ldl-c goal attainment among patients newly diagnosed … · ldl-c goal attainment among patients...
TRANSCRIPT

652 Journal of Managed Care Pharmacy JMCP Octoberr 2007 Vol. 13, No. 8 www.amcp.org
ReseaRch
Background: Patients beginning treatment with lipid-modifying drugsshould have their serum lipid levels monitored and, if necessary, their drugtherapy adjusted to reach and maintain their treatment goals. Patients withcoronary heart disease or diabetes are at high risk of coronary events and areparticularly important target groups for monitoring and dose adjustment oflipid-modifying drug therapy.
oBjective: to determine from administrative claims the rates of lipid testing,treatment with low-density lipoprotein cholesterol (LdL-c)-lowering drugtherapy, and LdL-c goal attainment defined as LdL-c < 100 mg per dL inthe time period after a new diagnosis of coronary heart disease or diabetesamong patients who had not previously received lipid-modifying drug therapy.
Methods: an index date was defined by a new diagnosis of coronary heartdisease or diabetes between january 1, 1999 and december 31, 2000,preceded by a 12-month pre-index period without lipid-modifying drug treat-ment in a commercial health maintenance organization (hMo) database forthe southeastern united states. coronary heart disease (chd) was definedby a diagnosis code for myocardial infarction (International Classificationof Diseases, Ninth Edition, Clinical Modification [icd-9-cM] code 410.xx) orangina/ischemic heart disease (411.xx), or a procedural code for angioplasty(icd-9-cM 36.1x-36.3x; Current Procedural Terminology [cPt] 92980-92984,92995-92996) or coronary artery bypass graft (icd-9-cM 36.01, 36.02, 36.05,36.09; cPt 33510-33545). diabetes was identified either by an icd-9-cMdiagnosis code 250.xx or a pharmacy claim for an anti-hyperglycemicmedication. Patients were followed in the post-index period until loss ofeligibility or a maximum of 42 months (mean = 26 months, range=12-42months). We calculated the proportion of patients with lipids treated and atLdL-c goal (defined as LdL-c < 100 mg per dL) in months 1-6 after the indexdate. among those not at goal in months 1-6, we estimated the proportiontreated to goal in months 7-12 and in month 7 to the end of the post-indexperiod. Logistic regression was used to estimate the odds of goal attainmentin months 7-12 and in month 7 to the end of the post-index period amongpatients who were not at goal in months 1-6.
resuLts: Laboratory lipid values were available for 4,676 (40.4%) of 11,552patients who had not previously received lipid-modifying drug therapy inmonths 1-6 after the index date, of whom 72.7% (n = 3,400) had an LdL-c≥ 100 mg per dL (63.5% for chd and 76.7% for diabetes). of 1,245 patientstested and treated with lipid-modifying therapy in months 1-6, 485 (39.0%)were at LdL-c goal in months 1-6 (48.2% of chd and 28.8% of diabetespatients), and 760 (61.0%) were not at LdL-c goal (51.8% of those with chdand 71.2% of those with diabetes). goal attainment (cumulative) among thosetreated improved to 50.1% in months 7-12 and 58.4% in month 7 to the endof the post-index period. Patients not attaining goal in months 1-6, and whocontinued treatment in months 7-12 and month 13 to the end of the post-in-dex period, had a 48.8% (95% confidence interval [ci],44.0%-53.6%) predict-ed probability of attaining their goals. the odds of goal attainment in month 7to the end of post-index period (among those not at goal in months 1-6) weregreater for (a) age ≥ 65 years (odds ratio [or] = 2.45, 95% ci,1.62-3.72), (b)history of hypertension (or = 1.91, 95% ci, 1.20-3.03), (c) greater number ofdistinct medications (or = 1.07, 95% ci,1.01-1.14 per additional medication),(d) months of observation post-index (or = 1.04, 95% ci = 1.01-1.08 per ad-
LdL-c goal attainment among Patients newly diagnosedWith coronary heart disease or diabetes in a commercial hMo
soma s. Nag, PhD; Gregory W. Daniel, RPh, Ms, MPh; Michael F. Bullano, PharmD;sachin Kamal-Bahl, PhD; shiva G. sajjan, PhD; X. henry hu, MD, PhD; and charles alexander, MD
ReseaRch
ditional month), and (e) months supply of lipid-modifying medication(or = 1.04, 95% ci, 1.01-1.07 per additional month), and were lower forLdL-c ≥ 130 mg per dL in months 1-6 (or = 0.53, 95% ci, 0.35-0.82) and ahistory of dyslipidemia (or = 0.54, 95% ci,0.35-0.83). the odds of LdL-c goalattainment were not affected by diagnosis (chd vs. diabetes), gender, statintitration (34% of patients), lipid-modifying drug switching (39% of patients),or treatment with a high-potency LdL-c-lowering drug dosage(one of sufficient strength to reduce LdL-c by > 40%).
concLusion: of patients receiving lipid testing and lipid drug treatment inthe 6 months after an initial diagnosis of chd or diabetes, 61% were not atthe LdL-c goal of < 100 mg per dL. among those not at LdL-c goal in the first6 months of treatment, only about half who continued treatment subsequentlyattained their LdL-c goal, despite statin titration or switching of their lipid-modifying drug therapy.
keyWords. coronary heart disease, diabetes, goal attainment, Lipidtreatment
J Manag Care Pharm. 2007;13(8):652-663Copyright© 2007, Academy of Managed Care Pharmacy. All rights reserved.
What is already known about this subject
What this study adds
• The LDL-C goal attainment rate for a national sample of patientswith coronary heart disease (CHD) in 2003 was 62%.
• National surveys and cross-sectional studies of diabetic patientsin managed care reported a lipid-modifying drug treatment rateof 28% in 1999-2000 and LDL-C goal (<100 mg per dL) attain-ment rates of 32-55% in 1999-2003. The 2003 HealthcareEffectiveness Data and Information Set (HEDIS) average LDL-Cgoal (<100 mg per dL) attainment rate for diabetes in partici-pating commercial health plans was 35%, which improved to44% in 2005.
• While these cross-sectional studies provide snapshots of lipidmanagement at points in time, not enough is known about therates of LDL-C goal attainment in the months after firstdiagnosis of CHD or diabetes.
• Of those who were tested and treated for LDL-C in the first 6months after an initial diagnosis of CHD or diabetes, 39.0%(CHD 48%, diabetes 29%) were at LDL-C goal <100 mg per dL.
• Cumulative goal attainment among those continuing treatmentimproved to 50% in the second 6 months and to 58% over 26months of follow-up.
• Patients who were treated but not at LDL-C <100 mg per dL inthe first 6 months after diagnosis and who continued treatmentwith lipid-modifying drugs had only about a 50% probability ofsubsequently attaining LDL-C goal regardless of CHD or diabetesdiagnosis.
aBsTRacT

www.amcp.org Vol. 13, No. 8 October 2007 JMCP Journal of Managed Care Pharmacy 653
LDL-C Goal Attainment Among Patients Newly DiagnosedWith Coronary Heart Disease or Diabetes in a Commercial HMO
Both the National Cholesterol Education Program (NCEP)and the American Diabetes Association (ADA) guide-lines now recommend treating patients with coronary
heart disease (CHD) or diabetes to a low-density lipoprotein-cholesterol (LDL-C) goal of < 100 mg per dL.1,2 The goal ofLDL-C < 100 mg per dL was first defined for CHD in 1994 bythe NCEP Adult Treatment Panel II (ATP II), and for diabe-tes by the ADA in 1998.3,4 The NCEP Third Adult TreatmentPanel (ATP III) in 2001 assigned diabetes CHD risk equivalence,and an LDL-C goal of < 100 mg per dL was adopted.1 Despitethe guidelines, there is considerable evidence of inadequateLDL-Cgoal attainment inclinicalpractice.5-18 Nationwide in2003,LDL-C goal attainment was 57% for patients with CHD, diabetes,or CHD risk equivalence, compared with 89% for patients in thezero CHD risk factor category.18 There is, however, little informa-tion about the likelihood of attaining LDL-C goal in the monthsimmediately after CHD or diabetes diagnosis.
In this study, LDL-C goal attainment in the months afterdiagnosis of CHD or diabetes (diagnosis by medical claim codeor pharmacy claim for an anti-hyperglycemic drug) in patientsbeginning treatment with lipid-modifying drugs was examined.
nn METHODSStudy design and patient selectionThis was a retrospective cohort study using administrative claimsdata in the HealthCore Integrated Research Database for theperiod January 1, 1998 through June 30, 2002. The data setused was from the commercial health maintenance organization(HMO) portion of a southeastern United States managed careorganization (MCO). Electronic records of laboratory valueswere obtained from a single national laboratory provider undercontract to this HMO. The initial study database included datafor approximately 1.1 million members in which all MCOeligibility, medical, and pharmacy files were linked by memberidentification number to electronic records of laboratory valuesfrom the single national provider. The database did not includelaboratory tests conducted in inpatient or outpatient hospitalsettings or in physician offices (i.e., the laboratory values weremissing from the database for any facility or physician that didnot outsource testing to the single national laboratory provider).
Patients’ identities were masked throughout the studyin a limited data set format, in accordance with the HealthInsurance Portability and Accountability Act (HIPAA) of 1996.Institutional review board approval was not sought, because therewas no patient intervention and the limited data were utilized inaccordance with appropriate data use agreements with thecovered entities as defined in HIPAA.
Patients with CHD or diabetes were identified during anindex period from January 1, 1999 through December 31, 2000by diagnosis or procedure codes on at least 1 medical or hospitalclaim, or receipt of at least 1 pharmacy claim for an anti-hyper-glycemic drug. The International Classification of Diseases, Ninth
Revision, Clinical Modification (ICD 9-CM) codes in any diagnosisfield, or Current Procedural Terminology, version 4 (CPT-4),codes on an inpatient or outpatient claim were used to identifyCHD: myocardial infarction (ICD 9-CM 410.xx) or angina/isch-emic heart disease (411.xx), or a procedural code for angioplasty(ICD-9-CM 36.1x-36.3x; CPT 92980-92984, 92995-92996) orcoronary artery bypass graft (ICD-9-CM 36.01, 36.02, 36.05,36.09; CPT 33510-33545). Diabetes was identified by diagnos-tic codes ICD-9-CM 250.xx or at least 1 pharmacy claim for ananti-hyperglycemic medication, defined by Generic ProductIdentifier (GPI) codes (Medi-Span, Master Drug Database;2003). GPI-4 codes for anti-diabetic drugs were: insulins 2710,sulfonylureas 2720, anti-diabetic amino acid derivatives 2723,biguanides 2725, meglitinide analogues 2728, alpha glucosidaseinhibitors 2750, insulin sensitizing agents 2760, andanti-diabetic combinations 2799.
The index date was defined as the date of the first claim witha diagnosis or procedure code for CHD, a diagnosis code fordiabetes, or a pharmacy claim for an anti-hyperglycemic drug.Continuous plan eligibility was required for at least 12 monthsbefore and after the index date (the 12-month pre-index andpost-index periods). Patients were excluded if they had anencounter claim coded with CHD or diabetes, or if they receiveda lipid-lowering medication, during the 12-month pre-indexperiod. Since the goal of this study was to examine LDL-C goalattainment following an incident diagnosis of CHD or diabetesamong patients previously untreated with lipid-modifyingmedications, a lipid-lowering medication in the pre-indexperiod was a criterion for exclusion. A diagnosis of dyslipidemiawas not a reason for exclusion, provided there was no evidenceof lipid-modifying drug treatment. Dyslipidemia was regardedas a potentially confounding variable and it was included as acovariate in the regression model.
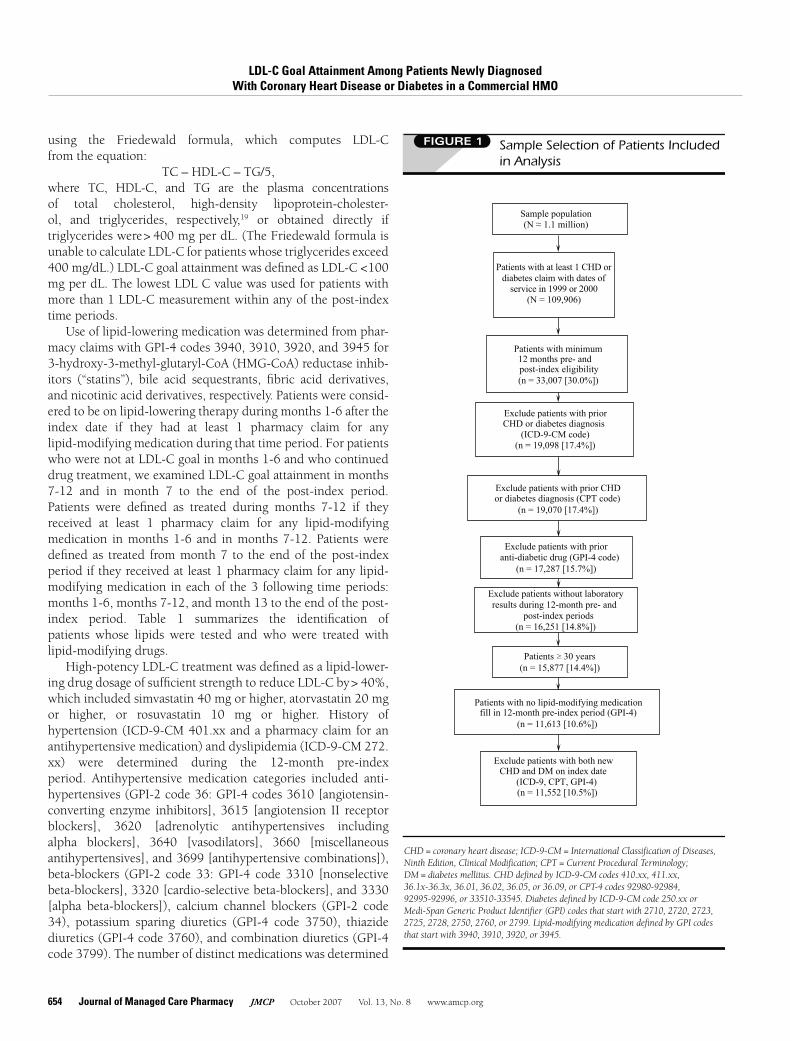
Only patients with electronic laboratory data available in theHealthCore Integrated Research Database in the 12-monthpre-index and post-index periods were retained for furtheranalysis. Sixty-one patients with initial diagnoses for both CHDand diabetes on the index date (i.e., on the same day)were excluded as potentially spurious data. The sample selec-tion steps are shown in Figure 1, and the study periods areillustrated in Figure 2.
Study variablesLipid testing, treatment, and LDL-C goal attainment wereeach determined within 3 time periods after the index date:months 1-6, months 7-12, and month 7 to the end of thepost-index period (Figure 2). LDL-C testing was determinedby the presence of 1 or more LDL-C or lipid panel values inthe electronic database of laboratory results. These values wererecorded using either Logical Observation Identifiers Namesand Codes (LOINC) or actual test names. The laboratory recordsincluded the date of testing. LDL-C values were calculated
LDL-C Goal Attainment Among Patients Newly DiagnosedWith Coronary Heart Disease or Diabetes in a Commercial HMO
654 Journal of Managed Care Pharmacy JMCP October 2007 Vol. 13, No. 8 www.amcp.org
using the Friedewald formula, which computes LDL-Cfrom the equation:
TC – HDL-C – TG/5,where TC, HDL-C, and TG are the plasma concentrationsof total cholesterol, high-density lipoprotein-cholester-ol, and triglycerides, respectively,19 or obtained directly iftriglycerides were> 400 mg per dL. (The Friedewald formula isunable to calculate LDL-C for patients whose triglycerides exceed400 mg/dL.) LDL-C goal attainment was defined as LDL-C <100mg per dL. The lowest LDL C value was used for patients withmore than 1 LDL-C measurement within any of the post-indextime periods.
Use of lipid-lowering medication was determined from phar-macy claims with GPI-4 codes 3940, 3910, 3920, and 3945 for3-hydroxy-3-methyl-glutaryl-CoA (HMG-CoA) reductase inhib-itors (“statins”), bile acid sequestrants, fibric acid derivatives,and nicotinic acid derivatives, respectively. Patients were consid-ered to be on lipid-lowering therapy during months 1-6 after theindex date if they had at least 1 pharmacy claim for anylipid-modifying medication during that time period. For patientswho were not at LDL-C goal in months 1-6 and who continueddrug treatment, we examined LDL-C goal attainment in months7-12 and in month 7 to the end of the post-index period.Patients were defined as treated during months 7-12 if theyreceived at least 1 pharmacy claim for any lipid-modifyingmedication in months 1-6 and in months 7-12. Patients weredefined as treated from month 7 to the end of the post-indexperiod if they received at least 1 pharmacy claim for any lipid-modifying medication in each of the 3 following time periods:months 1-6, months 7-12, and month 13 to the end of the post-index period. Table 1 summarizes the identification ofpatients whose lipids were tested and who were treated withlipid-modifying drugs.
High-potency LDL-C treatment was defined as a lipid-lower-ing drug dosage of sufficient strength to reduce LDL-C by> 40%,which included simvastatin 40 mg or higher, atorvastatin 20 mgor higher, or rosuvastatin 10 mg or higher. History ofhypertension (ICD-9-CM 401.xx and a pharmacy claim for anantihypertensive medication) and dyslipidemia (ICD-9-CM 272.xx) were determined during the 12-month pre-indexperiod. Antihypertensive medication categories included anti-hypertensives (GPI-2 code 36: GPI-4 codes 3610 [angiotensin-converting enzyme inhibitors], 3615 [angiotension II receptorblockers], 3620 [adrenolytic antihypertensives includingalpha blockers], 3640 [vasodilators], 3660 [miscellaneousantihypertensives], and 3699 [antihypertensive combinations]),beta-blockers (GPI-2 code 33: GPI-4 code 3310 [nonselectivebeta-blockers], 3320 [cardio-selective beta-blockers], and 3330[alpha beta-blockers]), calcium channel blockers (GPI-2 code34), potassium sparing diuretics (GPI-4 code 3750), thiazidediuretics (GPI-4 code 3760), and combination diuretics (GPI-4code 3799). The number of distinct medications was determined
FIGURE 1 Sample Selection of Patients Includedin Analysis
(n = 17,287 [15.7%])
CHD or diabetes diagnosis(ICD-9-CM code)
Patients 30 years
Exclude patients with both new
Patients with minimum12 months pre- andpost-index eligibility(n = 33,007 [30.0%])
(n = 19,098 [17.4%])
(n = 19,070 [17.4%])
(n = 15,877 [14.4%])
(N = 109,906)
Patients with at least 1 CHD ordiabetes claim with dates ofservice in 1999 or 2000
Exclude patients with prior
(n = 11,613 [10.6%])
CHD and DM on index date(ICD-9, CPT, GPI-4)
Exclude patients with prior CHD
Exclude patients with prior
or diabetes diagnosis (CPT code)
anti-diabetic drug (GPI-4 code)
(n = 11,552 [10.5%])
fill in 12-month pre-index period (GPI-4)Patients with no lipid-modifying medication
Sample population(N 1.1 million)
Exclude patients without laboratoryresults during 12-month pre- and
post-index periods(n = 16,251 [14.8%])
>
CHD = coronary heart disease; ICD-9-CM = International Classification of Diseases,Ninth Edition, Clinical Modification; CPT = Current Procedural Terminology;DM = diabetes mellitus. CHD defined by ICD-9-CM codes 410.xx, 411.xx,36.1x-36.3x, 36.01, 36.02, 36.05, or 36.09, or CPT-4 codes 92980-92984,92995-92996, or 33510-33545. Diabetes defined by ICD-9-CM code 250.xx orMedi-Span Generic Product Identifier (GPI) codes that start with 2710, 2720, 2723,2725, 2728, 2750, 2760, or 2799. Lipid-modifying medication defined by GPI codesthat start with 3940, 3910, 3920, or 3945.

www.amcp.org Vol. 13, No. 8 October 2007 JMCP Journal of Managed Care Pharmacy 655
LDL-C Goal Attainment Among Patients Newly DiagnosedWith Coronary Heart Disease or Diabetes in a Commercial HMO
at the drug class level from the number of unique 2-characterGPI codes for all drugs, including both acute and chronicmedications (e.g., 01 for penicillins; 02 for cephalosporins; 33for beta-blockers; 34 for calcium channel blockers; and 36 forangiotensin-converting enzyme [ACE] inhibitors, angiotensin IIreceptor blocker [ARBs], and other antihpertensives) during the12-month pre-index period.
Statistical methodsThe characteristics of patients newly diagnosed with CHD
and diabetes were compared using descriptive statistics. Thestatistical significance of differences between these 2 patient setswas determined using an independent t test for continuousvariables and Pearson chi-square tests for nominal/categoricalvariables. Rates of lipid treatment and LDL-C goal attainment inmonths 1-6 were examined with descriptive analyses. Weapplied logistic regression to estimate the odds of LDL-C goalattainment in months 7-12 and from month 7 to the end of thepost-index period among patients who did not attain LDL-Cgoal in months 1-6. The outcome for each model was binary,with attaining the LDL-C goal set to 1 and not attaining the goalset to 0. Odds ratios for all model covariates were calculated byexponentiating the logistic regression coefficients. The sample
used for model estimation was limited to patients with LDL-C,HDL-C, and triglyceride measurements in months 1-6. Variablesentered into the models were chosen a priori based on clinicalrelevance and forced into the final models regardless of statisti-cal significance. These variables included age, sex, histories ofhypertension and dyslipidemia, CHD or diabetes status, lipidvalues (LDL-C ≥ 130 mg per dL, HDL-C < 40 mg per dL, andtriglycerides ≥ 200 mg per dL) in months 1-6, adjustments tolipid therapy (statin titration, switching), use of high-potencyLDL-lowering statin dosages, the number of days supply oflipid-modifying drugs, and the number of distinct prescriptionmedications. The number of distinct prescription medicationsis an adjustment for comorbidity burden that has beenvalidated.20,21 Regression model fit was assessed using the Hos-mer-Lemeshow goodness-of-fit test and discrimination wasmeasured by examining the area under the ROC curve.22 To cal-culate overall predicted probability of goal attainment, meanvalues on all covariates were calculated and inserted into thelogistic regression equation (i.e., multiplied by the logistic re-gression coefficients).23 As is standard in logistic regression, theresulting linear predictor (natural log of the odds) was convertedinto an overall probability using the formula:
eZ / (1+eZ),
FIGURE 2 Schematic of Study Periods
Jan 1, 1998 Jan 1, 1999 Dec 31, 2000 June 30, 2002
Index date
12-month post-indexperiod
12-month pre-indexperiod
Overall study period
Index period
Month 7 to end ofpost-index period
Month 12Month 6
Months 1-6
Months 7-12
Month 13 to end ofpost-index period
Month 1 to end ofpost-index period

LDL-C Goal Attainment Among Patients Newly DiagnosedWith Coronary Heart Disease or Diabetes in a Commercial HMO
656 Journal of Managed Care Pharmacy JMCP October 2007 Vol. 13, No. 8 www.amcp.org
where e is the base of natural logarithms and Z is the linearpredictor. This calculation was performed for the sample overalland for each of the 2 patient sets (CHD and diabetes).
Statin titration was defined as an increase in the strength ofthe dispensed statin. A switch was defined as a claim for anylipid drug (statin or nonstatin) different from the previous lipiddrug fill, with no subsequent claim for the original drug. Forthe regression model that predicted LDL-C goal attainmentin months 7-12, the titration and switching variables weredetermined for months 1-12. For the model that predicted goalattainment in month 7 to the end of the post-index period, the
titration and switching variables were determined for month1 to the end of the post-index period. The number of monthsin the post-index period was included in the model for goalattainment in month 7 to the end of the post-index period, toadjust for unequal duration of follow-up among patients.
The number of days supply was aggregated for all statins.A small fraction of patients were treated only with nonstatins(5.9% of patients in months 1-6; 4.5% of patients in months7-12; and 3.6% of patients in month 7 to the end of the studyperiod). Since days supply was not captured for patients treatedonly with nonstatins, it was imputed based on an adjusted days
TABLE 1 Identification of Tested and Treated Patients
Variable Measured Definition Time Period(s)
Number of Cases
All CHD Diabetes
Number of patientsCoronary heart* disease or
diabetes†Index period Jan 1,
1999 to Dec 31, 2000
11,552 3,320 8,232
Lipid test by national
laboratory provider
LDL-C test result - field occupied months 1-6 4,676 1,418 3,258
Patients at goal –
treated and not treated
LDL-C <100 mg per dL months 1-6 1,276 518 758
Patients not at LDL-C
goal
LDL-C > 100 mg per dL months 1-6 3,400 900 2,500
Patients treated with
lipid-lowering drug‡Any lipid-lowering drug therapy months 1-6 1,742 886 856
Patients tested and
treated§LDL-C test result - field occupied;
and 1 or more pharmacy claims
for lipid-modifying drug
months 1-6 1,245 651 594
Patients treated and at
goal
LDL-C test result <100 mg per dL months 1-6 39.0%
485
48.2%
314
28.8%
171
Patients tested and
treated§ and not at
goal
1 or more pharmacy claims for
lipid-modifying drug and LDL-C >100 mg per dL
months 1-6 61.0%
760
51.8%
337
71.2%
423
Patients with continued
treatment in months
7-12
LDL-C test result field occupied;
and 1 or more pharmacy claims
for a lipid-modifying drug in eachtime period‡
months 1-6 and
months 7-12
48.2%
600
42.9%%
279
54.0%
321
Patients with continued
treatment from month
7 to end of post-index
period
LDL-C test result field occupied;
and 1 or more pharmacy claims
for a lipid-modifying drug in each
time period‡
months 1-6 and
months 7-12 and
month 13 to end of
post-index period
39.8%
496
36.1%
235
43.9%
261
*International Classification of Diseases, Ninth Edition, Clinical Modification (ICD-9-CM) 410.xx, 411.xx, 36.1x-36.3x, 36.01, 36.02, 36.05, or 36.09;or Current Procedural Terminology (CPT-4) 92980-92984, 92995-92996, or 33510-33545.†ICD-9-CM 250.xx; or Medi-Span Generic Product Identifier (GPI) codes that start with 2710, 2720, 2723, 2725, 2728, 2750, 2760, or 2799.‡The proportion of patients with baseline LDL-C > 100 mg per dL was not measured (i.e., some of these patients treated with lipid-lowering drug therapy could have hadLDL-C < 100 mg per dL at baseline).§The relative timing of testing and treatment within any time period was not captured.GPI codes that start with 3940, 3910, 3920, or 3945.
All
11,552
4,676
1,276
3,400
1,742
1,245
39.0%
485
61.0%
760
48.2%
600
39.8%
496
LDL-C = low-density lipoprotein-cholesterol; CHD = coronary heart disease.
Authors

www.amcp.org Vol. 13, No. 8 October 2007 JMCP Journal of Managed Care Pharmacy 657
LDL-C Goal Attainment Among Patients Newly DiagnosedWith Coronary Heart Disease or Diabetes in a Commercial HMO
supply for statins. An ordinary least squares regression modelwas run for statin users who were not at goal in months 1-6: dayssupply =β0 +β1 (CHD vs. diabetes)+ β2 (age) + β3 (sex)+ε. Themodel estimates were then used to predict days supply for non-statin users. Separate regressions estimated the days supply formonths 1-12 and for the entire post-index period. The observeddays supply for the statin users and the imputed days supplyfor the nonstatin users were then entered (as months supply)into the regression models of LDL-C goal attainment. An a priori2-tailed level of significance was set at the 0.05 level. All analyseswere carried out using Stata version 8.2 (Stata Corporation, Inc.,College Station, TX).
nn RESULTSMost of the 11,522 patients who met the study inclusion criteriawere newly diagnosed with diabetes (71%), the remaining 29%being newly diagnosed with CHD. Compared with patients withdiabetes, those with CHD were significantly older and includeda higher proportion of males (Table 2). The duration of the post-index period was similar for both cohorts, with an overall meanof 26 months (range 12-42 months). The proportions of patientswith histories of hypertension and dyslipidemia were higher forpatients with newly diagnosed CHD than for those with diabetes(38% vs. 32% and 28% vs. 23%, respectively). Mean LDL-Clevels in the 12-month pre-index period were slightly higher forCHD patients, whereas median triglyceride levels were signifi-cantly higher for patients with diabetes.
The days of supply of lipid-modifying drugs are presented inTable 3. For all patients, the mean days supply represented ap-proximately two-thirds of days in months 1-6 (114 of 180 days)and months 1-12 (224 of 360 days). The mean numbers of dayssupply were greater for patients with CHD than for patients withdiabetes in months 1-6 (126 vs. 101 days) months 1-12 (236 vs.214 days), and overall (542 vs. 466 days).
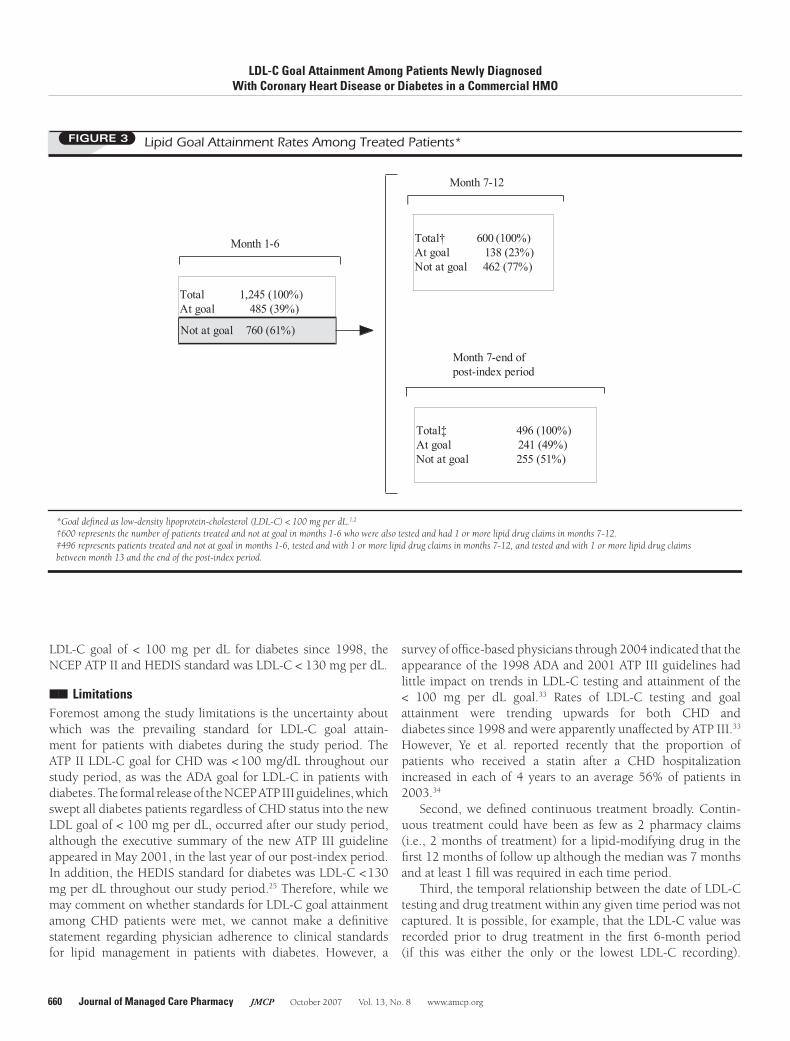
Of the 11,552 patients in the study population, 4,676(40.5%) had lipid testing data available in months 1-6 (Table1). Of the 4,676 patients tested, 3,400 (72.7%, distributed as63.5% of CHD patients and 76.5% of patients with diabetes)had LDL-C ≥ 100 mg per dL. A total of 1,245 patients weretested and treated with lipid-modifying therapy in months 1-6.Of these 1,245 patients, 485 (39.0%) were at their LDL-C goalin months 1-6 (48.2% of CHD and 28.8% of diabetes patients),and 760 (61.0%) were not at their LDL-C goal (51.8% of thosewith CHD and 71.2% of those with diabetes). Among the 760patients tested and treated and not at goal in months 1-6, 600(79.0%) were treated in months 7-12, of whom 138 (23.0%of 600) attained LDL-C goal, and 496 (65.3% of 760) weretreated after month 12, of whom 241 (31.8%) attained LDL-Cgoal (Figure 3). Cumulative goal attainment for those treatedwas 39.0% in months 1-6, 50.1% in months 7-12, and 58.4% inmonth 7 to the end of the post-index period.
The multivariate analyses showed that among patients who
did not attain LDL-C goal in months 1-6 and who continued tobe treated, there was no significant difference in goalattainment between CHD and diabetes patients in months7-12 or in month 7 to the end of the post-index period (Table 4).The overall predicted probability of attaining LDL-C goal inmonth 7 to the end of the post-index period was 48.8% (95%confidence interval [CI],44.0%-53.6%), with little difference inthe probability of goal attainment for patients with CHD (49.4%,95% CI,42.2%-56.7%) and for those with diabetes (48.2%, 95%CI, 41.4%-55.1%). The odds of goal attainment in month 7 tothe end of the post-index period (among those not at goal inmonths 1-6) were greater for (a) age ≥ 65 years (odds ratio [OR]=2.45, 95% CI,1.62-3.72), (b) history of hypertension (OR=1.91,95% CI, 1.20-3.03), (c) number of distinct medications (OR =1.07, 95% CI,1.01-1.14 per additional medication), (d) monthsof observation post-index (OR=1.04, 95% CI, 1.01-1.08 peradditional month), and (e) months supply of lipid-modifyingmedication (OR=1.04, 95% CI, 1.01-1.07 per additionalmonth), and were lower for LDL-C ≥ 130 mg per dL in months1-6 (OR=0.53, 95% CI, 0.35-0.82) and a history of dyslipid-emia (OR=0.54, 95% CI, 0.35-0.83). The odds of LDL-C goalattainment were not affected by gender, statin titration (34% ofpatients), lipid-modifying drug switching (39% of patients), ortreatment with a high-potency LDL-C-lowering drug dosage (ofsufficient strength to reduce LDL-C by > 40%). Both modelsdemonstrated good fit and discrimination, as measured by theHosmer-Le show goodness-of-fit statistic and area under theROC curve, respectively.
nn DISCUSSIONIn this study, we examined the course of lipid managementand LDL-C goal attainment for an average of 26 months aftera new diagnosis of CHD or diabetes in a managed care setting.Patients who were treated with lipid-modifying drugs but whodid not attain LDL-C goal in months 1-6 had only about a 1 in 2predicted probability (48.8%) of goal attainment in months 7 tothe end of the post-index period, regardless of CHD or diabetesdiagnosis.
There have been few longitudinal studies of rates of lipidtesting, lipid drug treatment, and LDL-C goal attainment amongpatients with diabetes or CHD in the period since publica-tion of the 1994 ATP II and 1998 ADA guidelines, which firstadvocated the LDL-C standard of < 100 mg per dL for CHDand diabetes, respectively.3,4 Beaton et al. reported an LDL-Ctesting rate of 54% and a lipid-lowering drug treatment rate of28% for patients with diabetes in managed care in 1999-2000.8
Reported rates of LDL-C goal attainment (< 100 mg per dL)were 62% for patients with CHD in 200318,24 and 32%-55%for patients with diabetes in 1999-2003.8-10,18 These studieswere all cross-sectional and included national surveys.18,24 TheNational Committee for Quality Assurance has reported rates ofLDL-C testing and goal attainment in participating US managed

LDL-C Goal Attainment Among Patients Newly DiagnosedWith Coronary Heart Disease or Diabetes in a Commercial HMO
658 Journal of Managed Care Pharmacy JMCP October 2007 Vol. 13, No. 8 www.amcp.org
TABLE 2 Characteristics of Study Sample of Newly Diagnosed Patients with Coronary Heart Diseaseor Diabetes Mellitus
Characteristics
All
(n = 11,552)
CHD
(n = 3,320)
Diabetes
(n = 8,232) P Value*
Age
Mean years [SD] 61.2 [14.7] 64.4 [14.2] 60.0 [14.7] < 0.001
65 years (%) 45.1 53.4 41.8 < 0.001
Male (%) 52.5 56.7 50.8 < 0.001
Duration of post-index period, months
Mean [SD] 25.8 [7.9] 25.6 [7.9] 25.9 [7.9] 0.077
Range (12.2, 42) (12.2, 42) (12.2, 42)
History of hypertension (%) 33.6 37.6 32.0 < 0.001
History of dyslipidemia (%) 24.5 27.9 23.1 < 0.001
Number distinct prescription medications, mean [SD] 4.4 [3.9] 5.1 [4.1] 4.1 [3.8] < 0.001
Laboratory measurements in 12-month pre-index period
LDL-C
Number of patients 1,520 (45.8%) 3,785 (46.0%)
Mean mg per dL [SD] 130.7 [33.4] 132.6 [33.2] 0.011
Median mg per dL (IQR) 129 (108, 151) 130 (110, 153) 129 (107, 151)
Triglycerides†
Number and % of patients 1,628 (49.0%) 4,182 (20.8%)
Mean mg per dL [SD] 189.1 [209.5] 155.1 [96.3] 202.3 [238.2]
Median mg per dL (IQR) 133 (96, 188) 157 (109, 230) < 0.001149 (104, 219)
5810 (50.3%)
5305 (45.9%)
130.0 [33.5]
*P values determined from independent 2-sample t tests for continuous variables and Pearson chi-square tests for categorical variables; the nonparametric median test wasused for triglycerides.†Triglyceride levels are highly skewed. As a result the mean is not the best measure of central tendency.CHD = Coronary heart disease; IQR = interquartile range; SD = standard deviation.
All
(n = 11,552)
61.2 [14.7]
45.1
52.5
25.8 [7.9]
(12.2, 42)
33.6
24.5
4.4 [3.9]
130.7 [33.4]
129 (108, 151)
189.1 [209.5]
149 (104, 219)
5810 (50.3%)
5305 (45.9%)
>

www.amcp.org Vol. 13, No. 8 October 2007 JMCP Journal of Managed Care Pharmacy 659
LDL-C Goal Attainment Among Patients Newly DiagnosedWith Coronary Heart Disease or Diabetes in a Commercial HMO
care plans for diabetes (but not CHD) for 1998-2002 (whenthe HEDIS goal was LDL-C < 130 mg per dL) and 2003-2005(LDL-C goal < 100 mg per dL).25 The HEDIS rate ofLDL-C < 100 mg per dL for diabetes in commercial planswas 35%-44% in 2003-2005.25 The corresponding rate forLDL-C < 130 mg per dL was 29%-55% in 1999-2002 and60%-68% in 2003-2005.25
There have been few longitudinal studies of patients withCHD or diabetes. Retrospective cohort studies have focusedon patients with hyperlipidemia15,26 and patients treated withlipid-modifying drugs,27 or specifically with statins (during1997-2004)28-31 although there have been some retrospec-tive cohort studies of high-risk patient groups (during 1996-2001).16,17,32 Many of these studies focused on adherence todrug therapy.28,29,31,32 Stacy and Egger reported that treatmentwith lipid-modifying drugs increased LDL-C goal attainmentfrom 23% at baseline (prior to any drug treatment) to 68% overan average of 3.7 years later (in 2004).26 These patients hadhyperlipidemia and/or hypercholesterolemia, however,rather than CHD or diabetes, and were treated by high-volume
prescribers, so that most patients (84%) had received at least1 lipid-modifying medication.26 Valuck et al. and Meyer etal. reported that patients treated with high-potency statinregimens were significantly more likely to attain an LDL-C goal< 100 mg per dL than patients treated with non-high-potencyregimens.17,27
In the present study, fewer patients with a new diagnosis ofdiabetes received lipid-modifying medication or attained theLDL-C goal of < 100 mg per dL than did newly diagnosed CHDpatients. There are several reasons why this may haveoccurred. First, diabetes patients may have received less inten-sive LDL-C testing and treatment, because the focus in newlydiagnosed diabetes patients is often on control of blood glucose.Second, since our definition of CHD included conditionslikely to require urgent medical care and/or hospitalization(e.g., myocardial infarction, angioplasty, coronary artery bypassgraft), newly diagnosed CHD patients may have been perceivedas needing more aggressive therapy. Finally, the data for thisstudy were recorded between January 1, 1998 and June 30,2002 and, although the ADA guidelines have recommended an
TABLE 3 Days Supply of Lipid-Modifying Drug Therapy
Variable Total CHD Diabetes P Value*
Months 1 to 6
Number of patients 1245 651 594
Mean days of therapy [SD] 114 [60] 126 [63] 101 [56] < 0.001
Median days of therapy (IQR) 120 (60, 155) 120 (60, 180) 98 (60, 150)
Months 1 to 12
Number of patients 600 279 321
Mean days of therapy [SD] 224 [90] 236 [92] 214 [88] 0.002
Median days of therapy (IQR) 216 (150, 300) 240 (180, 300) 210 (150, 270)
Number of patients 496 235 261
Mean days of therapy [SD] 502 [249] 542 [266] 466 [277] < 0.001
Median days of therapy (IQR) 476 (320, 630) 510 (339, 690) 450 (300, 600)
IQR = interquartile range; SD = standard deviation. *P values for comparisons of means for Coronary Heart Disease (CHD) and diabetes using independent 2-sample t tests.
Month 1 to end of post-index period
LDL-C Goal Attainment Among Patients Newly DiagnosedWith Coronary Heart Disease or Diabetes in a Commercial HMO
660 Journal of Managed Care Pharmacy JMCP October 2007 Vol. 13, No. 8 www.amcp.org
LDL-C goal of < 100 mg per dL for diabetes since 1998, theNCEP ATP II and HEDIS standard was LDL-C < 130 mg per dL.
nn LimitationsForemost among the study limitations is the uncertainty aboutwhich was the prevailing standard for LDL-C goal attain-ment for patients with diabetes during the study period. TheATP II LDL-C goal for CHD was < 100 mg/dL throughout ourstudy period, as was the ADA goal for LDL-C in patients withdiabetes. The formal release of the NCEP ATP III guidelines, whichswept all diabetes patients regardless of CHD status into the newLDL goal of < 100 mg per dL, occurred after our study period,although the executive summary of the new ATP III guidelineappeared in May 2001, in the last year of our post-index period.In addition, the HEDIS standard for diabetes was LDL-C <130mg per dL throughout our study period.25 Therefore, while wemay comment on whether standards for LDL-C goal attainmentamong CHD patients were met, we cannot make a definitivestatement regarding physician adherence to clinical standardsfor lipid management in patients with diabetes. However, a
survey of office-based physicians through 2004 indicated that theappearance of the 1998 ADA and 2001 ATP III guidelines hadlittle impact on trends in LDL-C testing and attainment of the< 100 mg per dL goal.33 Rates of LDL-C testing and goalattainment were trending upwards for both CHD anddiabetes since 1998 and were apparently unaffected by ATP III.33
However, Ye et al. reported recently that the proportion ofpatients who received a statin after a CHD hospitalizationincreased in each of 4 years to an average 56% of patients in2003.34
Second, we defined continuous treatment broadly. Contin-uous treatment could have been as few as 2 pharmacy claims(i.e., 2 months of treatment) for a lipid-modifying drug in thefirst 12 months of follow up although the median was 7 monthsand at least 1 fill was required in each time period.
Third, the temporal relationship between the date of LDL-Ctesting and drug treatment within any given time period was notcaptured. It is possible, for example, that the LDL-C value wasrecorded prior to drug treatment in the first 6-month period(if this was either the only or the lowest LDL-C recording).
FIGURE 3 Lipid Goal Attainment Rates Among Treated Patients*
Total‡ 496 (100%)At goal 241 (49%)Not at goal 255 (51%)
Month 7-end ofpost-index period
Total† 600 (100%)At goal 138 (23%)Not at goal 462 (77%)
Month 7-12
Month 1-6
Total 1,245 (100%)At goal 485 (39%)
Not at goal 760 (61%)
*Goal defined as low-density lipoprotein-cholesterol (LDL-C) < 100 mg per dL.1,2
†600 represents the number of patients treated and not at goal in months 1-6 who were also tested and had 1 or more lipid drug claims in months 7-12.‡496 represents patients treated and not at goal in months 1-6, tested and with 1 or more lipid drug claims in months 7-12, and tested and with 1 or more lipid drug claimsbetween month 13 and the end of the post-index period.

www.amcp.org Vol. 13, No. 8 October 2007 JMCP Journal of Managed Care Pharmacy 661
LDL-C Goal Attainment Among Patients Newly DiagnosedWith Coronary Heart Disease or Diabetes in a Commercial HMO
Therefore, our data would tend to underestimate the numberand proportion of patients at target LDL-C goal.
Fourth, lipid values performed in laboratories other thanthe single national provider or tests reported by physicians witha CPT code were not captured. Some patients could also havereceived lipid testing in the hospital, which would have madeoutpatient testing unnecessary for several months. However,due to this limitation, we did not calculate the number andproportion of patients that received LDL-C testing.
Fifth, these results may not be generalizable to other settings.This analysis was limited to 1 MCO located in the southeast-ern United States, and laboratory lipid values within the first
6 months after diagnosis were available for only 40% of thetarget population (4,676 of 11,552 patients), thereby limitingthe sample for which lipid management and goal attainmentcould be assessed.
Sixth, we did not include information on patient race andsocioeconomic status—factors reported previously to affectthe likelihood of LDL-C testing among Medicare patients.35
Last, we did not examine dyslipidemia versus LDL-C, and wecannot be certain that the lipid-lowering drug therapy wasspecifically used to treat elevated LDL-C. Finally, the use of claimsdata prohibited determination of the extent that patients could besplitting tablets. For example, a patient who received 40 mg
TABLE 4 Adjusted Odds Ratios for LDL-C Goal Attainment in Months 7 to 12 and Month 7 to End ofPost-index Period, for Those Who Were Treated and Were Not at LDL-C Goal inMonths 1-6, and Who Continued to be Treated
CharacteristicMonths 7 to12
(N = 598)*Month 7 to End of Post-index Period
(N = 494)†
OR 95% CI OR 95% CI
CHD (vs. diabetes) 1.04 0.68 1.60 0.97 0.63 1.49
Male sex 1.64 1.05 2.57 1.29 0.83 1.99
Age 65 years 2.06 1.34 3.15 2.45 1.62 3.72
LDL-C 130 mg per dL in months 1-6 0.70 0.45 1.08 0.53 0.35 0.82
HDL-C 40 mg per dL in months 1-6 0.90 0.55 1.49 0.81 0.49 1.33
TC 200 mg per dL in months 1-6 0.92 0.57 1.48 1.06 0.66 1.70
History of hypertension 1.47 0.94 2.31 1.91 1.20 3.03
History of dyslipidemia 0.81 0.53 1.23 0.54 0.35 0.83
Number distinct medications 1.10 1.04 1.16 1.07 1.01 1.14
Months of observation ---- 1.04 1.01 1.08
Statin titration‡ 0.77 0.45 1.32 0.75 0.46 1.22
Switching§ 1.21 0.74 1.99 0.94 0.60 1.47
High-potency LDL-C-lowering dosage 1.04 0.61 1.76 1.27 0.79 2.04
Months supply¶ 1.02 0.95 1.10 1.04 1.01 1.07
*Hosmer-Lemeshow goodness-of-fit chi-square (df = 8) = 3.90, P = 0.866; area under receiver operating characteristic (ROC) curve = 0.679. Two patients were excludeddue to lack of HDL-C measurement in months 1-6.†Hosmer-Lemeshow goodness-of-fit chi-square (df = 8) = 4.44, P = 0.815; area under ROC curve = 0.730. Two patients were excluded due to lack of HDL-C measurementin months 1-6.‡Defined as an increase in the strength of the dispensed statin. Totals for 136 patients (22.7%) were titrated in months 1-12, and 167 patients (33.7%) were titrated inmonths 1 to the end of post-index period.§Defined as a claim for any lipid drug (statin or nonstatin) different from the previous lipid drug fill, with no subsequent claim for the original drug. Totals for 142 patients(23.7%) were titrated in months 1-12, and 192 patients (38.7%) were titrated in months 1 to the end of post-index period.¶Observed for patients with statin use, imputed for nonstatin users.
>
CHD = coronary heart disease; OR = odds ratio; CI = confidence interval; LDL-C = low-density lipoprotein-cholesterol; HDL-C = high-density lipoprotein-cholesterol;TC = total cholesterol.
>
>
>

LDL-C Goal Attainment Among Patients Newly DiagnosedWith Coronary Heart Disease or Diabetes in a Commercial HMO
662 Journal of Managed Care Pharmacy JMCP October 2007 Vol. 13, No. 8 www.amcp.org
simvastatin tablets could have actually taken 20 mg per day bysplitting the tablets. However, the days supply in most caseswould have been adjusted accordingly (i.e., a 60-day supply for30 units of 40 mg simvastatin at a 20 mg dose per day).
CONCLUSIONOnly 27% of patients with CHD or diabetes patients whoreceived a lipid test were at the LDL-C goal of < 100 mg perdL in the first 6 months after diagnosis. Among those who alsoreceived lipid-modifying drug therapy, only 39% were at goal inthe first 6 months. The probability of goal attainment increasedover the follow-up period, but for those who did not reachLDL-C goal in the first 6 months after diagnosis, goal attain-ment remained below 50% over the entire post-index period,averaging 26 months.
ACKNOWLEDGMENTSThe authors acknowledge the contribution of Alan Morrison, PhD, as a medicalwriter.
DISCLOSURES
Funding for this study was provided by Merck-Schering Plough, Inc. AuthorsSoma S. Nag, Shiva G. Sajjan, Sachin Kamal-Bahl, Henry Hu, and CharlesAlexander are employed by Merck & Co., Inc., West Point, PA. Alexander,Nag, Sajjan, Hu, and Kamal-Bahl are shareholders of Merck & Co. Gregory W.Daniel discloses no potential bias or conflict of interest relating to this study.Michael F. Bullano discloses no potential bias or conflict of interest relating tothis study.
Nag served as principal author of the study. Study concept and design werecontributed by Nag, Hu, Daniel, Alexander, and Bullano. Data collection wasthe work of Daniel and Bullano with input from Nag; data interpretation wasprimarily the work of Nag and Sajjan with input from Hu, Daniel, andAlexander. Writing of the manuscript and its revision was primarily the workof Nag, Kamal-Bahl, and Alexander with input from Hu, Daniel, and Bullano.
REFERENCES
1. National Institute of Health, National Heart Lung and Blood Institute,National Cholesterol Education Program. Third Report of the NationalCholesterol Education Program (NCEP) Expert Panel on Detection, Evaluation,and Treatment of High Blood Cholesterol in Adults (Adult Treatment Panel III)Executive Summary 2001. NIH Publication No. 01-3670.
2. American Diabetes Association. Dyslipidemia management in adults withdiabetes. Diabetes Care. 2005;28:S4-36.
3. Summary of the second report of the National Cholesterol EducationProgram (NCEP) Expert Panel on Detection, Evaluation, and Treatment
of High Blood Cholesterol in Adults (Adult Treatment Panel II). JAMA.1993;269(23):3015-23.
4. Management of dyslipidemia in adults with diabetes. American Diabetes As-sociation. Diabetes Care. 1998;21(1):179-82.
5. Kell SH, Drass J, Bausell RB, Thomas KA, Osborn MA, Gohdes D. Measuresof disease control in Medicare beneficiaries with diabetes mellitus. J Am GeriatrSoc. 1999;47(4):417-22.
6. Harris MI. Health care and health status and outcomes for patients with type2 diabetes. Diabetes Care. 2000;23(6):754-58.
7. Saaddine JB, Engelgau MM, Beckles GL, Gregg EW, Thompson TJ, NarayanKM. A diabetes report card for the United States: quality of care in the 1990s.Ann Intern Med. 2002;136(8):565-74.
8. Beaton SJ, Nag SS, Gunter MJ, Gleeson JM, Sajjan SS, Alexander CM.Adequacy of glycemic, lipid, and blood pressure management for patients withdiabetes in a managed care setting. Diabetes Care. 2004;27(3):694-98.
9. Putzer G, Roetzheim R, Ramirez AM, Sneed K, Brownlee HJ, Jr., CampbellRJ. Compliance with recommendations for lipid management among patientswith type 2 diabetes in an academic family practice. J Am Board Fam Pract.2004;17(2):101-07.
10. Parris ES, Lawrence DB, Mohn LA, Long LB. Adherence to statin therapyand LDL cholesterol goal attainment by patients with diabetes and dyslipidemia.Diabetes Care. 2005;28(3):595-99.
11. Sueta CA, Chowdhury M, Boccuzzi SJ, et al. Analysis of the degree ofundertreatment of hyperlipidemia and congestive heart failure secondary tocoronary artery disease. Am J Cardiol. 1999;83(9):1303-07.
12. Pearson TA, Laurora I, Chu H, Kafonek S. The lipid treatment assessmentproject (L-TAP): a multicenter survey to evaluate the percentages of dyslip-idemic patients receiving lipid-lowering therapy and achieving low-densitylipoprotein cholesterol goals. Arch Intern Med. 2000;160(4):459-67.
13. Straka RJ, Taheri R, Cooper SL, Tan AW, Smith AC. Assessment ofhypercholesterolemia control in a managed care organization. Pharmacother.2001;21(7):818-27.
14. Latts LM. Assessing the results: phase 1 hyperlipidemia outcomes in 27health plans. Am J Med. 2001;110(S 6A):17S-23S.
15. Dubois RW, Alexander CM, Wade S, et al. Growth in use of lipid-lowering therapies: are we targeting the right patients? Am J Manag Care.2002;8(10):862-67.
16. Nag SS, Pearson TA, Ma L, et al. Estimating cholesterol treatment ratesamong individuals with multiple risk factors and without coronary heartdisease. Am J Cardiol. 2005;95(7):862-64.
17. Meyer JW, Schultz JS, O’Donnell JC, Patel PA, Sasane RM. Patternsand effectiveness of lipid-lowering therapies in a managed care environment.Value Health. 2005;8(5):601-12.
18. Davidson MH, Maki KC, Pearson TA, et al. Results of the National Choles-terol Education (NCEP) Program Evaluation ProjecT Utilizing Novel E-Tech-nology (NEPTUNE) II survey and implications for treatment under the recentNCEP Writing Group recommendations. Am J Cardiol. 2005;96(4):556-63.
19. Friedewald WT, Levy RI, Fredrickson DS. Estimation of the concentrationof low-density lipoprotein cholesterol in plasma, without use of the preparativeultracentrifuge. Clin Chem. 1972;18(6):499-502.
20. Schneeweiss S, Seeger JD, Maclure M, Wang PS, Avorn J, Glynn RJ. Per-formance of comorbidity scores to control for confounding in epidemiologicstudies using claims data. Am J Epidemiol. 2001;154(9):854-64.
21. Farley JF, Harley CR, Devine JW. A comparison of comorbidity measure-ments to predict healthcare expenditures. Am J Manag Care. 2006;12(2):110-19.
22. Hosmer DW, Lemeshow S. Applied logistic regression 2nd ed. New York: JohnWiley & Sons; 2000.
SoMA S. NAG, PhD, is associate director, Merck & Co., Inc., West Point, PA;GREGoRy W. DANIEl, RPh, MS, MPH, is research operations director, HealthCore, Inc., Wilmington, DE; MICHAEl F. BullANo, PharmD, is associatedirector, Health Economics and outcomes Research, Astra-Zeneca lP,Wilmington, DE; SACHIN KAMAl-BAHl, PhD, is associate director, Merck& Co., Inc., West Point, PA; SHIVA G. SAJJAN, PhD, is senior manager, Merck &Co., Inc., West Point, PA; X. HENRy Hu, MD, PhD is senior director, Merck &Co., Inc., West Point, PA; CHARlES AlEXANDER, MD, is senior director, Globaloutcomes Research, Merck & Co., Inc, West Point, PA.
AUTHOR CORRESPONDENCE: Dr. Soma S. Nag, 770 Broad Streetand Sumneytown Pike, WP39-166 19486, Tel.: (215) 652-9219;Fax: (215) 652-0860; E-mail: [email protected].
Authors

www.amcp.org Vol. 13, No. 8 October 2007 JMCP Journal of Managed Care Pharmacy 663
LDL-C Goal Attainment Among Patients Newly DiagnosedWith Coronary Heart Disease or Diabetes in a Commercial HMO
23. Buis M. Predict and adjust with logistic regression. The Stata J. 2007;7(2):221-26.
24. Ansell BJ, Fonarow GC, Maki KC, Dicklin MR, Bell M, Davidson MH.Reduced treatment success in lipid management among women with coronaryheart disease or risk equivalents: results of a national survey. Am Heart J.2006;152(5):976-81.
25. National Committee for Quality Assurance The State of Health Care Quality2006. Washington, DC: National Committee for Quality Assurance; 2006.
26. Stacy TA, Egger A. Results of retrospective chart review to determineimprovement in lipid goal attainment in patients treated by high-volumeprescribers of lipid-modifying drugs. J Manag Care Pharm. 2006;12(9):745-51.Available at: http://www.amcp.org/data/jmcp/745-51.pdf.
27. Valuck RJ, Williams SA, MacArthur M, et al. A retrospective cohort study ofcorrelates of response to pharmacologic therapy for hyperlipidemia in membersof a managed care organization. Clin Ther. 2003;25(11):2936-57.
28. Schultz JS, O’Donnell JC, McDonough KL, Sasane R, Meyer J. Determinantsof compliance with statin therapy and low-density lipoprotein cholesterol goalattainment in a managed care population. Am J Manag Care. 2005;11(5):306-12.
29. Kopjar B, Sales AE, Pineros SL, Sun H, Li YF, Hedeen AN. Adherence withstatin therapy in secondary prevention of coronary heart disease in veteransadministration male population. Am J Cardiol. 2003;92(9):1106-08.
30. Quilliam BJ, Perez HE, Andros V, Jones P. Quantifying the effect of applyingthe NCEP ATP III criteria in a managed care population treated with statintherapy. J Manag Care Pharm. 2004;10(3):244-50. Available at: http://www.amcp.org/data/jmcp/Research-244-250.pdf.
31. Thiebaud P, Patel BV, Nichol MB, Berenbeim DM. The effect of switchingon compliance and persistence: the case of statin treatment. Am J Manag Care.2005;11(11):670-74.
32. Chapman RH, Benner JS, Petrilla AA, et al. Predictors of adher-ence with antihypertensive and lipid-lowering therapy. Arch Intern Med.2005;165(10):1147-52.
33. Wang YR, Alexander GC, Meltzer DO. Lack of effect of guideline changeson LDL cholesterol reporting and control for diabetes visits in the U.S., 1995-2004. Diabetes Care. 2005;28(12):2942-44.
34. Ye X, Gross CR, Schommer J, Cline R, Xuan J, St Peter WL. Initiation ofstatins after hospitalization for coronary heart disease. J Manag Care Pharm.2007;13(5):385-96. Available at http://www.amcp.org/jmcp/JMCPMaga_June07_p385-396.pdf.
35. Massing MW, Henley NS, Carter-Edwards L, Schenck AP, Simpson RJ, Jr.Lipid testing among patients with diabetes who receive diabetes care fromprimary care physicians. Diabetes Care. 2003;26(5):1369-73.