lc/ms/ms in environmental monitoring: an … performance liquid...lc/ms/ms in environmental...
TRANSCRIPT

LC/MS/MS in Environmental Monitoring: An Instrument Company Perspective
Paul C. Winkler, Ph.D. Senior Field Applications Specialist AB SCIEX
2 © 2013 AB SCIEX
Presentation Outline
The Early Days
• Initial state of LC/MS/MS technology
• Evolution of analytical requirements
• Discussion of technology improvements to address analytical requirements
• Examples of data that demonstrate advantages of new technology
• Discussion of software that is essential for processing more complex data
3 © 2013 AB SCIEX
LC/MS/MS In Environmental Analyses: An Overview
The Early Days
• Early 1990’s most environmental analysis performed using GC/MS
• Some LC/MS/MS done for explosive and carbamate compounds. No regulatory methods for this technique
• Methods were unstable (Thermospray particularly) and instruments required extensive maintenance.
• HPLC columns were 4.6mm and required high flow rates and the peaks were wide
• The industry was not familiar with the technique and regarded it as a research tool
4 © 2013 AB SCIEX
LC/MS/MS In Environmental Analyses: An Overview
What Changes Have Occurred?
• Major improvements in the practice of HPLC
• Better columns and higher pressures resulted in more narrow peaks
• Shareholders are requiring good data in more complex matrices
• This puts pressure on manufacturers of mass spectrometers to meet these new requirements

5 © 2013 AB SCIEX
Compounds commonly requested: In
crea
sing
MW
Increasing polarity
Other chemical properties of interest:
- Solubility
- Structure
- Stability
- Charge
Quaternary ammonium salts
Acidic/polar herbicides
Macrolide antibiotics
Acrylamide
Melamine
Packaging migrants
Mycotoxins
Marine biotoxins
Assorted pesticides
Heterocyclic antibiotics
Aminoglycoside antibiotics
Assorted antibiotics
What the industry looks like today
6 © 2013 AB SCIEX
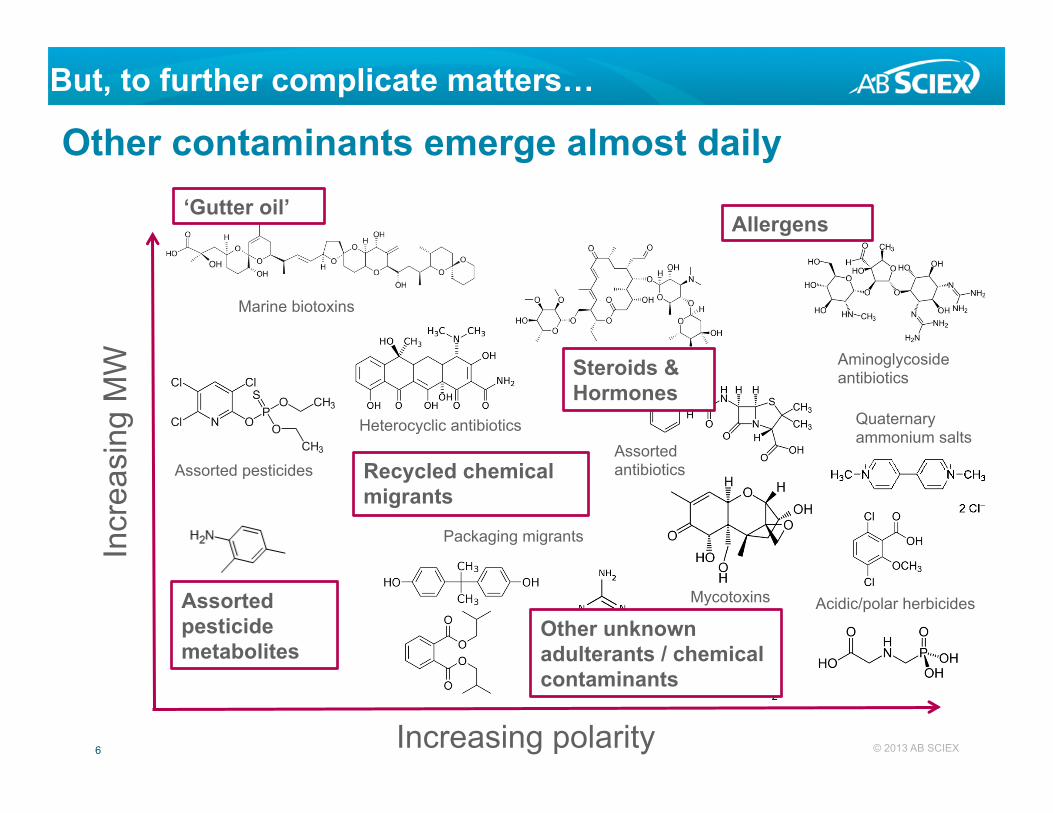
Other contaminants emerge almost daily In
crea
sing
MW
Increasing polarity
Quaternary ammonium salts
Acidic/polar herbicides
Macrolide antibiotics
Acrylamide
Melamine
Packaging migrants
Mycotoxins
Marine biotoxins
Assorted pesticides
Heterocyclic antibiotics
Aminoglycoside antibiotics
Assorted antibiotics
Assorted pesticide metabolites
Other unknown adulterants / chemical contaminants
Allergens
Steroids & Hormones
‘Gutter oil’
Recycled chemical migrants
But, to further complicate matters…
7 © 2013 AB SCIEX
Industry Response: We Bulked Up
Fast Forward to the Present
• Faster
• Need to meet the needs of faster chromatography
• More Sensitive
• Lower LOD’s and LOQ’s
• More reliable
• Need instruments that are easy to optimize and just run
• Better Identification
• Need powerful software to work with these complex data sets

8 © 2013 AB SCIEX
Speed and Sensitivity 0.1 ng/mL Pesticide Standard (10 µL Injected)
QTRAP® 6500 with IonDrive™ Turbo V source at 450°C
493 Scheduled MRM™
9 © 2013 AB SCIEX
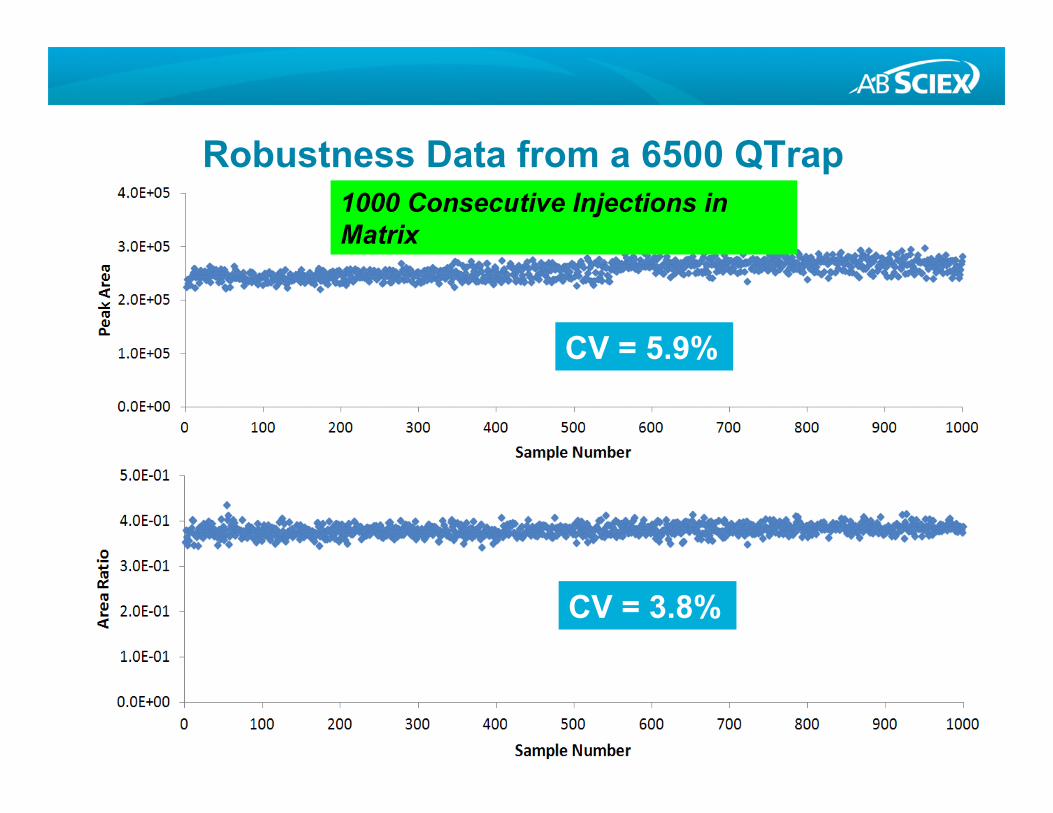
1000 Consecutive Injections in Matrix
CV = 5.9%
CV = 3.8%
Robustness Data from a 6500 QTrap

10 © 2013 AB SCIEX
Confirmation of Compound Identification
• Current practice is to identify a compound based on a ratio of a primary and secondary ion signal
• With complex matrices, interferences exist that cause errors in this ratio
• Acquisition of full scan MS/MS can provide far better confirmation of compound identification
• Triple quadrupole instrument scan time is too slow to allow acquisition of MS/MS spectra on a chromatographic timescale
11 © 2013 AB SCIEX
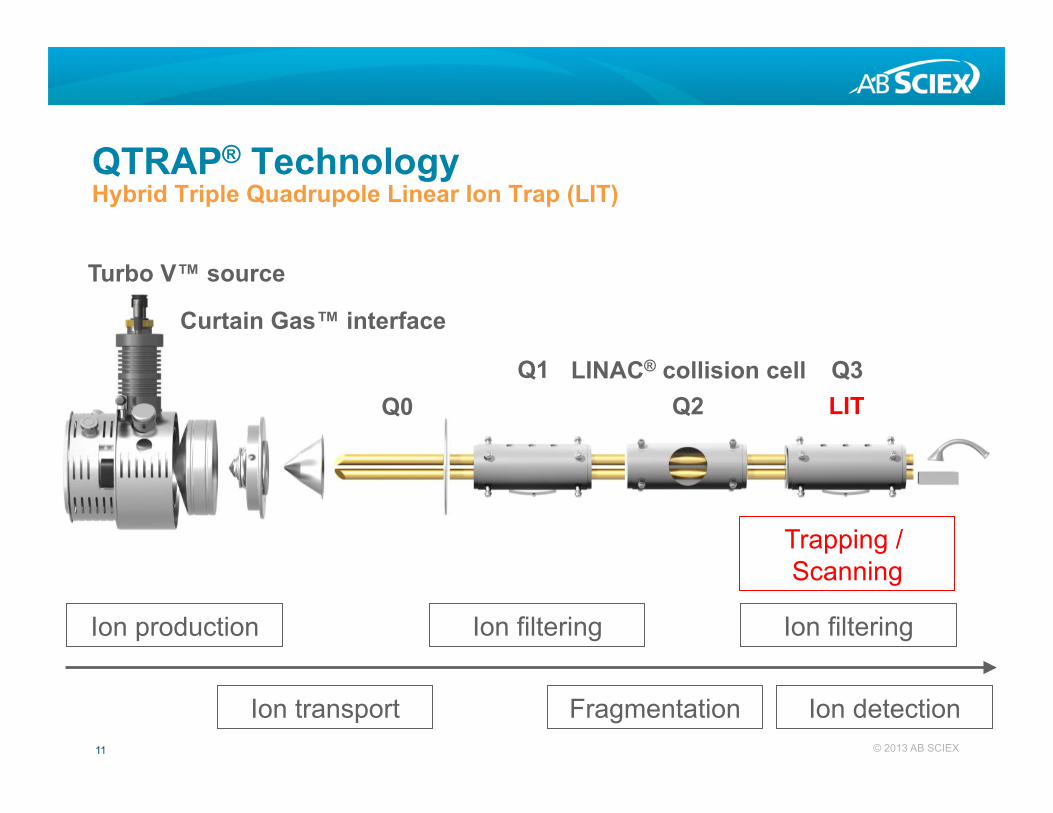
LINAC® collision cell Q2
QTRAP® Technology Hybrid Triple Quadrupole Linear Ion Trap (LIT)
Ion detection
Ion filtering
Ion transport
Ion production Ion filtering
Fragmentation
Turbo V™ source
Curtain Gas™ interface
Q0 Q1 Q3
LIT
Trapping / Scanning
12 © 2013 AB SCIEX
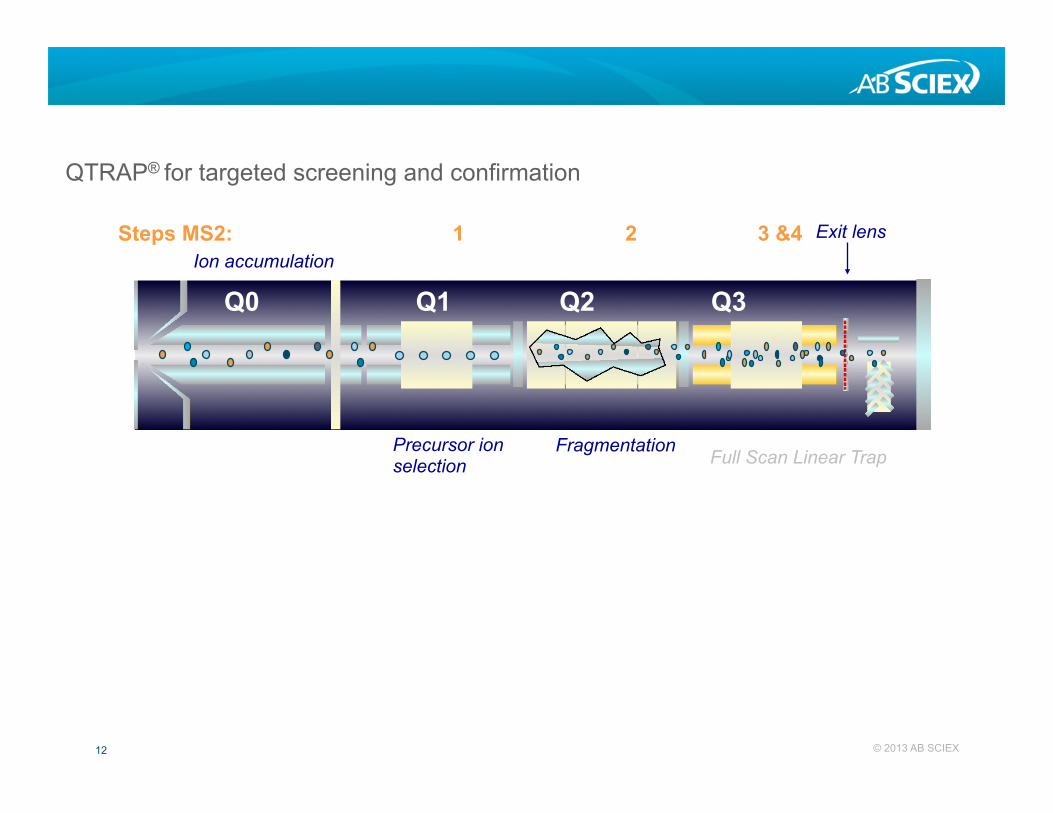
Q0 Q1 Q2 Q3
Q TRAP® System - Enhanced Product Ion Scanning
Precursor ion selection
Ion accumulation
Fragmentation
Exit lens Steps MS2: 1 2 3 &4
Full Scan Linear Trap
QTRAP® for targeted screening and confirmation
13 © 2013 AB SCIEX
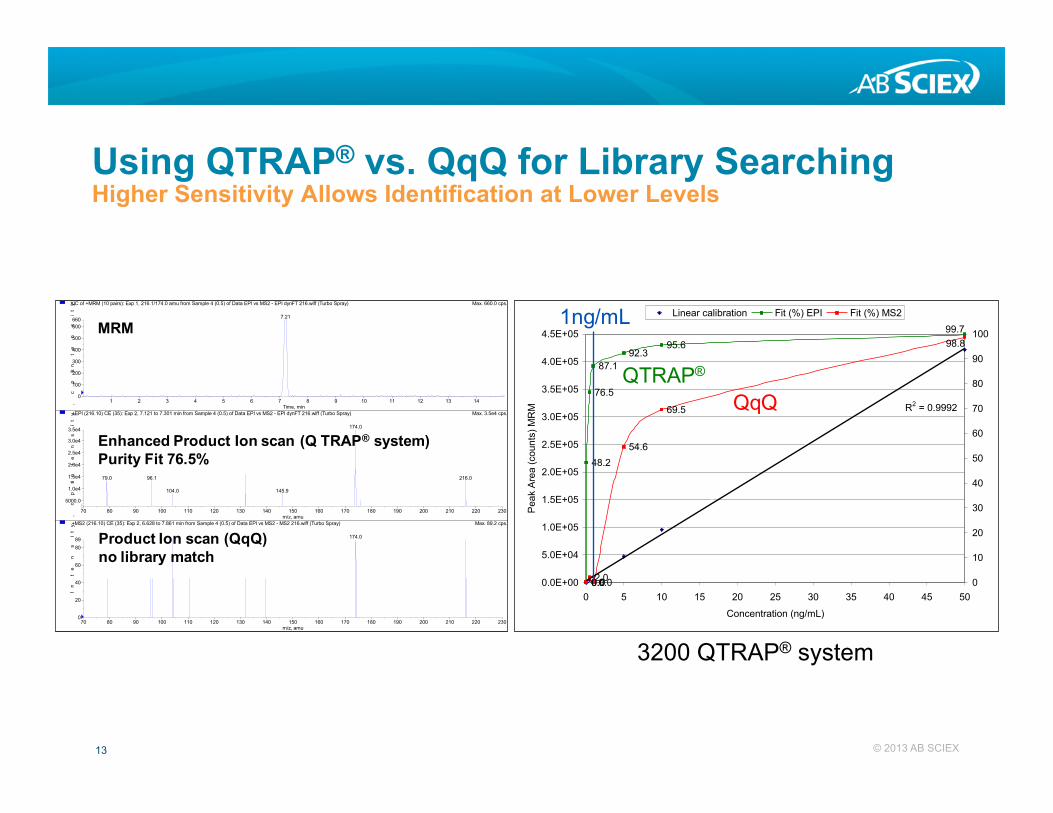
Using QTRAP® vs. QqQ for Library Searching Higher Sensitivity Allows Identification at Lower Levels
XIC of +MRM (10 pairs): Exp 1, 216.1/174.0 amu from Sample 4 (0.5) of Data EPI vs MS2 - EPI dynFT 216.wiff (Turbo Spray) Max. 660.0 cps.
1 2 3 4 5 6 7 8 9 10 11 12 13 14Time, min
0
100
200
300
400
500
600660
In
te
ns
it
y,
c
ps
7.21
+EPI (216.10) CE (35): Exp 2, 7.121 to 7.301 min from Sample 4 (0.5) of Data EPI vs MS2 - EPI dynFT 216.wiff (Turbo Spray) Max. 3.5e4 cps.
70 80 90 100 110 120 130 140 150 160 170 180 190 200 210 220 230m/z, amu
5000.0
1.0e4
1.5e4
2.0e4
2.5e4
3.0e4
3.5e4
In
te
ns
it
y,
c
ps
174.0
96.1 216.079.0
145.9104.0
+MS2 (216.10) CE (35): Exp 2, 6.628 to 7.861 min from Sample 4 (0.5) of Data EPI vs MS2 - MS2 216.wiff (Turbo Spray) Max. 89.2 cps.
70 80 90 100 110 120 130 140 150 160 170 180 190 200 210 220 230m/z, amu
0
20
40
60
8089
In
te
ns
it
y,
c
ps
174.0
MRM
Enhanced Product Ion scan (Q TRAP® system)Purity Fit 76.5%
Product Ion scan (QqQ)no library match
0
48.2
76.5
87.192.3
95.6
0.00.02.00.0
54.6
69.5
99.798.8
R2 = 0.9992
0.0E+00
5.0E+04
1.0E+05
1.5E+05
2.0E+05
2.5E+05
3.0E+05
3.5E+05
4.0E+05
4.5E+05
0 5 10 15 20 25 30 35 40 45 50
Concentration (ng/mL)
Pea
k A
rea
(cou
nts)
MR
M
0
10
20
30
40
50
60
70
80
90
100
Linear calibration Fit (%) EPI Fit (%) MS21ng/mL
QTRAP®
QqQ
3200 QTRAP® system
14 © 2011 AB SCIEX
QTRAP® Example PPCP in Water
MRM-EPI
Pittcon 2011
15 © 2011 AB SCIEX
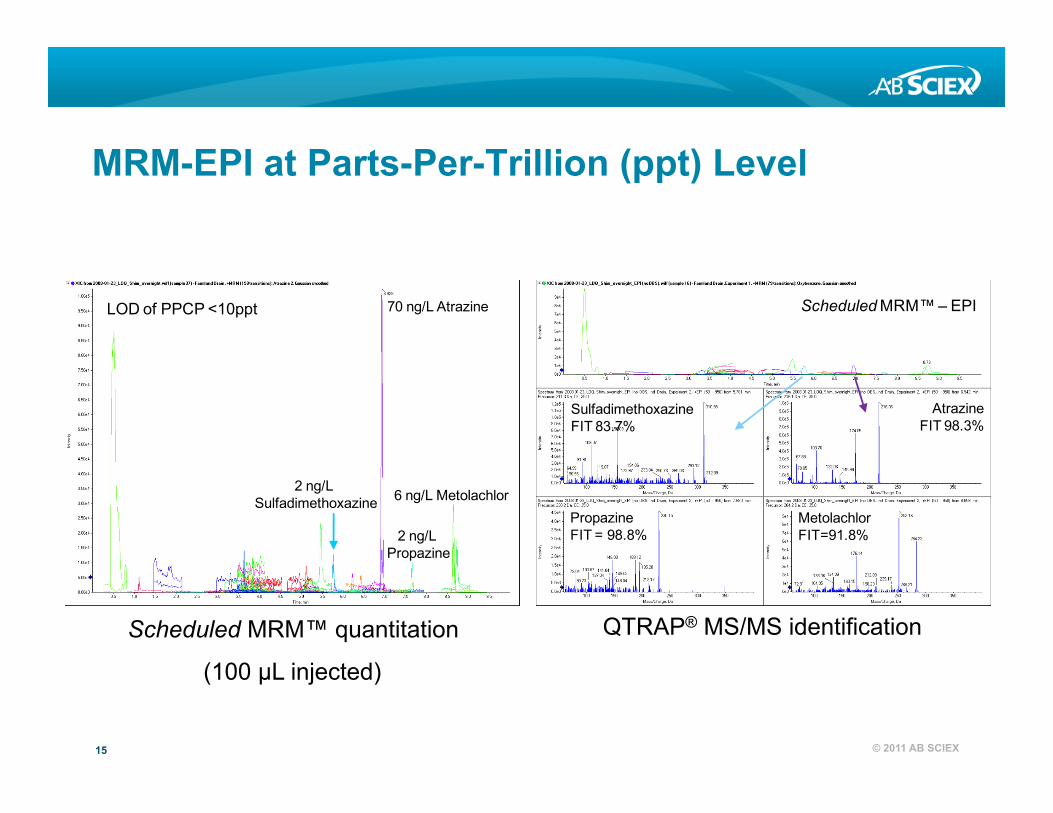
MRM-EPI at Parts-Per-Trillion (ppt) Level
LOD of PPCP <10ppt 70 ng/L Atrazine
2 ng/L Propazine
6 ng/L Metolachlor2 ng/L
Sulfadimethoxazine
Scheduled MRM™ – EPI
SulfadimethoxazineFIT 83.7%
AtrazineFIT 98.3%
PropazineFIT = 98.8%
MetolachlorFIT=91.8%
Scheduled MRM™ quantitation
(100 µL injected)
QTRAP® MS/MS identification
16 © 2011 AB SCIEX
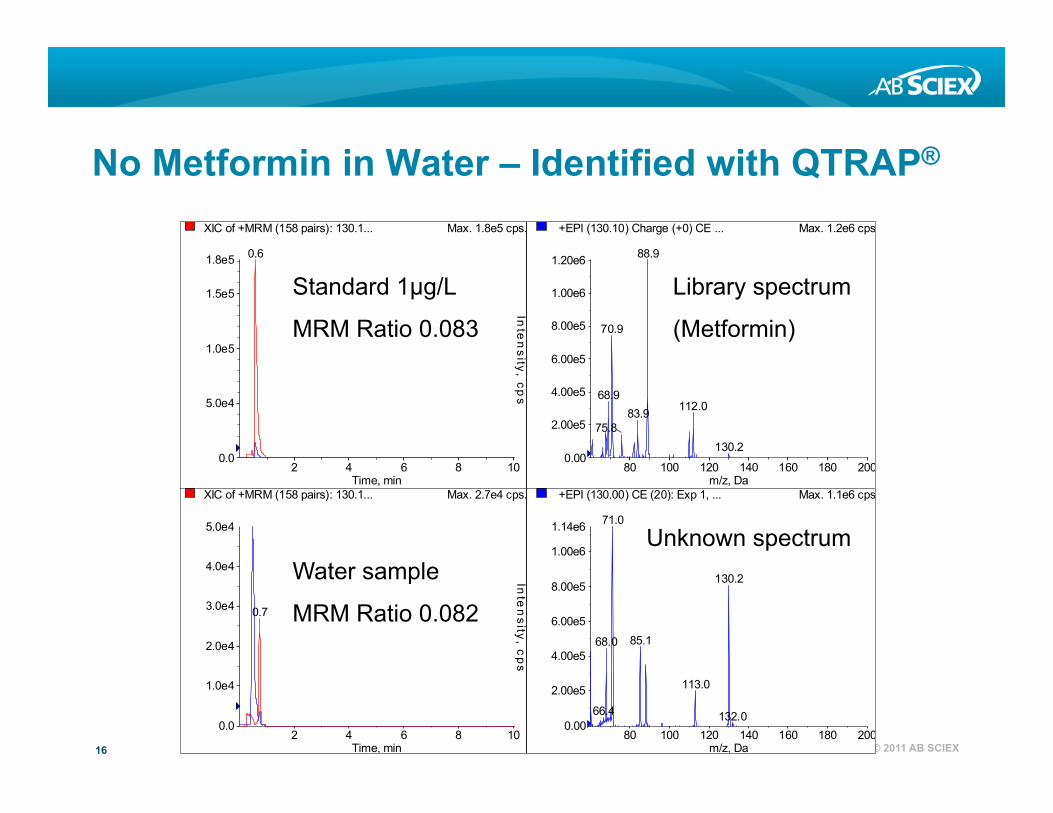
No Metformin in Water – Identified with QTRAP®
XIC of +MRM (158 pairs): 130.1... Max. 1.8e5 cps.
2 4 6 8 10Time, min
0.0
5.0e4
1.0e5
1.5e5
1.8e5
Inte
nsity
, cps
0.6
+EPI (130.10) Charge (+0) CE ... Max. 1.2e6 cps.
80 100 120 140 160 180 200m/z, Da
0.00
2.00e5
4.00e5
6.00e5
8.00e5
1.00e6
1.20e6
Inte
nsity, cp
s
88.9
70.9
68.9112.083.9
75.8130.2
XIC of +MRM (158 pairs): 130.1... Max. 2.7e4 cps.
2 4 6 8 10Time, min
0.0
1.0e4
2.0e4
3.0e4
4.0e4
5.0e4
Inte
nsity, c
ps
0.7
+EPI (130.00) CE (20): Exp 1, ... Max. 1.1e6 cps.
80 100 120 140 160 180 200m/z, Da
0.00
2.00e5
4.00e5
6.00e5
8.00e5
1.00e6
1.14e6In
ten
sity, cp
s71.0
130.2
85.168.0
113.0
66.4 132.0
Standard 1µg/L
MRM Ratio 0.083
Water sample
MRM Ratio 0.082
Library spectrum
(Metformin)
Unknown spectrum
17 © 2011 AB SCIEX
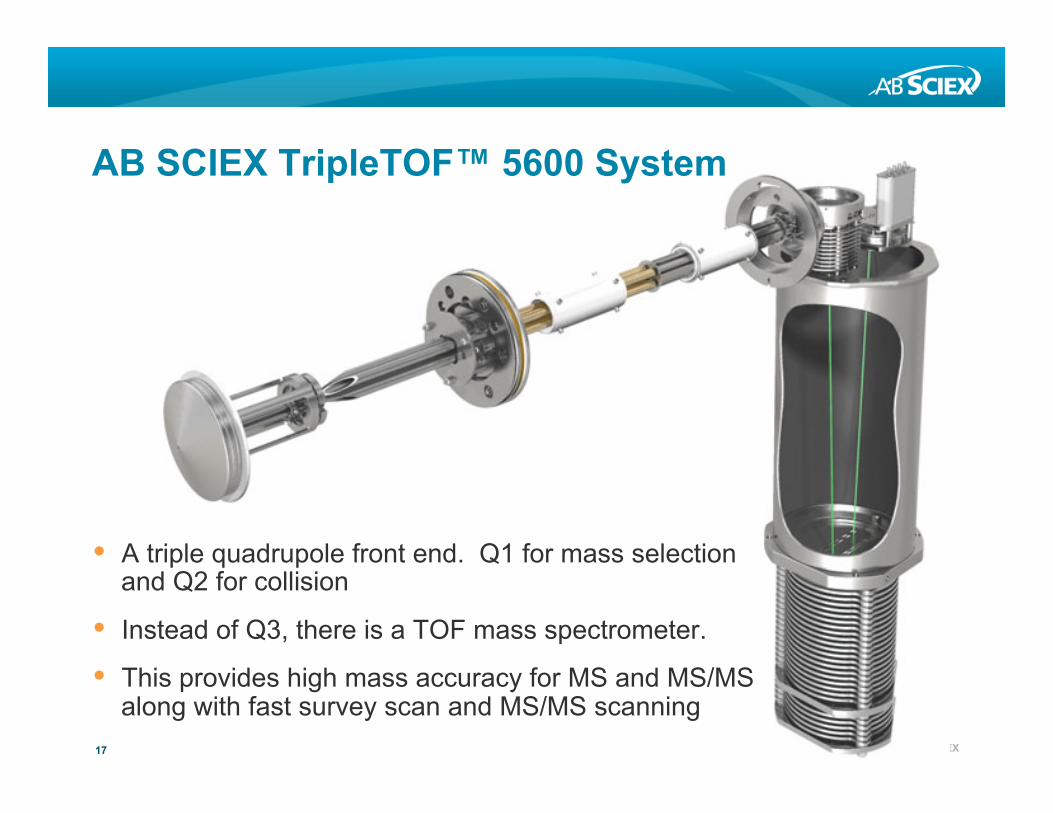
AB SCIEX TripleTOF™ 5600 System
� A triple quadrupole front end. Q1 for mass selection and Q2 for collision
� Instead of Q3, there is a TOF mass spectrometer.
� This provides high mass accuracy for MS and MS/MS along with fast survey scan and MS/MS scanning

18 © 2011 AB SCIEX
Time of Flight Analyzers
19 © 2011 AB SCIEX
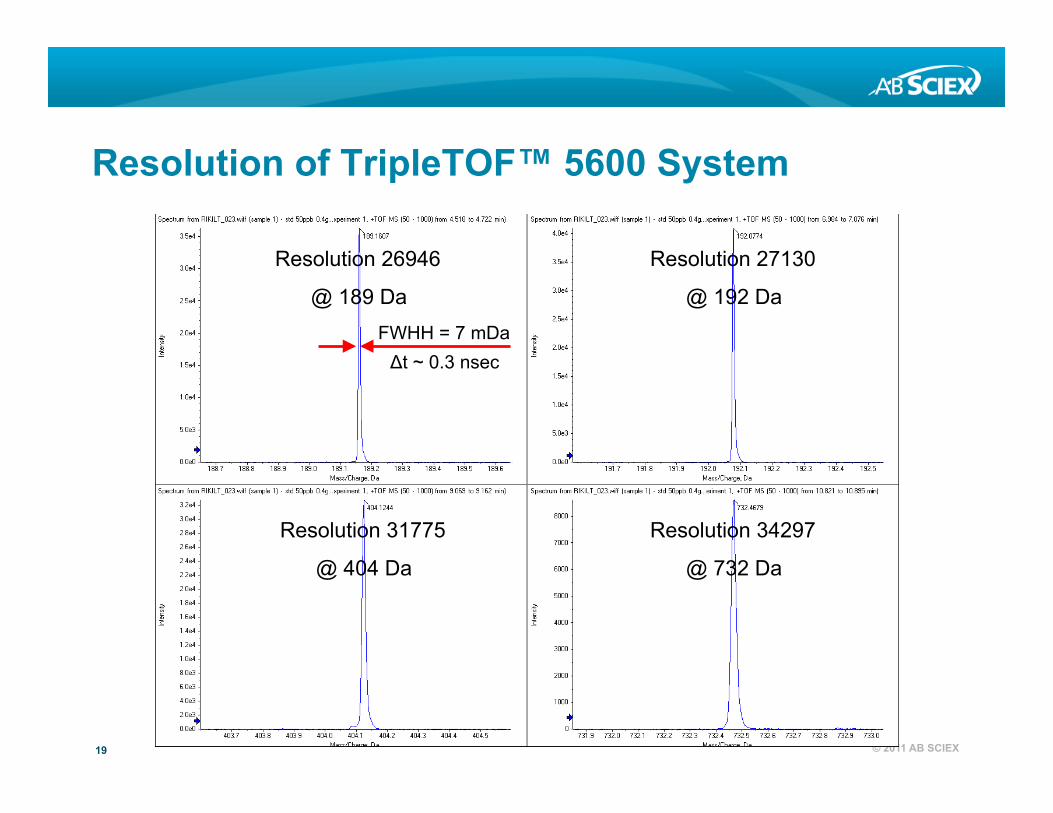
Resolution of TripleTOF™ 5600 System
Resolution 26946
@ 189 Da FWHH = 7 mDa Δt ~ 0.3 nsec
Resolution 27130
@ 192 Da
Resolution 31775
@ 404 Da
Resolution 34297
@ 732 Da
20 © 2011 AB SCIEX
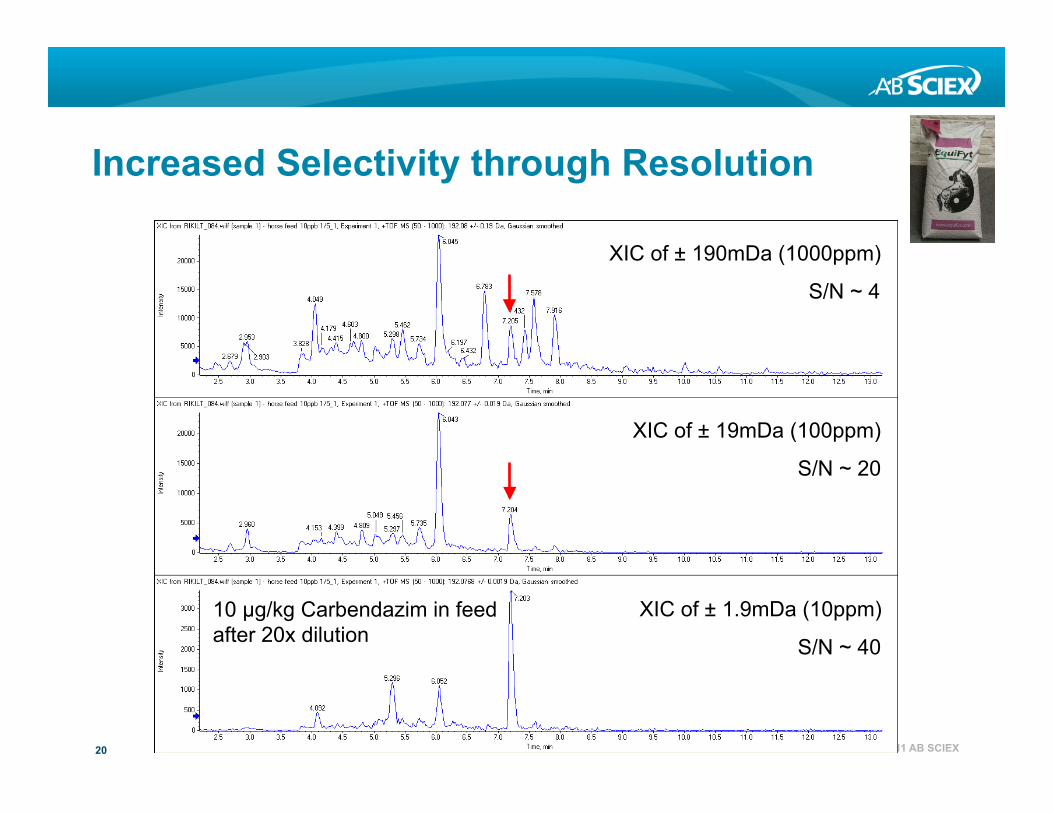
Increased Selectivity through Resolution
XIC of ± 19mDa (100ppm)
S/N ~ 20
XIC of ± 1.9mDa (10ppm)
S/N ~ 40
XIC of ± 190mDa (1000ppm)
S/N ~ 4
10 µg/kg Carbendazim in feed after 20x dilution
21 © 2011 AB SCIEX
Software is Mandatory for Targeted and Non-Targeted Data Processing
• Very large amount of information in each data set
• Survey scan such as MRM’s or TOF full scan
• Dependent MS/MS scans
22 © 2011 AB SCIEX
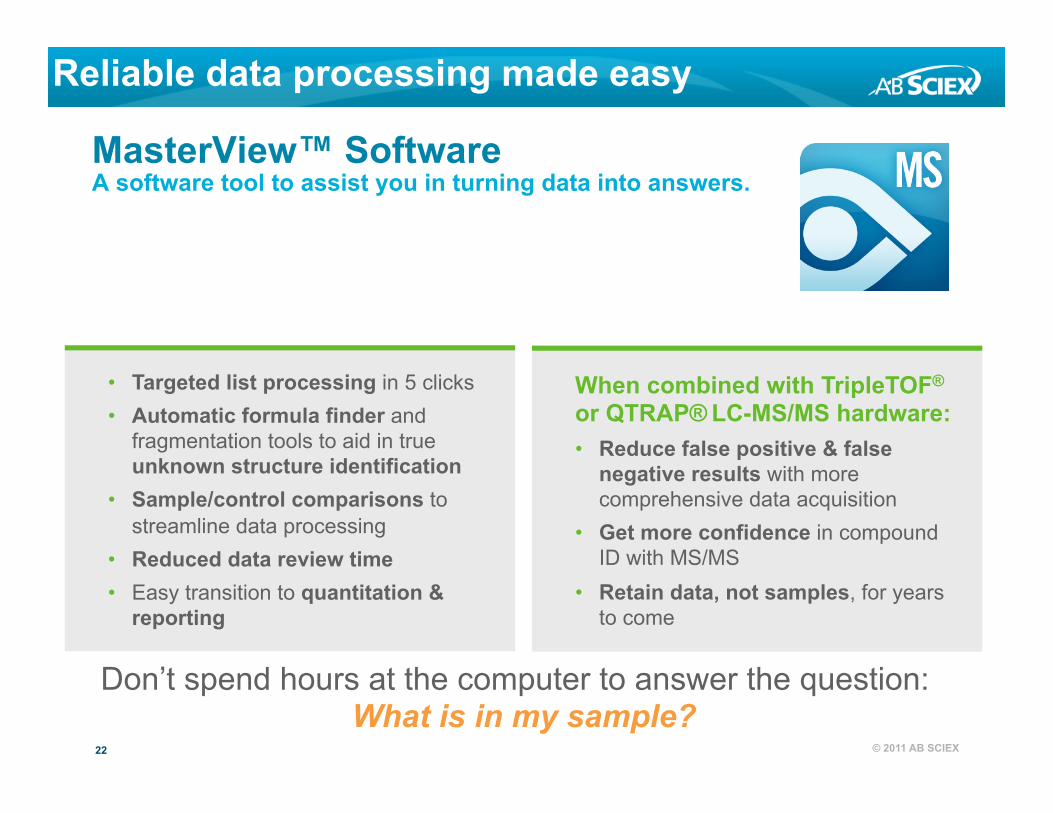
Reliable data processing made easy
MasterView™ Software A software tool to assist you in turning data into answers.
• Targeted list processing in 5 clicks • Automatic formula finder and
fragmentation tools to aid in true unknown structure identification
• Sample/control comparisons to streamline data processing
• Reduced data review time • Easy transition to quantitation &
reporting
When combined with TripleTOF®
or QTRAP® LC-MS/MS hardware: • Reduce false positive & false
negative results with more comprehensive data acquisition
• Get more confidence in compound ID with MS/MS
• Retain data, not samples, for years to come
Don’t spend hours at the computer to answer the question: What is in my sample?
23 © 2011 AB SCIEX
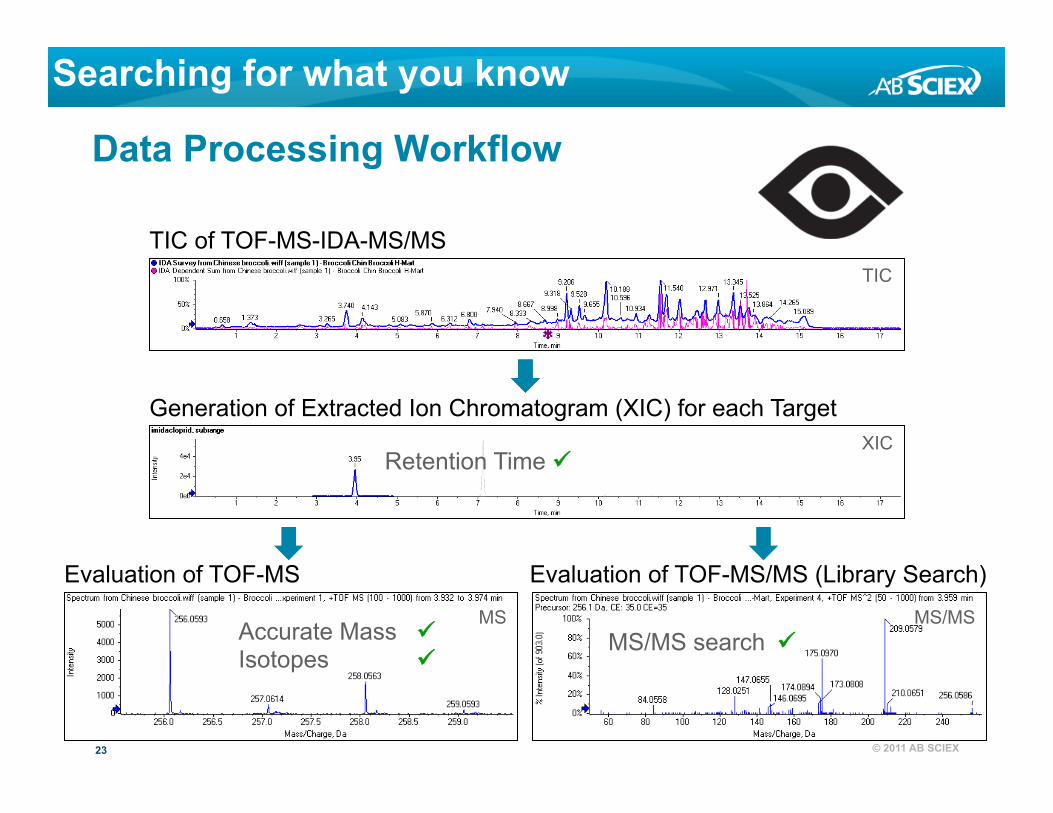
Searching for what you know
Data Processing Workflow
Evaluation of TOF-MS Evaluation of TOF-MS/MS (Library Search)
MS MS/MS
Generation of Extracted Ion Chromatogram (XIC) for each Target XIC
TIC of TOF-MS-IDA-MS/MS
Retention Time ü
Accurate Mass ü Isotopes ü
MS/MS search ü
TIC
24 © 2011 AB SCIEX
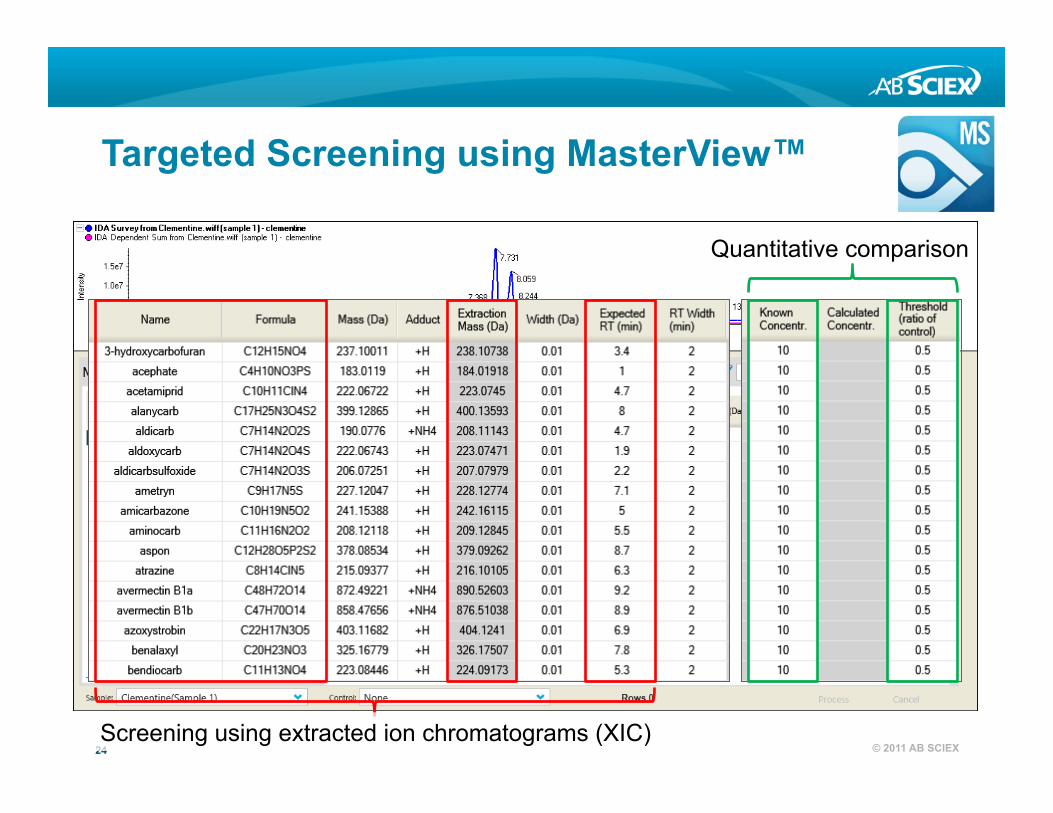
Targeted Screening using MasterView™
Screening using extracted ion chromatograms (XIC)
Quantitative comparison
25 © 2011 AB SCIEX
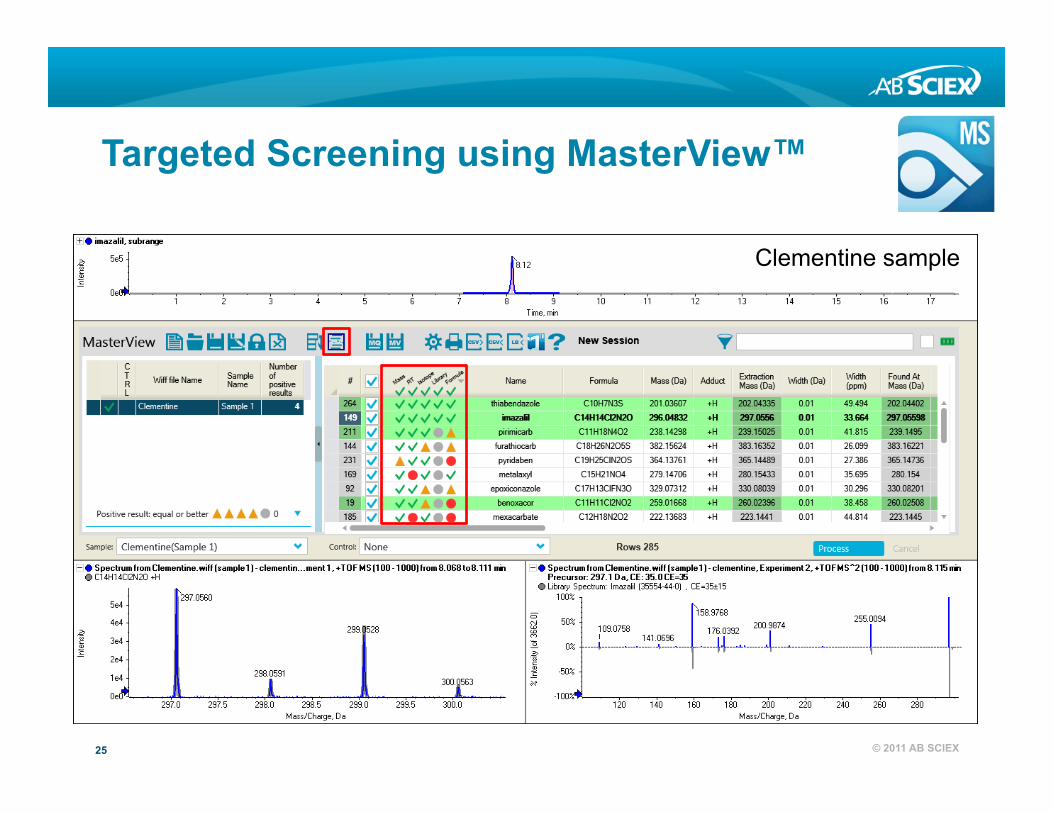
Targeted Screening using MasterView™
Clementine sample
26 © 2011 AB SCIEX
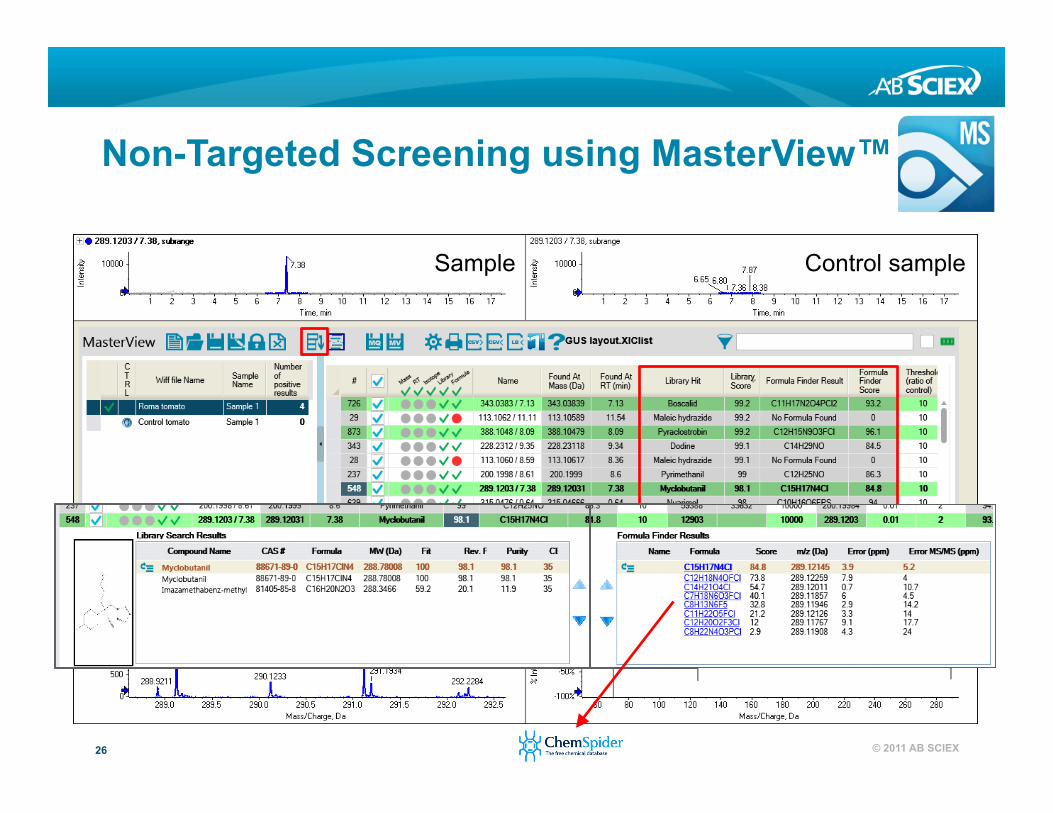
Non-Targeted Screening using MasterView™
Control sample Sample
27 © 2011 AB SCIEX
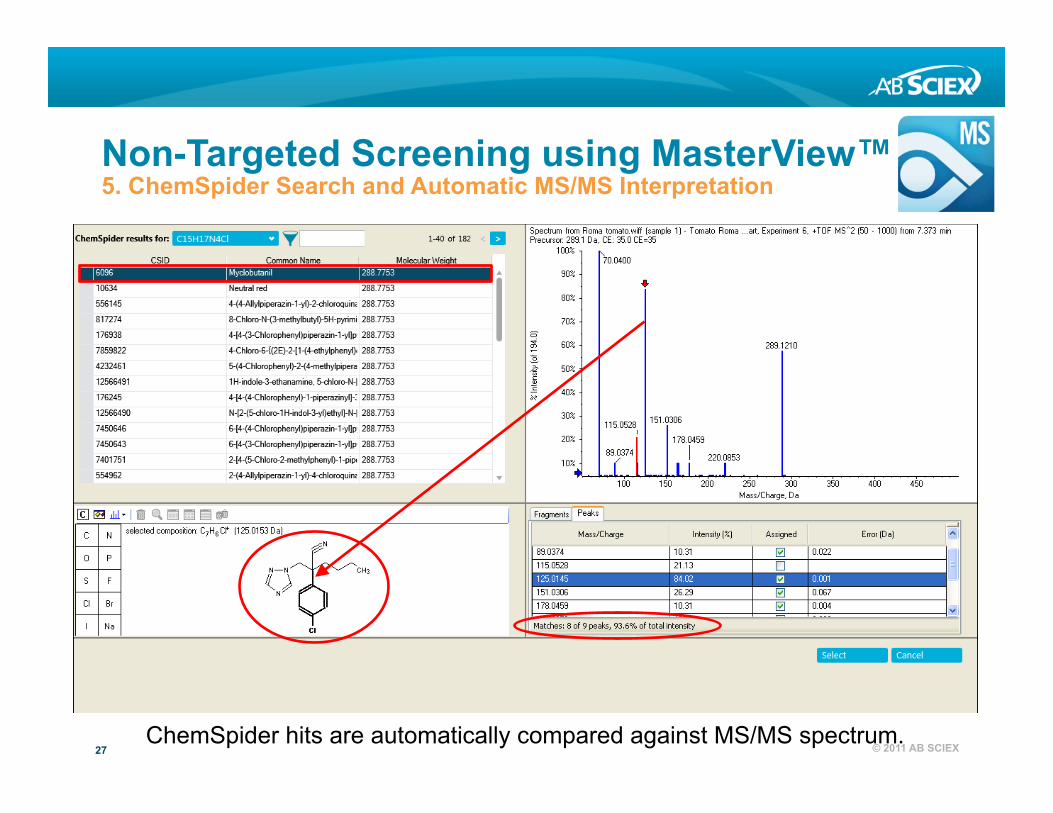
Non-Targeted Screening using MasterView™ 5. ChemSpider Search and Automatic MS/MS Interpretation
ChemSpider hits are automatically compared against MS/MS spectrum.

28 © 2011 AB SCIEX
Number of matching molecular formulae based on selectivity criteria The use of accurate mass molecular ion only gives many matches. Addition of MS/MS information greatly reduces match possibilities.
0
20
40
60
80
100
120
20 ppm 10 ppm 5 ppm 2 ppm
Num
ber o
f mat
chin
g fo
rmul
ae
Mass accuracy
using the accurate mass molecular ion only plus using the isotopic pattern (10%) plus using the MS/MS fragment ions
*
** *
* *
*M+H+
M+NH4+
M+Na+
The importance of MS/MS to ID unknowns

29 © 2011 AB SCIEX
The importance of MS/MS to ID unknowns
20 pesticides spiked at
10 ppb in 5 food matrices:
% correctly identified
% outside of
acceptability range (possible false negative
report)
% questionable
(needing review)
Analyzed by MRM ion ratios
95%
4% - all confirmed by library search
1% - confirmed by library search
Analyzed by MS/MS
library searching
99%
0%
1% - confirmed by MRM ion
ratio
30 © 2011 AB SCIEX
Conclusions • Instruments are capable of low parts per trillion LOD’s
• Instrument speed is sufficient to allow good quantitation with narrow chromatographic peaks
• Instruments are capable of acquiring full scan MS/MS spectra on routine basis in a production setting
• Software is in place to allow rapid and comprehensive analysis of complex data sets
• Because it is possible to acquire MS/MS spectra routinely strong consideration should be given to require this data when reporting results