lc/ms analysis of the monoclonal antibody rituximab using ... · lc/ms analysis of the monoclonal...
TRANSCRIPT
LC/MS Analysis of the Monoclonal Antibody Rituximab Using the Q Exactive Benchtop Orbitrap Mass SpectrometerMartin Samonig1,2, Christian Huber1,2 and Kai Scheffler2,3 1Division of Chemistry and Bioanalytics, University of Salzburg, Salzburg, Austria 2Christian Doppler Laboratory for Innovative Tools for Biosimilar Characterization, University of Salzburg, Salzburg, Austria 3Thermo Fisher Scientific, Dreieich, Germany
Ap
plica
tion
No
te 5
91
Key WordsMonoclonal antibody, intact protein mass measurement, sequence confirmation, protein deconvolution, top-down sequencing
GoalAnalysis and characterization of a monoclonal antibody using an optimized LC/MS workflow based on monolithic columns coupled online with the Thermo Scientific™ Q Exactive™ benchtop Orbitrap™ mass spectrometer.
IntroductionMonoclonal antibodies (mAbs) are one of the fastest growing classes of pharmaceutical products. They play a major role in the treatment of a variety of conditions such as cancer, infectious diseases, allergies, inflammation, and auto-immune diseases. Because mAbs can exhibit significant heterogeneity, extensive analytical characterization is required to obtain approval for a new mAb as a therapeutic product. Mass spectrometry has become an essential tool in the characterization of mAbs, providing molecular weight determinations of intact proteins as well as separated light and heavy chains, elucidation of glycosylation and glycan structures, confirmation of correct amino acid sequences, and identification of impurities such as host cell proteins (HCP) inherent to the production process.
Rituximab, which is known under the trade names Rituxan® (Biogen Idec/Genentech) in the United States and MabThera® (Roche) in Europe, is a recombinantly produced, monoclonal chimeric antibody against the protein CD20. It was one of the first new generation drugs in cancer immune therapy. Rituximab was approved by the U.S. Food and Drug Administration in 1997 and by the European Commission in 1998 for cancer therapy of malignant lymphomas. The variable domain of the antibody targets the cell surface molecule CD20, that can be found in some non-Hodgkin lymphomas.
In this application note, the capabilities and performance of the Q Exactive benchtop Orbitrap mass spectrometer in analyzing the intact and reduced forms of rituximab are demonstrated as well as sequence confirmation analyses using a combined top-down and bottom-up approach.
Furthermore, the sensitivity of two chromatographic setups using monolithic columns coupled online to the mass spectrometer is evaluated. The data obtained demonstrate superior resolution and mass accuracy of the Q Exactive mass spectrometer and present it as a high-confidence screening tool for accelerated and accurate biopharmaceutical product development and characterization.

2 ExperimentalSample PreparationThe commercially available monoclonal antibody rituximab was used in all experiments. Rituximab is a sterile, clear, colorless, preservative-free, concentrated solution for intravenous infusion. It was supplied at a concentration of 10 mg/mL, formulated in 7.35 mg/mL sodium citrate buffer containing 0.7 mg/mL polysorbate 80, 9.0 mg/mL sodium chloride, and sterile water, and ready for injection. The pH was adjusted to 6.5 with sodium hydroxide or hydrochloric acid.
Prior to LC/MS analysis, rituximab was dialyzed due to polysorbate 80 in the sample. The dialysis was performed with a Thermo Scientific™ Slide-A-Lyzer™ dialysis cassette with a molecular weight cut off (MWCO) of 3.5 kDa. A 1 mL sample of rituximab was dialyzed for 48 h against 2 L of 20% aqueous acetonitrile (ACN) at 4 °C.
For analysis of the light and heavy chains of rituximab, disulfide bonds were reduced by incubation for 30 min at 60 °C with 5 mM tris(2 carboxyethyl)phosphine (TCEP).
For the bottom-up analysis of digested mAb, the sample was alkylated with 20 mM iodoacetamide (IAA) for 30 min at room temperature in the dark after the reduction step. The sample was purified with Thermo Scientific™ Pierce™ C18 tips dried in a Thermo Scientific™ SpeedVac™ concentrator and dissolved in 0.5 M triethylammonium bicarbonate buffer (TEAB). Sequencing grade modified trypsin (Promega) was added twice in a total ratio of 1:15 (w/w) at 0 h and 1.5 h and digestion was allowed to proceed for 2.5 h at 37 °C. The digest was stopped by addition of triflouroacetic acid (TFA) to approximately pH 3.
All samples were supplied in autosampler vials containing glass inserts (micro-inserts 0.1 ml, clear glass, VWR).
Liquid ChromatographyA monolithic 160 x 0.20 mm i.d. poly(styrene-divinylbenzene) copolymer (PS-DVB) capillary column, prepared according to a previously published protocol1, and a Thermo Scientific™ PepSwift™ monolithic 250 x 0.20 mm i.d PS-DVB capillary column were used. Protein separations were performed with a Thermo Scientific™ Dionex™ UltiMate™ 3000 RSLCnano system that included a detector equipped with a 3 nL z-shaped capillary detection cell.
Separations were accomplished at 55 °C with a gradient of 20–60% acetonitrile (ACN) in 0.050% aqueous triflouroacetic acid (TFA) in 10 min at a flow rate of 1 µL/min. For the proteolytic digest with trypsin, the gradient was adapted to run at 0–50% B in 30 min. For the reduced antibody samples, a gradient from 35–45% B in 15 min was selected.
Protein separation in a higher scale was performed using a Thermo Scientific™ ProSwift™ RP-10R monolithic 50 mm x 1.0 mm i.d. column with an UltiMate 3000 RSLCnano system that included a 45 nL detection cell. The column was run with a flow rate of 60 µL/min and a column temperature set to 55 °C. The gradient used was 26–80% B in 20 min. For the reduced antibody, a gradient of 26–56% B in 20 min was chosen to separate the heavy and the light chain.
The recorded back pressure of the monolithic columns for the gradients described above was in the range of 190 to 260 bar for the PepSwift 250 mm x 0.2 mm i.d. column and 120 to 180 bar for the ProSwift RP-10R 50 mm x 1 mm i.d. column.
For all experiments, the solvents used were water with 0.05% TFA (A) and acetonitrile with 0.05% TFA (B). The LC gradients are described in Tables 1 and 2.
Table 1. LC gradients used for experiments with the PepSwift 250 mm x 0.2 mm i.d. column, at a flow rate of 1 μL/min
Mass Spectrometry The Q Exactive benchtop Orbitrap mass spectrometer was used for all experiments in this study. Experiments using the ProSwift RP-10R 50 mm x 1 mm i.d. column were performed using the Thermo Scientific™ IonMax™ source with the heated electrospray ionization (HESI) sprayer, applying 4 kV spray voltage and sheath gas and auxiliary gas flow rates of 15 and 5 units, respectively.
All other experiments were performed using the Thermo Scientific™ NanoFlex™ ion source equipped with 15 cm PicoTip® emitter (New Objective, Woburn, USA; 20 µm i.d., 360 µm o.d., 10 µm tip), running with a flow rate of 1 µL/min. A source voltage of 1.5 kV was applied.
Method details are provided in Table 3.
Table 2. LC gradient used for experiments with the ProSwift RP-10R 50 mm x 1 mm i.d. column, at a flow rate of 60 μL/min
Time [min]
Intact mAb [%B]
Time [min]
Reduced mAb [%B]
Time [min]
mAb Digest [%B]
0.0 20 0.0 35 0.0 0
10.0 60 15.0 45 30.0 50
10.1 85 15.1 85 30.1 85
16.0 85 21.0 85 40.0 85
16.1 20 21.1 35 40.1 0
30.0 20 30.0 35 50.0 0
Time [min]
Intact mAb [%B]
Time [min]
Reduced mAb [%B]
0.0 26 0.0 26
15.0 80 15.0 56
20.0 80 15.1 80
20.1 26 20.0 80
30.0 26 20.1 26
30.0 26

Source CIDThe source CID (SID) parameter is a DC offset (0–100 eV) that is added to the source DC offset. The source DC offset consists of three voltages: capillary DC, S-lens DC, and S-lens exit lens. The application of this DC offset by setting the source CID parameter results in collisions of the analytes inside the injection flatapole with residual gas molecules present in the source region of the instrument.
All-Ion FragmentationAll-ion fragmentation (AIF) is a fragmentation type in which all ions generated in the source are guided through the ion optics of the mass spectrometer, accumulated in the C-trap, and sent together to the higher-energy collisional dissociation (HCD) cell for fragmentation. In this case, the quadrupole is not set to select a particular precursor but operated in RF-only pass-through mode. For the analysis of intact proteins, this is a useful method since different charge states often show different fragmentation behavior and it is not easy to predict which one works best.
Data AnalysisFull MS spectra were deconvoluted using Thermo Scientific™ Protein Deconvolution™ software version 2.0. From the intact antibody and the intact heavy chain, the spectra acquired at a resolution setting of 17,500 were deconvoluted using the ReSpect™ algorithm. High resolution spectra from the intact light chain acquired at a resolution of 140,000 and top-down spectra acquired at 70,000 resolution were deconvoluted using the Xtract algorithm. To identify glycoforms of the intact antibody and the intact heavy chain obtained after reduction, the masses were compared to the expected masses with the various combinations of commonly found glycoforms.
The top-down HCD and AIF spectra were deconvoluted using the Xtract algorithm in the Thermo Scientific™ Qual Browser™ utility. Fragment ion assignment was performed using Thermo Scientific™ ProSightPC™ software version 3.0 in single protein mode with a fragment ion tolerance of 5 ppm.
The dataset obtained from the proteolytic digest was processed with Thermo Scientific™ Proteome Discoverer™ software version 1.4, using the SEQUEST® algorithm.
A three-protein-entry database was used consisting of the light chain, the heavy chain in two variants carrying either Ala or Val at position 219, and trypsin. Mass tolerances were set to 10 ppm for the precursor and 20 mmu for the fragment ions. Four variable modifications were considered: carbamid-omethylation (Cys), oxidation (Met), deamidation (N, Q), Gln to pyro-Glu conversion, and N,N-dimethylation (Lys) (relevant for identification of trypsin autolysis products only).
Results and DiscussionRituximab is an IgG1 class chimeric monoclonal antibody against the protein CD20, which consists of two light chains with 213 amino acids and two heavy chains with 451 amino acids each in length. The light and heavy chains are connected via 12 intrachain and 4 interchain disulfide linkages (Figure 1). The antibody is decorated with glycan structures attached to residue Asn301 of each of the two heavy chains. The composition and length of the attached glycans is quite diverse, resulting in a microheterogeneity of the molecule. The variety and relative abundance of the different glycostructures is essential for the efficiency of the antibody as a biological drug. The nomenclature of common glycans attached to antibodies are listed in Figure 2.
3Table 3. Mass spectrometric parameters used for all experiments
Figure 1. Schematic of molecular structure for the humanized IgG1 class monoclonal antibody rituximab
Intact Antibody Reduced Antibody Top Down AIF 5-plex MS/MS (Targeted MS2) Antibody Digest
Method type Full MS Full MS (2 segments) Full MS-AIF Targeted MS2 Full MS-dd top 10 HCD
Total run time 30 min 0–15.8/15.8–30 min 25 min 25 min 40 min
Scan range m/z 1800–5000 800–3500/700–2500 300–2500 Fixed first mass 300 350–2000
Resolution (full MS/MS2) 17,500/x 140,000/17,500 70,000 n.a./70,000 70,000/17,500
AGC Full MS 3.00 x 10⁶ 3.00 x 10⁶ 3.00 x 10⁶ 5.00 x 10⁵ 3.00 x 10⁶ (MS)/1.00 x 105(MS2)
Max inject time (Full MS/MS2) 150 ms 150 ms/200 ms 150 ms 150 ms 100 ms/100 ms
Isolation window n.a. n.a. n.a. 10 Th 2 Th
Microscans 10 5 5 5 1
Capillary temperature 275 °C 275 °C 275 °C 275 °C 275 °C
S-lens RF level 80 80 50 50 50
SID [eV] 80 0/60 n.a. LC 0/HC 20 n.a.
NCE [%] n.a. n.a. 10 to 30 10 to 30 25

4
The full MS spectrum obtained from 20 ng rituximab applied to a 25 cm x 0.2 mm i.d. monolithic column is displayed in Figure 3. The mass spectrum, acquired over m/z 1800–5000 shows the typical charge distribution observed for large proteins. The most abundant charge state (z=+45) at m/z 3269, represented in the zoomed in insert, nicely pictures the four most abundant glycoforms of the intact antibody.
The intact mass of these four most abundant glycoforms and a series of less abundant glycoforms is obtained after the deconvolution of the full MS mass spectrum shown in Figure 4. The assignment of the peaks was based on the calculation of the proteins sequence, taking into account the various anticipated glycan structures shown in Figure 2.
3260 3270 3280 3290m/z
0 10 20 30 40 50 60
70
80 90
100
Rela
tive
Abun
danc
e
3272.96 3276.58
3269.31 3280.12
3283.743266.23 3290.26
zoom
2500 3000 3500 4000 m/z
0 10 20 30 40 50 60 70 80 90
100
Rela
tive
Abun
danc
e
3272.96
3347.33 3137.16
3425.13 3068.50 3005.83 3506.59
3592.19 2945.77 3686.06 2888.16
3776.35 2832.49 3875.98 2776.10
3984.74 2632.99 4208.14 2303.96
Figure 3. Single scan full MS spectrum (10 μscans) of rituximab, acquired from 10 ng sample loaded on a 250 x 0.2 mm i.d. column. The insert shows a zoomed in view of the most abundant charge state (z=+45). The observed peak pattern in the insert represents the different glycoforms of the molecule.
Figure 2. Nomenclature of carbohydrate structures commonly observed on antibodies

5
Figure 4. Deconvoluted mass spectrum of rituximab with annotated glycoforms (top) and comparison of theoretical and measured masses for the five most abundant glycoforms (table)
Figure 5. Full MS spectra acquired from 1 ng intact rituximab, applying increasing settings of source CID (SID)
For the acquisition of the full MS spectrum of the intact antibody, the optimum setting of the source CID was evaluated (Figure 5). This setting was found to be crucial
in obtaining a high quality spectrum. The application of 25–90% source CID is beneficial for most proteins. For this sample the optimum setting was 80% SID.
146925.606146619.406 148010.563
162 Da 162 Da162 Da162 Da
162 Da162 Da
146619.406Man5/Man5
(G1F/G2F)SA1
(G1F/G2F)SA2
G1F/G2FSA2
G1F/G2FSA1
146541.406
146925.606
Man5/Man5(G2F/G2F)SA2
+2740.35+2673.54
+2513.07
(G2F/G2F)SA1
G0F/G0F G0F/G1F G0F/G2F or (G1F)2
G1F/G2F G2F/G2F
Measured 147,075.969 147,237.734 147,399.516 147,561.766 147,721.813
Theoretical 147,074.985 147,237.126 147,399.267 147,561.408 147,723.549
Δ ppm -6.7 -4.1 -1.7 -2.0 11.8
0 5 10 15 20 Time (min)
0 20 40 60
80
100
Rela
tive
Abun
danc
e
12.24
12.55 4.78 5.49 14.06 11.89 16.56 21.806.82 0.60
2000 2500 3000 3500 4000 4500 5000 m/z
0 20 40 60 80
100
Rela
tive
Abun
danc
e
3190.65 3309.78 2979.82
3567.96 3656.31 2714.43
1940.42
BPC SID 40%
SID 50% SID 60%
SID 70% SID 80%
3841.98 2304.46 3968.41
4224.07 4492.29
2000 2500 3000 3500 4000 4500 5000 m/z
0 20 40 60 80
100
Rela
tive
Abun
danc
e
2949.09 3145.74
2784.44 3285.71 2304.07
3526.92 4055.44
4543.99
2000 2500 3000 3500 4000 4500 5000 m/z
0 20 40 60 80
100
Rela
tive
Abun
danc
e
3009.29 2888.03
2779.08 3347.44 2678.07
3506.87 2457.72
3875.57 4497.14
2000 2500 3000 3500 4000 4500 5000 m/z
0 20 40 60 80
100
Rela
tive
Abun
danc
e
3133.74 2945.78
3347.37 2888.02 3506.68
3682.01 2730.67 3980.61
2496.66 4463.02
2000 2500 3000 3500 4000 4500 5000 m/z
0 20 40 60 80
100
Rela
tive
Abun
danc
e
3272.96 3068.44
3506.69 3005.83
3681.99 2832.48 3875.75
2587.05 4207.88

Elemental compositions C H N O S MW (monoisotopic)
MW (average)
Light chain (LC) full sequence aa 1-213 1016 1577 273 328 6 23,042.34369 23,056.5
N-terminal pyro Glutamic acid 1016 1574 272 328 6 23,025.31714 23,039.4
N-terminal pyro Glutamic acid, 2 intrachain S-S bonds 1016 1570 272 328 6 23,021.28584 23,035.4
2 x LC (N-term. pyroGlu) 2032 3148 544 656 12 46,050.63428 46,078.9
2 x LC (N-term. pyroGlu, 2 intrachain S-S bonds each) 2032 3140 544 656 12 46,042.57168 46,070.8
Heavy chain (HC) full sequence aa 1-451 2197 3389 577 676 16 49,183.40813 49,214.0
N-terminal pyro Glutamic acid 2197 3386 576 676 16 49,166.38158 49,197.0
minus C-term. K (aa 1-450) 2191 3374 574 675 16 49,038.28661 49,068.8
minus 4 intrachain S-S bonds 2191 3366 574 675 16 49,030.22401 49,060.8
HC-G0F (pyro-Glu, - K, fully reduced) 2247 3466 578 714 16 50,482.82048 50,514.2
HC-G1F (pyro-Glu, - K, fully reduced) 2253 3476 578 719 16 50,644.87330 50,676.3
HC-G2F (pyro-Glu, - K, fully reduced) 2259 3486 578 724 16 50,806.92613 50,838.5
HC minus 4 intrachain S-S bonds + G0F 2247 3458 578 714 16 50,474.75788 50,506.1
2 x HC (pyroGlu, - K) 4382 6748 1148 1350 32 98,076.57323 98,137.7
2 x HC (pyroGlu, - K, 4 intrachain S-S bonds each) 4382 6732 1148 1350 32 98,060.44803 98,121.6
Man5 (HexNAc)2 (Hex)5 46 76 2 35 0 1216.42286 1217.1
G0 (HexNAc)4 (Hex)3 50 82 4 35 0 1298.47596 1299.2
G0F (HexNAc)4 (Hex)3 Fuc 56 92 4 39 0 1444.53387 1445.3
G1 (HexNAc)4 (Hex)4 56 92 4 40 0 1460.52878 1461.3
G1F (HexNAc)4 (Hex)4 Fuc 62 102 4 44 0 1606.58669 1607.5
G2 (HexNAc)4 (Hex)5 62 102 4 45 0 1622.58161 1623.5
G2F (HexNAc)4 (Hex)5 Fuc 68 112 4 49 0 1768.63951 1769.6
G1FSA (HexNAc)4 (Hex)4 Fuc SA 73 119 5 52 0 1897.68211 1898.7
G1FSA2 (HexNAc)4 (Hex)4 Fuc (SA)2 84 136 6 60 0 2188.77752 2190.0
G2FSA (HexNAc)4 (Hex)5 Fuc SA 79 129 5 57 0 2059.73493 2060.9
G2FSA2 (HexNAc)4 (Hex)5 Fuc (SA)2 90 146 6 65 0 2350.83035 2352.1
Man5/Man5 (HexNAc)4 (Hex)10 92 152 4 70 0 2432.84572 2434.2
G0F/G0F (HexNAc)8 (Hex)6 (Fuc)2 112 184 8 78 0 2889.06774 2890.7
G0F/G1F (HexNAc)8 (Hex)7 (Fuc)2 118 194 8 83 0 3051.12056 3052.8
G1F/G1F (HexNAc)8 (Hex)8 (Fuc)2 124 204 8 88 0 3213.17338 3215.0
G1F/G2F (HexNAc)8 (Hex)9 (Fuc)2 130 214 8 93 0 3375.22621 3377.1
G2F/G2F (HexNAc)8 (Hex)10 (Fuc)2 136 224 8 98 0 3537.27903 3539.2
G1F/G2FSA (HexNAc)8 (Hex)9 (Fuc)2 SA 141 231 9 101 0 3666.32162 3668.3
6 The calculation of the masses for the light chain, unglycosylated heavy chain, and intact fully assembled antibody is presented in Table 4, showing the step-by-step calculation starting with the 213 respectively 451 amino acids of the light and heavy chain. Both protein sequences contain an N-terminal glutamine, which is anticipated to be modified to a pyro-glutamic acid, resulting in a deduction of mass of 17.0265 Da. Moreover, the C-terminal lysine present in the heavy chain is likely to be cleaved off, reducing the molecular weight by another
128.09497 Da. For assembling the intact antibody, a total of 16 disulfide linkages is considered by abstracting 32 protons. The glycan structures on each of the two heavy chains will add between 1217.1 and 2352.1 Da in mass. It has to be considered that the two chains can carry different glycans, resulting in a mixed composition, e.g. G01/G2F. Chemical composition and masses of individual carbohydrates are listed in Table 5. The monoisotopic and average atomic masses of the elements used to calculate molecular weights in Tables 4 and 5 are listed in Table 6.
Table 4. Chemical composition and step-by-step calculation of monoisotopic and average mass for the light and heavy chain, including their modifications as well as the intact antibody rituximab with various glycoforms. Detected masses shown in Figures 4, 6, and 7 are presented in the blue cells.

7
The initial calculation based on the sequence published in the DrugBank database2 resulted in a mass that did not match the masses obtained in our experiments. Comparison of the DrugBank sequence with a previously published sequence3 revealed a difference in one amino acid at position 219, located in the conserved region of the heavy chain, Ala versus Val. The sequence containing the Ala at position 219 did match well with the results obtained from intact mass measurements as well as with previously reported results.4 To further verify this, a series of additional experiments was performed.
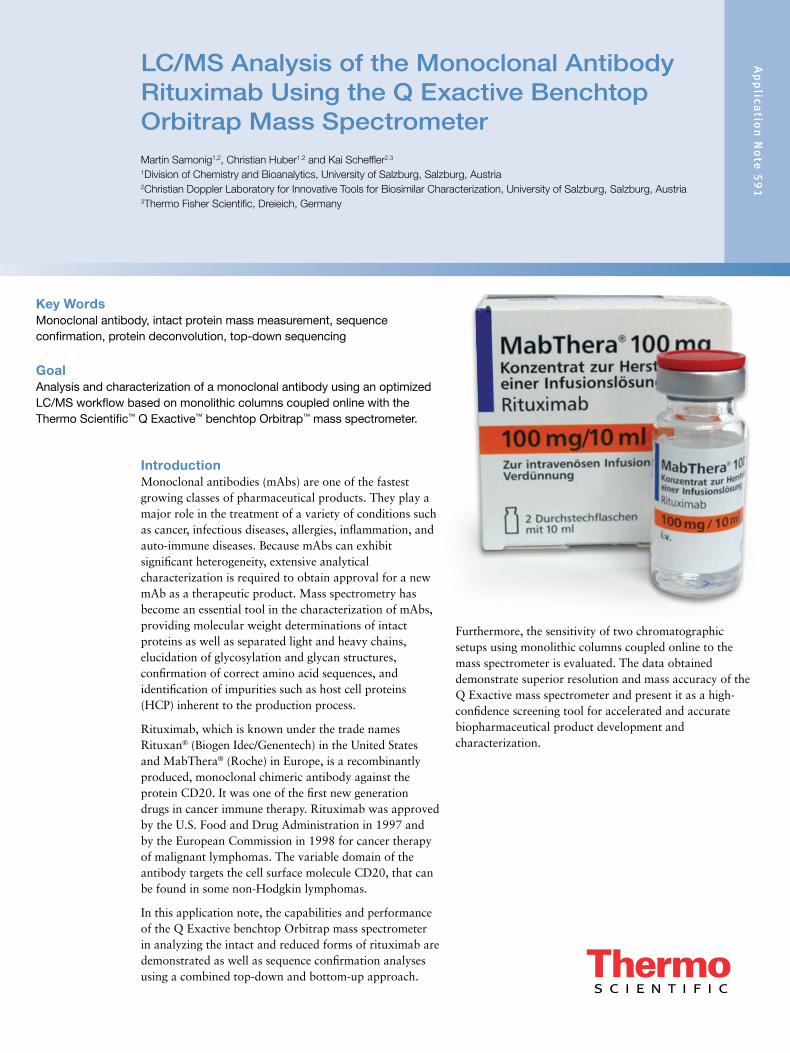
After reducing the antibody (without alkylation), the analysis of separated light and heavy chain was performed applying different resolution settings to account for whether or not isotopic resolution can be achieved based on molecular weight. Due to the smaller molecular weight of the light chain, it is possible to obtain an isotopically resolved spectrum, whereas for the heavy chain this is not possible since it is about twice as large as the light chain.
To apply different resolution settings, the method was set up in two segments (140k resolution for the scans acquired from 0 to 15.8 min, and 17.5k resolution from 15.8 to 30 min) and the gradient was optimized to achieve well-separated peaks of the light and heavy chain.
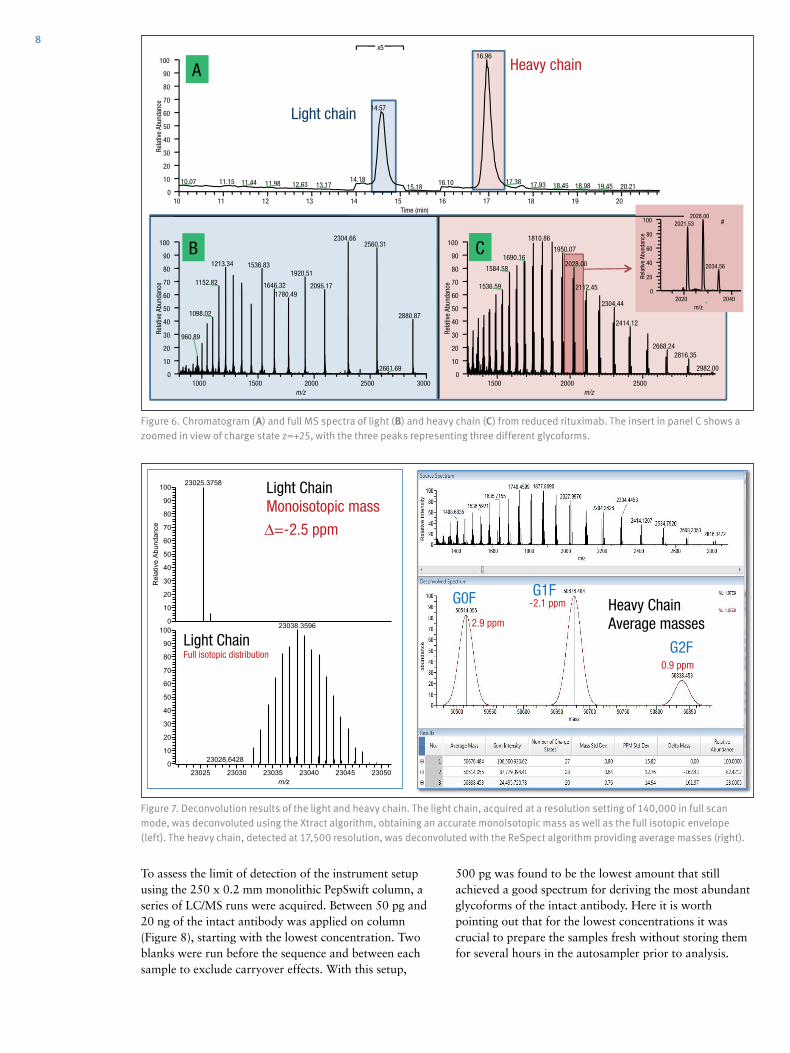
On both monolithic columns evaluated in this study (PepSwift 250 mm x 0.2 mm i.d. and ProSwift RP-10R 50 mm x 0.1 mm i.d.), the separation of the two peaks by more than 2 min was equally possible (Figure 6). The mass spectra obtained from the light chain and from the heavy chain (Figures 6b and 6c) were submitted for deconvolution. The isotopically resolved light chain spectrum was deconvoluted using the Xtract algorithm, resulting in a monoisotopic molecular weight of 23,025.3758 Da, which matches the calculated mass by 2.5 ppm. The heavy chain was deconvoluted using the ReSpect algorithm, resulting in three peaks, each of which represents one of the major glycoforms, G0F, G1F, and G2F (Figure 7).
Table 5. Chemical composition and masses of monosaccharides
Table 6. Monoisotopic and average atomic masses of the elements used to calculate the molecular masses in Tables 4 and 5
Elemental compositions C H N O S MW (monoisotopic)
MW (average)
G1F/G2FSA2 (HexNAc)8 (Hex)9 (Fuc)2 (SA)2 152 248 10 109 0 3957.41704 3959.6
G2F/G2FSA (HexNAc)8 (Hex)10 (Fuc)2 SA 147 241 9 106 0 3828.37445 3830.5
G2F/G2FSA2 (HexNAc)8 (Hex)10 (Fuc)2 (SA)2 158 258 10 114 0 4119.46986 4121.7
Sum 2 x HC +2 x LC (4 x pyroGlu, -2K) 6414 9896 1692 2006 44 144,127.20750 144,216.6
minus 32 S-S bond protons 6414 9864 1692 2006 44 144,094.95710 144,184.3
2HC + 2LC - 16 S-S bonds + (Man5)2 6506 10016 1696 2076 44 146,527.80282 146,618.5
2HC + 2LC - 16 S-S bonds + (G0F)2 6526 10048 1700 2084 44 146,984.02484 147,075.0
2HC + 2LC - 16 S-S bonds + G0F/G1F 6532 10058 1700 2089 44 147,146.07766 147,237.1
2HC + 2LC - 16 S-S bonds + G0F/G2F or (G1F)2 6538 10068 1700 2094 44 147,308.13049 147,399.3
2HC + 2LC - 16 S-S bonds + G1F/G2F 6544 10078 1700 2099 44 147,470.18331 147,561.4
2HC + 2LC - 16 S-S bonds + G2F/G2F 6550 10088 1700 2104 44 147,632.23613 147,723.5
2HC + 2LC - 16 S-S bonds + G1F/G2F SA 6555 10095 1701 2107 44 147,761.27872 147,852.7
2HC + 2LC - 16 S-S bonds + G1F/G2F (SA)2 6566 10112 1702 2115 44 148,052.37414 148,143.9
2HC + 2LC - 16 S-S bonds + G2F/G2F SA 6561 10105 1701 2112 44 147,923.33155 148,014.8
2HC + 2LC - 16 S-S bonds + G2F/G2F (SA)2 6572 10122 1702 2120 44 148,214.42696 148,306.1
Sum Formula
Monoisotopic Mass
Average Mass C O N H
Sialic Acid C11
O8NH
17291.09542 291.3 11 8 1 17
Galactose C6O
5H
10162.05282 162.1 6 5 0 10
N-Acetylglucosamine C8O
5NH
13203.07937 203.2 8 5 1 13
Mannose C6O
5H
10162.05282 162.1 6 5 0 10
Fucose C6O
4H
10146.05791 146.1 6 4 0 10
Monoisotopic Mass Average Mass
C 12.0000000 12.01074
H 1.00782503 1.00794
N 14.0030740 14.00674
O 15.9949146 15.99940
S 31.9720707 32.06608
8
To assess the limit of detection of the instrument setup using the 250 x 0.2 mm monolithic PepSwift column, a series of LC/MS runs were acquired. Between 50 pg and 20 ng of the intact antibody was applied on column (Figure 8), starting with the lowest concentration. Two blanks were run before the sequence and between each sample to exclude carryover effects. With this setup,
500 pg was found to be the lowest amount that still achieved a good spectrum for deriving the most abundant glycoforms of the intact antibody. Here it is worth pointing out that for the lowest concentrations it was crucial to prepare the samples fresh without storing them for several hours in the autosampler prior to analysis.
Light chain
Heavy chain A
B C
2020 2040 m/z
0 20 40 60 80
100
Rela
tive
Abun
danc
e
2028.00 2021.53
2034.56
10 11 12 13 14 15 16 17 18 19 20 Time (min)
0 10 20 30 40
50 60 70 80 90
100
Rela
tive
Abun
danc
e
16.96
14.57
11.1510.07 17.38 16.1011.44 11.98 12.63 17.93 13.17 18.45 18.98 19.45 14.18 20.21 15.18
x5
1000 1500 2000 2500 3000 m/z
0 10 20 30 40 50 60 70 80 90
100
Rela
tive
Abun
danc
e
2304.66 2560.31
1213.34 1536.83 1920.51
1152.82 1646.32 2095.17
1098.02 2880.87 960.89
1780.49
2661.69
#
1500 2000 2500 m/z
0 10 20 30 40 50 60 70 80 90
100
Rela
tive
Abun
danc
e
1810.86 1950.07
1690.16 2028.00
1584.58 1536.59 2112.45
2304.44 2414.12
2668.242816.35
2982.00
23025 23030 23035 23040 23045 23050m/z
0
10
20
30
40
50
60
70
80
90
1000
10
20
30
40
50
60
70
80
90
100
Rel
ativ
e A
bund
ance
23025.3758
23038.3596
23028.6428
Light ChainMonoisotopic mass
Heavy ChainAverage masses
Light ChainFull isotopic distribution
2.9 ppm
-2.1 ppm
0.9 ppm
G0F G1F
G2F
Figure 6. Chromatogram (A) and full MS spectra of light (B) and heavy chain (C) from reduced rituximab. The insert in panel C shows a zoomed in view of charge state z=+25, with the three peaks representing three different glycoforms.
Figure 7. Deconvolution results of the light and heavy chain. The light chain, acquired at a resolution setting of 140,000 in full scan mode, was deconvoluted using the Xtract algorithm, obtaining an accurate monoisotopic mass as well as the full isotopic envelope (left). The heavy chain, detected at 17,500 resolution, was deconvoluted with the ReSpect algorithm providing average masses (right).

9
On the 50 mm x 1 mm i.d. monolithic ProSwift column, 30 ng and 150 ng of intact antibody were applied, both of which produced high quality spectra (Figure 9). Based on
the 30 ng load it can be estimated that the lowest amount still yielding a sufficient spectrum quality to be between 5 and 10 ng.
0
50
1000
50
1000
50
1000
50
1000
50
100 3272.94
3280.13
3283.75
3272.95
3280.113283.61
3272.94
3280.143284.03
3273.003276.65
3280.293291.49
3273.063276.72
3280.25
3275.62
20 ng
10 ng
5 ng
1 ng
500 pg
0 50
100 0 50
100
Rela
tive
Abun
danc
e 0 50
100 0
50 100 0
50 100 3272.94
3068.43 3506.66 2945.76
3681.95 2832.52 3980.46 2584.24 4212.43
3272.95 3133.71 3005.84 3506.64
3681.92 2888.06 2678.09 3980.44 4207.82
3201.85 3071.84 3425.13
3592.17 2888.01 3776.34 2730.65
4091.07 4331.69 3273.00
3133.89 3351.03 2949.06 3592.17 2414.86 3776.38 4091.22
3273.06 2815.40
3425.28 2413.08 3682.10
2776.75 3780.70
4095.23 4339.08 2967.21
3200 m/z
0 10 20 30 40 50 60 70 80 90
100 0 10 20 30 40 50 60 70 80 90
100
Rela
tive
Abun
danc
e
3201.80 3205.31
3198.28
3208.84
3212.38
3201.80
3205.31
3198.28
3208.84
3212.38
2000 3000 4000 5000 m/z
0 10 20 30 40 50 60 70 80 90
100 0 10 20 30 40 50 60 70 80 90
100
Rela
tive
Abun
danc
e
4750.60
4607.37
zoom
zoom
150 ng
30 ng
Figure 8. Full MS spectra from a dilution series of 20 ng to 500 pg of intact antibody, applied on a 250 mm x 0.2 mm i.d. monolithic PepSwift column
Figure 9. Full MS spectra (left) and zoomed in view of the highest abundant charge state (right) of 150 ng and 30 ng loads of intact rituximab applied on a 50 mm x 1 mm i.d. monolithic ProSwift column

10 In an attempt to further confirm the sequences of the light and heavy chains, two types of top-down experiments were performed: all-ion fragmentation (AIF) with fragmentation upon collision in the HCD cell and a multiplexed (5-plex), targeted MS2 experiment on five selected charge states each of the light and heavy chains. All spectra were acquired at 70,000 resolution. For the targeted MS spectrum, a retention-time-dependent mass list was used, targeting first the earlier eluting light chain (RT 13.16 min: m/z 1536.96, 1646.6, 1773.3, 1920.7, 2095.4) and later the heavy chain (RT 16–20 min: m/z 1584.6, 1635.7, 1684.7, 1748.5, 1810.9). In this type of experiment, the first charge state listed on the inclusion list is selected and sent to the HCD cell for fragmentation. The product ions are stored in the HCD cell while the second charge state is isolated, sent to the HCD cell, fragmented, and stored in the cell until the fifth charge state has also been fragmented. All ions from the five individual isolation and fragmentation steps are sent together to the Orbitrap analyzer, resulting in one single fragment ion spectrum.
The fragment ion assignment for the light chain is displayed in Figure 10. There is good coverage of both the N- and C-terminal ends as well as some fragments in the center of the sequence, resulting in 28% coverage, respectively 15% of the theoretical fragments. For the heavy chain, fragmentation was less efficient with both methods and resulted in about 20 fragments, most of which represent the sequence termini.
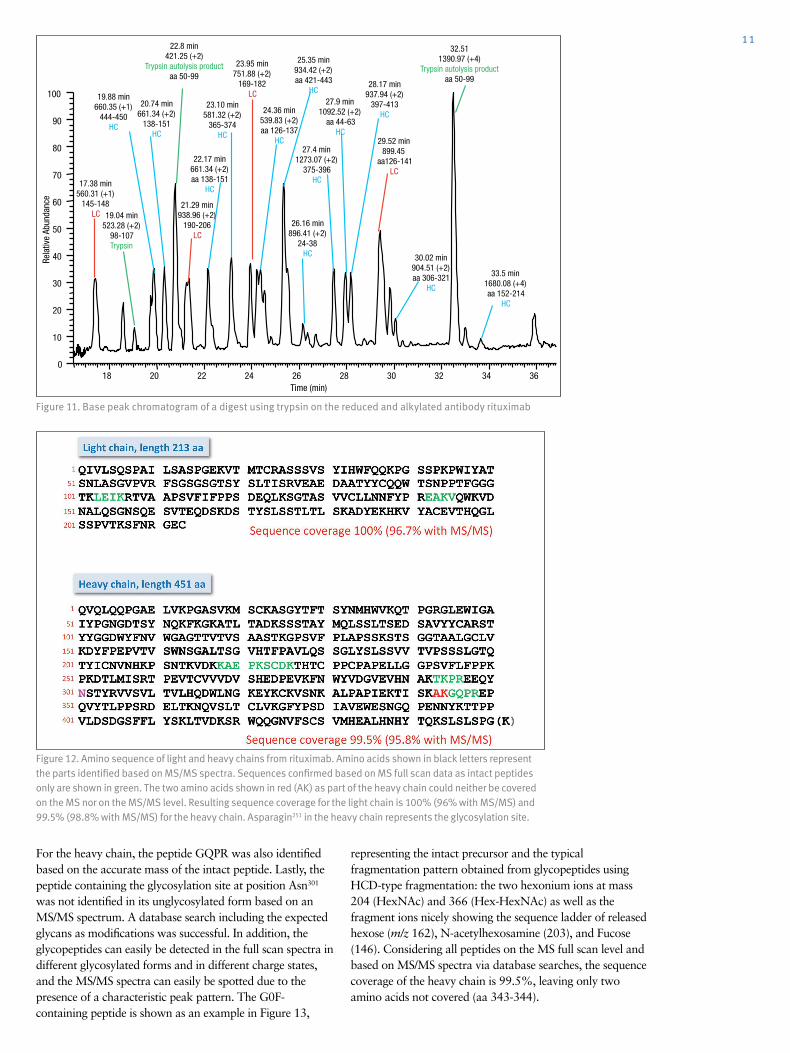
To further confirm the sequences, a bottom-up approach was performed using a digest with trypsin following reduction and alkylation of the antibody. The chrom-atogram obtained from the digest is displayed in Figure 11. A database search against a four-entry database containing the light chain, both variants of the heavy chain, and trypsin revealed a sequence coverage of the light chain of 96% and for the heavy chain of 78.8% (Figure 12). The two short missing peptides from the light chain (LEIK and EAK) could be detected as intact masses only in the full MS spectra, whereas the peptide EAK was identified based on the accurate mass corresponding to the peptide containing a missed cleavage EAKVQWK. Taking into account the peptides identified based on MS/MS spectra and based on accurate masses of the small intact peptides, sequence coverage for the light chain is 100%.
Figure 10. Matched sequence coverage of the rituximab light chain based on fragment ions obtained from AIF experiments. Seventeen b- and 50 y-ions were assigned, corresponding to 15.7% of the theoretical number of fragments (67 of 426).
11
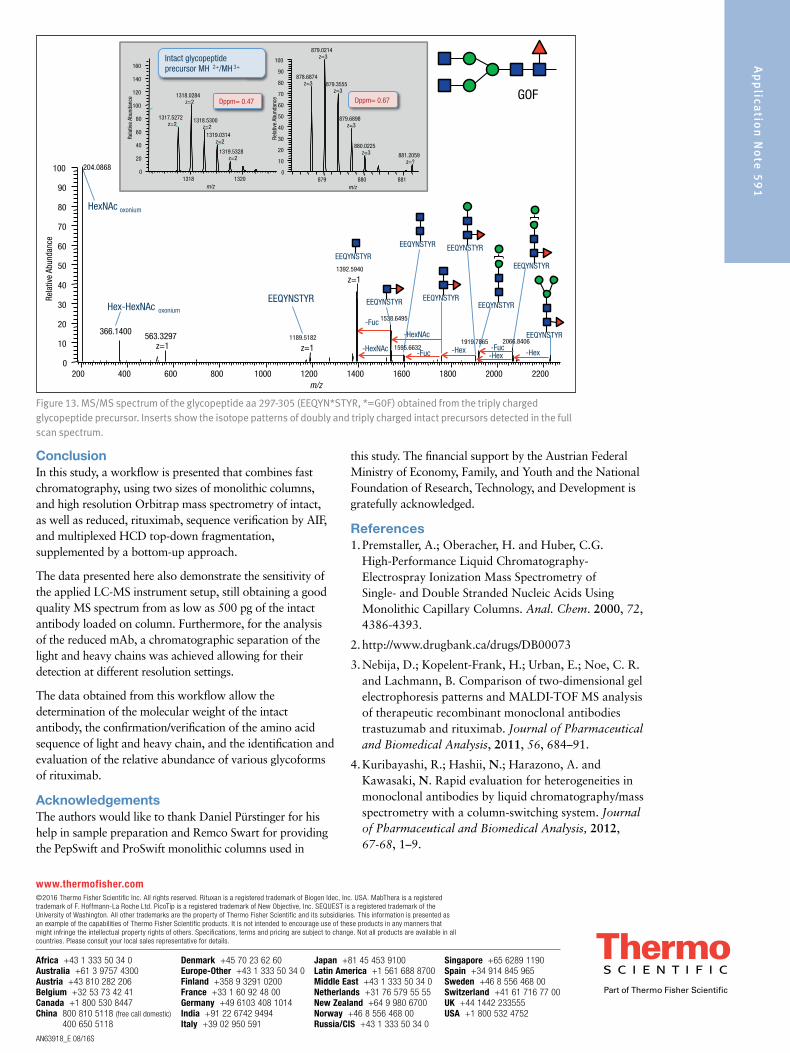
For the heavy chain, the peptide GQPR was also identified based on the accurate mass of the intact peptide. Lastly, the peptide containing the glycosylation site at position Asn301 was not identified in its unglycosylated form based on an MS/MS spectrum. A database search including the expected glycans as modifications was successful. In addition, the glycopeptides can easily be detected in the full scan spectra in different glycosylated forms and in different charge states, and the MS/MS spectra can easily be spotted due to the presence of a characteristic peak pattern. The G0F-containing peptide is shown as an example in Figure 13,
representing the intact precursor and the typical fragmentation pattern obtained from glycopeptides using HCD-type fragmentation: the two hexonium ions at mass 204 (HexNAc) and 366 (Hex-HexNAc) as well as the fragment ions nicely showing the sequence ladder of released hexose (m/z 162), N-acetylhexosamine (203), and Fucose (146). Considering all peptides on the MS full scan level and based on MS/MS spectra via database searches, the sequence coverage of the heavy chain is 99.5%, leaving only two amino acids not covered (aa 343-344).
18 20 22 24 26 28 30 32 34 36 Time (min)
0
10
20
30
40
50
60
70
80
90
100
Rela
tive
Abun
danc
e
20.74 min 661.34 (+2)
138-151 HC
19.88 min 660.35 (+1)
444-450 HC
17.38 min 560.31 (+1)
145-148 LC
23.10 min 581.32 (+2)
365-374 HC
23.95 min 751.88 (+2)
169-182 LC
28.17 min 937.94 (+2)
397-413 HC
29.52 min 899.45
aa126-141 LC
32.51 1390.97 (+4)
Trypsin autolysis product aa 50-99
22.8 min 421.25 (+2)
Trypsin autolysis product aa 50-99
33.5 min 1680.08 (+4) aa 152-214
HC
30.02 min 904.51 (+2) aa 306-321
HC
27.9 min 1092.52 (+2)
aa 44-63 HC
25.35 min 934.42 (+2) aa 421-443
HC
27.4 min 1273.07 (+2)
375-396 HC
26.16 min 896.41 (+2)
24-38 HC
24.36 min 539.83 (+2) aa 126-137
HC
22.17 min 661.34 (+2) aa 138-151
HC
21.29 min 938.96 (+2)
190-206 LC
19.04 min 523.28 (+2)
98-107 Trypsin
Figure 11. Base peak chromatogram of a digest using trypsin on the reduced and alkylated antibody rituximab
Figure 12. Amino sequence of light and heavy chains from rituximab. Amino acids shown in black letters represent the parts identified based on MS/MS spectra. Sequences confirmed based on MS full scan data as intact peptides only are shown in green. The two amino acids shown in red (AK) as part of the heavy chain could neither be covered on the MS nor on the MS/MS level. Resulting sequence coverage for the light chain is 100% (96% with MS/MS) and 99.5% (98.8% with MS/MS) for the heavy chain. Asparagin251 in the heavy chain represents the glycosylation site.
AN63918_E 08/16S
Africa +43 1 333 50 34 0Australia +61 3 9757 4300Austria +43 810 282 206Belgium +32 53 73 42 41Canada +1 800 530 8447China 800 810 5118 (free call domestic)
400 650 5118
Denmark +45 70 23 62 60Europe-Other +43 1 333 50 34 0Finland +358 9 3291 0200France +33 1 60 92 48 00Germany +49 6103 408 1014India +91 22 6742 9494Italy +39 02 950 591
Japan +81 45 453 9100Latin America +1 561 688 8700Middle East +43 1 333 50 34 0Netherlands +31 76 579 55 55New Zealand +64 9 980 6700Norway +46 8 556 468 00Russia/CIS +43 1 333 50 34 0
Singapore +65 6289 1190Spain +34 914 845 965Sweden +46 8 556 468 00Switzerland +41 61 716 77 00UK +44 1442 233555USA +1 800 532 4752
www.thermofisher.com©2016 Thermo Fisher Scientific Inc. All rights reserved. Rituxan is a registered trademark of Biogen Idec, Inc. USA. MabThera is a registered trademark of F. Hoffmann-La Roche Ltd. PicoTip is a registered trademark of New Objective, Inc. SEQUEST is a registered trademark of the University of Washington. All other trademarks are the property of Thermo Fisher Scientific and its subsidiaries. This information is presented as an example of the capabilities of Thermo Fisher Scientific products. It is not intended to encourage use of these products in any manners that might infringe the intellectual property rights of others. Specifications, terms and pricing are subject to change. Not all products are available in all countries. Please consult your local sales representative for details.
Ap
plica
tion
No
te 5
91
ConclusionIn this study, a workflow is presented that combines fast chromatography, using two sizes of monolithic columns, and high resolution Orbitrap mass spectrometry of intact, as well as reduced, rituximab, sequence verification by AIF, and multiplexed HCD top-down fragmentation, supplemented by a bottom-up approach.
The data presented here also demonstrate the sensitivity of the applied LC-MS instrument setup, still obtaining a good quality MS spectrum from as low as 500 pg of the intact antibody loaded on column. Furthermore, for the analysis of the reduced mAb, a chromatographic separation of the light and heavy chains was achieved allowing for their detection at different resolution settings.
The data obtained from this workflow allow the determination of the molecular weight of the intact antibody, the confirmation/verification of the amino acid sequence of light and heavy chain, and the identification and evaluation of the relative abundance of various glycoforms of rituximab.
AcknowledgementsThe authors would like to thank Daniel Pürstinger for his help in sample preparation and Remco Swart for providing the PepSwift and ProSwift monolithic columns used in
this study. The financial support by the Austrian Federal Ministry of Economy, Family, and Youth and the National Foundation of Research, Technology, and Development is gratefully acknowledged.
References1. Premstaller, A.; Oberacher, H. and Huber, C.G.
High-Performance Liquid Chromatography-Electrospray Ionization Mass Spectrometry of Single- and Double Stranded Nucleic Acids Using Monolithic Capillary Columns. Anal. Chem. 2000, 72, 4386-4393.
2. http://www.drugbank.ca/drugs/DB00073
3. Nebija, D.; Kopelent-Frank, H.; Urban, E.; Noe, C. R. and Lachmann, B. Comparison of two-dimensional gel electrophoresis patterns and MALDI-TOF MS analysis of therapeutic recombinant monoclonal antibodies trastuzumab and rituximab. Journal of Pharmaceutical and Biomedical Analysis, 2011, 56, 684–91.
4. Kuribayashi, R.; Hashii, N.; Harazono, A. and Kawasaki, N. Rapid evaluation for heterogeneities in monoclonal antibodies by liquid chromatography/mass spectrometry with a column-switching system. Journal of Pharmaceutical and Biomedical Analysis, 2012, 67-68, 1–9.
-Hex-Hex
-HexNAc
-Fuc
-Hex
HexNAc oxonium
Hex-HexNAc oxonium
EEQYNSTYR
EEQYNSTYR
-Fuc-HexNAc
1318 1320m/z
0
20
40
60
80
100
120
140
160
Rela
tive
Abun
danc
e 1318.0284z=2
1317.5272z=2
1318.5300z=2
1319.0314z=2
1319.5328z=2
879 880 881m/z
0
10
20
30
40
50
60
70
80
90
100
Rela
tive
Abun
danc
e
879.0214z=3
878.6874z=3 879.3555
z=3
879.6898z=3
880.0225z=3 881.2059
z=?
Intact glycopeptide precursor MH 2+/MH 3+
Dppm= 0.47 Dppm= 0.67
200 400 600 800 1000 1200 1400 1600 1800 2000 2200m/z
0
10
20
30
40
50
60
70
80
90
100
Rela
tive
Abun
danc
e
1392.5940
z=1
1538.6495
366.14002066.8406
563.3297z=1 1919.7865
1189.5182
z=1 1595.6632-Fuc
204.0868
GOF
EEQYNSTYR
EEQYNSTYR
EEQYNSTYR
EEQYNSTYR
EEQYNSTYR
EEQYNSTYR
EEQYNSTYR
Figure 13. MS/MS spectrum of the glycopeptide aa 297-305 (EEQYN*STYR, *=G0F) obtained from the triply charged glycopeptide precursor. Inserts show the isotope patterns of doubly and triply charged intact precursors detected in the full scan spectrum.