lavaan.survey: an r package for complex survey analysis of structural equation models
TRANSCRIPT
Complex sample surveys Using lavaan.survey Example lavaan.survey analysis Conclusions
lavaan.survey: An R package for complexsurvey analysis of structural equation models
Daniel Oberski
Department of methodology and statistics
lavaan.survey [email protected]
Complex sample surveys Using lavaan.survey Example lavaan.survey analysis Conclusions
lavaan.survey [email protected]
Complex sample surveys Using lavaan.survey Example lavaan.survey analysis Conclusions
What is "complex" about a sample survey?
lavaan.survey [email protected]

Complex sample surveys Using lavaan.survey Example lavaan.survey analysis Conclusions
1. Clustering
3. Weighting
2. Stratification
lavaan.survey [email protected]
Complex sample surveys Using lavaan.survey Example lavaan.survey analysis Conclusions
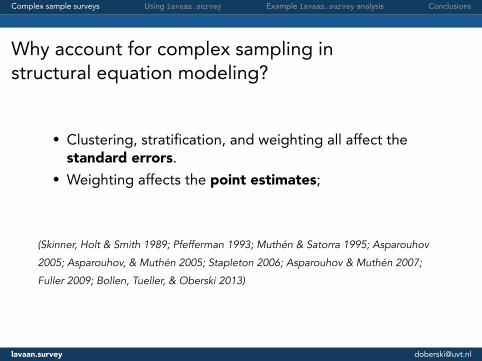
Why account for complex sampling instructural equation modeling?
• Clustering, stratification, and weighting all affect thestandard errors.
• Weighting affects the point estimates;
(Skinner, Holt & Smith 1989; Pfefferman 1993; Muthén & Satorra 1995; Asparouhov
2005; Asparouhov, & Muthén 2005; Stapleton 2006; Asparouhov & Muthén 2007;
Fuller 2009; Bollen, Tueller, & Oberski 2013)
lavaan.survey [email protected]

Complex sample surveys Using lavaan.survey Example lavaan.survey analysis Conclusions
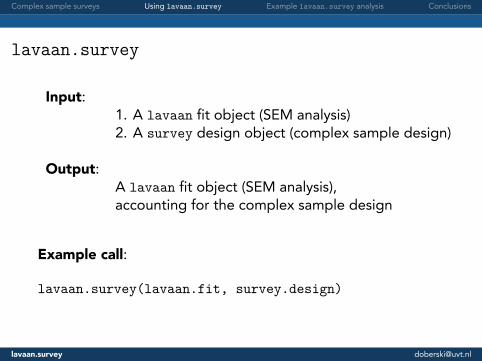
lavaan.survey
Input:1. A lavaan fit object (SEM analysis)2. A survey design object (complex sample design)
Output:A lavaan fit object (SEM analysis),accounting for the complex sample design
Example call:
lavaan.survey(lavaan.fit, survey.design)
lavaan.survey [email protected]
Complex sample surveys Using lavaan.survey Example lavaan.survey analysis Conclusions
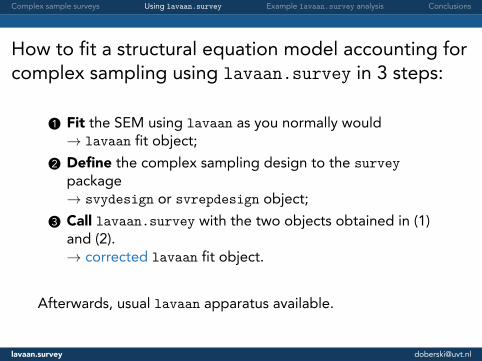
How to fit a structural equation model accounting forcomplex sampling using lavaan.survey in 3 steps:
..1 Fit the SEM using lavaan as you normally would→ lavaan fit object;
..2 Define the complex sampling design to the surveypackage→ svydesign or svrepdesign object;
..3 Call lavaan.survey with the two objects obtained in (1)and (2).→ corrected lavaan fit object.
Afterwards, usual lavaan apparatus available.
lavaan.survey [email protected]
Complex sample surveys Using lavaan.survey Example lavaan.survey analysis Conclusions
Example complex sample SEM analysis from the literature
Ferla, Valcke & Cai (2009). Academic self-efficacy and academicself-concept: Reconsidering structural relationships. Learning andIndividual Differences, 19 (4).
lavaan.survey [email protected]

Complex sample surveys Using lavaan.survey Example lavaan.survey analysis Conclusions
Structural equation model of Belgian PISA data
lavaan.survey [email protected]
Complex sample surveys Using lavaan.survey Example lavaan.survey analysis Conclusions
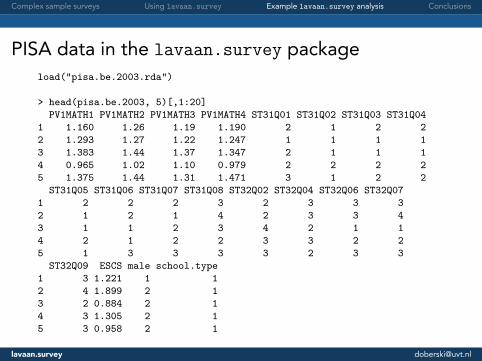
PISA data in the lavaan.survey packageload("pisa.be.2003.rda")
> head(pisa.be.2003, 5)[,1:20]PV1MATH1 PV1MATH2 PV1MATH3 PV1MATH4 ST31Q01 ST31Q02 ST31Q03 ST31Q04
1 1.160 1.26 1.19 1.190 2 1 2 22 1.293 1.27 1.22 1.247 1 1 1 13 1.383 1.44 1.37 1.347 2 1 1 14 0.965 1.02 1.10 0.979 2 2 2 25 1.375 1.44 1.31 1.471 3 1 2 2
ST31Q05 ST31Q06 ST31Q07 ST31Q08 ST32Q02 ST32Q04 ST32Q06 ST32Q071 2 2 2 3 2 3 3 32 1 2 1 4 2 3 3 43 1 1 2 3 4 2 1 14 2 1 2 2 3 3 2 25 1 3 3 3 3 2 3 3
ST32Q09 ESCS male school.type1 3 1.221 1 12 4 1.899 2 13 2 0.884 2 14 3 1.305 2 15 3 0.958 2 1
lavaan.survey [email protected]
Complex sample surveys Using lavaan.survey Example lavaan.survey analysis Conclusions
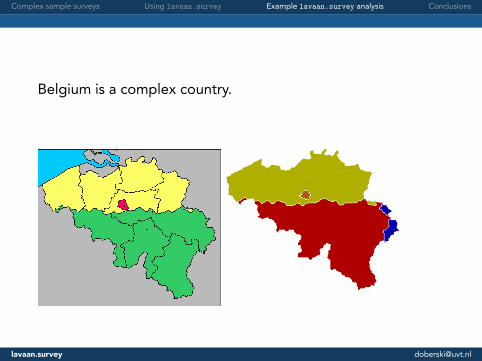
Belgium is a complex country.
lavaan.survey [email protected]
Complex sample surveys Using lavaan.survey Example lavaan.survey analysis Conclusions
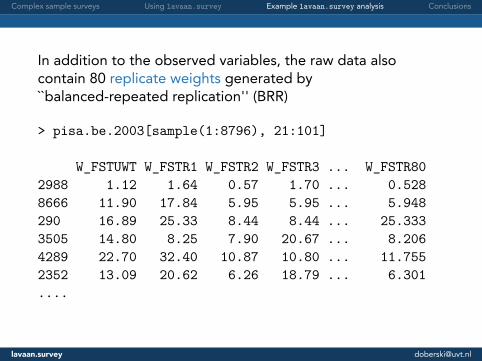
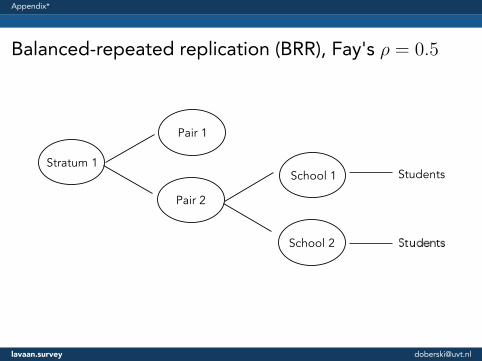
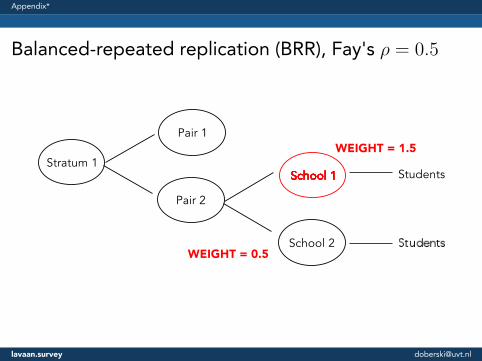
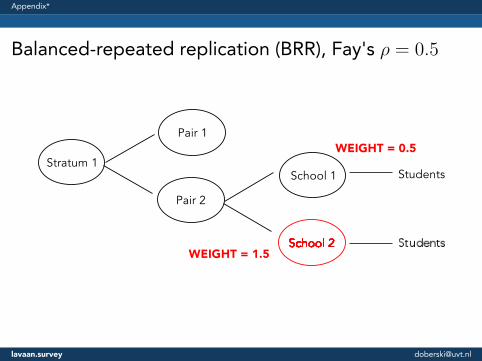
In addition to the observed variables, the raw data alsocontain 80 replicate weights generated by``balanced-repeated replication'' (BRR)
> pisa.be.2003[sample(1:8796), 21:101]
W_FSTUWT W_FSTR1 W_FSTR2 W_FSTR3 ... W_FSTR802988 1.12 1.64 0.57 1.70 ... 0.5288666 11.90 17.84 5.95 5.95 ... 5.948290 16.89 25.33 8.44 8.44 ... 25.3333505 14.80 8.25 7.90 20.67 ... 8.2064289 22.70 32.40 10.87 10.80 ... 11.7552352 13.09 20.62 6.26 18.79 ... 6.301....
lavaan.survey [email protected]
Complex sample surveys Using lavaan.survey Example lavaan.survey analysis Conclusions
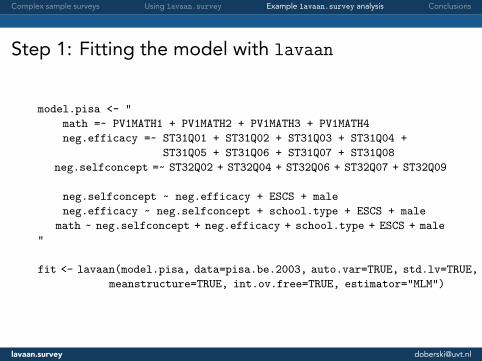
Step 1: Fitting the model with lavaan
model.pisa <- "math =~ PV1MATH1 + PV1MATH2 + PV1MATH3 + PV1MATH4neg.efficacy =~ ST31Q01 + ST31Q02 + ST31Q03 + ST31Q04 +
ST31Q05 + ST31Q06 + ST31Q07 + ST31Q08neg.selfconcept =~ ST32Q02 + ST32Q04 + ST32Q06 + ST32Q07 + ST32Q09
neg.selfconcept ~ neg.efficacy + ESCS + maleneg.efficacy ~ neg.selfconcept + school.type + ESCS + male
math ~ neg.selfconcept + neg.efficacy + school.type + ESCS + male"
fit <- lavaan(model.pisa, data=pisa.be.2003, auto.var=TRUE, std.lv=TRUE,meanstructure=TRUE, int.ov.free=TRUE, estimator="MLM")
lavaan.survey [email protected]

Complex sample surveys Using lavaan.survey Example lavaan.survey analysis Conclusions
Step 2: Letting survey knowabout the replicate weight design
des.rep <- svrepdesign(ids=~1, weights=~W_FSTUWT,data=pisa.be.2003,repweights="W_FSTR[0-9]+",type="Fay", rho=0.5)
More information on defining complex sampling objects:
Lumley (2004). Complex Surveys: A Guide to Analysis using R. NewYork: Wiley.Thomas Lumley's website with tutorials:http://r-survey.r-forge.r-project.org/survey/index.html
lavaan.survey [email protected]

Complex sample surveys Using lavaan.survey Example lavaan.survey analysis Conclusions
Complex survey SEM
fit.surv <-lavaan.survey(lavaan.fit=fit, survey.design=des.rep)
lavaan.survey [email protected]

Complex sample surveys Using lavaan.survey Example lavaan.survey analysis Conclusions
Point and standard error estimates using robust ML with andwithout correction for the sampling design using BRR replicateweights.
Estimate s.e.Naive PML Naive PML creff
neg.selfconcept ∼ neg.efficacy -0.021 -0.050 0.032 0.046 1.415neg.efficacy ∼ neg.selfconcept 0.568 0.609 0.046 0.065 1.421neg.efficacy ∼ school.type 0.530 0.518 0.022 0.022 1.009math ∼ neg.selfconcept -0.179 -0.177 0.015 0.021 1.362math ∼ neg.efficacy -0.239 -0.237 0.015 0.018 1.216math ∼ school.type -0.606 -0.596 0.019 0.035 1.858
lavaan.survey [email protected]
Complex sample surveys Using lavaan.survey Example lavaan.survey analysis Conclusions
Conclusions
lavaan.survey [email protected]
Complex sample surveys Using lavaan.survey Example lavaan.survey analysis Conclusions
Conclusions
• When there are clusters, strata, and/or weights, youshould usually adjust the SEM analysis for them;
• Especially important for correct standard errors andmodel fit statistics.
• lavaan.survey leverages the power of the lavaan andsurvey packages to let you do this.
• Future: categorical data.
lavaan.survey [email protected]
Complex sample surveys Using lavaan.survey Example lavaan.survey analysis Conclusions
http://daob.nl
Oberski, D.L. (2014). lavaan.survey: An R Package for Complex SurveyAnalysis of Structural Equation Models. Journal of Statistical Software,57 (1). http://www.jstatsoft.org/v57/i01
lavaan.survey [email protected]


Appendix*
Specifying regression relations in lavaan
Dependent variable ``regressedon''
independent variables
selfconcept ~ efficacy + ESCS + maleefficacy ~ selfconcept + school.type +
ESCS + malemath ~ selfconcept + efficacy +
school.type + ESCS + male
lavaan.survey [email protected]


Appendix*
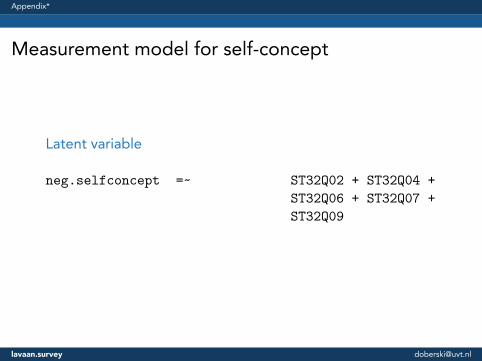
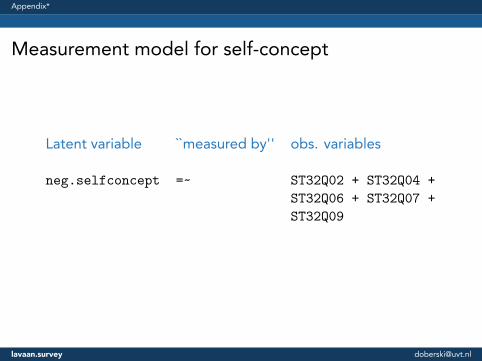
Measurement model for self-concept
Latent variable ``measured by'' obs. variables
neg.selfconcept =~ ST32Q02 + ST32Q04 +ST32Q06 + ST32Q07 +ST32Q09
lavaan.survey [email protected]
Appendix*
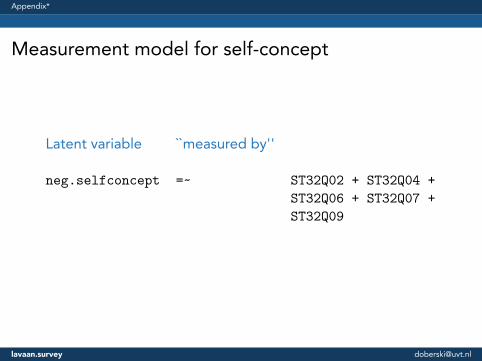
Measurement model for self-concept
Latent variable
``measured by'' obs. variables
neg.selfconcept =~ ST32Q02 + ST32Q04 +ST32Q06 + ST32Q07 +ST32Q09
lavaan.survey [email protected]
Appendix*
Measurement model for self-concept
Latent variable ``measured by''
obs. variables
neg.selfconcept =~ ST32Q02 + ST32Q04 +ST32Q06 + ST32Q07 +ST32Q09
lavaan.survey [email protected]
Appendix*
Measurement model for self-concept
Latent variable ``measured by'' obs. variables
neg.selfconcept =~ ST32Q02 + ST32Q04 +ST32Q06 + ST32Q07 +ST32Q09
lavaan.survey [email protected]
Appendix*
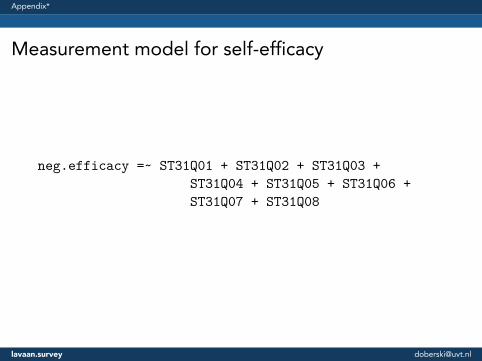
Measurement model for self-efficacy
neg.efficacy =~ ST31Q01 + ST31Q02 + ST31Q03 +ST31Q04 + ST31Q05 + ST31Q06 +ST31Q07 + ST31Q08
lavaan.survey [email protected]
Appendix*
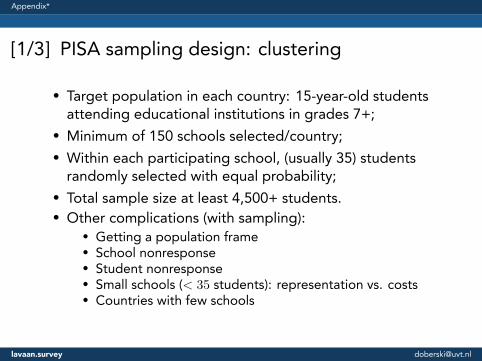
[1/3] PISA sampling design: clustering
• Target population in each country: 15-year-old studentsattending educational institutions in grades 7+;
• Minimum of 150 schools selected/country;• Within each participating school, (usually 35) studentsrandomly selected with equal probability;
• Total sample size at least 4,500+ students.• Other complications (with sampling):
• Getting a population frame• School nonresponse• Student nonresponse• Small schools (< 35 students): representation vs. costs• Countries with few schools
lavaan.survey [email protected]

Appendix*
[2/3] PISA sampling design: stratification
• Before sampling, schools stratified in the sampling frame;• Schools classified into ``like'' groups, for purpose:
• improve efficiency of the sample design;• disproportionate sample allocations to specific groups ofschools, e.g. states, provinces, or other regions;
• ensure all parts of population included in the sample;• representation of specific groups in sample.
lavaan.survey [email protected]

Appendix*
PISA sampling: stratification in Belgium
• Region × Public/private education → 23 strata• Then sampling within stratum with probabilityproportional to:
• (Flanders) ISCED; Retention Rate; Vocational/SpecialEducation; Percentage of Girls;
• (French Community) National/International School;Retention Rate; Vocational-Special Education/Other;
• (German Community) Public/Private.lavaan.survey [email protected]

Appendix*
[3/3] Weighting
wij = w1iw2ijf1if2ijt1i
w1i: Base weight for school i;w2ij: Base weight for student j in school i;
f2ij, f1i: Nonresponse factor for student and schoolnonparticipation;
t1i: Weight trimming factor.
lavaan.survey [email protected]
Appendix*
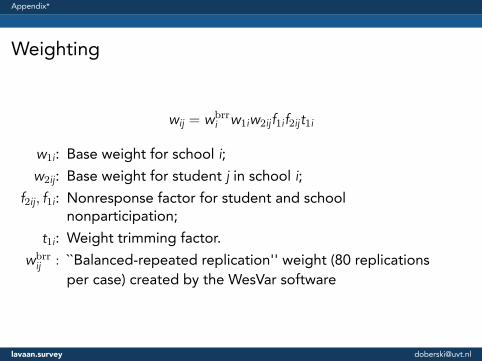
Weighting
wij = wbrri w1iw2ijf1if2ijt1i
w1i: Base weight for school i;w2ij: Base weight for student j in school i;
f2ij, f1i: Nonresponse factor for student and schoolnonparticipation;
t1i: Weight trimming factor.wbrrij : ``Balanced-repeated replication'' weight (80 replications
per case) created by the WesVar software
lavaan.survey [email protected]

Appendix*
Structural parameter estimates and standard errorstaking nonnormality into account
Estimate Std.err Z-value P(>|z|)Regressions:
neg.selfconcept ~neg.efficacy -0.021 0.032 -0.657 0.511ESCS -0.062 0.018 -3.381 0.001male -0.389 0.027 -14.607 0.000
neg.efficacy ~neg.selfcncpt 0.568 0.046 12.354 0.000school.type 0.530 0.022 24.331 0.000ESCS -0.252 0.016 -16.199 0.000male -0.360 0.031 -11.668 0.000
math ~neg.selfcncpt -0.179 0.015 -11.644 0.000neg.efficacy -0.239 0.015 -16.413 0.000school.type -0.606 0.019 -32.154 0.000ESCS 0.312 0.014 22.511 0.000male 0.009 0.024 0.375 0.708
lavaan.survey [email protected]
Appendix*
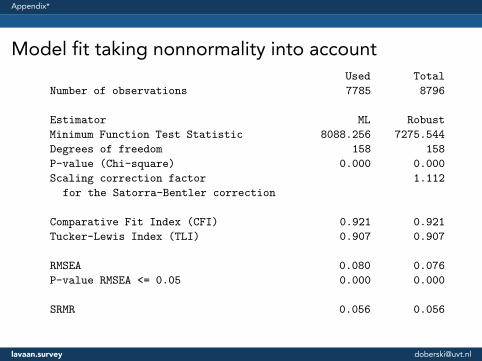
Model fit taking nonnormality into accountUsed Total
Number of observations 7785 8796
Estimator ML RobustMinimum Function Test Statistic 8088.256 7275.544Degrees of freedom 158 158P-value (Chi-square) 0.000 0.000Scaling correction factor 1.112
for the Satorra-Bentler correction
Comparative Fit Index (CFI) 0.921 0.921Tucker-Lewis Index (TLI) 0.907 0.907
RMSEA 0.080 0.076P-value RMSEA <= 0.05 0.000 0.000
SRMR 0.056 0.056
lavaan.survey [email protected]
Appendix*
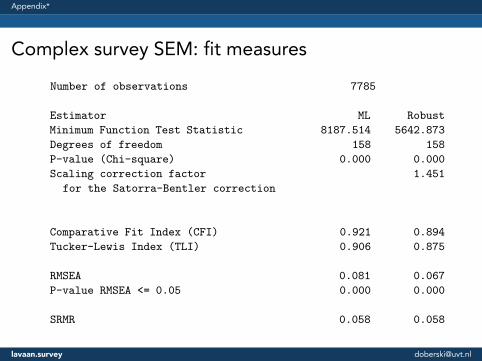
Complex survey SEM: fit measuresNumber of observations 7785
Estimator ML RobustMinimum Function Test Statistic 8187.514 5642.873Degrees of freedom 158 158P-value (Chi-square) 0.000 0.000Scaling correction factor 1.451
for the Satorra-Bentler correction
Comparative Fit Index (CFI) 0.921 0.894Tucker-Lewis Index (TLI) 0.906 0.875
RMSEA 0.081 0.067P-value RMSEA <= 0.05 0.000 0.000
SRMR 0.058 0.058
lavaan.survey [email protected]