laura cattaneo · sergio terzi editors models, …...claudio violi, laura calvo duarte, catalina...
TRANSCRIPT

S P R I N G E R B R I E F S I N A P P L I E D S C I E N C E S A N D T E C H N O LO G Y P O L I M I S P R I N G E R B R I E F S
Laura Cattaneo · Sergio Terzi Editors
Models, Methods and Tools for Product Service DesignThe Manutelligence Project

SpringerBriefs in Applied Sciencesand Technology
PoliMI SpringerBriefs
Editorial Board
Barbara Pernici, Politecnico di Milano, Milano, ItalyStefano Della Torre, Politecnico di Milano, Milano, ItalyBianca M. Colosimo, Politecnico di Milano, Milano, ItalyTiziano Faravelli, Politecnico di Milano, Milano, ItalyRoberto Paolucci, Politecnico di Milano, Milano, ItalySilvia Piardi, Politecnico di Milano, Milano, Italy

More information about this series at http://www.springer.com/series/11159http://www.polimi.it
Laura Cattaneo • Sergio TerziEditors
Models, Methods and Toolsfor Product Service DesignThe Manutelligence Project

EditorsLaura CattaneoDepartment of Management, Economicsand Industrial Engineering
Politecnico di MilanoMilan, Italy
Sergio TerziDepartment of Management, Economicsand Industrial Engineering
Politecnico di MilanoMilan, Italy
ISSN 2191-530X ISSN 2191-5318 (electronic)SpringerBriefs in Applied Sciences and TechnologyISSN 2282-2577 ISSN 2282-2585 (electronic)PoliMI SpringerBriefsISBN 978-3-319-95848-4 ISBN 978-3-319-95849-1 (eBook)https://doi.org/10.1007/978-3-319-95849-1
Chapter 4 is licensed under the terms of the Creative Commons Attribution-NonCommercial-NoDerivatives 4.0 International License (http://creativecommons.org/licenses/by-nc-nd/4.0/). For furtherdetails see license information in the chapter.
Library of Congress Control Number: 2018948601
© The Editor(s) (if applicable) and The Author(s) 2019. This book is an open access publication.Open Access This book is licensed under the terms of the Creative Commons Attribution 4.0International License (http://creativecommons.org/licenses/by/4.0/), which permits use, sharing, adap-tation, distribution and reproduction in any medium or format, as long as you give appropriate credit tothe original author(s) and the source, provide a link to the Creative Commons license and indicate ifchanges were made.The images or other third party material in this book are included in the book’s Creative Commonslicense, unless indicated otherwise in a credit line to the material. If material is not included in the book’sCreative Commons license and your intended use is not permitted by statutory regulation or exceeds thepermitted use, you will need to obtain permission directly from the copyright holder.The use of general descriptive names, registered names, trademarks, service marks, etc. in thispublication does not imply, even in the absence of a specific statement, that such names are exempt fromthe relevant protective laws and regulations and therefore free for general use.The publisher, the authors and the editors are safe to assume that the advice and information in thisbook are believed to be true and accurate at the date of publication. Neither the publisher nor theauthors or the editors give a warranty, express or implied, with respect to the material contained herein orfor any errors or omissions that may have been made. The publisher remains neutral with regard tojurisdictional claims in published maps and institutional affiliations.
This Springer imprint is published by the registered company Springer Nature Switzerland AGThe registered company address is: Gewerbestrasse 11, 6330 Cham, Switzerland
Preface
This book summarizes work being undertaken within the Manutelligence EuropeanResearch Project (Grant agreement N°: 636951, H2020-FoF-2014, FoF-05—Innovative product–service design using manufacturing intelligence). The projectaims at supporting enterprises to develop smart, social, and flexible products withhigh value-added services. Manutelligence has improved product and servicedesign by developing suitable models and methods, and connecting them through amodular collaborative secure ICT Platform. The use of real data collected in realtime through the Internet of Things (IoT) technologies underpin the design ofproduct–service system (PSS) and allows to follow the PSS along its life cycle.Available data allows a better measure and simulation of costs and sustainabilityissues, through life-cycle cost (LCC) and life-cycle assessment (LCA). Analyzingdata coming from IoT systems and sharing LCC and LCA information thanks to theICT Platform allows speeding up the design of product–service (P-S), decreasingcosts and better understanding customer needs. Industrial partners involved in theproject provided a clear overview of the Manutelligence results and proved how itstechnological solutions improve the design of a product–service system and themanagement of the product–service life cycle.
The book covers a large number of topics, since Manutelligence really involvedseveral issues coming from the product and service life cycle. It was designed tooffer readers the possibility to have a complete view of all the results we haveachieved during the project. Furthermore, it contains a clear explanation of the ITmodular architecture we have developed in order to collect within a unique andcomplete framework different tools and software.
Chapter 1 introduces the main research contents and provides an overview onManutelligence objectives. Furthermore, it introduces the description of the ITmodular platform.
Chapter 2 deals with engineering and business requirements definition, analysis,and validation. It describes the four-phase methodology implemented to define thecommon aggregated requirements for the platform development. The phasesinclude requirement elicitation, structuration and organization, analysis andrefinement and validation. It also shows the main results of each phase.
v

Chapter 3 describes an approach to manage PSS along its life cycle. It includes adesign methodology for PSS and a systems modeling method. It also highlightschallenges related to PSS lifecycle management observed during theManutelligence project.
Chapter 4 shows how the platform developed during the project enable designersand engineers to access through natural 3DEXPERIENCE to data from both thetraditional enterprise IT systems (CAD, CAX, PLM, MES, etc.) and IoT-enabledsystems. Furthermore, it describes how it is possible to retrieve physical productsinformation and knowledge management during the PSS lifecycle phases.
Chapter 5 presents tools and procedures to embed and retrieve the knowledgerelated to the P-S and its life cycle in manufacturing. Taking into account theinformation coming from different sources (PLCs, sensorial IoT nodes, etc.) in thecontext of production system, a methodology to present coherently field data isproposed, with the idea to offer interoperability and integration also from the pointof view of the different devices used to collect these data.
Chapter 6 describes a tool aimed at carrying out the life cycle assessment (calledMaGA) and another one for the life cycle costing (called BAL.LCPA). In order toseamlessly include environmental and economic considerations into the designprocess, the two stand-alone tools have been integrated with the Manutelligencedesign platform. Their application in a Fablab-like environment is described toshow how they interact with design tools and to provide examples of the resultsthey get.
Chapter 7 describes all the different use cases involved in the project. It isfocused on how each of them has applied Manutelligence methods and tools inorder to improve PSS design and management. A particular focus is dedicated tothe usage of the Manutelligence platform.
Chapter 8 illustrates the business potential of product and service lifecycleengineering tools within the manufacturing sector, with particular attention to theuse cases of the Manutelligence project. The whole process (the aggregation and thevalue creation) is investigated. From the scenario, analysis of the global PLM sectoremerged that the aggregation of product and service lifecycle engineering tools isable to generate significant added value, highlighting in this way the relevantcommercial perspectives of the Manutelligence platform.
Milan, Italy Laura CattaneoSergio Terzi
vi Preface
Acknowledgements
We are grateful to our project officer Erastos Filos and to our reviewerMrs. Anastasia Garbi for their constructive and useful suggestions; they greatlyhelped us shape our project results. Also, we own gratitude to our project coordi-nator Maurizio Petrucciani for his invaluable support through all phases of theproject and to all the consortium partners, that have made this work and this projectoutstanding. At last, as authors from Politecnico di Milano we would like to thankthe members of our team who were involved in the project, namely FrancescaAmato, Daniele Cerri, Matteo Cocco, Elisabetta De Berti, Silvia Marchetto, ManuelOliveira, Monica Rossi, Emanuela Vinci. All of them provided their best effort inachieving the results of the project, contributing to the research development and tothe scientific improvement of our group, led by Prof. Marco Taisch, and to theprogress of the entire Politecnico and to the whole society.
The work reported in this book is funded by the European Commission, throughEuropean Union’s Horizon 2020 research and innovation programme, under grantagreement no. 636951.
vii
Contents
1 Introduction . . . . . . . . . . . . . . . . . . . . . . . . . . . . . . . . . . . . . . . . . . . 1Laura Cattaneo, Jacopo Cassina, Maurizio Petrucciani, Sergio Terziand Stefan Wellsandt
2 Engineering and Business Requirements Definition, Analysisand Validation . . . . . . . . . . . . . . . . . . . . . . . . . . . . . . . . . . . . . . . . . 13Iris Karvonen, Tapani Ryynänen, Heidi Korhonen, Matteo Coccoand Donatella Corti
3 Life Cycle Management for Product-Service Systems . . . . . . . . . . . . 29Stefan Wellsandt, Laura Cattaneo, Daniele Cerri, Sergio Terzi,Donatella Corti, Christian Norden and Reinhard Ahlers
4 A Platform for Product-Service Design and ManufacturingIntelligence . . . . . . . . . . . . . . . . . . . . . . . . . . . . . . . . . . . . . . . . . . . . 45Maurizio Petrucciani, Lorenzo Marangi, Massimiliano Agostaand Marco Stevanella
5 Tools and Procedures to Embed and Retrieve Product-ServiceLifecycle Knowledge . . . . . . . . . . . . . . . . . . . . . . . . . . . . . . . . . . . . . 63Jacopo Cassina, Ida Critelli, Lara Binotti, Eva Cosciaand Stefano Borgia
6 Life Cycle Assessment and Life Cycle Costing for PSS . . . . . . . . . . . 83Donatella Corti, Alessandro Fontana, Michele De Santis,Christian Norden and Reinhard Ahlers
7 Use Cases . . . . . . . . . . . . . . . . . . . . . . . . . . . . . . . . . . . . . . . . . . . . . 101Claudio Violi, Laura Calvo Duarte, Catalina Amengual Garí,Pekka Puranen, Christian Norden and Lars Oscarsson
8 Business Exploitation . . . . . . . . . . . . . . . . . . . . . . . . . . . . . . . . . . . . 131Manuela Zacchei, Silvia Capato and Gianicola Loriga
ix

Chapter 1Introduction
Laura Cattaneo, Jacopo Cassina, Maurizio Petrucciani, Sergio Terziand Stefan Wellsandt
Abstract This introductive chapter aims to clarify some of the main research con-tents that are involved in Manutelligence project and wants to present the objectivesof the project and the structure of theManutelligence IT platform.We briefly describesome fundamental concepts, such as the Product Lifecycle Management (PLM), theProduct Service System (PSS), the Internet of Things (IoT) for the smart manufac-turing, the Life Cycle Cost and the Life Cycle Assessment (LCC and LCA). Allthese topics are strictly connected, since Manutelligence project aims at supportingenterprises to design and to develop suitable Product-Service Systems, addressingcustomers’ needs and stakeholders’ requirements, collected also through IoT tech-nologies. Furthermore it aims to integrate best in class methodology and tools fromresearch and industry, resulting in a secure, collaborative Product/ServiceDesign andManufacturing Engineering Platform, able to manage the Product-Service lifecycleand to collect information in order to implement LCC and LCA.
L. Cattaneo (B) · S. TerziDepartment of Economics, Management and Industrial Engineering, Politecnico di Milano,20156 Milan, Italye-mail: [email protected]
S. Terzie-mail: [email protected]
S. WellsandtBIBA—Bremer Institut für Produktion und Logistik GmbH, University of Bremen,Hochschulring 20, 28359 Bremen, Germanye-mail: [email protected]
M. PetruccianiDassault Systemes Italia Srl, Viale dell’Innovazione 3, 20126 Milano, Italye-mail: [email protected]
J. CassinaHolonix s.r.l, Corso Italia, 8, 20821 Meda, MB, Italye-mail: [email protected]
© The Author(s) 2019L. Cattaneo and S. Terzi (eds.), Models, Methods and Tools for Product ServiceDesign, PoliMI SpringerBriefs, https://doi.org/10.1007/978-3-319-95849-1_1
1

2 L. Cattaneo et al.
1.1 Product Lifecycle Management
PLM (Product Lifecycle Management) is an acronym widely used in the currentindustrial practice. Coined more than 15 years ago, PLM is often seen as an exten-sive and comprehensive concept, which defines the integration of different kindsof activities performed by engineering staff along the entire lifecycle of industrialproducts, “from cradle to grave” [1].
In its practical essence, PLM defines the adoption of several software tools andplatforms for supporting innovation and engineering processes. According to themain business analysts (e.g. Gartner, CIMdata, Tech Clarity), PLM is a leadingglobal market of IT solutions, mainly segmented in two branches: (i) Authoring andSimulation tools and (ii) Collaborative Product Development platforms and environ-ments. In the first segment, dozens of vendors are globally proposing their solutionsfor enabling virtual prototyping solutions (from CAD 3D, to Computational FlowDynamic, from Finite Element Analysis, to Discrete Event Simulation, etc.). Thesecond branch is populated by a plethora of collaborative functionalities supporting,for instance, effective file sharing, document vaulting, work flow automation, teammanagement and on distance working. Most of them are provided in one single,secured environment.
PLM is still a matter of design and engineering tools, and their integration. Theindustrial practice shows how PLM’s real implementation is quite far from its com-prehensive “lifecycle” meaning [2].
One product lifecycle framework in production engineering differentiates threemain phases, describing the product from the “cradle to grave” [3]:
• Beginning of Life (BOL): processes related to development, production and dis-tribution;
• Middle of Life (MOL): processes related to a product’s use, service and repair;• End of Life (EOL): processes related to reverse logistics like reuse, recycle anddisposal.
Approaches, such as closed-loop PLM [4], take a view upon the entire productlifecycle, fromproduct ideation to end-of-life processes. Ideally, the viewextends intothe beginning of the next lifecycle. This puts forward a paradigm shift from “cradleto grave” to “cradle to cradle” [5]. An example is the refurbishment of componentsfrom decommissioned products for use in new ones. The aim of closed-loop PLM isto close information gaps between the phases and processes of the product lifecycle.This can be backwards, for example providing usage data to design processes, orforwards, for example providing production and assembly information to recyclingprocesses. It deals with products as classes or variants, as well as individual productitems (“item level”).
1 Introduction 3
1.2 Product Service System
The adoption of the service business by manufacturing companies is a commontrend in many industrial sectors, especially those offering durable goods. This shift,referred to in literature as servitization process, is defined as “[…] the increasedoffering of fuller market packages or ‘bundles’ of customer focused combinationsof goods, services, support, self-service and knowledge in order to add value tocore product offerings” [6]. Servitization supports companies to strengthen theircompetitive position thanks to the financial, marketing and strategic benefits led bythe integration of services in the companies’ offer [6–9].
Differentiation against competitors, hindering competitors to offer similarproduct-service bundles and the increasing of customer loyalty are the main ben-efits of servitization. Today, more than ever, servitization is customer driven [10]. Aresearch field that is often associated to the servitization process is the one relatedto the Product Service-Systems (PSS) [11]. The first definition of a PSS was givenin 1999: “A product service-system is a system of products, services, networks ofplayers and supporting infrastructure that continuously strives to be competitive, sat-isfy customer needs and have a lower environmental impact than traditional businessmodels” [12].
Manzini points out that PSS is an innovation strategy that allows fulfilling specificcustomer needs [13]. Tukker observes that PSS is capable to enhance customer loyaltyand build unique relationships since it follows customer needs better [14]. Anotherimportant contribution comes from Sakao and Shimomura that see PSS as a socialsystem that enhances social and economic values for stakeholders [15].
Themove towards the PSS entails an organizational change that makes a companyshift fromaproduct-oriented culture to a service-oriented one.The transition is quite acomplex process that requires several changes and that usually happens in subsequentsteps.
Martinez et al. identify the five categories of challenges a company has to dealwithwhenmoving along the servitization process, namely embedded product-serviceculture, delivery of integrated offering, internal processes and capabilities, strategicalignment and supplier relationships [16].
PSS often include value adding services based on ICT contributions, both interms of enhanced information and knowledge generation/sharing, as well as ofadditional functionalities [17, 18]. PSS providers need to establish collaborationamong specialized companies. In particular, Fisher et al. discussed approaches forservice business development on a global scale. They take into account organizationalelements, such as customer proximity or behavioral orientation [19].
The closer affiliation of customers and manufacturers/service providers offerpotential to generate revenue throughout the entire lifecycle [18, 20]. Moreover,as stated by Baines et al., “… integrated product-service offerings are distinctive,long-lived, and easier to defend from competition based in lower cost economies…” [18]. The potential extension of the lifetime of tangible components of PSS, due
4 L. Cattaneo et al.
to their integration with adding value services, opens interesting perspectives alsoabout environmental sustainability improvements.
The advantages coming from PSS have been demonstrated in literature, yet formany companies efficiently managing the service operations is still a challenge.Best practices and empirical analysis are mainly carried out with a focus on largercompanies.Nonetheless, the PSS topic ismore andmore recognized bySMEs that arelooking for innovative business solutions to improve their competitive advantages.
1.3 Internet of Things for Smart Manufacturing
The term “Internet of Things” (IoT) was first used by the Massachusetts Instituteof Technology in the year 1999. It was used in the sense of a networked systemof autonomously interacting and self-organizing objects and processes, which wasexpected to lead to a convergence of physical things with the digital world of theInternet [21]. This extrapolates the idea of the Internet—a global, interconnected net-work of computers—to describe a network of interconnected things, such as everydayobjects, products, and environments. At the heart of the concept lies the idea thatobjects—things—are capable of information processing, communication with eachother and with their environment, and autonomous decision making. For instance,Intelligent Products are physical items, which may be transported, processed or usedand comprise the ability to act in an intelligent manner. McFarlane et al. [22] definethe Intelligent Product as:
[…] a physical and information based representation of an item […]which possesses a uniqueidentification, is capable of communicating effectively with its environment, can retain orstore data about itself, deploys a language to display its features, production requirements,etc., and is capable of participating in or making decisions relevant to its own destiny.
The degree of intelligence of a product may exhibit variations from simple data pro-cessing to complex pro-active behavior. Three dimensions of characterization of anIntelligent Product are suggested byMeyer et al. [23]: Level of Intelligence, Locationof Intelligence and Aggregation Level of Intelligence. The first dimension describeswhether the Intelligent Product exhibits information handling, problem notificationor decisions making capabilities. The second shows whether the intelligence is builtinto the object, or whether it is located in the network. Finally, the aggregation leveldescribes whether the item itself is intelligent or whether intelligence is aggregatedat container level.
More recently Porter states that intelligence and connectivity enable an entirelynew set of product functions and capabilities, which can be grouped into four areas:monitoring, control, optimization, and autonomy [24]. A product can potentiallyincorporate all four. Each capability is valuable in its own right and also sets thestage for the next level. For example, monitoring capabilities are the foundation forproduct control, optimization, and autonomy. A company must choose the set ofcapabilities that deliver its customer value and define its competitive positioning.
1 Introduction 5
Smart, connected products have three core elements:
• Physical components comprise the product’s mechanical and electrical parts. In acar, for example, these include the engine block, tires, and batteries.
• Smart components comprise the sensors, microprocessors, data storage, controls,software, and, typically, an embedded operating system and enhanced user inter-face. In a car, for example, smart components include the engine control unit,antilock braking system, rain-sensing windshields with automated wipers, andtouch screen displays.
• Connectivity components comprise the ports, antennae, and protocols enablingwired or wireless connections with the product. Connectivity takes three forms,which can be present together:
– One-to-one: an individual product connects to the user, the manufacturer, oranother product through a port or other interface—for example, when a car ishooked up to a diagnostic machine.
– One-to-many: a central system is continuously or intermittently connected tomany products simultaneously. For example, many Tesla automobiles are con-nected to a single manufacturer system that monitors performance and accom-plishes remote service and upgrades.
– Many-to-many: multiple products connect to many other types of products andoften also to external data sources. An array of types of farm equipment isconnected to one another, and to geo-location data, to coordinate and optimizethe farm system.
Connectivity serves a dual purpose. First, it allows information to be exchangedbetween the product and its operating environment, its maker, its users, and otherproducts and systems. Second, connectivity enables some functions of the productto exist outside the physical device, in what is known as the product cloud.
Smart, connected products offer exponentially expanding opportunities for newfunctionality, far greater reliability, much higher product utilization, and capabilities.
These new types of products alter industry structure and the nature of competition,exposing companies to newcompetitive opportunities and threats. They are reshapingindustry boundaries and creating entirely new industries. Smart, connected productshave been shown to be applicable to various scenarios and business models. Forinstance, Kärkkäinen et al. describe the application of the concept to supply networkinformation management problems [25]. Other examples are the application of theSmart Products to supply chain [26], manufacturing control [22, 27], and production,distribution, and warehouse management logistics [28].
Smart connected products are increasingly the focus of research into the collectionof item-level product usage data for closed-loop PLM applications, servitization andproduct avatars [29, 30].
6 L. Cattaneo et al.
1.4 Life Cycle Cost (LCC) and Life Cycle Assessment(LCA)
Life Cycle Cost (LCC) analysis provides a framework for specifying the estimatedtotal incremental cost of developing, producing, using and retiring a particular item.This methodology is useful to directly provide cost information to designers, in orderto reduce the life cycle cost of the products they design [31].
There exist some difficulties in the application of LCC techniques to PSS, whichusually includes the necessity of analyze various scenarios for effectively evaluatingthe impact of risks and uncertainties. These difficulties arise from some specificitiesof PSS, such as the modification of the role and responsibilities of customers andsuppliers in the various PSS life cycle phases, the difficulty to foreseen the timingand overall frequency of use of some services, the lack of availability of life cycledata. The gap about LCC information among the various stakeholders during thePSS design phase can lead to unsatisfactory choices and prevent the full exploitationof PSS benefits [32, 33].
Life Cycle Assessment is “a process to evaluate the environmental burdens asso-ciated with a product system, or activity (process) by identifying and quantitativelydescribing the energy and materials used, and wastes released to the environment,and to assess the impacts of those energy and material uses and releases to the envi-ronment” (www.setac.org). To calculate impact ratios, LCA defines four phases thattakes place iteratively: the goal/scope definition, the inventory definition and analy-sis, the impact assessment and the interpretation. Fundamental for the reliability andrepeatability of calculating impact ratios is the completeness and quality of data andthe transparency of processes and methodology applied.
Although LCA is a well-documented methodology (e.g., LCA handbook, 2010),repeatability is weakened because of the large freedom offered in choosing systemboarders, parameter selection, data quantity and calculation methodology, whichintroduce uncertainties on estimated impact ratios and make difficult their compar-isons.Moreover, due to the complexity and the diverse types of uncertainties inherentto LCA, simplifications and by analogy approaches are often required in order to useit [34]. This hinders the comparison of studies even when they address similar situ-ations. The role of LCA in influencing design and more generally decision makingtowards a sustainability strategy is hindered by its current use, which often takesplace as a posteriori side activity after product design fulfillment, as well as by thelack data models and tools able to capture andmake transparent the choices and deci-sion process during all the step of product lifecycle. These problems are exacerbatedwhile considering PSS due to some specific challenges, such as:
• Wide difference of PSS typologies implyingmodifications to the required activitiesand the involved actors [35];
• Strong influenceof the context of applicationofPSS for determining the encountersand the methodologies to be followed [36],
• Unsatisfactory integration of sustainability issues in current PSS design method-ologies.

1 Introduction 7
1.5 The Manutelligence Project
The Manutelligence Project aims at supporting enterprises to design and to developsuitable Product-Service Systems, addressing customers’ needs and stakeholders’requirements. Manutelligence aims to integrate best in class methodologies andtools from research and industry, resulting in a secure, collaborative Product/ServiceDesign and Manufacturing Engineering Platform.
The Manutelligence consortium consists of a group of highly qualified industrialand academic research organizations that has been specifically affiliated to meet thechallenges of the project.
All the involved RTD partners have a strong experience in publicly fundedprojects, both at a European and a national level, with high innovative and applicationcapabilities. The RTD partners have the core competences and expertises required tocover the knowledge domains of this project (information and communication tech-nologies, product lifecycle management, product & service innovation management,data and knowledge management, etc.). The application partners are concentrated onthe industry-driven implementation and evaluation, to prove the resulting researchconcepts.
The partners are divided as follow:
• 4 Research partners broken down as follows:
– 2 Universities: Politecnico di Milano and Supsi.– 2 Research Institutes: VTT and BIBA.
• 3 ICT Industrial partners: Dassault Systèmes, Holonix and Balance.• 5 Industrial Companies: Ferrari, Mayer Turku, Lindbäcks Bygg, Fundacio PrivadaCentre CIM, Rina Consulting.
Concerning the geographical distribution of the consortium partners, Manutel-ligence gathers partners form seven different countries: Finland, France, Germany,Italy, Spain, Sweden, and Switzerland.
1.5.1 Manutelligence Research Objectives
The main research topics addressed during the projects have been:
• Improve efficiency and develop newmethodology for the PSS design process, witha specific focus on the integration of IoT technologies (Chap. 2).
• Achieve a complete integration of Product Lifecycle Management and ServiceLifecycle Management, developing concepts, methodologies and tools to supportPSS development (Chap. 2).
• Adapt and integrate existing design, data analysis and life cycle assessment toolsto realize closed-loop PLM for PSS (Chap. 2).
• Enable designers and engineers access data from the traditional enterprise IT sys-tems, but also from the IoT enabled systems. The objective is to manage all data,
8 L. Cattaneo et al.
information and knowledge related to the P-S and its lifecycle in manufacturing.(Chap. 3).
• Extract feedback from P-S customers, analyzing data coming from IoT systems,in order to speed up the design of P-S, and to decrease the costs and to betterunderstand customer needs (Chap. 3).
• Extend and improve the use of Manufacturing and Service Execution Simulationand optimize it through comparisons with test bench and real usage data (Chaps.3 and 4).
• Measure and simulate costs and sustainability issues, through Life Cycle Cost(LCC) and Life Cycle Assessment (LCA), collecting data from both traditionalsources and smart connected products. The combined use of various tools allowseffectively sharing LCC and LCA information to all the stakeholders in a simpleway, supporting their decision making processes (Chap. 5).
1.5.2 The Manutelligence IT Platform
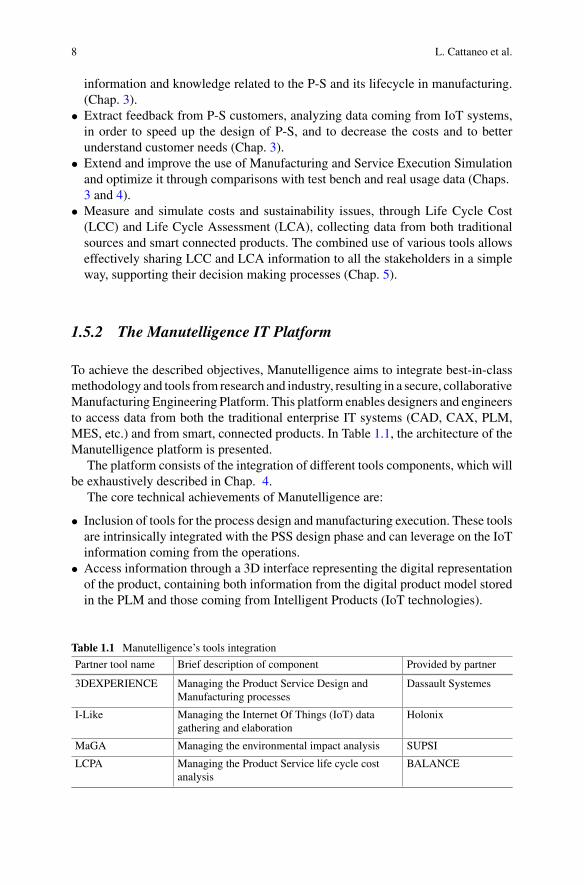
To achieve the described objectives, Manutelligence aims to integrate best-in-classmethodology and tools from research and industry, resulting in a secure, collaborativeManufacturing Engineering Platform. This platform enables designers and engineersto access data from both the traditional enterprise IT systems (CAD, CAX, PLM,MES, etc.) and from smart, connected products. In Table 1.1, the architecture of theManutelligence platform is presented.
The platform consists of the integration of different tools components, which willbe exhaustively described in Chap. 4.
The core technical achievements of Manutelligence are:
• Inclusion of tools for the process design and manufacturing execution. These toolsare intrinsically integrated with the PSS design phase and can leverage on the IoTinformation coming from the operations.
• Access information through a 3D interface representing the digital representationof the product, containing both information from the digital product model storedin the PLM and those coming from Intelligent Products (IoT technologies).
Table 1.1 Manutelligence’s tools integration
Partner tool name Brief description of component Provided by partner
3DEXPERIENCE Managing the Product Service Design andManufacturing processes
Dassault Systemes
I-Like Managing the Internet Of Things (IoT) datagathering and elaboration
Holonix
MaGA Managing the environmental impact analysis SUPSI
LCPA Managing the Product Service life cycle costanalysis
BALANCE
1 Introduction 9
• Support the interaction between the engineering and the environmental (LCA) orbusiness (LCC) analysts, as well as to provide tools andmethods to enable iterativecalculation and optimization of these aspects. The platform results a suitable toolto collect, share data and information helping analysts to retrieve data and to defineboundaries of the analysis.
• Features of the platform can be applied in many different industrial cases, improv-ing the manufacturing efficiency and quality, addressing the needs captured fromthe products usage by the end users.
References
1. Terzi S, Bouras A, Dutta D, Garetti M, Kiritsis D (2010) Product lifecycle management—fromits history to its new role. Int J Prod LifecycleManag 4(4):360–389. ISSN (Online): 1743-5129,ISSN (Print)
2. RossiM, RiboldiM, Cerri D, Terzi S, GarettiM (2013) Product lifecyclemanagement adoptionversus lifecycle orientation: evidences from Italian companies. In: Proceedings of productlifecycle management for society 10th IFIP WG 5.1 international conference, PLM 2013,Nantes, France, July 6–10, 2013, pp 346–355
3. Wellsandt S,Nabati E,Wuest T,HribernikKA,ThobenKD (2016)A survey of product lifecyclemodels: towards complex products and service offers. Int J Prod Lifecycle Manag 9(4):353
4. Hong-Bae J, Kiritsis D, Xirouchakis P (2007) Research issues on closed-loop PLM. ComputInd 58(8–9):855–868
5. Pokharel S, Mutha A (2009) Perspectives in reverse logistics: a review. Resour Conserv Recycl53:8
6. Vandermerwe S, Rada J (1988) Servitization of business: adding value by adding services. EurManag J 6(4):314–324
7. Oliva R, Kallenberg R (2003) Managing the transition from products to services. Int J Serv IndManag 14(2):160–172
8. Gebauer H, Friendli T, Fleisch E (2006) Success factors for achieving high service revenuesin manufacturing companies. Benchmarking: Int J 13(3):374–386
9. Malleret V (2006) Value creation through service offers. Eur Manag J 24(1):106–11610. Lewis M, Howard M (2009) Beyond products and services: shifting value generation in the
automotive supply chain. Int J Automot Technol Manage 9(1):4–1711. Tukker A, Tischner U (2006) New business for Old Europe: product-service development,
competitiveness and sustainability. Greenleaf Publishing, Sheffield12. Goedkoop M, van Haler C, te Riele H, Rommers P (1999) Product service-systems, ecological
and economic basics, pre consultants, The Hague. Report for Dutch Ministries of Environment(VROM) and Economic Affairs (EZ)
13. Manzini E, Vezzoli C (2003) A strategic design approach to develop sustainable product servicesystems: examples taken from the ‘environmentally friendly innovation’ Italian prize. J CleanProd 11(8):851–857
14. Tukker A (2004) Eight types of product–service system: eight ways to sustainability? Experi-ences from SusProNet. Bus Strategy Environ 13(4):246–260
15. Sakao T, Shimomura Y (2007) Service Engineering: a novel engineering discipline for pro-ducers to increase value combining service and product. J Clean Prod 15(6): 590–604. https://doi.org/10.1016/j.lclepro.2006.05.015
16. Martinez V, Bastl M, Kingston J, Evans S (2010) Challenges in transforming manufacturingorganizations into product-service providers. J Manufact Technol Manag 21(4):449–469

10 L. Cattaneo et al.
17. JanssonK,Kalliokoski P,Heimilä J (2003)Extended products in one-of-a-kind product deliveryand service networks. In: Building of theKnowledge Economy. Proceedings of the eChallengesconference in Bologna, IOS Press, Amsterdam
18. Jannsson K, Thoben K-D (2005) The extended products paradigm, an introduction. In: AraiE, Kimura F, Goossenaerts J, Shirase K (eds) Knowledge and skill chains in engineering andmanufacturing, IFIP International Federation for Information Processing, vol 168. Springer,Berlin, Heidelberg, pp 39–47
19. FisherT,GebauerH, FleishE (2012) Service business development, strategies for value creationin manufacturing firms. Cambridge University Press, Cambridge
20. Baines TS, LightfootH, Steve E,NeelyA,GreenoughR, Peppard J, RoyR, ShehabE, BraganzaA, Tiwari A, Alcock J, Angus J, Bastl M, Cousens A, Irving P, Johnson M, Kingston J, LockettH, Martinez V, Michele P, Tranfield D, Walton I, Wilson H (2007) State-of-the-art in product-service systems. Proc Inst Mech Eng, Part B: J Eng Manuf 221(10):1543–1552
21. Brand L, Hülser T, Grimm, V, Zweck A (2009) Internet der Dinge – Perspektiven für dieLogisitk. Zukünftige Technologien Consulting
22. McFarlane D, Sarma S, Chirn JL, Wong CY, Ashton K (2003) Auto ID systems and intelligentmanufacturing control. Eng Appl Artif Intell 16:365–376
23. Meyer GG, Främling K, Holmström J (2009) Intelligent products: a survey. Comput Ind60:137–148
24. Porter ME, Heppelmann JE (2014) How smart, connected products are transforming competi-tion. Harvard Business Review 92(11):64–88
25. Kärkkäinen M, Holmström J, Främling K, Artto K (2003) Intelligent products—a step towardsa more effective project delivery chain. Comput Ind 50:141–151
26. Ventä O (2007) Intelligent and Systems. Technology theme—final report. VTT, p 304. VTTPublications, Espoo
27. HribernikK, Cassina J, RøstadCC, ThobenK-D, TaischM (2012) Potentials of item-level PLMand servitization in the leisure boat sector. In: Proceedings of the 1st international through-lifeengineering services conference. Shrivenham, UK, 28
28. Wuest T, Hribernik K, Thoben K.-D (2012) Can a product have a Facebook? A new perspectiveon product avatars in product lifecycle management. In: IFIPWG 5.1 international conference,PLM 2012, Montreal, QC, Canada, July 9–11, 2012, pp 400-410
29. Wuest T, Irgens C, Thoben K.-D (2013) An approach to quality monitoring in manufacturingusing supervised machine learning on product state data. J Intel Manufact, online first. https://doi.org/10.1007/s10845-013-0761-y
30. Asiedu Y, Gu P (1998) Product life cycle cost analysis: state of the art review. Int J Prod Res36(4):883–908
31. Erkoyuncu JA, Roy R, Shehab E, Wardle P (2009) Uncertainty challenges in service costestimation for product service systems in the aerospace and defence industries. In: Proceedingsof the 1st CIRP Industrial Product-Service Systems (IPS2) conference, Cranfield University,1–2 April 2009, pp 200
32. Schuh G, Boos W, Kozielski S (2009) Life cycle cost-orientated service models for tool anddie companies. In: Proceedings of the 1st CIRP Industrial Product-Service Systems (IPS2)conference, Cranfield University, 1–2 April 2009, pp 249
33. Sahni S, Boustani A,Gutowski T, Graves S (2010) Textile remanufacturing and energy Savings.Environmentally Benign Laboratory. Laboratory for Manufacturing and Productivity, SloanSchool of Management, MITEI-1-g-2010
34. Fischbach M, Puschmann T, Alt R (2013) Service lifecycle management. Bus Inf Syst Eng5(1):45–49
35. Mukhtar M, Ismail MN, Yahya Y (2012) A hierarchical classification of co-creation modelsand techniques to aid in product or service design. Comput Ind 63(4):289–297
36. Vasantha GVA, Rajkumar R, Lelah A, Brissaud D (2012) A review of product-service systemsdesign methodologies. J Eng Des 23(9):635–659

1 Introduction 11
Open Access This chapter is licensed under the terms of the Creative Commons Attribution 4.0International License (http://creativecommons.org/licenses/by/4.0/), which permits use, sharing,adaptation, distribution and reproduction in any medium or format, as long as you give appropriatecredit to the original author(s) and the source, provide a link to the Creative Commons license andindicate if changes were made.
The images or other third party material in this chapter are included in the chapter’s CreativeCommons license, unless indicated otherwise in a credit line to the material. If material is notincluded in the chapter’s Creative Commons license and your intended use is not permitted bystatutory regulation or exceeds the permitted use, you will need to obtain permission directly fromthe copyright holder.
Chapter 2Engineering and Business RequirementsDefinition, Analysis and Validation
Iris Karvonen, Tapani Ryynänen, Heidi Korhonen, Matteo Coccoand Donatella Corti
Abstract The objective of Manutelligence platform is to manage manufacturingintelligence; all data, information and knowledge related to the Product Service (PS)and its lifecycle. The platform is based on two existing platforms and some analysistools (for example LCA and LCC). It was developed according to the needs of fouruse cases in different industrial fields (automotive, ship, smart house, 3D-printing).The chapter describes the four-phase methodology to define the common aggregatedrequirements for the platform. The phases include requirement elicitation, struc-turation and organization, analysis and refinement and validation. In the elicitationphase the requirements were identified from the use cases, in the structuration andrefinement phases theywere further consolidated, categorized and processed towardsaggregated requirements and in the validation phase the resulting aggregated require-ments were compared to the original use case requirements. The chapter also showsthe main results of each phase.
I. Karvonen (B) · T. Ryynänen · H. KorhonenVTT Technical Research Centre of Finland Ltd., P.O. Box 1000, 02044 Espoo, Finlande-mail: [email protected]
T. Ryynänene-mail: [email protected]
H. Korhonene-mail: [email protected]
M. CoccoDassault Systèmes, Milano, Italye-mail: [email protected]
D. CortiSUPSI—University of Applied Sciences and Arts of Southern Switzerland, Via Cantonale,2C, 6928 Manno, Switzerlande-mail: [email protected]
© The Author(s) 2019L. Cattaneo and S. Terzi (eds.), Models, Methods and Tools for Product ServiceDesign, PoliMI SpringerBriefs, https://doi.org/10.1007/978-3-319-95849-1_2
13

14 I. Karvonen et al.
2.1 Introduction
This chapter describes the methodology and main results of the definition and pro-cessing of engineering and business requirements for Manutelligence platform. Thechapter is focused on the phase before platform implementation; thus also the vali-dation here is about validation of final requirements against the use case scenariosand requirements. The platform validation against the requirements is not discussedhere.
As a starting point for development, Manutelligence had two existing platformsand some existing analysis tools. These have been consolidated, complemented andadapted to become the Manutelligence platform. Thus the Manutelligence approachwas different from the basic software requirements definition, which often startsfrom the scratch (new application or module) or has the description or original userrequirements of the existing platform available.
The development has been guided by the needs of participating industrial pilots.The Manutelligence project included four industrial pilots from different industrialfields (automotive, ship, smart house, 3D-printing). These cases were the sources forindustrial requirements in the project. All the pilots already use various engineeringtools in the product design. The idea was not to collect all the potential functions thatan engineering platform could cover, but to identify new needs with relation to theircurrent tools and practices. Thus the collected requirements from the use cases donot compose a complete set of requirements for a generic PS engineering platform.
The requirement engineering process was carried out using a common methodol-ogy through the following phases: requirement elicitation, structuring and orga-nization, refinement and validation. The intermediate requirement processing andconsolidation phases were needed because the different pilot scenarios were focusedon different processes and industries,with various stakeholders and user needs,whichresulted in a heterogeneous set of elicited requirements, difficult to use as such forthe platform development. In the process attention was given to keep the traceability.
In the requirement elicitation phase, the idea was to identify requirements with awide scope, not restricting in what could be implemented in the current project. Onone hand the wider scope gave more input for the platform development, on the otherhand the pilots were in the elicitation phase not yet able to make the decision aboutwhat will be implemented in Manutelligence. Thus it was clear from the beginningthat not all wishes in original requirements are implemented in this project with therestricted project resources. Thus the requirements should not be considered as staticand final but more as an iterative and evolutionary set of needs.
2.2 Challenges
The main objective in requirement elicitation was to receive requirements that arisefrom the real needs of end users and the focus was not on the formal quality. The end
2 Engineering and Business Requirements Definition … 15
users were not specialists in requirement engineering, but in PS design and engineer-ing methods and tools. Requirement identification is often challenging, as the endusers are not able to express their needs directly. Instead they need to be dragged outusing different methods, taking into account the end-user business objectives. Thususer friendly methods were needed. The approach generated a set of heterogeneousrequirements, which required further analysis and processing.
The sources of heterogeneity came already from different concepts and termi-nologies used in different sectors, but also from different groups of stakeholders,PS systems and different engineering processes and practices. Additionally, the pilotcompanies represent different company sizes and have differences in their prepared-ness for the utilization of information technology. The different groups also producedrequirements with different levels of detail.
Given the above, the four datasets received were challenging to structure andconsolidate. Therefore the structuration and analysis of the requirements requiredmanual and iterative processing of data. As the structuration and analysis phasesweremainly performed by researchers using different methods, the end users were againin the main role in the validation phase to check that the consolidated requirementswere sufficient compared to the original pilot scenarios.
2.3 Methodology
2.3.1 Four Phase Approach
The Manutelligence approach was to integrate and adapt existing technologies tofulfill the development needs of the four pilot cases in selected PS engineering pro-cess parts. The approach affected the Manutelligence methodology for requirementsengineering.
The selected approach was to apply a four-phase methodology with the phases:Elicitation, Structuration, Analysis and Refinement and Validation. The objectivesof the four Requirements Engineering phases were:
Elicitation. During this process heterogeneous needs and opportunities coming fromdifferent stakeholders involved in the PS development were identified from the pilots.Structuration. The main objective of the structuration was to unify and integratethe information collected in the previous step from disparate sources and organizethem into a common structure that can be used for analysis.Refinement and Analysis. The target of this activity was to refine and verify thepreviously elicited requirements. The refinement consists of the assessment of thecompleteness, coherence and feasibility of the stakeholders’ requirements and theirprioritization according to different criteria.Requirements validation. The purpose of the validation was to ensure that thestructured and consolidated requirements were sufficient for the end users (pilots)and could fulfill the defined scenarios. Thus this phase was the validation of the
16 I. Karvonen et al.
consolidated requirements against the pilot needs (scenarios and stories), not thevalidation of the implementation. Later in the project a validation of the platformagainst the consolidated requirements was performed. This platform validation is outof the scope of this chapter.
2.3.2 Requirements Elicitation Techniques in Manutelligence
The task of requirements elicitation is the identification of requirements’ sourcesand the elicitation of requirements according to the identified stakeholders and otherrequirements sources [3]. The elicitation can be performed using different method-ologies such as interview, questionnaire, observation, brainstorming, prototyping,mind-map and checklist. In this phase, human activity is fundamental and it is nec-essary to identify users involved in the process and establish a relation between themand the developers [2].
The elicitation was started with a pre-elicitation phase to identify the context inwhich the Manutelligence project will be developed. In the pre-elicitation, informa-tion was collected using a short questionnaire about the understanding of the holisticPS and what are the stakeholder expectations from the project. It was a kind of“close interview” technique in which the stakeholders answered to a predefined setof open-ended questions (3 questions).
After this preparation phase the actual elicitation was carried out. The followingelicitation techniques were used: questionnaire, process mapping, pilot stories andpilot scenarios.
In Manutelligence a comprehensive questionnaire with about 30 questions wasused to investigate the industrial practices in product and service (PS) developmentand data management in the four pilots. The questionnaire included the followingparts:
Part 1. Design process at glance.Part 2. Managing knowledge in a design and development context.Part 3. Managing the development of the PS.Part 4. Evaluating the lifecycle of the PS.
In the process mapping activity, the PS lifecycle of each pilot was modeled tounderstand the main life cycle phases and their interaction and the focus of processdevelopments needed. Because of the different levels of complexity in the pilot casesthe resulting models varied in the level of detail.
The pilot story is a customer and user centric methodology, useful to understandthe whole domain of the project. A pilot story basically is a storytelling with adescription of how the user would interact with the Manutelligence platform ratherthan how it works internally or how it is designed. Telling the story, the end user isable to present the desired future operations. Going through the story, it was possibleto identify requirements enabling the story to come true.
2 Engineering and Business Requirements Definition … 17
In parallel with the requirement identification, pilot scenarios for the Manutelli-gence project were described. The scenarios described the candidate as-is and to-beuse cases to be implemented in the project pilots, offering information in amore struc-tured format: purpose and objectives, actors involved, systems etc. This informationwas also used in the elicitation of the requirements.
2.3.3 Structuration Methods
The objective of the structuration phase was to organize the requirements comingfrom different sources into a common structure and to consolidate them to amoderatenumber of requirements. Thus firstly the structure had to be defined, then all therequirements were allocated to the structure and finally they were aggregated. In thebeginning, each requirement was given a unique identifier that also connects it tothe original pilot. This identifier followed the requirement throughout the process sothat the original requirement could always be traced back.
In the structuration two approaches were integrated: top-down and bottom-up.In the top-down approach, the concepts and structures given by the project wereidentified. These could be found for example in the interviews or questionnaires.The structures were compared to find similarities, which did not have to be exactlythe same but on the same dimension, like for example different process phases ofproduct-service lifecycles.
In the bottom-up approach, the structures emerging from the data were identified.The task utilized an adaptation of the Thematic analysis method [1]. An understand-ing of the data (original pilot requirements) was required in the task, often leadingto necessity to familiarize oneself with the pilot stories and scenarios.
The bottom-up approach thus meant analyzing the unstructured requirementsto identify similarities, categories and structures. The goal was to form a genericstructure or hierarchy of categories that suits for all the use cases and supports thedevelopment of the Manutelligence platform.
In the next phase the information available from both the given structures (top-down) and from the list of unstructured requirements (bottom-up) was analyzed andrelations, similarities and differences were identified. The final structure was formed,based on understanding the knowledge from both approaches and the complete data.
The pilot requirements were organized to the defined structure. The organizationalso tested if the structure was sufficient, if it was possible to put each requirementsomewhere in the structure.
Finally the original pilot requirements belonging to the same subcategory wereaggregated. The aggregated requirements are not as detailed as the original onesbut they aim to integrate similar needs from different pilots. The links to originalrequirements were maintained.

18 I. Karvonen et al.
2.3.4 Analysis and Prioritization Method
The objective of the third phase was to further refine and prioritize the structuredrequirements coming from the previous phase. The aim of the prioritization wasnot to remove any requirements but to create an overall view of their high levelimportance. The final decision of the requirements to be implemented during theproject was taken along the pilot development.
The requirements were first reviewed in order to make the level of detail morehomogeneous and to eliminate potential duplications. Next a trade-off analysis wasperformed to identify on one handmutually supportive and on the other hand conflict-ing requirements. In the trade-off analysis each couple of requirements was consid-ered and the corresponding relationship was qualitatively evaluated. The correlationwas analyzed considering themutual impact of requirements during the developmentof the platform. A positive correlation means that the parallel fulfillment of the tworequirements is mutually supportive and vice-versa. Values ranging from −2 to +2were used.
For the prioritization two types of criteria were defined: (1) Manutelligence-related criteria and (2) Pilot-related criteria. Manutelligence-related criteria comefrom understanding the general objectives of the project. Aggregated requirementswere used in this phase. Pilot-related criteria are based on the needs of the pilot cases;thus the original unstructured requirements were used here. These requirements wereconsidered on how much they can positively impact on the design process of the PSin the pilot.
Findings coming from the two prioritization analyses were finally merged to formthe final rank. A bonus system was used that favors more those requirements thatare addressed as important by both the Manutelligence-related and the pilot-relatedcriteria. This final rank achieved provided evidence about what are the most relevantrequirements to be fulfilled within the Manutelligence project since it summarizedall the previous analyses based on different points of view.
2.3.5 Requirements Validation Method
Validation has different roles over the application development process. In Manutel-ligence the first validation took place in the requirement definition phase and it wasabout validation of requirements, not software. Thus the objective of the require-ments validation here was not to check that the Manutelligence platform and relatedtools fulfill the requirements, but that the aggregated requirements fulfill the enduser needs. Also the prioritization defined in the previous task was checked. Thiswas needed, as the composition, structuring, aggregation and analysis (includingprioritization) of requirements from different use cases were performed by the sup-porting partners, not the use case owners themselves.

2 Engineering and Business Requirements Definition … 19
Different methods for the validation were applied. First an individual reviewusing a walk-through approach was used to check the sufficiency of aggregatedrequirements (not the priorities). The reviewwas performed by a group of researchersrepresenting the partners supporting the end users in Manutelligence. In the revieweach of the use cases was handled separately. Two pieces of source material for eachcase were used: (1) the pilot stories and (2) the end user scenario descriptions (to-be).The approach in the review was first to walk through the pilot story step by step andto identify the main functionality needed for each step. Thereafter the list of neededfunctionalities was compared to the list of aggregated requirements to see if thereis a requirement available, which enables taking the step. After that, the same wasdone for the end user scenarios (to-be). As the aggregated requirements are on ahigher level, telling more about “what” than “how”, the idea was to find a high levelrequirement, which could cover the lower level functionality.
It is clear that not all aggregated requirements were needed for each use case, butthe other way around; at least one requirement was needed for each step. Otherwisea shortage was recorded.
To include the end users (pilots) in the validation, a specific validation workshopwas organized. The workshop contained the following three main sessions:
• Presentation of the aggregated requirements,• Industrial partners crosschecking the Use Case requirements,• Industrial partners checking the prioritization of the requirements.
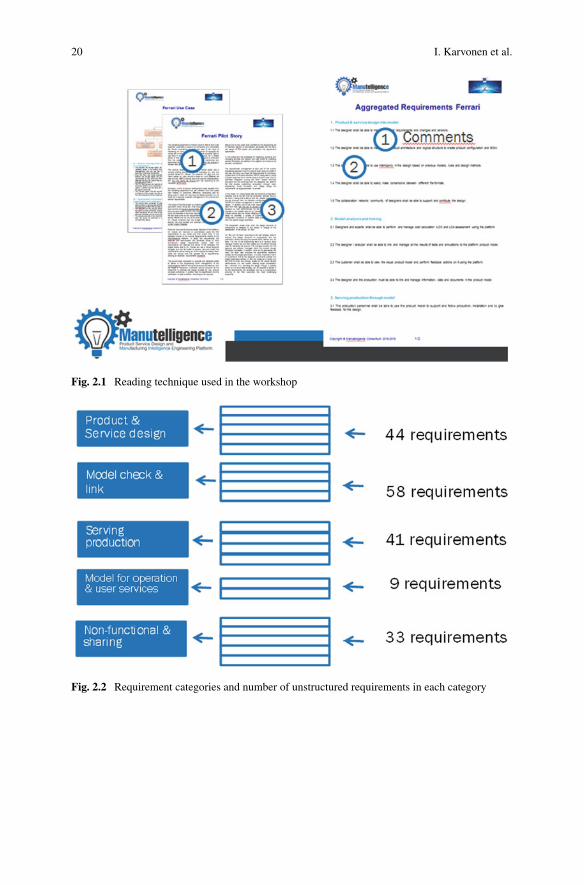
Themain task was the crosschecking of the aggregated requirements by the indus-trial partners. The participants were divided into sub-groups, one for each pilot andone for software developers, five groups in all. The methodology used was a form ofRequirementsWalk-Through andReading Technique. The participants were asked toreview the partner specific Pilot Stories and Use Case scenario descriptions (to-be) tocheck the sufficiency of the aggregated requirements. The groupswere equippedwithprintouts, in A3 size, of Pilot Stories, Use Case scenarios and the list of aggregatedrequirements. Figure 2.1 depicts the methodology.
The participants read through their Pilot Story and Use Case scenarios, section bysection. For each encountered step or function in the text, the participant checked thata corresponding requirement could be found in the list of aggregated requirements.These were marked with a circled 1, 2 and 3 etc. as seen in Fig. 2.2. If an aggregatedrequirement covering the issue could not be found, then a notewasmade. The numberof how many times an aggregated requirement was referenced to was counted foreach Industrial partner.
The third and final step in the workshop for each Industrial partner was to pointout the most important aggregated requirements. Each industrial partner was askedto mark the five top important aggregated requirements for its specific use cases. Thegiven rankings were summarized into an overall ranking.
20 I. Karvonen et al.
Fig. 2.1 Reading technique used in the workshop
Fig. 2.2 Requirement categories and number of unstructured requirements in each category
2 Engineering and Business Requirements Definition … 21
2.4 Results from the Definition of Businessand Engineering Requirements
2.4.1 Results from Requirements Elicitation
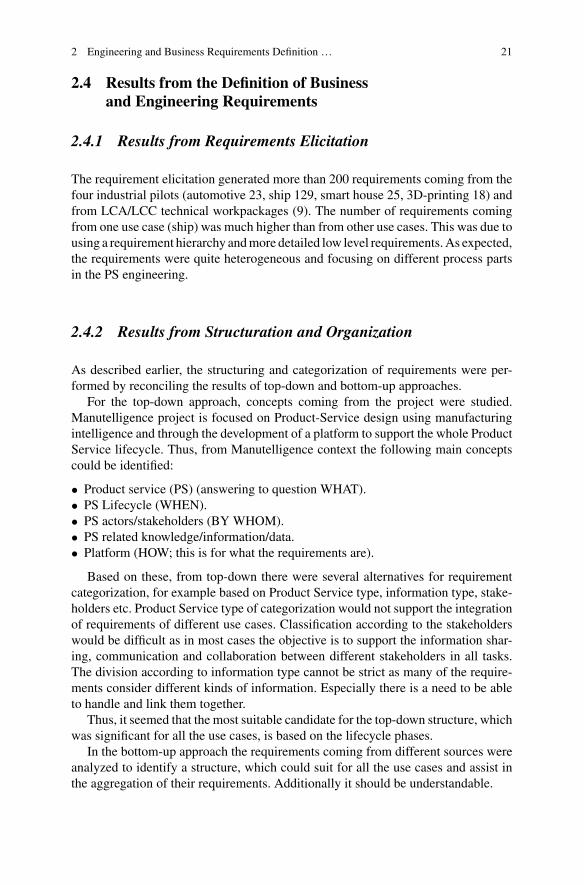
The requirement elicitation generated more than 200 requirements coming from thefour industrial pilots (automotive 23, ship 129, smart house 25, 3D-printing 18) andfrom LCA/LCC technical workpackages (9). The number of requirements comingfrom one use case (ship) was much higher than from other use cases. This was due tousing a requirement hierarchy andmore detailed low level requirements.As expected,the requirements were quite heterogeneous and focusing on different process partsin the PS engineering.
2.4.2 Results from Structuration and Organization
As described earlier, the structuring and categorization of requirements were per-formed by reconciling the results of top-down and bottom-up approaches.
For the top-down approach, concepts coming from the project were studied.Manutelligence project is focused on Product-Service design using manufacturingintelligence and through the development of a platform to support the whole ProductService lifecycle. Thus, from Manutelligence context the following main conceptscould be identified:
• Product service (PS) (answering to question WHAT).• PS Lifecycle (WHEN).• PS actors/stakeholders (BY WHOM).• PS related knowledge/information/data.• Platform (HOW; this is for what the requirements are).
Based on these, from top-down there were several alternatives for requirementcategorization, for example based on Product Service type, information type, stake-holders etc. Product Service type of categorization would not support the integrationof requirements of different use cases. Classification according to the stakeholderswould be difficult as in most cases the objective is to support the information shar-ing, communication and collaboration between different stakeholders in all tasks.The division according to information type cannot be strict as many of the require-ments consider different kinds of information. Especially there is a need to be ableto handle and link them together.
Thus, it seemed that the most suitable candidate for the top-down structure, whichwas significant for all the use cases, is based on the lifecycle phases.
In the bottom-up approach the requirements coming from different sources wereanalyzed to identify a structure, which could suit for all the use cases and assist inthe aggregation of their requirements. Additionally it should be understandable.
22 I. Karvonen et al.
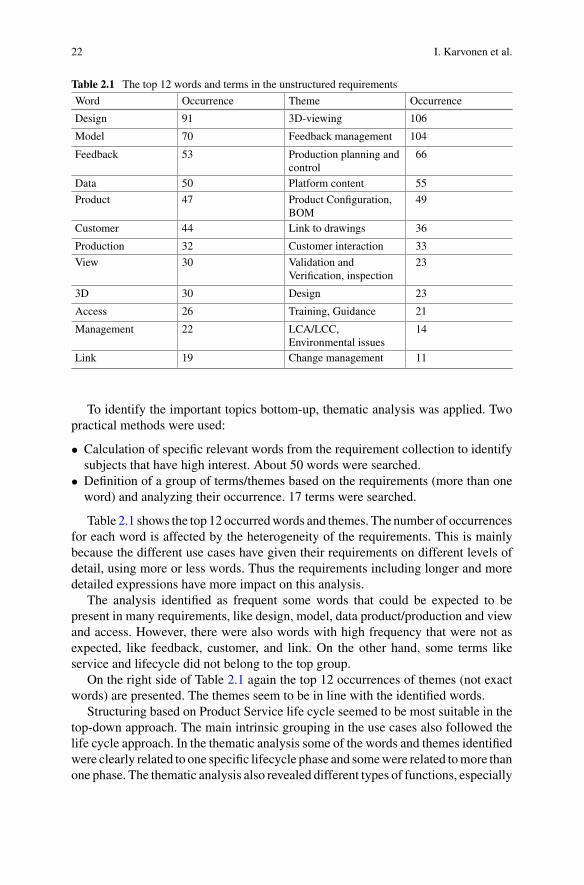
Table 2.1 The top 12 words and terms in the unstructured requirements
Word Occurrence Theme Occurrence
Design 91 3D-viewing 106
Model 70 Feedback management 104
Feedback 53 Production planning andcontrol
66
Data 50 Platform content 55
Product 47 Product Configuration,BOM
49
Customer 44 Link to drawings 36
Production 32 Customer interaction 33
View 30 Validation andVerification, inspection
23
3D 30 Design 23
Access 26 Training, Guidance 21
Management 22 LCA/LCC,Environmental issues
14
Link 19 Change management 11
To identify the important topics bottom-up, thematic analysis was applied. Twopractical methods were used:
• Calculation of specific relevant words from the requirement collection to identifysubjects that have high interest. About 50 words were searched.
• Definition of a group of terms/themes based on the requirements (more than oneword) and analyzing their occurrence. 17 terms were searched.
Table 2.1 shows the top 12 occurredwords and themes. The number of occurrencesfor each word is affected by the heterogeneity of the requirements. This is mainlybecause the different use cases have given their requirements on different levels ofdetail, using more or less words. Thus the requirements including longer and moredetailed expressions have more impact on this analysis.
The analysis identified as frequent some words that could be expected to bepresent in many requirements, like design, model, data product/production and viewand access. However, there were also words with high frequency that were not asexpected, like feedback, customer, and link. On the other hand, some terms likeservice and lifecycle did not belong to the top group.
On the right side of Table 2.1 again the top 12 occurrences of themes (not exactwords) are presented. The themes seem to be in line with the identified words.
Structuring based on Product Service life cycle seemed to be most suitable in thetop-down approach. The main intrinsic grouping in the use cases also followed thelife cycle approach. In the thematic analysis some of the words and themes identifiedwere clearly related to one specific lifecycle phase and somewere related tomore thanone phase. The thematic analysis also revealed different types of functions, especially
2 Engineering and Business Requirements Definition … 23
related to the design phase. Design phase is not only of engineering/design but alsopreparing and using the designed product information/model for intelligent actionsin different life cycle phases. Thus, when selecting the high level structure for theintegrated requirements, it was seen useful to divide the design phase functions to twogroups; those related to the real design phase (creation of the product design/model)and those using the product model for linking additional information/documents, toperform analysis and checking and to prepare for life cycle services.
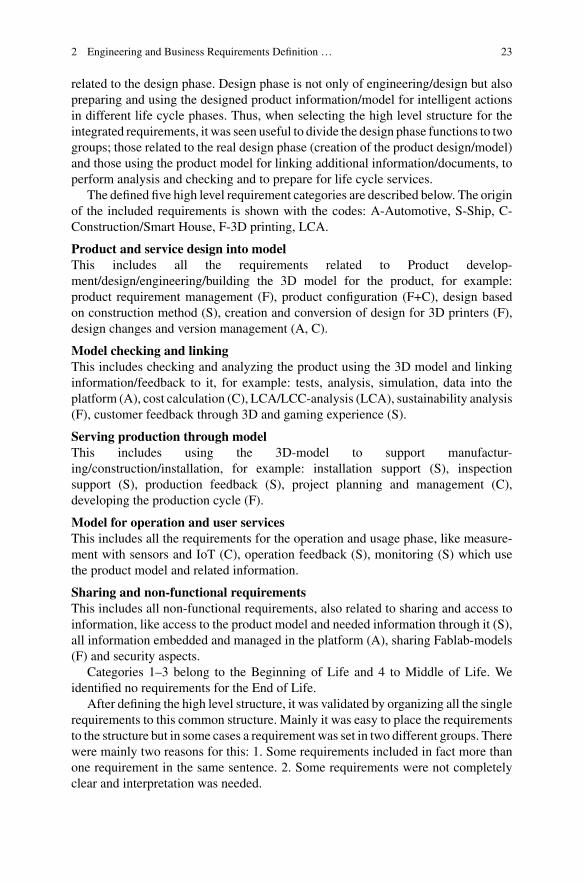
The defined five high level requirement categories are described below. The originof the included requirements is shown with the codes: A-Automotive, S-Ship, C-Construction/Smart House, F-3D printing, LCA.
Product and service design into modelThis includes all the requirements related to Product develop-ment/design/engineering/building the 3D model for the product, for example:product requirement management (F), product configuration (F+C), design basedon construction method (S), creation and conversion of design for 3D printers (F),design changes and version management (A, C).
Model checking and linkingThis includes checking and analyzing the product using the 3D model and linkinginformation/feedback to it, for example: tests, analysis, simulation, data into theplatform (A), cost calculation (C), LCA/LCC-analysis (LCA), sustainability analysis(F), customer feedback through 3D and gaming experience (S).
Serving production through modelThis includes using the 3D-model to support manufactur-ing/construction/installation, for example: installation support (S), inspectionsupport (S), production feedback (S), project planning and management (C),developing the production cycle (F).
Model for operation and user servicesThis includes all the requirements for the operation and usage phase, like measure-ment with sensors and IoT (C), operation feedback (S), monitoring (S) which usethe product model and related information.
Sharing and non-functional requirementsThis includes all non-functional requirements, also related to sharing and access toinformation, like access to the product model and needed information through it (S),all information embedded and managed in the platform (A), sharing Fablab-models(F) and security aspects.
Categories 1–3 belong to the Beginning of Life and 4 to Middle of Life. Weidentified no requirements for the End of Life.
After defining the high level structure, it was validated by organizing all the singlerequirements to this common structure. Mainly it was easy to place the requirementsto the structure but in some cases a requirement was set in two different groups. Therewere mainly two reasons for this: 1. Some requirements included in fact more thanone requirement in the same sentence. 2. Some requirements were not completelyclear and interpretation was needed.

24 I. Karvonen et al.
1.1 1.2 1.3 1.4 1.5 2.1 2.2 2.3 2.4 3.1 3.2 3.3 3.4 4.1 4.2 5.1 5.2 5.3 5.4 5.51.1 2 1 1 0 0 1 2 1 0 0 0 0 0 0 0 1 1 0 01.2 2 2 0 2 1 1 1 1 0 2 0 0 0 1 0 0 0 -11.3 1 1 0 2 0 2 1 0 0 0 0 0 1 0 0 1 01.4 1 0 0 1 2 1 0 0 1 1 1 1 1 0 1 11.5 0 0 1 1 0 0 0 1 1 1 2 2 2 0 -12.1 2 1 1 0 0 0 1 2 2 2 0 1 1 -12.2 0 2 0 0 0 1 1 0 0 0 0 -1 -12.3 0 0 0 0 0 0 0 0 -1 1 -1 -12.4 1 0 0 -1 0 1 -1 0 -1 -1 -13.1 2 2 1 0 0 -1 1 0 -1 -13.2 2 1 0 1 -1 0 0 0 13.3 1 0 0 -1 0 0 -1 -13.4 0 0 -1 0 -1 2 04.1 0 -1 0 -1 -1 04.2 0 0 2 0 05.1 0 2 0 -15.2 1 -1 05.3 -1 05.4 05.5
Aggregated requirementsA
ggre
gate
dre
q uire
men
ts
Fig. 2.3 Trade-off among macro-requirements. The scale used is the following: 2: strong positivecorrelation; 1: positive correlation; 0: no correlation; −1: negative correlation
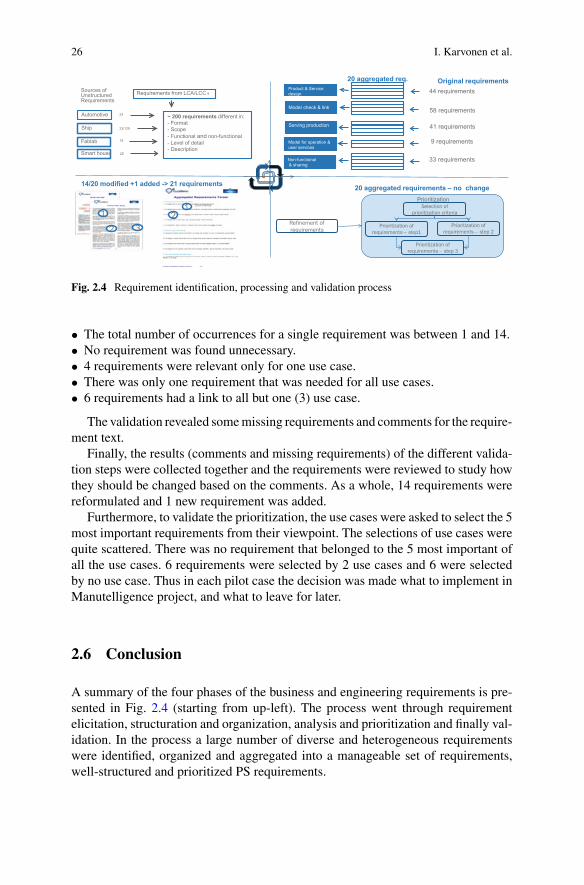
As a result of the aggregation all the ~200 requirements were aggregated into5 + 4 + 4 + 2 + 5 � 20 requirements (Fig. 2.2).
2.4.3 Results from Prioritization
The trade-off analysis (correlation between the requirements) was performed by theresearch partners. The results are shown in Fig. 2.3. Each aggregated requirementhas been given a number (for example 1.3), where the first number represents therequirement category.
The prioritization criteria were defined as follows: (1) Manutelligence-relatedprioritization criteria including Implementation time, Implementation cost, Technicalgap, Usability in other sectors, Scalability, PSS fitting, and Enabling collaboration.Weights for the criteria were also defined. (2) Pilot related criteria, for example,Design time, Change management agility, Improved communication with customersand Improved communication among designers. Each pilot defined its own set ofweights for the criteria, since it was expected that the relative importance of theperformance associated to the criteria vary depending on the specific context.
The Manutelligence-related criteria were applied for the 20 aggregated require-ments while the pilot-related for the original pilot requirements separately for eachpilot. The individual scores where then summarized to the aggregated requirements.
For the final ranking additionally a bonus system was defined. The basic ideawas that the score of an aggregated requirement obtained from the Manutelligence-related criteria consideration was increased by a bonus if the same requirement wasconsidered to be important also by one or more pilots.
It should be noted that the final list and the relative rank was not frozen at thispoint: the overall requirements engineering process followed a spiral approach andduring the development new interests also came up. Also, no requirements were

2 Engineering and Business Requirements Definition … 25
eliminated from the list in this phase, even though some of them were assigned alower score. The highest scores were received by the following requirements:
4.2 The service provider shall be able to manage the services and their data onthe platform.
2.1 Designers and experts shall be able to perform and manage real time costcalculation/LCC and LCA assessment along the design using the platform and thedata from design and previous projects.
1.1 The designer shall be able to systematically manage product requirements andtrace design changes and versions within the platform.
1.5 The collaboration network/community of designers shall be able to supportand contribute to the design on the platform.
2.5 Validation Results
In the individual walk through the pilot stories and to-be scenarios, 1–7 steps wereidentified for which there was no clear corresponding requirement. Mostly theseneeds were quite detailed or very specific. In addition there were some steps forwhich link to an existing requirement could be identified, but the requirement shouldsomehow be extended to cover a specific aspect. There were two main types ofcomments:
• The requirement should include “service” in addition to product. This is veryimportant as Manutelligence aims to support Product-Service design.
• In addition to other stakeholders, also customer or end user should have access tothe PS information. This is relevant as the customer interaction and participationis even more important when providing PS than when providing products.
Based on these comments, the aggregated requirements were reformulated tocover also services and customers/users.
All the four use cases participated in the validation workshop. First the 20 aggre-gated requirements were discussed and clarified with their source: which use casesand original requirements have affected to each requirement. Most of the require-ments were considered understandable but also some comments regarding themwerereceived from the use cases. These mainly included terminology.
The validation of requirements was performed in five groups: one for each usecase + one group for platform providers. The use case representatives were supportedby the research partners. The methodology described before was followed: the usecases went through the pilot story and identified the aggregated requirements, whichsupported the pilot story activity. The links between the pilot story steps and therequirements were marked with the same number. The idea was also to identifymissing requirements for supporting pilot steps.
The number of identified links for each aggregated requirement from the use caseswas identified. The following was observed:
26 I. Karvonen et al.
Sources of UnstructuredRequirements
Automotive
Ship
Fablab
Smart house
18
23/129
25
23
Requirements from LCA/LCC 9
~ 200 requirements different in:- Format- Scope- Functional and non-functional- Level of detail- Description
1
2 3
21 Comments
Refinement of requirements
Selection of prioritization criteria
Prioritization of requirements – step1
Prioritization of requirements – step 2
Prioritization of requirements – step 3
Prioritization
Product & Service design
Model check & link
Serving production
Model for operation &user services
Non-functional& sharing
44 requirements
58 requirements
41 requirements
9 requirements
33 requirements
Original requirements20 aggregated req.
20 aggregated requirements – no change14/20 modified +1 added -> 21 requirements
Fig. 2.4 Requirement identification, processing and validation process
• The total number of occurrences for a single requirement was between 1 and 14.• No requirement was found unnecessary.• 4 requirements were relevant only for one use case.• There was only one requirement that was needed for all use cases.• 6 requirements had a link to all but one (3) use case.
The validation revealed somemissing requirements and comments for the require-ment text.
Finally, the results (comments and missing requirements) of the different valida-tion steps were collected together and the requirements were reviewed to study howthey should be changed based on the comments. As a whole, 14 requirements werereformulated and 1 new requirement was added.
Furthermore, to validate the prioritization, the use cases were asked to select the 5most important requirements from their viewpoint. The selections of use cases werequite scattered. There was no requirement that belonged to the 5 most important ofall the use cases. 6 requirements were selected by 2 use cases and 6 were selectedby no use case. Thus in each pilot case the decision was made what to implement inManutelligence project, and what to leave for later.
2.6 Conclusion
A summary of the four phases of the business and engineering requirements is pre-sented in Fig. 2.4 (starting from up-left). The process went through requirementelicitation, structuration and organization, analysis and prioritization and finally val-idation. In the process a large number of diverse and heterogeneous requirementswere identified, organized and aggregated into a manageable set of requirements,well-structured and prioritized PS requirements.

2 Engineering and Business Requirements Definition … 27
The final list of 21 aggregated and validated requirements is the following:
1. Product service design into model
1.1 The user shall be able to systematicallymanage product and service require-ments and trace design changes and versions within the platform.
1.2 The user shall be able to manage the product and service structure to createproduct configuration and BOM on the platform.
1.3 The designer shall be able to use knowledge in the design based on previousmodels and the platform shall provide automatically the rules and designmethods.
1.4 The platform shall be able to make easily data conversions (CAD files,product models, visualization models, manufacturing models).
1.5 The collaboration network/community of designers shall be able to supportand contribute the design on the platform.
2. Model analysis and linking
2.1 Designers, customers and other users shall be able to perform, manage andview real time LCC and LCA. Here the data from design and previousprojects should be available.
2.2 The platform shall use the product model to link, manage and allow accessto all the results of (quality) tests and simulations.
2.3 The customer shall be able to view the visual product model (includingvirtual walk/driving) and give feedback on it using the platform.
2.4 The designer and the production shall be able to link and manage infor-mation, data and documents in the product model supported by platformspecifications and rules.
3. Serving production through model
3.1 The production personnel and the customer shall be able to use the productmodel on the platform to support and monitor production, installation andto give feedback for the design.
3.2 Project manager and customer shall be able to use themodel on the platformto plan, monitor and manage the contract and the production.
3.3 The manufacturer/production coordinator/user shall be able to manage theproduction resources and suppliers through the platform.
3.4 The production/quality management shall be able to manage and follow thequality and failure data on the platform.
4. Model for operation and user services
4.1 The user/ service provider shall be able to monitor the behaviour of theproduct using the product model and linked sensors with access to the plat-form.
4.2 The service provider and the customer shall be able to manage the servicesand their data on the platform.
28 I. Karvonen et al.
5. Non-functional requirements (including sharing information)
5.1 All information shall be managed and embedded in a common platform,which is applicable for different industrial sectors.
5.2 The platform shall provide user management and allow access to stakehold-ers according their rights and needs.
5.3 The platform shall support sharing and communication, alsoremotely/online/off-line.
5.4 The platform shall manage data security and quality (including metadata).5.5 User interface of the platform services shall be easy to use and include user
support, like tutorials.5.6 The platform should allow to display PSS-related advertisements for the
customer and support the selling process for additional products and servicesin dependency of a PSS’s life cycle phase and its actual condition (forexample by visualizing them in the product context).
These aggregated requirements were used in the development phase to supportthe platform and pilot development. In the final phase of the project the implementedsolution (pilots and the platform) was validated against the aggregated requirements.
References
1. Aronson J (1995) A pragmatic view of thematic analysis. Qual Rep 2(1):1–3. Retrieved fromhttp://nsuworks.nova.edu/tqr/vol2/iss1/3. Accessed 13 Dec 2017
2. Sawyer P, Kotonya G (2001) Software requirements. SWEBOK, 93. Sommerville I, Kotonya G (1998) Requirements engineering: processes and techniques. Wiley,
New York
Open Access This chapter is licensed under the terms of the Creative Commons Attribution 4.0International License (http://creativecommons.org/licenses/by/4.0/), which permits use, sharing,adaptation, distribution and reproduction in any medium or format, as long as you give appropriatecredit to the original author(s) and the source, provide a link to the Creative Commons license andindicate if changes were made.
The images or other third party material in this chapter are included in the chapter’s CreativeCommons license, unless indicated otherwise in a credit line to the material. If material is notincluded in the chapter’s Creative Commons license and your intended use is not permitted bystatutory regulation or exceeds the permitted use, you will need to obtain permission directly fromthe copyright holder.
Chapter 3Life Cycle Managementfor Product-Service Systems
Stefan Wellsandt, Laura Cattaneo, Daniele Cerri, Sergio Terzi,Donatella Corti, Christian Norden and Reinhard Ahlers
Abstract Product-Service Systems (PSS) and the Internet of Things (IoT) are tworelated concepts. This chapter describes an approach to manage PSS along its lifecycle. It includes a design methodology for PSS and a systems modelling method.The former supports designers in defining PSSs that incorporate monitoring, control,optimization or autonomy. It includes a newmethod to assess a product’s functional-ity in terms of the data needed for its realization. The latter adopts life cycle thinkingand employs amodelling language to outline the PSS and its various components andactors. A life cycle performance analysis could benefit from the model by extract-ing cost information from it for further analysis. This chapter highlights challengesrelated to PSS life cycle management observed during the Manutelligence project.They concern the design methodology and the applied life cycle modelling method.
S. Wellsandt (B)BIBA—Bremer Institut für Produktion und Logistik GmbH at the University of Bremen,Hochschulring 20, 28359 Bremen, Germanye-mail: [email protected]
L. Cattaneo · D. Cerri · S. TerziDepartment of Economics, Management and Industrial Engineering, Politecnico di Milano,20156 Milan, Italye-mail: [email protected]
D. Cerrie-mail: [email protected]
S. Terzie-mail: [email protected]
D. CortiDepartment of Innovative Technologies SUPSI, University of Applied Sciences and Artsof Southern Switzerland, 6928 Manno, Switzerlande-mail: [email protected]
C. Norden · R. AhlersBalance Technology Consulting GmbH, 28203 Bremen, Germanye-mail: [email protected]
R. Ahlerse-mail: [email protected]
© The Author(s) 2019L. Cattaneo and S. Terzi (eds.), Models, Methods and Tools for Product ServiceDesign, PoliMI SpringerBriefs, https://doi.org/10.1007/978-3-319-95849-1_3
29
30 S. Wellsandt et al.
3.1 Product-Service Systems and the Internet of Things
A PSS is an integrated product and service offering that delivers value in use to thecustomer. There are several potential benefits of PSSs. First, there is an increaseof revenues, because services tend to have higher profit margins and can provide astable source of revenues. Second, they are means to differentiate offers in mass-markets, which are typically characterized by commodities and technologies. Third,services bring a decrease of variability and volatility of cash flow throughout the lifeof a product resulting in a higher shareholder value [1]. PSS is a complex concept,because it is composed of several parts that need to be managed: a product and oneor more related services, a network of stakeholders and a supporting infrastructure[2]. The different product aspects, such as the concept and design phases and thelife cycle, have been analyzed deeper by many authors [3], while the service topic ismore recent and first attempts exist for structuring the service design [4].
The IoT technologies promote the business model of PSS. They enable new ser-vices related to the connectivity and the usage of environmental data. Connectedsmart products offer expanding opportunities for new functionality, greater reliabil-ity, higher product utilization and capabilities that cut across and transcend traditionalproduct boundaries [5]. Terms like Cyber-Physical Systems (CPS), IoT and VirtualReality have become ordinary in industries. IoT products raise a new set of strategicchoices related to
• how value is created and captured,• how the amount of data they generate is utilized and managed, and• what role companies should play as industry boundaries are expanded [5].
Smart products have threemain components: physical components, smart compo-nents and connectivity components. Smart components are directly connected withservices related to the physical parts, while connectivity allows exchanging informa-tion between the product and its environment, and enables services to exist outsidethe physical product itself [5].
Intelligence and connectivity enable an entirely new set of product functions andcapabilities, which can be grouped into four areas: monitoring, control, optimization,and autonomy [5]. A product can potentially incorporate all four. Each capability isvaluable in its own right and sets the stage for the next level. For example, monitoringcapabilities are the foundation for product control, optimization, and autonomy.
• Monitoring: smart, connected products enable the monitoring of a product’scondition, operation and external environment through sensors and external datasources. A product can alert users or others stakeholders to changes in circum-stances or performance. Monitoring also allows companies and customers to tracka product’s operating characteristics and history. It improves the understandingof how the product is actually used. The collected data has implications for: (1)design by reducing over-engineering and improving market segmentation throughthe analysis of usage patterns by customer type; (2) after-sale service by allowingthe dispatch of the right technician with the right part to improve the first-time fix
3 Life Cycle Management for Product-Service Systems 31
rate. Monitoring data may also reveal warranty compliance issues, as well as newsales opportunities, such as the need for additional product capacity because ofhigh utilization.
• Control: smart, connected products can be controlled through remote commandsor algorithms that are built into the device or reside in the product cloud.Algorithmsare rules that direct the product to respond to specific changes in its condition orenvironment (for example, “if pressure gets too high, shut off the valve” or “whentraffic in a parking garage reaches a certain level, turn the overhead lighting on oroff”). Control through software embedded in the product or the cloud allows thecustomization of product performance to a degree that was not cost effective oroften even possible before. The same technology also enables users to control andpersonalize their interaction with the product in many new ways. For example,users can adjust their smart light bulbs via smartphone, turning them on and off,programming them to blink red if an intruder is detected, or dimming them slowlyat night.
• Optimization: smart, connected products can apply algorithms and analytics to in-use or historical data to improve output, utilization, and efficiency. Inwind turbines,for instance, a local microcontroller can adjust each blade on every revolutionto capture maximum wind energy. Each turbine can be adjusted to improve itsperformance and to minimize its impact on the efficiency of those nearby. The richflow ofmonitoring data from smart, connected products, coupled with the capacityto control product operation, allows companies to optimize product performancein numerous ways, many of which have not been previously possible.
• Autonomy: monitoring, control and optimization capabilities combine to allowsmart, connected products to achieve a previously unattainable level of autonomy.At the simplest level an autonomous product does operation using sensors andsoftware on real time. More-sophisticated products are able to learn about theirenvironment, self-diagnose their own service needs, and adapt to users’ prefer-ences. Autonomy not only can reduce the need for operators, but it can improvesafety in dangerous environments and facilitate operation in remote locations.Autonomous products can also act in coordination with other products and sys-tems. The value of these capabilities can grow exponentially as more and moreproducts become connected.
Connected products require the design of a new technology infrastructure madeof multiple layers. It is necessary to identify sensors, software, data storage, userinterfaces as well as ports, protocols and kind of connections to design the PSS.
The IoT could underpin the PSS design by using information feedback at anystage of the Product-Service life cycle. Moreover, IoT provides information for con-tinuous improvement, closer relationship with stakeholders, resource efficiency andthe ability to meet sustainability. IoT provides the opportunity to obtain informa-tion about some relevant parts of the system in real time, during all the life cycleprocesses, thus representing a differential in order to build, design, implement andimprove a PSS.
32 S. Wellsandt et al.
3.2 Life Cycle Thinking, Modelling and Management
The following paragraphs adopt the findings of a literature survey published in theInternational Journal for Product Life cycle Management [6]. The study investigatedthe constituents of life cycle models.
Life cycle is a concept used in Biology where it describes the recurring changeof states for certain organisms (see [7] for biological life cycle). In engineering, theorganisms are exchanged for tangible goods (products). Processes, such as design,production, use, repair, recycling anddisposal substitute the organism’s state changes.From theperspective of business economics, the concept of the product life cycleswasintroduced by Theodore Levitt in the 1960s [8]. Levitt’s approach describes the lifecycle of products by four phases: introduction into the market, rapid growth of salesvolume, market saturation and market decline. The introduction of Levitt’s productlife cycle model supports the strategic management of products. Manutelligencefocused on the engineering life cycle.
Life cycle thinkingmeans that people have a life cycle model in mind that affectsthe scope of their activities during, for instance, system development and production.In Manutelligence, a life cycle model describes activities related to a PSS in a sim-plified way. It consists of elements that represent the transformation of the product,software or service over time, whereas the notion of ‘transformation’ is adopted fromoperations management [9]. A transformation changes inputs (e.g. rawmaterial) intooutputs (e.g. machine) of a higher quality and a higher value. Processes and/or thestakeholders performing specific processes represent the transformation.
Technological advances, such as the IoT, resulted in developments that influencelife cycle thinking. Effects of these developments and common characteristics of aPSS’s life cycle are summarized in Table 3.1. The presented concepts are not meantto be comprehensive.
Examples for the influence of life cycle thinking on engineering are Life CycleAssessment and Life Cycle Costing. The adoption of life cycle thinking in industryand academia led to the emergence of a plethora of different life cycle models asinvestigated by Wellsandt et al. [6]. Manutelligence focused on the flow of codifiedinformation along the life cycle.
Life cycle management, in the Manutelligence project, focuses on the manage-ment of information along the PSS life cycle. The specialization on PSS is a rathernew discipline, because the adoption of Servitization, Intelligent Products and theInternet of Things is not very high in most industries. Consequently, the experiencewith this PSS life cycle management is low, compared to the information manage-ment for tangible products or software. One of the challenges of PSS life cyclemanagement is the fact that a PSS consists of integrated hardware, software and ser-vice components. This is especially true, if the PSS has connectivity-based features.In this context, integration has several meanings, for example, the:
1 Integration of ICT into traditional products (Intelligent/Smart Products).2 Integration of hard- and software development (Concurrent Engineering).3 Integration of PSS software into third party software (Interoperability).4 Integration of services into existing business processes.
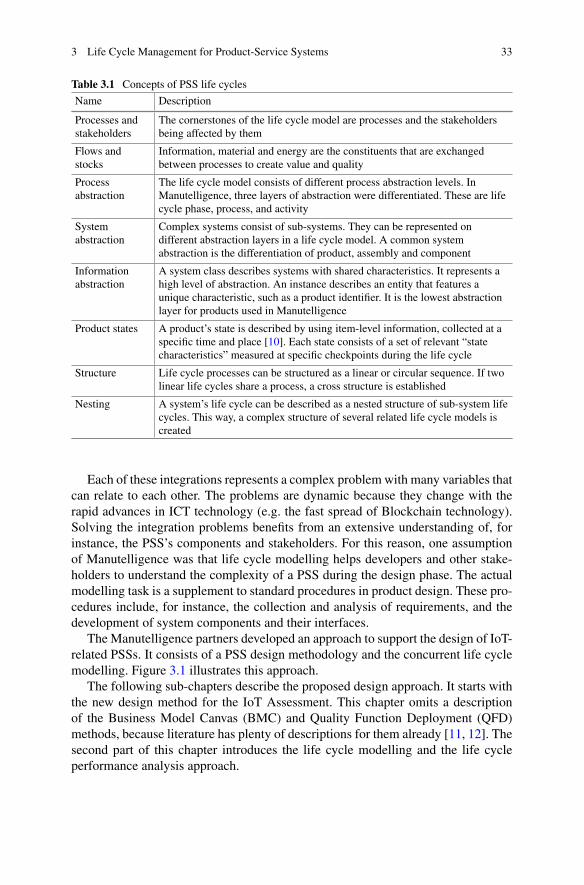
3 Life Cycle Management for Product-Service Systems 33
Table 3.1 Concepts of PSS life cycles
Name Description
Processes andstakeholders
The cornerstones of the life cycle model are processes and the stakeholdersbeing affected by them
Flows andstocks
Information, material and energy are the constituents that are exchangedbetween processes to create value and quality
Processabstraction
The life cycle model consists of different process abstraction levels. InManutelligence, three layers of abstraction were differentiated. These are lifecycle phase, process, and activity
Systemabstraction
Complex systems consist of sub-systems. They can be represented ondifferent abstraction layers in a life cycle model. A common systemabstraction is the differentiation of product, assembly and component
Informationabstraction
A system class describes systems with shared characteristics. It represents ahigh level of abstraction. An instance describes an entity that features aunique characteristic, such as a product identifier. It is the lowest abstractionlayer for products used in Manutelligence
Product states A product’s state is described by using item-level information, collected at aspecific time and place [10]. Each state consists of a set of relevant “statecharacteristics” measured at specific checkpoints during the life cycle
Structure Life cycle processes can be structured as a linear or circular sequence. If twolinear life cycles share a process, a cross structure is established
Nesting A system’s life cycle can be described as a nested structure of sub-system lifecycles. This way, a complex structure of several related life cycle models iscreated
Each of these integrations represents a complex problem with many variables thatcan relate to each other. The problems are dynamic because they change with therapid advances in ICT technology (e.g. the fast spread of Blockchain technology).Solving the integration problems benefits from an extensive understanding of, forinstance, the PSS’s components and stakeholders. For this reason, one assumptionof Manutelligence was that life cycle modelling helps developers and other stake-holders to understand the complexity of a PSS during the design phase. The actualmodelling task is a supplement to standard procedures in product design. These pro-cedures include, for instance, the collection and analysis of requirements, and thedevelopment of system components and their interfaces.
The Manutelligence partners developed an approach to support the design of IoT-related PSSs. It consists of a PSS design methodology and the concurrent life cyclemodelling. Figure 3.1 illustrates this approach.
The following sub-chapters describe the proposed design approach. It starts withthe new design method for the IoT Assessment. This chapter omits a descriptionof the Business Model Canvas (BMC) and Quality Function Deployment (QFD)methods, because literature has plenty of descriptions for them already [11, 12]. Thesecond part of this chapter introduces the life cycle modelling and the life cycleperformance analysis approach.

34 S. Wellsandt et al.
Fig. 3.1 Manutelligence PSS design approach
3.3 Approach to Design IoT-Related PSS
3.3.1 Design Methodology
This part of the chapter is based on the Manutelligence public Deliverable 2.2 [13].The main goal of the methodology is to structure the PSS’s concept and design pro-cesses with a focus on the identification of the IoT technologies needed to catch andelaborate data for customer need satisfaction, and for the design of suitable services.The idea is to connect different activities and methods, to elicit data and information.The methodology is modular, different activities are optional, and they do not needto be performed in a specific order. Within these main activities, we include the defi-nition of the business model, the definition of the stakeholders’ requirements and thedefinition of the IoT capabilities. Besides these three tasks, there are other tasks to beconsidered, especially concerning the design of the actual solution components. Themain activities should be completed and integrated with other important information,as well as the addition of hard and software functionalities and business processes.
We will focus on the definition of the IoT capabilities, which represents the inno-vative part of the methodology developed during the Manutelligence project.
3.3.2 IoT Assessment Support
This activity represents the core part of the proposedmethodology, since it defines thebases for the PSS design phase. The outputs of this process will be the Bill ofMaterial(BOM) of the product, the definition of the connected services and the identificationof data, information and knowledge that should be managed and analyzed during theProduct-Service life cycle. Connect products require the design of a new technology

3 Life Cycle Management for Product-Service Systems 35
infrastructuremade up ofmultiple layers. It is necessary to identify sensors, software,data storage, user interfaces as well as ports, protocols and kind of connections todesign the PSS. Furthermore, it is necessary to satisfy the stakeholders’ requirements,which should be previously analyzed, for instance with a QFD.
Usually the Product Design and the Service Design processes are separately per-formed within specialized teams. This produces solutions that often are not reallyintegrated. The innovation of the Manutelligence methodology aims to improve theintegration between Product and Service Design, in order to give to customers thebest PSS solution.
Starting from the requirements defined in a previous phase, the team will imple-ment the Product-Service Design with the primary aim of defining the IoT capabili-ties that should be integrate in the product life cycle, in order to properly design theconnected services.
The idea is to develop a graphical tool that can be used by designers to identifyand classify the IoT capabilities that should be embedded in the product. This toolhas to include:
• The classification of the capabilities of the smart product, which can be groupedinto four areas [5]: monitoring, control, optimization and autonomy. This classi-fication specifies the kind of service a company wants to implement thanks to theIoT technology.
• The definition of data destination. It is necessary to define the stakeholder whoneeds a specific kind of information (e.g. customer, designer, andmaintainer). Thisis important also to identify the format with which data or analysis results shouldbe shown and the support that must be used, in order to read and share data andresults. For example, customers would like to have access to data directly fromtheir smartphone.
• The identification of the product parts in which sensors should be installed in orderto collect data.
To implement the graphical tool, we exploit the BOM, which should be developedin the Product Design phase. The BOM is particularly useful to identify the product’sparts. Parts and components define a specific number of details and levels. For eachof these levels, we design a specific graphic structure. For instance, for a smart car,at level 0 we have the vehicle. Level 1 composes of the Power Unit, the Gear Boxand the Car Body (Fig. 3.2).
For each level, the product’s parts are reported as input for the designed table.The first column identifies the data destination and the stakeholders involved in theservice. The entries of the table are colored following the capabilities classification(i.e. monitoring is green colored, control is yellow colored, optimization is orangecolored and autonomy is red colored,) and the entries are filled indicating the variable.If a box remains white, this means that no IoT capabilities are defined for that entry.The IoTcapability is selected, in order to satisfy the product and service requirements.This classification is an important initial stage, since a specific IoT capability definesthe correspondent technology to select, for example, sensors or data storage systemsand clarify the kind of connection that must be developed.
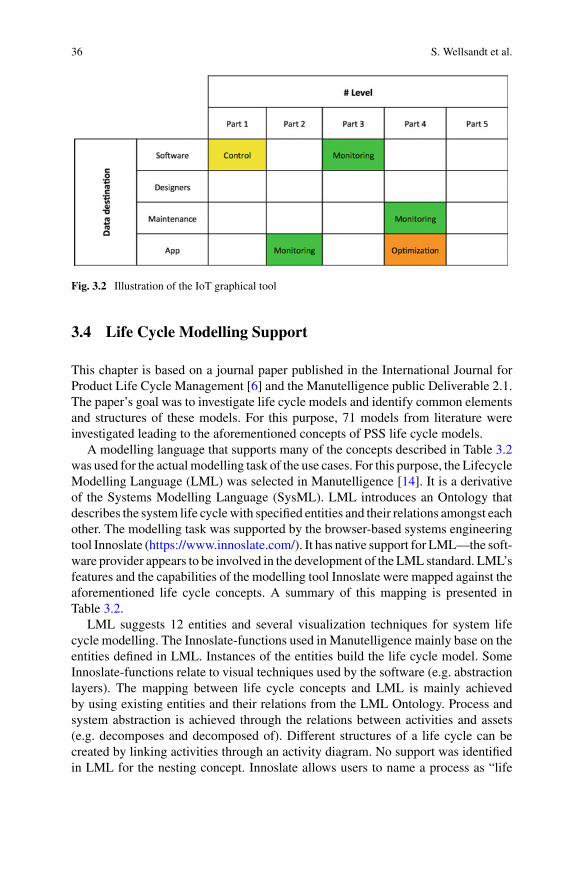
36 S. Wellsandt et al.
Fig. 3.2 Illustration of the IoT graphical tool
3.4 Life Cycle Modelling Support
This chapter is based on a journal paper published in the International Journal forProduct Life Cycle Management [6] and the Manutelligence public Deliverable 2.1.The paper’s goal was to investigate life cycle models and identify common elementsand structures of these models. For this purpose, 71 models from literature wereinvestigated leading to the aforementioned concepts of PSS life cycle models.
A modelling language that supports many of the concepts described in Table 3.2was used for the actualmodelling task of the use cases. For this purpose, the LifecycleModelling Language (LML) was selected in Manutelligence [14]. It is a derivativeof the Systems Modelling Language (SysML). LML introduces an Ontology thatdescribes the system life cyclewith specified entities and their relations amongst eachother. The modelling task was supported by the browser-based systems engineeringtool Innoslate (https://www.innoslate.com/). It has native support for LML—the soft-ware provider appears to be involved in the development of the LML standard. LML’sfeatures and the capabilities of the modelling tool Innoslate were mapped against theaforementioned life cycle concepts. A summary of this mapping is presented inTable 3.2.
LML suggests 12 entities and several visualization techniques for system lifecycle modelling. The Innoslate-functions used in Manutelligence mainly base on theentities defined in LML. Instances of the entities build the life cycle model. SomeInnoslate-functions relate to visual techniques used by the software (e.g. abstractionlayers). The mapping between life cycle concepts and LML is mainly achievedby using existing entities and their relations from the LML Ontology. Process andsystem abstraction is achieved through the relations between activities and assets(e.g. decomposes and decomposed of). Different structures of a life cycle can becreated by linking activities through an activity diagram. No support was identifiedin LML for the nesting concept. Innoslate allows users to name a process as “life
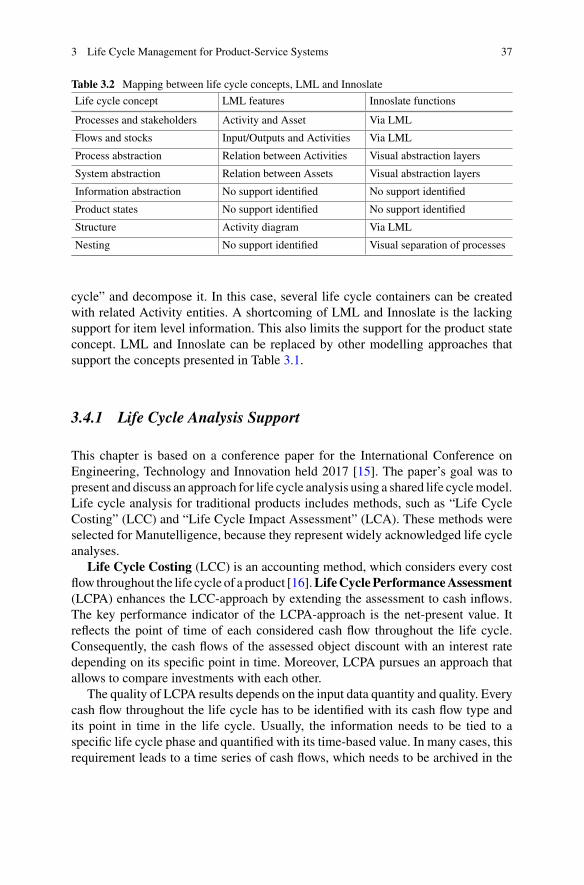
3 Life Cycle Management for Product-Service Systems 37
Table 3.2 Mapping between life cycle concepts, LML and Innoslate
Life cycle concept LML features Innoslate functions
Processes and stakeholders Activity and Asset Via LML
Flows and stocks Input/Outputs and Activities Via LML
Process abstraction Relation between Activities Visual abstraction layers
System abstraction Relation between Assets Visual abstraction layers
Information abstraction No support identified No support identified
Product states No support identified No support identified
Structure Activity diagram Via LML
Nesting No support identified Visual separation of processes
cycle” and decompose it. In this case, several life cycle containers can be createdwith related Activity entities. A shortcoming of LML and Innoslate is the lackingsupport for item level information. This also limits the support for the product stateconcept. LML and Innoslate can be replaced by other modelling approaches thatsupport the concepts presented in Table 3.1.
3.4.1 Life Cycle Analysis Support
This chapter is based on a conference paper for the International Conference onEngineering, Technology and Innovation held 2017 [15]. The paper’s goal was topresent and discuss an approach for life cycle analysis using a shared life cyclemodel.Life cycle analysis for traditional products includes methods, such as “Life CycleCosting” (LCC) and “Life Cycle Impact Assessment” (LCA). These methods wereselected for Manutelligence, because they represent widely acknowledged life cycleanalyses.
Life Cycle Costing (LCC) is an accounting method, which considers every costflow throughout the life cycle of a product [16].LifeCyclePerformanceAssessment(LCPA) enhances the LCC-approach by extending the assessment to cash inflows.The key performance indicator of the LCPA-approach is the net-present value. Itreflects the point of time of each considered cash flow throughout the life cycle.Consequently, the cash flows of the assessed object discount with an interest ratedepending on its specific point in time. Moreover, LCPA pursues an approach thatallows to compare investments with each other.
The quality of LCPA results depends on the input data quantity and quality. Everycash flow throughout the life cycle has to be identified with its cash flow type andits point in time in the life cycle. Usually, the information needs to be tied to aspecific life cycle phase and quantified with its time-based value. In many cases, thisrequirement leads to a time series of cash flows, which needs to be archived in the
38 S. Wellsandt et al.
ex-post perspective or forecasted in the ex-ante perspective. In the next steps, thegathered data has to be translated into a software-tool to perform the LCPA.
The general LCPA approach can be adapted for the assessment of PSS. Besidesthe relevant input data for products, such as investments, energy costs, maintenanceand other operating costs, the analysis of the service part requires input data thatis more focused on, for instance, personnel costs, equipment usage to perform theservice, travel costs, as well as service fees as revenues. As a result, the comparativeLCPA approach enables the evaluation of different PSS concepts with each other.
The main reference to carry out a Life Cycle Impact Assessment (LCA) is theISO 14000 family of standards. They provide a set of international guidelines quitestable, subjected to periodic updates, internationally recognized and used as referenceat global level. The identified and renowned structure of an LCA study is organizedinto four phases:
• Definition of the goal and scope of LCA. It defines why the LCA is performedand what the system boundaries are.
• Life Cycle Inventory (LCI) analysis. The exchanged natural elements and theirquantities of the resources and emissions entering (e.g. raw material, energy andancillary material) and leaving the system of interest (e.g. emission, waste, prod-ucts and co-products) have to be defined. This step is complex and time consuming,since it involves data collection from several different actors and related processesalong the supply network. The allocation process of shared resources is a criticalpoint and has an impact on the final result.
• Life Cycle Impact Assessment (LCIA). It is meant to calculate the impacts onthe environment generated by the identified LCI data.
• Interpretation. In thefinal phase, the reportwith the quantified impacts is preparedand the critical review of the LCA results is performed.
The ISO 14050 standard has been developed with a physical product focus, eventhough the provided definition of “product” states “any good or service“. This meansthat services are conceptually considered, yet the PSS concept is not consideredexplicitly. For this reason, the ISO-based LCA approach might not be applicableto the PSS context directly. The main difficulty when carrying out an LCA for aPSS is how to integrate the service component into the LCI. Corti et al. proposed anapproach to support the LCI phase for PSSs [17]. It could formalize the integrationof information related to the service part of the offer. Categories of information andtheir positioning along the life cycle of the PSS are taken into consideration showingthe backbone structure that is recommended to carry out the LCI for a PSS. The lifecycle divides into its three main phases, namely Beginning of Life (BOL), Middle ofLife (MOL) and End of Life (EOL), whilst the data categories are related to eitherthe product component or the service component.
Guidelines for gathering the information to support the LCA methodology arestill missing [18, 19]. Dal Lago et al. propose a conceptual work in this direction[20]. The authors develop a set of guidelines to gather the information needed toinstantiate and support an LCA analysis from a PSS life cycle perspective.
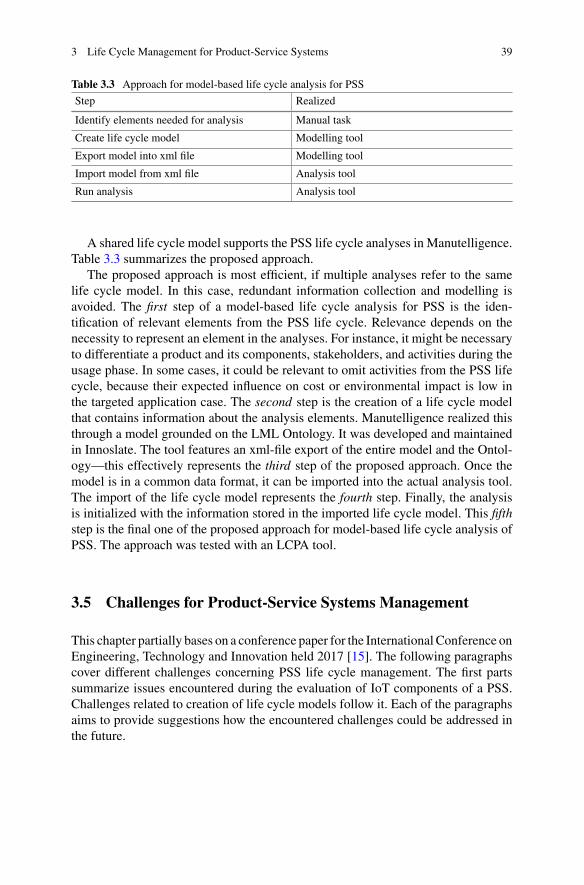
3 Life Cycle Management for Product-Service Systems 39
Table 3.3 Approach for model-based life cycle analysis for PSS
Step Realized
Identify elements needed for analysis Manual task
Create life cycle model Modelling tool
Export model into xml file Modelling tool
Import model from xml file Analysis tool
Run analysis Analysis tool
A shared life cycle model supports the PSS life cycle analyses in Manutelligence.Table 3.3 summarizes the proposed approach.
The proposed approach is most efficient, if multiple analyses refer to the samelife cycle model. In this case, redundant information collection and modelling isavoided. The first step of a model-based life cycle analysis for PSS is the iden-tification of relevant elements from the PSS life cycle. Relevance depends on thenecessity to represent an element in the analyses. For instance, it might be necessaryto differentiate a product and its components, stakeholders, and activities during theusage phase. In some cases, it could be relevant to omit activities from the PSS lifecycle, because their expected influence on cost or environmental impact is low inthe targeted application case. The second step is the creation of a life cycle modelthat contains information about the analysis elements. Manutelligence realized thisthrough a model grounded on the LML Ontology. It was developed and maintainedin Innoslate. The tool features an xml-file export of the entire model and the Ontol-ogy—this effectively represents the third step of the proposed approach. Once themodel is in a common data format, it can be imported into the actual analysis tool.The import of the life cycle model represents the fourth step. Finally, the analysisis initialized with the information stored in the imported life cycle model. This fifthstep is the final one of the proposed approach for model-based life cycle analysis ofPSS. The approach was tested with an LCPA tool.
3.5 Challenges for Product-Service Systems Management
This chapter partially bases on a conference paper for the International Conference onEngineering, Technology and Innovation held 2017 [15]. The following paragraphscover different challenges concerning PSS life cycle management. The first partssummarize issues encountered during the evaluation of IoT components of a PSS.Challenges related to creation of life cycle models follow it. Each of the paragraphsaims to provide suggestions how the encountered challenges could be addressed inthe future.
40 S. Wellsandt et al.
3.5.1 IoT Assessment
The IoT assessment method is the original contribution of our methodology, sinceother phases are actually well-knownmethodologies already used in several differentfields [11, 12]. The IoT assessment graphical tool should be able to design howinformation and data collected through IoT technologies have to be integrated alongthe PSS life cycle. We present a list of questions that the IoT assessment tool shouldbe able to answer and we identify which points need further developments andimprovements.
Why? Why we want to use IoT technologies? Which is the service we want todevelop? Which particular function we want to perform? Even if these points shouldcome straightforward from the HoQ requirements, the IoT assessment should high-light these goals, in order to keep focus on them. The graphical tool registers the IoTcapabilities that should be implemented in the PSS, as suggested in [5].
Who?Who is involved, which are the different stakeholders that take part in thisprocess?The actual graphical tool, during its application toManutelligence use cases,turned out to be a little bit confusing, since we have put as data destination designers,maintenance, applications and software. Actually, the presence of hardware andsoftware is always mandatory, because data are collected and analyzed with softwaresupport. Only after these first steps, processed data could be visualized/used bysomeone else, for example, designers could use analytics results to improve productdesign and product development.
What?Whatwewant tomeasure?Whichdata and informationwewant to collect?Looking at the graphical support, we have no information regarding which variablesand data should be collected along the process.
Where? Where we have to insert and install sensors? Which components of theproduct are involved in the collection of information? We answer to this questionusing information coming from the BOM. At this moment we investigate all thedifferent BOM levels, but how it turned out from its application to Manutelligenceuse cases, this could request too much effort than what is really needed. For example,the level of details in a car’s BOM could be deep and even unnecessary for this aim.In principle, the BOM could be used only to identify and take note of parts involvedin the data collection process.
When? Which phase of the product life cycle is involved? When informationis collected? When information and data could be used? It could be necessary tohighlight, which are the PSS life cycle phases involved in the process, also to easilyidentify stakeholders and different flows of data and information between them. Forexample, data collected from machine-embedded sensors (MOL phase) could besent to maintainers to realize predictive maintenance (MOL phase). Data collectedduring the product usage (MOL phase) could be sent to designers, in order to improveproduct design and product development (BOL phase).
With What? What kind of technology should be developed? What about hard-ware and software installed and used to collect, analyze and share data? Which dataanalysis should be performed? In the graphical tool, we do not mention the tech-
3 Life Cycle Management for Product-Service Systems 41
nologies that should be put in place, in order to collect data and allow connectivity(hardware, ports, protocols and kind of connections) even if this point is important,in order to check if all the different devices are able to be connected one with eachother. As some of the use cases have highlighted during project development, it isalso important to perform a feasibility analysis, to compare benefits and costs of thetechnology investment. The graphical tool should also contain an initial definition ofthe statistical techniques that should be used to analyze data.Whenmachine learningtechniques are implemented from some software, data are directly processed froman algorithm and results are made available for further analysis (for example, afterCluster Analysis it could be decided to perform a Classification Rules Analysis). Insome cases, the presence of a data scientist could be requested, which could takesome raw or processed data and perform further analysis or post processing oper-ations, in order to organize the output such that it is easily understandable. Onlyafter these intermediary steps, data could be available to be read and used by otherstakeholders.
3.5.2 Life Cycle Modelling
Model complexity. Complexity refers to the number of elements and relations ina life cycle model. The investigated use cases in Manutelligence feature around100 elements and more than 100 relations (using the LML Ontology). The requirednumber of elements depends on the model’s purpose and on the PSS. A support ofmultiple life cycle analyses (and other tasks) may lead to the need to include addi-tional elements and relations. Higher complexity will likely make the managementof the model more difficult (e.g. adding, removing and updating elements). Addingelements to the life cycle model can be avoided if two or more tasks share an element.Additional relations, however, might be necessary in the case of element sharing.
Model dynamics. The concept of dynamics refers to the need that a model’selements and relations may evolve over time (depending on the model’s purpose).In the course of the PSS design and operations, for instance, the model is subjectto extension or reduction. Elements and relations change depending on the needs ofthe decision makers involved in the related tasks. This is especially the case whenthe model is also used as a PSS planning tool—as experienced in Manutelligence.Maintaining a life cycle model, i.e. keeping it updated to the most recent planningstate, can be a time consuming task. The time needed to maintain a model depends,among others, on the complexity of themodel. For instance, it is a difficult task to addan element and its relations to a model with several hundreds of elements and evenmore relations. In the case of Manutelligence, the maintenance of the model was notexperienced as difficult. Possibly, because the model is not yet complex enough toaffect maintenance.
Modelling tools. Creation and maintenance of a life cycle model can be difficulttasks that should be supported with software tools. The decision to use LML for ourstudy limits the number of tools to support this task. The only tool that integrates it
42 S. Wellsandt et al.
“out of the box” is called Innoslate. Key persons from the company behind this toolare contributors to the LML specification. The logic of LML may be replicated withother tools, such as Enterprise Architect and the ARIS toolbox. Life cycle modellingtools should, in general, satisfy the needs of the stakeholders involved in the PSS lifecycle. In the case of life cycle analysis, the stakeholders (analysts) need to access(read) life cycle model information that is relevant for their analysis task. A completemodel export with subsequent file parsing, as realized in Manutelligence, is only atemporary solution. This is, amongst other reasons, because the parsing could missan element that is not following the convention of the parsing mechanism. A simpleexample is a typo in the element name. In order to solve this and other data qualityproblems, a reliable life cycle model exchange mechanism is needed.
References
1. Cavalieri S, Pezzotta G (2012) Product–service systems engineering: state of the art andresearch challenges. Comput Ind 63(4):278–288
2. Goedkoop MJ (1999) Product service systems, ecological and economic basics. Ministry ofHousing, Spatial Planning and the Environment, Communications Directorate
3. UlrichKT, Eppinger SD (2008) Product design and development, 4th edn, Internat edn. Boston:McGraw-Hill/Irwin
4. Aurich JC, Mannweiler C, Schweitzer E (2010) How to design and offer services successfully.CIRP J Manuf Sci Technol 2(3):136–143
5. Porter ME, Heppelmann JE (2014) How smart, connected products are transforming competi-tion. Harvard Bus Rev 92(11):64–88
6. Wellsandt S,Nabati E,Wuest T,HribernikKA,ThobenKD (2016)A survey of product lifecyclemodels: towards complex products and service offers. Int J Prod Lifecycle Manage 9(4):353
7. Bell G, Koufopanou V (1991) The architecture of the life cycle in small organisms. PhilosTrans R Soc Lond B: Biol Sci 332(1262):81–89
8. Levitt T (1965) Exploit the product life cycle. Harvard Bus Rev 43:81–949. Grabner T (2014) OperationsManagement: Auftragserfüllung bei Sach- und Dienstleistungen,
2 edn (Aktualisierte Aufl.). Wiesbaden: Springer Gabler10. Wuest T, Irgens C, Thoben K-D (2014) An approach to monitoring quality in manufacturing
using supervised machine learning on product state data. J Intell Manuf 25(5):1167–118011. Osterwalder A, Pigneur Y (2010) Businessmodel generation: a handbook for visionaries, game
changers, and challengers. Wiley, New York12. Akao Y (2004) Quality function deployment. Productivity Press13. Manutelligence consortium, “Manutelligence project” (2015) [Online] Available: http://www.
manutelligence.eu/. Accessed 21 Jan 201614. Lifecyclemodeling.org, “Lifecycle Modeling Language” (2017) [Online] Available: http://
www.lifecyclemodeling.org/. Accessed 29 Aug 201715. Wellsandt S et al (2017) Model-supported lifecycle analysis: an approach for product-service
systems. In: International conference on engineering, technology and innovation, Madeira16. International Organization for Standardization (2008) ISO 15686-5:2008—buildings and con-
structed assets—service-life planning—part 5: life-cycle costing. International Organizationfor Standardization

3 Life Cycle Management for Product-Service Systems 43
17. Corti D, FontanaA,Montorsi F (2016)Reference data architecture for PSSs life cycle inventory.Procedia CIRP 47:300–304
18. Kjaer LL, Pagoropoulos A, Schmidt JH, McAloone TC (2016) Challenges when evaluatingproduct/service-systems through life cycle assessment. J Cleaner Prod 120:95–104
19. Dal Lago M, Corti D, Wellsandt S (2017) “Reinterpreting the LCA standard procedure forPSS. Procedia CIRP
Open Access This chapter is licensed under the terms of the Creative Commons Attribution 4.0International License (http://creativecommons.org/licenses/by/4.0/), which permits use, sharing,adaptation, distribution and reproduction in any medium or format, as long as you give appropriatecredit to the original author(s) and the source, provide a link to the Creative Commons license andindicate if changes were made.
The images or other third party material in this chapter are included in the chapter’s CreativeCommons license, unless indicated otherwise in a credit line to the material. If material is notincluded in the chapter’s Creative Commons license and your intended use is not permitted bystatutory regulation or exceeds the permitted use, you will need to obtain permission directly fromthe copyright holder.
Chapter 4A Platform for Product-Service Designand Manufacturing Intelligence
Maurizio Petrucciani, Lorenzo Marangi, Massimiliano Agostaand Marco Stevanella
Abstract Manutelligence is designed for the Product-Service business, allowingenterprises to develop innovative Product-Services, more sustainable, addressingcustomer needs. This platform will enable designers and engineers to access throughnatural 3DEXPERIENCE to data from both the “traditional” enterprise IT systems(CAD, CAX, PLM, MES, etc.) and IoT enabled systems for physical products infor-mation and knowledge management during its whole life cycle phases. The activitiescarried out by Manutelligence will improve the product and service development byconnecting them together through cross disciplinary feedback loops by means ofmodular collaborative secure ICT manufacturing intelligence. The four software pil-lars of theManutelligence platform are the 3DEXPERIENCE, byDassault Systèmes,I-Like, by Holonix, MaGA, by SUPSI, LCPA, by Balance.
4.1 P-S Collaborative Design and Manufacturing Platform
Manutelligence aims at supporting the emerging trend of the Product-Service busi-ness, allowing enterprises to develop innovative and more sustainable Product-Services, addressing customer needs. Some of these services can be provided onlyafter timely and accurate analysis of customers’ product usage in order to acquireuseful information for new product improvements or services provision. Often themisalignment between product and service development processes and unability ofconcurrent engineering between both processes arise due to the lack of informationexchange among the product and service life cycle phases. This generates longer timeto market for the product and service, misalignment between the product and servicelife cycle phases, lack of sharing knowledge and product and services not adapted tothe business environment/customers’ needs. Manutelligence aims to integrate best inclass methodologies and tools from research and industry, resulting in a secure, crossdisciplinary collaborative Product-Service Design and Manufacturing Engineering
M. Petrucciani (B) · L. Marangi · M. Agosta · M. StevanellaDassault Systemes Italia Srl, Via dell’Innovazione, 3, 20126 Milan, Italye-mail: [email protected]
© The Author(s) 2019L. Cattaneo and S. Terzi (eds.), Models, Methods and Tools for Product ServiceDesign, PoliMI SpringerBriefs, https://doi.org/10.1007/978-3-319-95849-1_4
45

46 M. Petrucciani et al.
Platform. This platform should enable designers and engineers to access throughnatural 3D experiences to data from both the “traditional” enterprise IT systems(CAD, CAX, PLM,MES, etc.) and IoT enabled systems for physical products infor-mation and knowledge management during its whole life cycle phases. The activitiescarried out byManutelligence will improve the product and service developmentby connecting them together through cross disciplinary feedback loops by meansof modular collaborative secure ICT manufacturing intelligence.
Therefore the innovative point is reached providing a lifecycle transversal infras-tructure, able to provide to the different involved stakeholders (designers, engineers,manufacturing managers, testing, maintenance users and service team) a coherent,secure and content driven access to information (Fig. 4.1).
Moreover Life Cycle Cost (LCC) and Life Cycle Analysis (LCA) are usually along and difficult process and cannot be directly used during the design phase byengineers, but needs specialized analysts due to the difficulty of retrieving data anddefining the boundaries of the analysis. Objective of Manutelligence is to supportthe interaction between the engineering and the environmental (LCA) or business(LCC) analysts as well as to provide tools and methods to enable iterative calculationand optimization of these aspects.
4.2 Product Service Solution for Industrial Scenarios
The Manutelligence Platform has been developed based on industrial use cases andscenarii, with the target to be applicable in the related industrial sectors.
TheManutelligence Platform design was organized to support the industrial casesof theManutelligence project provided by the partnersFerrari,Meyer,FabLab (Fun-dacio CIM) and Lindbäcks. Chapter 6, about Use cases applications, is showing theuse case details.
The Ferrari case has been developed using the CAD design and simulation capa-bilities for the frequency and modal analysis as well as the IoT functionalities tocapture and elaborate the driver usage of the car, recording information via telemetry.TheMeyer case has been managed implementing the enterprise change managementprocess; this process can be triggered directly via the IoT, automatically creating theissue object containing the data coming from problems captured during the shipoperations. The FabLab made usage of the CAD design and BOM management
Fig. 4.1 Lifecycle phases
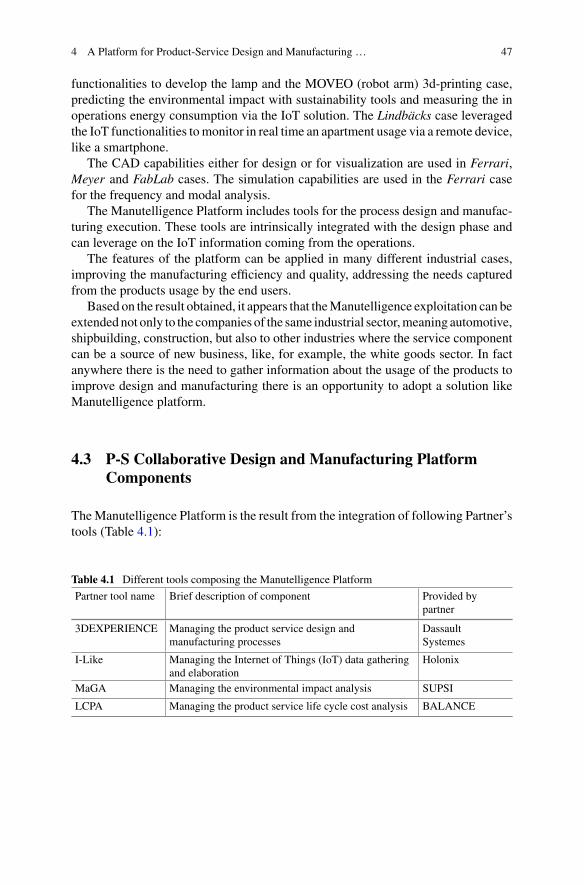
4 A Platform for Product-Service Design and Manufacturing … 47
functionalities to develop the lamp and the MOVEO (robot arm) 3d-printing case,predicting the environmental impact with sustainability tools and measuring the inoperations energy consumption via the IoT solution. The Lindbäcks case leveragedthe IoT functionalities tomonitor in real time an apartment usage via a remote device,like a smartphone.
The CAD capabilities either for design or for visualization are used in Ferrari,Meyer and FabLab cases. The simulation capabilities are used in the Ferrari casefor the frequency and modal analysis.
The Manutelligence Platform includes tools for the process design and manufac-turing execution. These tools are intrinsically integrated with the design phase andcan leverage on the IoT information coming from the operations.
The features of the platform can be applied in many different industrial cases,improving the manufacturing efficiency and quality, addressing the needs capturedfrom the products usage by the end users.
Based on the result obtained, it appears that theManutelligence exploitation can beextendednot only to the companies of the same industrial sector,meaning automotive,shipbuilding, construction, but also to other industries where the service componentcan be a source of new business, like, for example, the white goods sector. In factanywhere there is the need to gather information about the usage of the products toimprove design and manufacturing there is an opportunity to adopt a solution likeManutelligence platform.
4.3 P-S Collaborative Design and Manufacturing PlatformComponents
TheManutelligence Platform is the result from the integration of following Partner’stools (Table 4.1):
Table 4.1 Different tools composing the Manutelligence Platform
Partner tool name Brief description of component Provided bypartner
3DEXPERIENCE Managing the product service design andmanufacturing processes
DassaultSystemes
I-Like Managing the Internet of Things (IoT) data gatheringand elaboration
Holonix
MaGA Managing the environmental impact analysis SUPSI
LCPA Managing the product service life cycle cost analysis BALANCE
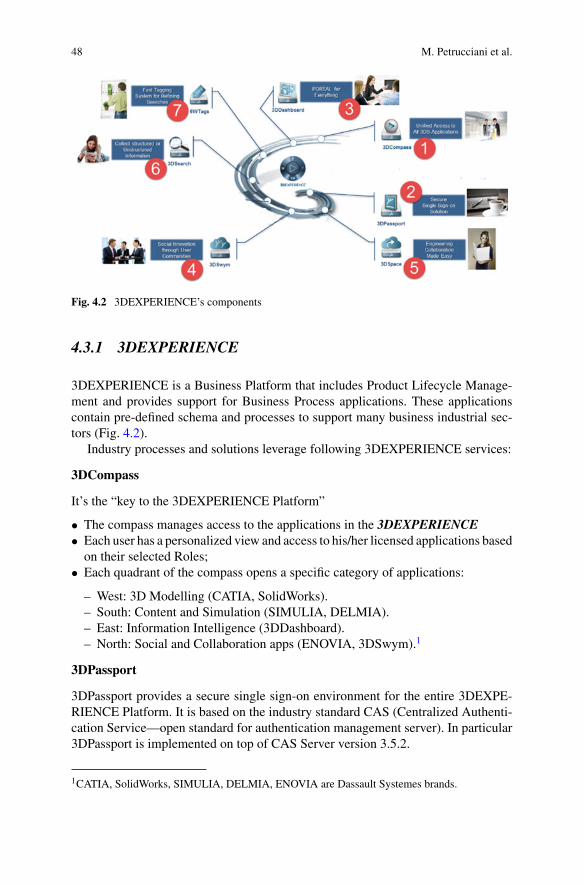
48 M. Petrucciani et al.
Fig. 4.2 3DEXPERIENCE’s components
4.3.1 3DEXPERIENCE
3DEXPERIENCE is a Business Platform that includes Product Lifecycle Manage-ment and provides support for Business Process applications. These applicationscontain pre-defined schema and processes to support many business industrial sec-tors (Fig. 4.2).
Industry processes and solutions leverage following 3DEXPERIENCE services:
3DCompass
It’s the “key to the 3DEXPERIENCE Platform”
• The compass manages access to the applications in the 3DEXPERIENCE• Each user has a personalized view and access to his/her licensed applications basedon their selected Roles;
• Each quadrant of the compass opens a specific category of applications:
– West: 3D Modelling (CATIA, SolidWorks).– South: Content and Simulation (SIMULIA, DELMIA).– East: Information Intelligence (3DDashboard).– North: Social and Collaboration apps (ENOVIA, 3DSwym).1
3DPassport
3DPassport provides a secure single sign-on environment for the entire 3DEXPE-RIENCE Platform. It is based on the industry standard CAS (Centralized Authenti-cation Service—open standard for authentication management server). In particular3DPassport is implemented on top of CAS Server version 3.5.2.
1CATIA, SolidWorks, SIMULIA, DELMIA, ENOVIA are Dassault Systemes brands.
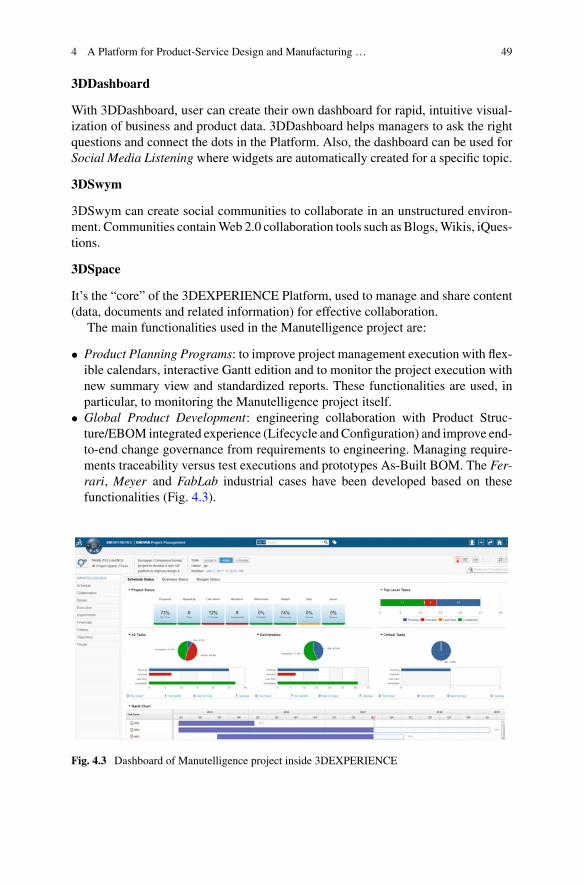
4 A Platform for Product-Service Design and Manufacturing … 49
3DDashboard
With 3DDashboard, user can create their own dashboard for rapid, intuitive visual-ization of business and product data. 3DDashboard helps managers to ask the rightquestions and connect the dots in the Platform. Also, the dashboard can be used forSocial Media Listening where widgets are automatically created for a specific topic.
3DSwym
3DSwym can create social communities to collaborate in an unstructured environ-ment. Communities containWeb 2.0 collaboration tools such as Blogs,Wikis, iQues-tions.
3DSpace
It’s the “core” of the 3DEXPERIENCE Platform, used to manage and share content(data, documents and related information) for effective collaboration.
The main functionalities used in the Manutelligence project are:
• Product Planning Programs: to improve project management execution with flex-ible calendars, interactive Gantt edition and to monitor the project execution withnew summary view and standardized reports. These functionalities are used, inparticular, to monitoring the Manutelligence project itself.
• Global Product Development: engineering collaboration with Product Struc-ture/EBOM integrated experience (Lifecycle andConfiguration) and improve end-to-end change governance from requirements to engineering. Managing require-ments traceability versus test executions and prototypes As-Built BOM. The Fer-rari, Meyer and FabLab industrial cases have been developed based on thesefunctionalities (Fig. 4.3).
Fig. 4.3 Dashboard of Manutelligence project inside 3DEXPERIENCE

50 M. Petrucciani et al.
The 3DEXPERIENCE Platform Architecture is a three-tier architecture in whichthe presentation, the application processing and the data management are logicallyseparate processes. The Architecture is a web based one, using the https protocol,to ensure secure data management. Access to the application can be done via webbrowser (Webtop Client) or via specific client application (Native Client), as shownin the following Fig. 4.4.
4.3.2 I-like
I-Like is the Holonix web platform supporting the Internet of Things (IoT) processesin the Manutelligence platform.
I-Like Architecture
The Holonix I-Like is a web platform aimed at retrieving, organizing and visualizingall the data that are relevant to know the history and the current status of a machineor product. This is the module inside the platform whose objective is to acquire datafrom the field. Once the data are acquired, they can be used for different analysisand with different purposes. For example, inside the Manutelligence Platform, datacoming from different “sources” like Ferrari FXXhigh performance race car, FabLab3D printers, Lindbäcks wooden houses and Meyer ships are captured by Holonix I-Like. The core of the solution consists of a cloud platform, a set of gateways to readdata from the field and a set of web and mobile apps to present the data to the users.Following Fig. 4.5 offers a general graphical representation of the Holonix I-Likearchitecture.
Fig. 4.4 Three-tier architecture
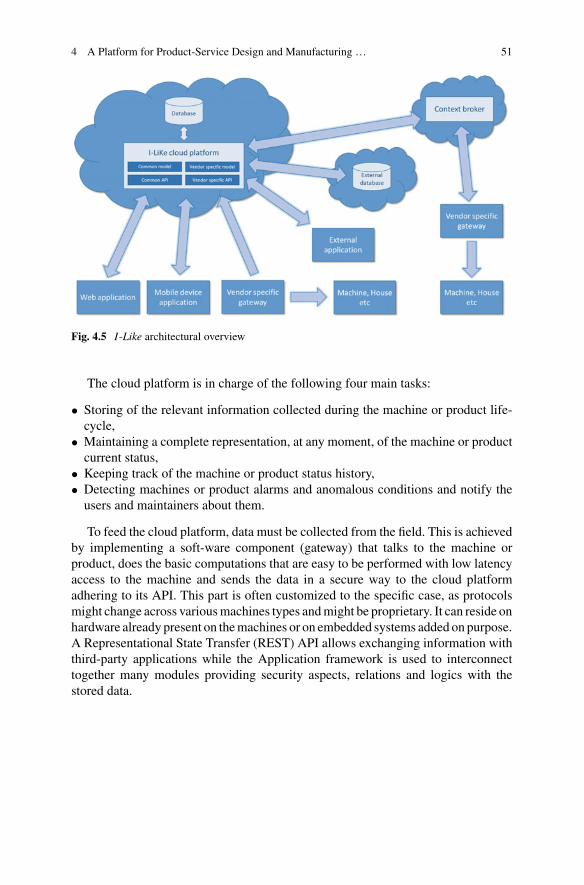
4 A Platform for Product-Service Design and Manufacturing … 51
Fig. 4.5 I-Like architectural overview
The cloud platform is in charge of the following four main tasks:
• Storing of the relevant information collected during the machine or product life-cycle,
• Maintaining a complete representation, at any moment, of the machine or productcurrent status,
• Keeping track of the machine or product status history,• Detecting machines or product alarms and anomalous conditions and notify theusers and maintainers about them.
To feed the cloud platform, data must be collected from the field. This is achievedby implementing a soft-ware component (gateway) that talks to the machine orproduct, does the basic computations that are easy to be performed with low latencyaccess to the machine and sends the data in a secure way to the cloud platformadhering to its API. This part is often customized to the specific case, as protocolsmight change across variousmachines types andmight be proprietary. It can reside onhardware already present on themachines or on embedded systems added on purpose.A Representational State Transfer (REST) API allows exchanging information withthird-party applications while the Application framework is used to interconnecttogether many modules providing security aspects, relations and logics with thestored data.

52 M. Petrucciani et al.
4.3.3 MaGA
MaGA is a software for Life Cycle Assessment developed by SUPSI. It was devel-oped as a standalone application. In the Manutelligence context it is integrated as anapplication of the platform.
The Life Cycle Assessment calculation is based on the availability of a Bill ofMaterial (BOM) of the Product to be analyzed.
The Manutelligence Platform is designed in order to let MaGA import the BOMfrom 3DEXPERIENCE Platform. Anyway MaGA can be used standalone and theBOM can be created from scratch using the MaGA UI.
A specific interface was developed so that the user can, during theMaGA session,import the BOM automatically and add all the information needed for the environ-mental impact calculation.
The MaGA session data can be saved into the 3DEXPERIENCE Platform, sothat the calculation can be carried out and refined by different users on differentworkstation as needed by the work organization.
Once the Assessment calculations are completed, the final results can be uploadedin 3DEXPERIENCE Platform, making it available to all the users, as per the accessrules implemented.
4.3.4 LCPA
LCPA is a software for Life Cycle Costing developed by Balance. It was developedas a standalone application. In the Manutelligence context it is integrated as anapplication of the platform.
As in the case of MaGA, the Assessment calculation is based on the availabilityof a Bill of Material (BOM) of the Product to be analyzed, and for that reason theManutelligence Platform was designed to let LCPA import the BOM from 3DEX-PERIENCE Platform. Anyway LCPA can be used standalone and the BOM can becreated from scratch using the LCPA UI.
A specific interface was developed so that the user can, during the LCPA ses-sion, import in the BOM automatically and add all the information needed for theenvironmental impact calculation.
Once the calculations are completed, the final result can be uploaded in 3DEX-PERIENCE Platform, making it available to all the users.

4 A Platform for Product-Service Design and Manufacturing … 53
Table 4.2 Data exchange
Involved systems Technology used Exchange format data
MaGA ← → 3DEXPERIENCE REST web service JSON/XML format
LCPA ← → 3DEXPERIENCE REST web service JSON/XML format
I-Like ← → 3DEXPERIENCE REST web service JSON format
I-Like ← → LCPA REST web service JSON format
4.4 P-S Collaborative Design and Manufacturing PlatformIntegration
Data exchange between four components of Manutelligence Platform (3DEXPERI-ENCE, I-Like,MaGA, LCPA) is ensured through the use ofWebServices technologythat provide a standard means of interoperating between different software applica-tions, running on a variety of platforms and/or frameworks.2 The following tableshows technology end exchange formats adopted (Table 4.2).
The workflow of the data exchange between 3DEXPERIENCE and MaGA aswell as 3DEXPERIENCE and LCPA can be summarized in the following steps:
• Retrieve list of existing products from 3DEXPERIENCE to MaGA or LCPA.• Retrieve the BOM (Bill of Material) for a specific product from 3DEXPERIENCEand import it into MaGA or LCPA tool.
• Perform the Assessment with MaGA or LCPA tool.• Send the Assessment from MaGA or LCPA tool to 3DEXPERIENCE to make itavailable for the platform users collaboration.
This solution will allow an iterative process to converge to the optimization of theenvironmental impact as well as on the life cycle costing since the early stages of theProduct-Service design. In fact this workflow can be applied immediately, drivingthe materials selection, the design solution and taking into account the whole lifecycle of the product, including the service and the disposal phases.
The workflows of the data exchange between 3DEXPERIENCE and I-Like canbe summarized in the following steps.
Meyer Case
• The “Meyer management system”, hosted by Holonix, is retrieving, organisingand visualising all the data that are relevant in order to know the history and thecurrent status of a specific Boat.
• When an anomalous condition occurs, the on board system launches the alert tothe operator for the local action and transmits the information about anomalouscondition to the 3DEXPERIENCE Platform creating automatically an Issue.
• The Issue can be the start point for the Change Management process.
2https://www.w3.org/TR/ws-arch/.
54 M. Petrucciani et al.
Ferrari Case
• The telemetry system, hosted by Ferrari plus Holonix (steering wheel accelerome-ter), is retrieving data measured during the specific trip of a specific car; the I-Likeuser can organize and visualizing such data.
• The organized data will be automatically transferred to the 3DEXPERIENCE toallow the structural analysis, in particular the frequency and modal analysis toimprove the drive style performance by introducing the appropriate powertraintransmission changes to avoid resonance and vibration amplitude. The data trans-ferred will be classified and identified by 3DEXPERIENCE, providing to I-Likea unique identifier of the specific trip session.
Lindbäcks apartment Life Cycle Costing Case
The workflow of the data exchange between I-Like and LCPA can be summarizedinto the following steps.
• I-Like gets and stores data coming from Lindbäcks apartment (e.g. temperature,alarm, humidity).
• LCPA automatically downloads from I-Like the averages measured values of thesensors for a given interval; the energy consumption will be calculated in LCPA.
• The real energy consumption, based on measurements in the apartment, and theenergy costs, based on actual price models, are calculated.
• LCPA tool compares the “real” energy consumption of the apartment based onmeasurements with the calculated energy consumption based on mathematicalmodels.
In this way the apartment designer is able to compare theoretical calculation withmeasured data and then can improve the energy consumption due to optimized iso-lations for the next apartment.
The apartment tenant is aware of his energy consumption and the energy con-sumption costs on a daily basis and also room-related (in case the measurements aredone in every room) and he is enabled to adapt his energy consumption habits basedon real measured data.
4.5 P-S Process Design and Manufacturing ExecutionTools: 3D Modeling (CATIA and Solidworks)
The goal of the activity of the Design Engineer is to create and document the processrequired to develop new objects from the concept phase, up to the engineering phase.All the business processes are implemented by CATIA and Solidworks modules, inthe framework of Dassault’s 3DEXPERIENCE platform.

4 A Platform for Product-Service Design and Manufacturing … 55
4.5.1 Product Structure
The Product Structure is the product representation of the way it is conceived, devel-oped and engineered. This is the basis to develop the Bill of Materials and to executesimulations to validate the product.
In the context of CATIA module the basic objects to design are:
• Physical Product, used for the assemblies (the “branches” of the product tree).• Physical 3D Part, used for the component (the “leaves” of the product tree).• Representations.• 3DShape, containing the 3D geometry.• Drawing, containing the 2D geometry.
These object are used to create the Product Structure (also know as product tree)and to create the 3D geometry, enabling the visualization experience of the products(Fig. 4.6).
4.6 3D Modeling
The design of a product can start from scratch by creating a sketch or re-using libraryobjects or via carry-over of previous products to modify to design new ones. Thereis a bunch of functionalities available to capture the intent of the designer in order tofacilitate and speed up the product development, as well as tool to control the dataaccess and the product maturity follow-up in a quality context.
The results that can be obtained are the ones developed for the Manutelligenceindustrial use cases (Fig. 4.7).
Fig. 4.6 Product’s structure
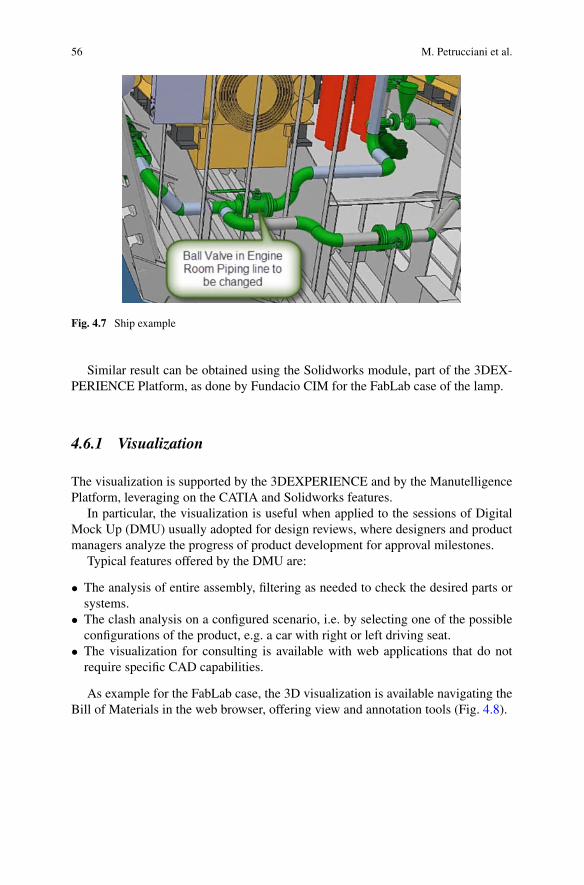
56 M. Petrucciani et al.
Fig. 4.7 Ship example
Similar result can be obtained using the Solidworks module, part of the 3DEX-PERIENCE Platform, as done by Fundacio CIM for the FabLab case of the lamp.
4.6.1 Visualization
The visualization is supported by the 3DEXPERIENCE and by the ManutelligencePlatform, leveraging on the CATIA and Solidworks features.
In particular, the visualization is useful when applied to the sessions of DigitalMock Up (DMU) usually adopted for design reviews, where designers and productmanagers analyze the progress of product development for approval milestones.
Typical features offered by the DMU are:
• The analysis of entire assembly, filtering as needed to check the desired parts orsystems.
• The clash analysis on a configured scenario, i.e. by selecting one of the possibleconfigurations of the product, e.g. a car with right or left driving seat.
• The visualization for consulting is available with web applications that do notrequire specific CAD capabilities.
As example for the FabLab case, the 3D visualization is available navigating theBill of Materials in the web browser, offering view and annotation tools (Fig. 4.8).
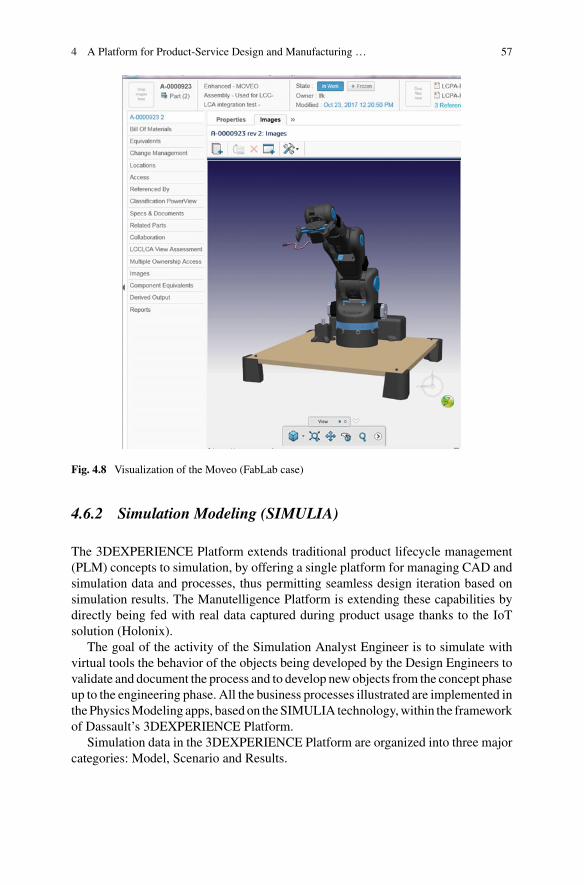
4 A Platform for Product-Service Design and Manufacturing … 57
Fig. 4.8 Visualization of the Moveo (FabLab case)
4.6.2 Simulation Modeling (SIMULIA)
The 3DEXPERIENCE Platform extends traditional product lifecycle management(PLM) concepts to simulation, by offering a single platform for managing CAD andsimulation data and processes, thus permitting seamless design iteration based onsimulation results. The Manutelligence Platform is extending these capabilities bydirectly being fed with real data captured during product usage thanks to the IoTsolution (Holonix).
The goal of the activity of the Simulation Analyst Engineer is to simulate withvirtual tools the behavior of the objects being developed by the Design Engineers tovalidate and document the process and to develop new objects from the concept phaseup to the engineering phase. All the business processes illustrated are implemented inthePhysicsModeling apps, based on theSIMULIA technology,within the frameworkof Dassault’s 3DEXPERIENCE Platform.
Simulation data in the 3DEXPERIENCE Platform are organized into three majorcategories: Model, Scenario and Results.
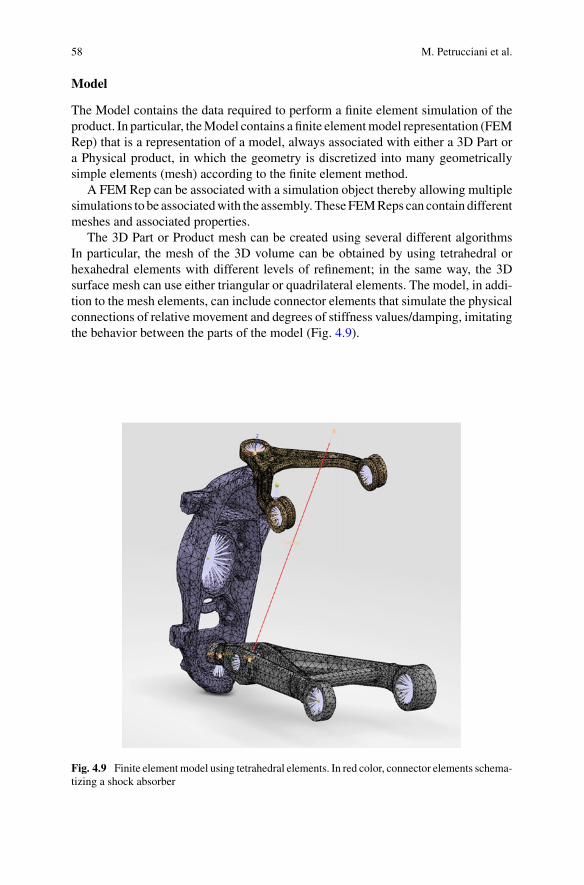
58 M. Petrucciani et al.
Model
The Model contains the data required to perform a finite element simulation of theproduct. In particular, theModel contains a finite elementmodel representation (FEMRep) that is a representation of a model, always associated with either a 3D Part ora Physical product, in which the geometry is discretized into many geometricallysimple elements (mesh) according to the finite element method.
A FEM Rep can be associated with a simulation object thereby allowing multiplesimulations to be associatedwith the assembly. TheseFEMReps can contain differentmeshes and associated properties.
The 3D Part or Product mesh can be created using several different algorithmsIn particular, the mesh of the 3D volume can be obtained by using tetrahedral orhexahedral elements with different levels of refinement; in the same way, the 3Dsurface mesh can use either triangular or quadrilateral elements. The model, in addi-tion to the mesh elements, can include connector elements that simulate the physicalconnections of relative movement and degrees of stiffness values/damping, imitatingthe behavior between the parts of the model (Fig. 4.9).
Fig. 4.9 Finite elementmodel using tetrahedral elements. In red color, connector elements schema-tizing a shock absorber

4 A Platform for Product-Service Design and Manufacturing … 59
Scenario
The Scenario consists of different objects that describe how a simulation is per-formed; the availability of certain types of actions will depend on the type of scenariocreation app.
In the Scenario, the type of analysis procedure to be performed is specified; thiscan be a general static analysis, a non-linear implicit or explicit dynamic analysis, ora linear dynamic analysis. Within each steps, the relevant external loads (e.g. gravity,pressure, concentrated forces) and restraints are applied to the model, together withoutput requests for the analysis.
In particular, in the Scenario the link between the CAD data and the Internetof Things data occurs. For example, considering the Ferrari use case, telemetricdata coming from the test drive and processed by Holonix are imported onto theManutelligence Platform in tabular format (e.g. CSV format) and used to create(amplitudes of the forces in time/shift) the applied loads and/or displacement asboundary conditions (Fig. 4.10).
Once theSimulationScenario has been completely defined, it is possible to executethe analysis by specifying the number of cores to use to leverage the scalability ofthe SIMULIA solver.
Results
Results, in the context of simulation, contain the outcome of the executed analysis,including output variables, reports and animations that can be viewed in the PhysicsResults Explorer app.
Fig. 4.10 Input from telemetry
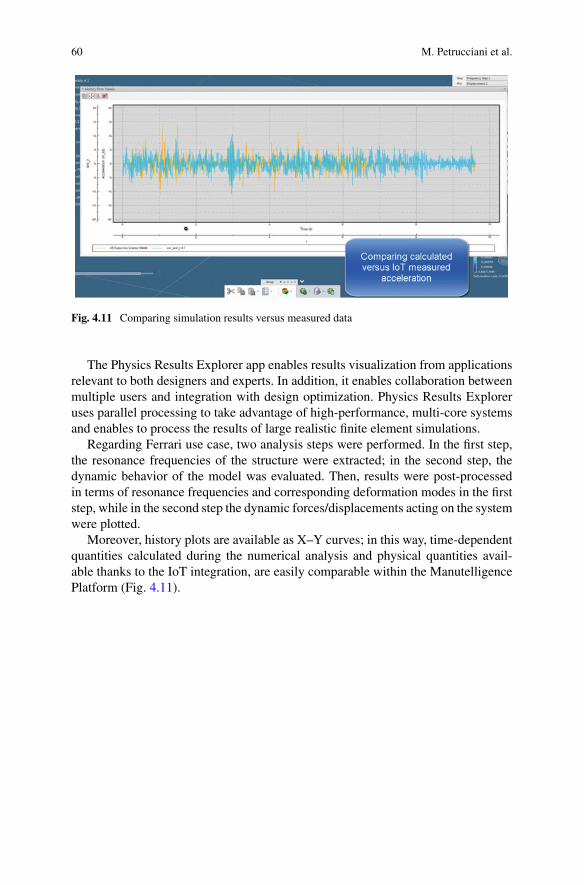
60 M. Petrucciani et al.
Fig. 4.11 Comparing simulation results versus measured data
The Physics Results Explorer app enables results visualization from applicationsrelevant to both designers and experts. In addition, it enables collaboration betweenmultiple users and integration with design optimization. Physics Results Exploreruses parallel processing to take advantage of high-performance, multi-core systemsand enables to process the results of large realistic finite element simulations.
Regarding Ferrari use case, two analysis steps were performed. In the first step,the resonance frequencies of the structure were extracted; in the second step, thedynamic behavior of the model was evaluated. Then, results were post-processedin terms of resonance frequencies and corresponding deformation modes in the firststep, while in the second step the dynamic forces/displacements acting on the systemwere plotted.
Moreover, history plots are available as X–Y curves; in this way, time-dependentquantities calculated during the numerical analysis and physical quantities avail-able thanks to the IoT integration, are easily comparable within the ManutelligencePlatform (Fig. 4.11).

4 A Platform for Product-Service Design and Manufacturing … 61
Open Access This chapter is licensed under the terms of the Creative Commons Attribution-NonCommercial-NoDerivatives 4.0 International License (http://creativecommons.org/licenses/by-nc-nd/4.0/), which permits any noncommercial use, sharing, distribution and reproduction in anymedium or format, as long as you give appropriate credit to the original author(s) and the source,provide a link to the Creative Commons license and indicate if you modified the licensed material.You do not have permission under this license to share adapted material derived from this chapteror parts of it.
The images or other third party material in this chapter are included in the chapter’s CreativeCommons license, unless indicated otherwise in a credit line to the material. If material is notincluded in the chapter’s Creative Commons license and your intended use is not permitted bystatutory regulation or exceeds the permitted use, you will need to obtain permission directly fromthe copyright holder.

Chapter 5Tools and Procedures to Embedand Retrieve Product-Service LifecycleKnowledge
Jacopo Cassina, Ida Critelli, Lara Binotti, Eva Coscia and Stefano Borgia
Abstract The cross-disciplinary collaborative management environment developedin Manutelligence project for Product-Service (P-S) engineering has the primaryobjective of managing all data, information and knowledge related to the P-S andits lifecycle in manufacturing. The present chapter presents tools and procedures toembed and retrieve this lifecycle knowledge. As extracting feedback from customerscan make the P-S more suitable and attractive to the customers themselves, improv-ing the P-S design and the development of new services, first of all an analysis ofthe approaches for customer feedback based on the Manutelligence industrial cases(automotive, ship, smart house, 3D-printing) has been performed. The customerfeedback is characterized through different viewpoints: customer types, benefits,feedback content and methods for feedback collection, also focusing on how theManutelligence platform can support the feedback collection. Concerning the usecases, practical examples on some users experience performed using the modules ofManutelligence platform are described. In particular, the application developed forFerrari data retrieval and the visualization tool of Mayer are introduced as significantmodules supporting interaction and feedback between the customer and designer.Taking into account the information coming from different sources (e.g. PLCs, sen-sorial IoT nodes, etc.) in the context of production system, a methodology to presentcoherently field data is proposed, with the idea to offer interoperability and integra-tion also from the point of view of the different devices used to collect these data. Forthis purposed, a specific application—part of i-LiKe suite and comprising a specificdashboard for manufacturing data visualization—has been conceived. In order toexplain the related capabilities and functionalities, a simulator related to 3D printingis presented as an extended demonstration of the proposed approach.
J. Cassina (B) · I. Critelli · L. Binotti · E. Coscia · S. BorgiaHolonix s.r.l., Corso Italia, 8, 20821 Meda, MB, Italye-mail: [email protected]
© The Author(s) 2019L. Cattaneo and S. Terzi (eds.), Models, Methods and Tools for Product ServiceDesign, PoliMI SpringerBriefs, https://doi.org/10.1007/978-3-319-95849-1_5
63
64 J. Cassina et al.
5.1 Methodologies for Customer Feedback
5.1.1 Introduction
Extracting feedback from P-S customers can make the P-S more suitable and attrac-tive to the customers themselves. However, it is always not easy to get the feedback.The objective in this paragraph is to analyse the approaches for customer feed-back based on the Manutelligence industrial cases: automotive, ship, smart house,fablab/3D-printing. The customer feedback is analysed through different viewpoints:customer types, benefits, feedback content and methods for feedback collection.Additionally it is discussed, how the Manutelligence platform can support the feed-back collection.
5.1.2 Customer Feedback Analysis Approach
The Manutelligence platform aims to enable designers and engineers access datafrom the traditional enterprise IT systems, but also from the IoT enabled systems.The objective is to manage all data, information and knowledge related to the P-Sand its lifecycle in manufacturing. In the beginning of the project each of the four usecase pilots specified the use scenarios, including descriptions of processes or processparts which could be supported by a P-S engineering platform. These scenarios werethe main source for this feedback analysis. The descriptions included the objectives,challenges, lifecycle stage and the use cases included. Each scenario could havemorethan one use case. Each use case againwas describedwith a common format includingfor example actors, precondition, post-condition, systems involved, diagram and themain steps. The number of scenarios and use cases defined were 14 scenarios and34 use cases.
Here the Manutelligence use cases have been used as the information source toanalyse real world needs, opportunities and methods for customer feedback. Theanalysis included the following steps:
• Identification of the use scenarios and use cases in which customer is involved asan active or passive source of feedback. As a whole in 7 of the 14 scenarios and 9of the 34 use cases some kind of customer feedback was included.
• Analysis of the identified scenarios and use cases using a common approach andtemplate was done.
• Consolidation of the analysis results. This was performed for the items consid-ered most important, like the customer/user type, objectives and benefits, lifecyclestage, feedback type and channels or tools, how the feedback is used and whatcould be the role of the Manutelligence platform.
• Identification of similarities and differences; developing a mapping frameworkand conclusions.
5 Tools and Procedures to Embed and Retrieve Product-Service … 65
5.1.3 Customer Types
When talking about customer feedback, it is important to identify that there aredifferent types of customers. In Manutelligence the following definitions are given:
• Customer: “Actors (typically a person or organization) who request and pay for avalue representation”.
• User: “Actors who take immediate benefit from a value representation (e.g. own-ership of a product)”.
Sometimes the customers are the same as users but in other cases the customeris not necessarily the user: the user may be the customer of the customer, or eventhe customer of the customer of the customer. As an example: the customer of ashipyard is the ship owner and the final end users are the travellers. Additionally, theship owner is also the user in the operation phase but with a different focus than thetravellers. More, in addition to the owner and end user, there may be also actors whooperate the P-S.
In principle the feedback from customers may come from different customer/userlevels and the P-S providers would be interested to get the feedback as early aspossible in the lifecycle. However, typically it is not as easy to get feedback fromthe user level (if not the first customer) in the lifecycle phase when the P-S is still inthe design or manufacturing/implementation phase. On the other hand, in the usagephase it is often more simple to get the feedback from the user.
5.1.4 Objectives and Benefits
Even if the Manutelligence use cases significantly differ from each other in sizeand complexity, they all express, in different ways, one common objective for thecollection of the customer feedback. It is the improvement of the P-S, either of theP-S instantiation (a specific P-S) or the future P-Ss. The improved P-S is expectedto influence the customer satisfaction and thus to improve the competitiveness of thecompany. Additionally it is expected that the interaction including the feedback andthe potential to influence the P-S design strengthens the customer relationship andenables better understanding about the future needs.
The availability of life cycle analysis (LCA) and life cycle cost analysis (LCC)on the platform allows the integration of LCA and LCC analysis into the designprocess. The results can be offered to the customer and the customer is able to givefeedback if the P-S performance is sufficient. The end user can make the decisionbased on sustainability assessment and long term costs. For example, the customercan predict future energy consumption and ask for changes if the performance is notgood enough.
In addition to high quality P-S, one expected benefit is to speed up the design,P-S specification and implementation processes, and to decrease the costs. Efficient
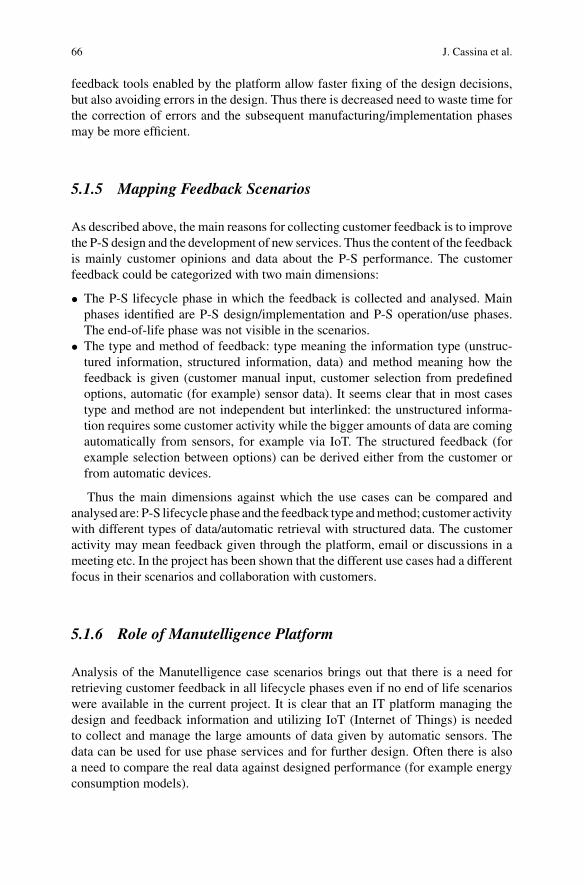
66 J. Cassina et al.
feedback tools enabled by the platform allow faster fixing of the design decisions,but also avoiding errors in the design. Thus there is decreased need to waste time forthe correction of errors and the subsequent manufacturing/implementation phasesmay be more efficient.
5.1.5 Mapping Feedback Scenarios
As described above, the main reasons for collecting customer feedback is to improvethe P-S design and the development of new services. Thus the content of the feedbackis mainly customer opinions and data about the P-S performance. The customerfeedback could be categorized with two main dimensions:
• The P-S lifecycle phase in which the feedback is collected and analysed. Mainphases identified are P-S design/implementation and P-S operation/use phases.The end-of-life phase was not visible in the scenarios.
• The type and method of feedback: type meaning the information type (unstruc-tured information, structured information, data) and method meaning how thefeedback is given (customer manual input, customer selection from predefinedoptions, automatic (for example) sensor data). It seems clear that in most casestype and method are not independent but interlinked: the unstructured informa-tion requires some customer activity while the bigger amounts of data are comingautomatically from sensors, for example via IoT. The structured feedback (forexample selection between options) can be derived either from the customer orfrom automatic devices.
Thus the main dimensions against which the use cases can be compared andanalysed are: P-S lifecycle phase and the feedback type andmethod; customer activitywith different types of data/automatic retrieval with structured data. The customeractivity may mean feedback given through the platform, email or discussions in ameeting etc. In the project has been shown that the different use cases had a differentfocus in their scenarios and collaboration with customers.
5.1.6 Role of Manutelligence Platform
Analysis of the Manutelligence case scenarios brings out that there is a need forretrieving customer feedback in all lifecycle phases even if no end of life scenarioswere available in the current project. It is clear that an IT platform managing thedesign and feedback information and utilizing IoT (Internet of Things) is neededto collect and manage the large amounts of data given by automatic sensors. Thedata can be used for use phase services and for further design. Often there is alsoa need to compare the real data against designed performance (for example energyconsumption models).
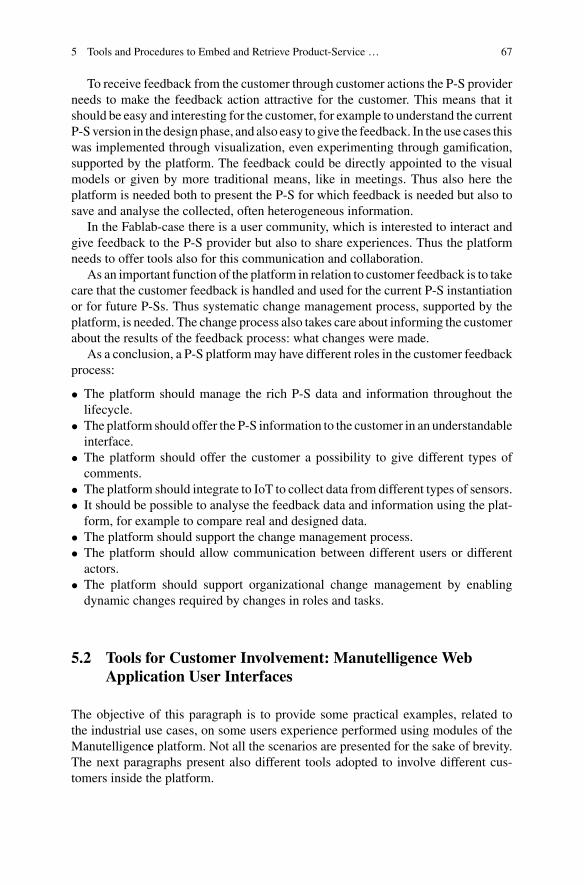
5 Tools and Procedures to Embed and Retrieve Product-Service … 67
To receive feedback from the customer through customer actions the P-S providerneeds to make the feedback action attractive for the customer. This means that itshould be easy and interesting for the customer, for example to understand the currentP-Sversion in the designphase, and also easy to give the feedback. In the use cases thiswas implemented through visualization, even experimenting through gamification,supported by the platform. The feedback could be directly appointed to the visualmodels or given by more traditional means, like in meetings. Thus also here theplatform is needed both to present the P-S for which feedback is needed but also tosave and analyse the collected, often heterogeneous information.
In the Fablab-case there is a user community, which is interested to interact andgive feedback to the P-S provider but also to share experiences. Thus the platformneeds to offer tools also for this communication and collaboration.
As an important function of the platform in relation to customer feedback is to takecare that the customer feedback is handled and used for the current P-S instantiationor for future P-Ss. Thus systematic change management process, supported by theplatform, is needed. The change process also takes care about informing the customerabout the results of the feedback process: what changes were made.
As a conclusion, a P-S platformmay have different roles in the customer feedbackprocess:
• The platform should manage the rich P-S data and information throughout thelifecycle.
• The platform should offer the P-S information to the customer in an understandableinterface.
• The platform should offer the customer a possibility to give different types ofcomments.
• The platform should integrate to IoT to collect data from different types of sensors.• It should be possible to analyse the feedback data and information using the plat-form, for example to compare real and designed data.
• The platform should support the change management process.• The platform should allow communication between different users or differentactors.
• The platform should support organizational change management by enablingdynamic changes required by changes in roles and tasks.
5.2 Tools for Customer Involvement: Manutelligence WebApplication User Interfaces
The objective of this paragraph is to provide some practical examples, related tothe industrial use cases, on some users experience performed using modules of theManutelligence platform. Not all the scenarios are presented for the sake of brevity.The next paragraphs present also different tools adopted to involve different cus-tomers inside the platform.
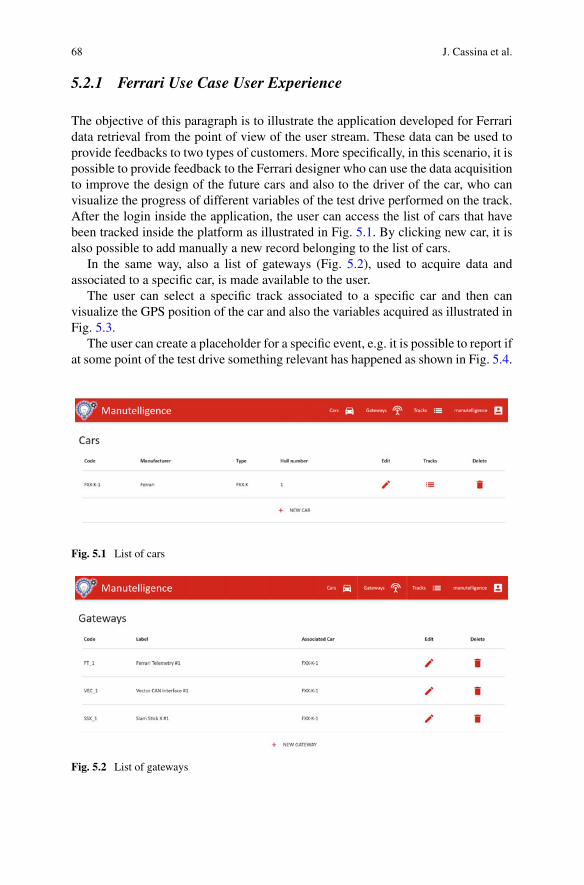
68 J. Cassina et al.
5.2.1 Ferrari Use Case User Experience
The objective of this paragraph is to illustrate the application developed for Ferraridata retrieval from the point of view of the user stream. These data can be used toprovide feedbacks to two types of customers. More specifically, in this scenario, it ispossible to provide feedback to the Ferrari designer who can use the data acquisitionto improve the design of the future cars and also to the driver of the car, who canvisualize the progress of different variables of the test drive performed on the track.After the login inside the application, the user can access the list of cars that havebeen tracked inside the platform as illustrated in Fig. 5.1. By clicking new car, it isalso possible to add manually a new record belonging to the list of cars.
In the same way, also a list of gateways (Fig. 5.2), used to acquire data andassociated to a specific car, is made available to the user.
The user can select a specific track associated to a specific car and then canvisualize the GPS position of the car and also the variables acquired as illustrated inFig. 5.3.
The user can create a placeholder for a specific event, e.g. it is possible to report ifat some point of the test drive something relevant has happened as shown in Fig. 5.4.
Fig. 5.1 List of cars
Fig. 5.2 List of gateways
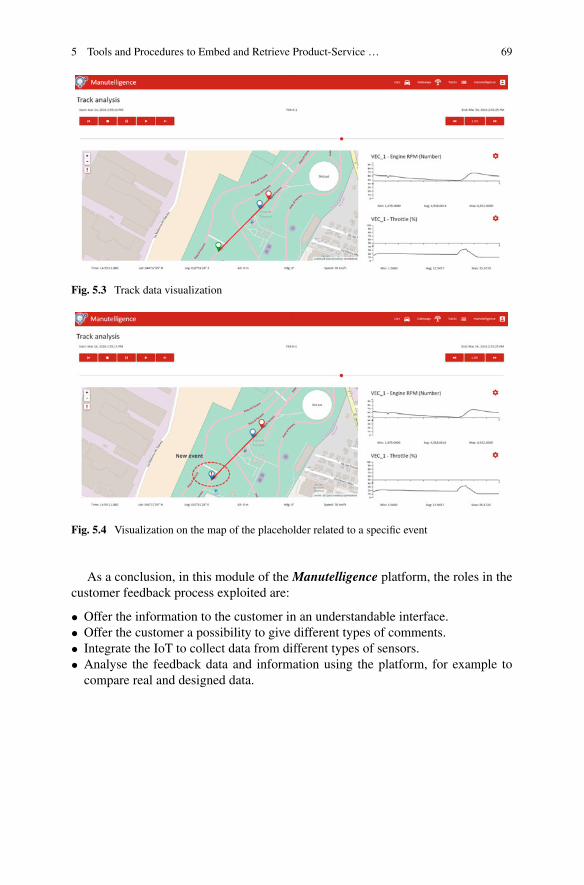
5 Tools and Procedures to Embed and Retrieve Product-Service … 69
Fig. 5.3 Track data visualization
Fig. 5.4 Visualization on the map of the placeholder related to a specific event
As a conclusion, in this module of the Manutelligence platform, the roles in thecustomer feedback process exploited are:
• Offer the information to the customer in an understandable interface.• Offer the customer a possibility to give different types of comments.• Integrate the IoT to collect data from different types of sensors.• Analyse the feedback data and information using the platform, for example tocompare real and designed data.

70 J. Cassina et al.
5.2.2 Meyer Use Case: Customer Feedback in Salesand Design
This use case aims to support the interaction and feedback between the customer anddesign through ship visualization. The interaction may happen in different lifecyclephases, like sales, design and production. The customer here is the ship owner orga-nization which may include about 200 experts in different fields (e.g. architects). Theobjective may be to win a sales order, to keep the customer (ship owner) satisfactionhigh, to get acceptance for the design solutions and to avoid change needs later inthe design or in the manufacturing phase.
There are different means to modelling the ship for the customer. The engineeringdepartment can make the visual 3D ship model available to the customer and thecustomer can view the ship model from the engineering platform, rotate it fromdifferent angles, move in the model, and zoom in/out, but not change the model assuch. Amore advancedVirtual Reality demonstration using gaming technologies hasbeen further developed and is presented here. The aim is to use it in the sales phase tomake the customer convinced about the offered solution. The scenario “Immersive3D Walking Experience” with a networked VR platform can be used with differentdevices, as presented in Fig. 5.5. Clients can connect to the same global VR-pool.The data security is high in the solution. All the parties can see their own personal VRexperience and the communication can happen via VOIP and Avatars (Multiplayerconcept). This means that the users may walk in the model and “meet” there otherusers.
Figure 5.6 presents a print-screen from the VR demonstration. The prototypecontains a conversion of the ship model to a virtual reality environment, which iscompatible with all platforms also in the future market.
The visualization can be considered as an additional knowledge-based serviceto the customer, which helps to sell more ships and keep the customer satisfied.The knowledge based service may include importing, cleaning and optimizing theCAD data for the game engine use, adding UI components for movements, inter-active objects, creating VR-solution for various environments HTC-Vive, Hololens,advanced lighting, textures and sounds.
Augmented reality
PC-Screen
Caves
Fig. 5.5 Mock-up of networked VR platform

5 Tools and Procedures to Embed and Retrieve Product-Service … 71
Fig. 5.6 A printed screen from the ship VR demo
Further development can be made towards new better people in the model (morerealistic, better graphics and animations), taking into account the ship environmentson where the ship will be travelling+day&night, and upgraded ship models to lookgood from closer distance (some modelling work will be done, for example deckfurniture can be replaced with more detailed models etc.).
As a conclusion, in this module of the Manutelligence platform, the roles in thecustomer feedback process exploited are:
• Offer the information to the customer in an understandable interface.• Offer the customer a possibility to give different types of comments.• Allow communication between different users or different actors.
5.3 Manufacturing Context Driven Intelligence LayerDevelopment and Integration
5.3.1 Introduction
The objective of this paragraph is to present amethodology to present coherently datacoming from different devices. What has been designed can aggregate data comingfrom different devices, like PLCs or sensorial IoT nodes, which are meant to collectdata mostly from industrial machines in the factory and present them in a modularand fully configurable dashboard. In order to do so, the application developed formanaging different devices, which is also part of the i-LiKe suite, is described in thefollowing. With the purpose to explain what the capabilities and functionalities are,a simulator related to FabLab machines is presented as an extended demonstrationof this approach.

72 J. Cassina et al.
5.3.2 Device Abstraction Layer
The device abstraction layer (D.A.L.) is an application developed specifically tomanage the devices in the environment of a given project, providing a unified pointof access to device data for the other applications.
In particular, it is capable of providing an “image” of the device status built uponthe data collected, applying rules to the incoming stream of data, transforming rawlow level data into a more meaningful form, recording the data to long term storageand providing a way to retrieve the data recorded. It also provides access control forthe devices connected, by distinguishing access for devices, gateways (e.g. a singleboard PC publishing data for multiple devices) and applications (whichwill consumethe data).
Basically, D.A.L. represents a developed stand-alone application. Consideringthe Manutelligence platform, it is integrated inside the I-Like module, representing amiddle layer between the IoT devices and the component supporting data collectingand preliminary analysis. SoD.A.L. can be seen as the interchange data point betweendevices and the overall SW platform: it exposes a set of REST APIs that allow thedashboard to access data.
Generic implementation
To model the devices, and the rules applied onto them, three main entities are used:
• DeviceType: they group devices of the same type (e.g. a 3D printer model) andrelated rules sets;
• DeviceTypeVersion: the version is where the rules for a device type are really con-tained; it is useful as in development stage different rules sets for the same devicetype might be needed, so that old devices can continue working on establishedrules set while new ones can be experimented;
• Device: they are the instances of a DeviceType (e.g. the single 3D printers sold bya manufacturer), each one with its status and data.
To provide flexibility required to manage data originating from various differentdevices, a collection of rule “blocks” is available. The blocks can be combined witheach other into the DeviceTypeVersion described above. Each rule block follows theevent emitter pattern, using the base classes present in Node.JS runtime environ-ment, so the data it process can directly contribute to the device status “image” andeventually it can be passed on to other rules for further processing.
The rules sets mapped into DeviceTypeVersions are then instantiated for singledevices, each one operating on its encapsulated data set.
The DeviceType-DeviceTypeVersion-Device hierarchy, with related device andapplications access control metadata, are related to a Context. Several contexts can beaccommodated on the same instance of D.A.L., so that multitenancy can be achieved:in certain scenarios this is important as several smaller projects can be served by arather complex setup of multiple application and databases management systems.
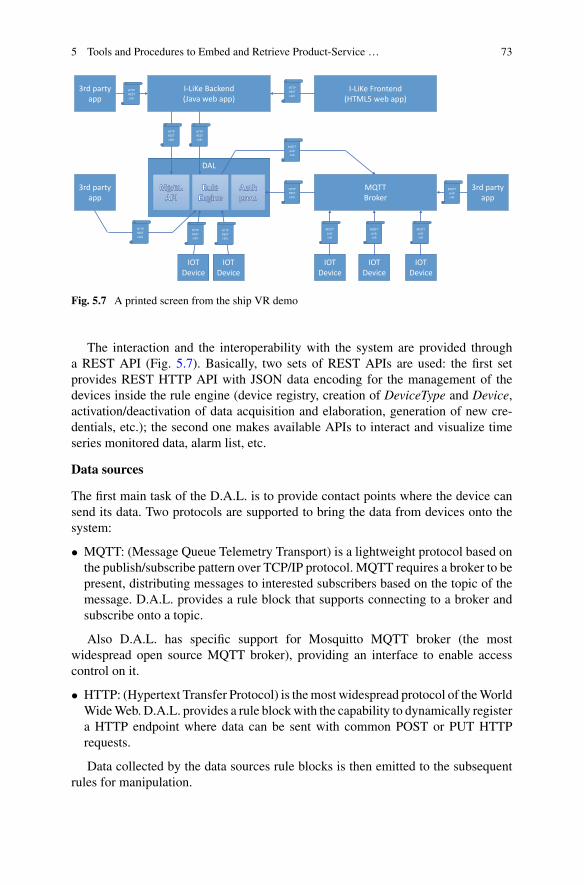
5 Tools and Procedures to Embed and Retrieve Product-Service … 73
I-LiKe Backend(Java web app)
I-LiKe Frontend(HTML5 web app)
MQTTBroker
IOTDevice
IOTDevice
DAL
IOTDevice
MQTTpubsub
IOTDevice
MQTTpubsub
IOTDevice
MQTTpubsub
HTTPRESTcalls
HTTPRESTcalls
MQTTpubsub
HTTPRESTcalls
HTTPRESTcalls
HTTPRESTcalls
HTTPRESTcalls
3rd partyapp
3rd partyapp
3rd partyapp
HTTPRESTcalls
MQTTpubsub
HTTPRESTcalls
Fig. 5.7 A printed screen from the ship VR demo
The interaction and the interoperability with the system are provided througha REST API (Fig. 5.7). Basically, two sets of REST APIs are used: the first setprovides REST HTTP API with JSON data encoding for the management of thedevices inside the rule engine (device registry, creation of DeviceType and Device,activation/deactivation of data acquisition and elaboration, generation of new cre-dentials, etc.); the second one makes available APIs to interact and visualize timeseries monitored data, alarm list, etc.
Data sources
The first main task of the D.A.L. is to provide contact points where the device cansend its data. Two protocols are supported to bring the data from devices onto thesystem:
• MQTT: (Message Queue Telemetry Transport) is a lightweight protocol based onthe publish/subscribe pattern over TCP/IP protocol. MQTT requires a broker to bepresent, distributing messages to interested subscribers based on the topic of themessage. D.A.L. provides a rule block that supports connecting to a broker andsubscribe onto a topic.
Also D.A.L. has specific support for Mosquitto MQTT broker (the mostwidespread open source MQTT broker), providing an interface to enable accesscontrol on it.
• HTTP: (Hypertext Transfer Protocol) is themost widespread protocol of theWorldWideWeb. D.A.L. provides a rule blockwith the capability to dynamically registera HTTP endpoint where data can be sent with common POST or PUT HTTPrequests.
Data collected by the data sources rule blocks is then emitted to the subsequentrules for manipulation.

74 J. Cassina et al.
Closely related to data sources rule blocks, D.A.L. provides buffering rule blocks,enabling time sorting of the data and cadenced emission to the subsequent elaborationpipeline.
Data manipulation
Data incoming from devices sometimes is in a ready to be stored form, but often itneeds an elaboration step: simpler devices tend to provide data that greatly benefitsfrom a stream processing approach to aggregate them into a more usable form. Otherfrequent use cases are the generation of a notification (event or alarm) upon somecondition recognized on the data.
D.A.L. provides a set of rules to carry on these tasks in a simple manner, reducingthe burden of specific implementations.
To cope with unexpected elaboration steps, the possibility to evaluate a genericJavascript function block onto the data is provided through a dedicated rule.
Data storage and streaming
For data storage several rule blocks are provided, supporting different databases andstorage forms:
• Time-JSON: a generic JSON payload associated with a timestamp.• Time-Decimal: a decimal value associated with a timestamp.• Interval: an event data structure, identified by a UUID v4 and presenting a startdate, an end date and a string value.
For long term data storage, mainly Apache Cassandra andMySQL are supported.Support to other DBMS is planned to be added by providing dedicated rule blocks.
Similarly to data storage, data streaming is also supported. Data can be streamedor storedwhen it is received onto the elaboration pipeline. Scheduled data extractionscan also be defined.
Streaming supports sending data in the following manners:
• MQTT: by connecting to a broker and publishing on a topic.• HTTP: by sending a POST or PUT request to a URL.• Redis PUB: by issuing a PUBLISH command onto a Redis instance, using it as asystem bus.
Data streaming is a powerful concept, potentially enabling the binding of severalinstances of D.A.L. in various environments: for example, a D.A.L. instance couldprocess low level data near the devices (edge computing) and then send them forfurther processing and long term storage to another instance of D.A.L. on an internetaccessible server (cloud computing).
Data retrieval
The last important task carried on by D.A.L. is providing a way to access the datait collected so that other applications can consume them. Similarly to HTTP data
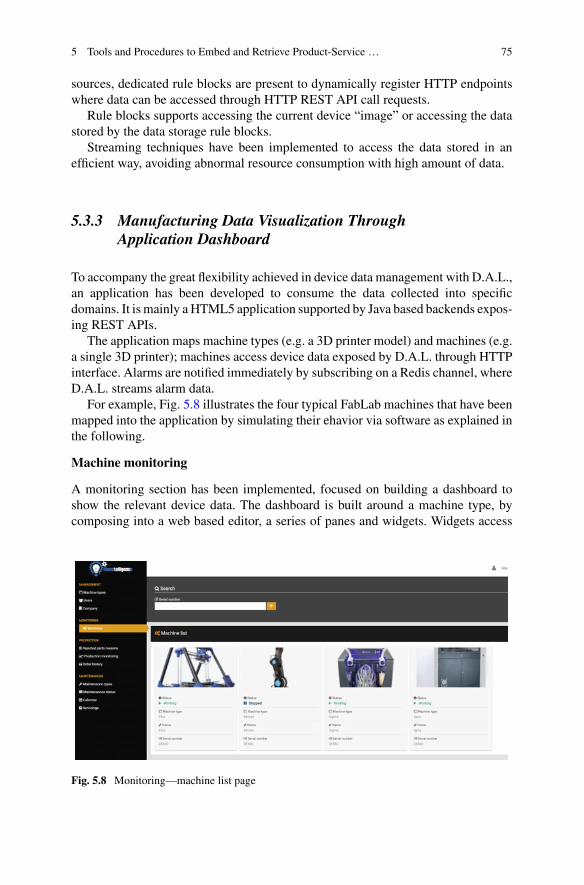
5 Tools and Procedures to Embed and Retrieve Product-Service … 75
sources, dedicated rule blocks are present to dynamically register HTTP endpointswhere data can be accessed through HTTP REST API call requests.
Rule blocks supports accessing the current device “image” or accessing the datastored by the data storage rule blocks.
Streaming techniques have been implemented to access the data stored in anefficient way, avoiding abnormal resource consumption with high amount of data.
5.3.3 Manufacturing Data Visualization ThroughApplication Dashboard
To accompany the great flexibility achieved in device data management with D.A.L.,an application has been developed to consume the data collected into specificdomains. It is mainly aHTML5 application supported by Java based backends expos-ing REST APIs.
The application maps machine types (e.g. a 3D printer model) and machines (e.g.a single 3D printer); machines access device data exposed by D.A.L. through HTTPinterface. Alarms are notified immediately by subscribing on a Redis channel, whereD.A.L. streams alarm data.
For example, Fig. 5.8 illustrates the four typical FabLab machines that have beenmapped into the application by simulating their ehavior via software as explained inthe following.
Machine monitoring
A monitoring section has been implemented, focused on building a dashboard toshow the relevant device data. The dashboard is built around a machine type, bycomposing into a web based editor, a series of panes and widgets. Widgets access
Fig. 5.8 Monitoring—machine list page
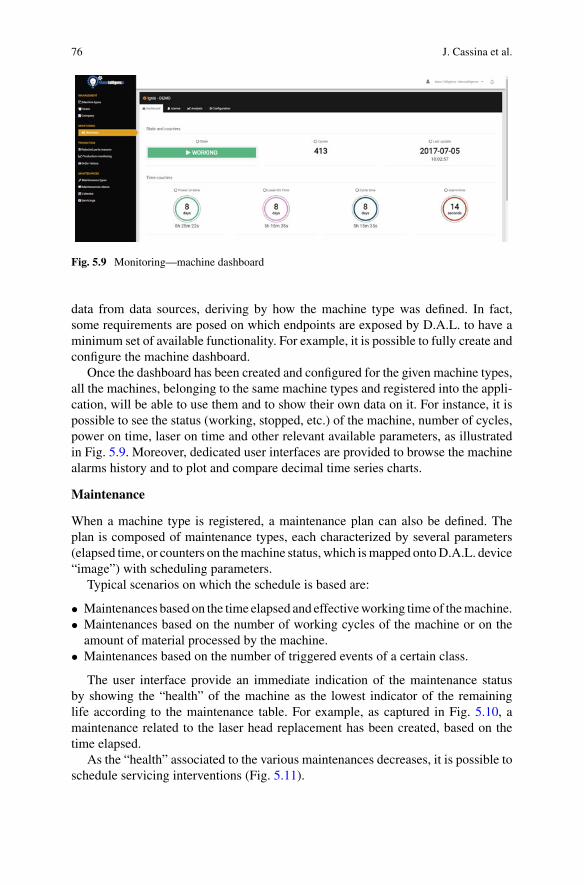
76 J. Cassina et al.
Fig. 5.9 Monitoring—machine dashboard
data from data sources, deriving by how the machine type was defined. In fact,some requirements are posed on which endpoints are exposed by D.A.L. to have aminimum set of available functionality. For example, it is possible to fully create andconfigure the machine dashboard.
Once the dashboard has been created and configured for the given machine types,all the machines, belonging to the same machine types and registered into the appli-cation, will be able to use them and to show their own data on it. For instance, it ispossible to see the status (working, stopped, etc.) of the machine, number of cycles,power on time, laser on time and other relevant available parameters, as illustratedin Fig. 5.9. Moreover, dedicated user interfaces are provided to browse the machinealarms history and to plot and compare decimal time series charts.
Maintenance
When a machine type is registered, a maintenance plan can also be defined. Theplan is composed of maintenance types, each characterized by several parameters(elapsed time, or counters on themachine status, which ismapped ontoD.A.L. device“image”) with scheduling parameters.
Typical scenarios on which the schedule is based are:
• Maintenances based on the time elapsed and effectiveworking time of themachine.• Maintenances based on the number of working cycles of the machine or on theamount of material processed by the machine.
• Maintenances based on the number of triggered events of a certain class.
The user interface provide an immediate indication of the maintenance statusby showing the “health” of the machine as the lowest indicator of the remaininglife according to the maintenance table. For example, as captured in Fig. 5.10, amaintenance related to the laser head replacement has been created, based on thetime elapsed.
As the “health” associated to the various maintenances decreases, it is possible toschedule servicing interventions (Fig. 5.11).
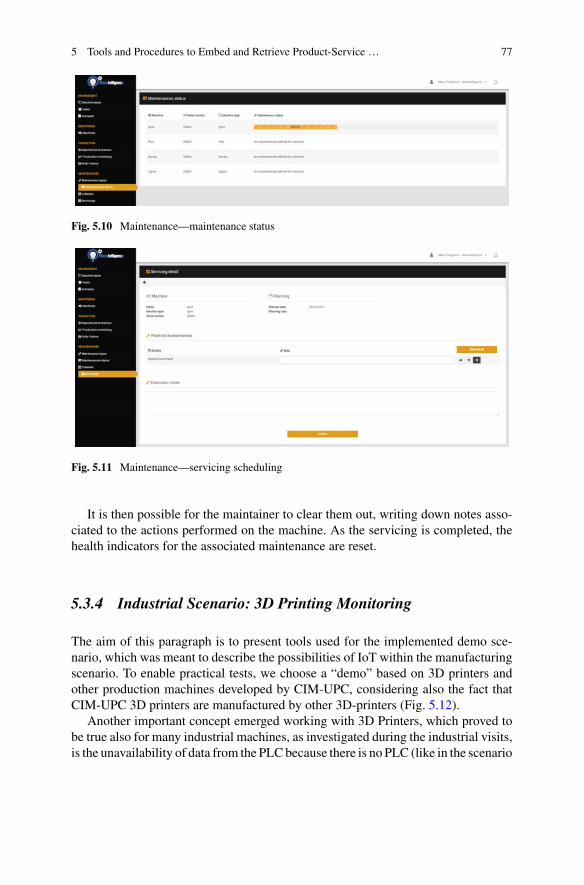
5 Tools and Procedures to Embed and Retrieve Product-Service … 77
Fig. 5.10 Maintenance—maintenance status
Fig. 5.11 Maintenance—servicing scheduling
It is then possible for the maintainer to clear them out, writing down notes asso-ciated to the actions performed on the machine. As the servicing is completed, thehealth indicators for the associated maintenance are reset.
5.3.4 Industrial Scenario: 3D Printing Monitoring
The aim of this paragraph is to present tools used for the implemented demo sce-nario, which was meant to describe the possibilities of IoT within the manufacturingscenario. To enable practical tests, we choose a “demo” based on 3D printers andother production machines developed by CIM-UPC, considering also the fact thatCIM-UPC 3D printers are manufactured by other 3D-printers (Fig. 5.12).
Another important concept emerged working with 3D Printers, which proved tobe true also for many industrial machines, as investigated during the industrial visits,is the unavailability of data from the PLCbecause there is no PLC (like in the scenario
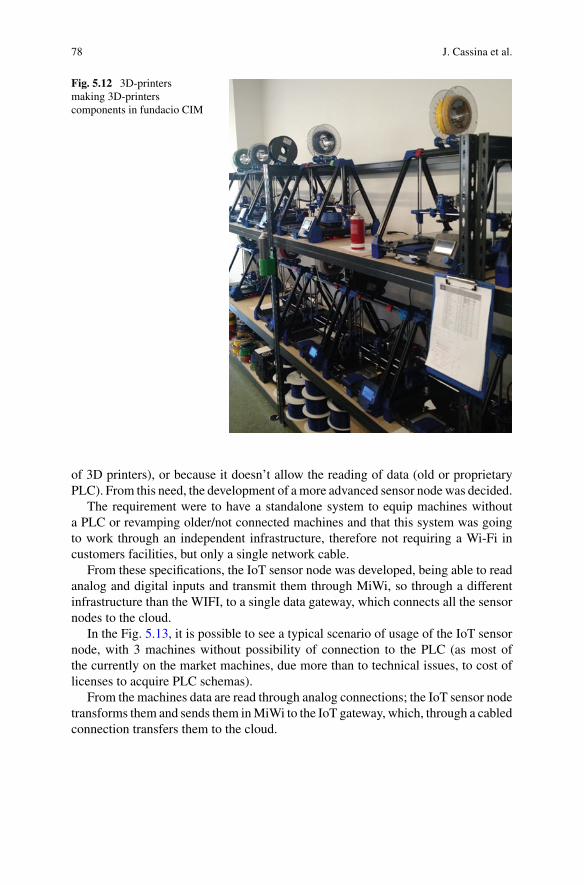
78 J. Cassina et al.
Fig. 5.12 3D-printersmaking 3D-printerscomponents in fundacio CIM
of 3D printers), or because it doesn’t allow the reading of data (old or proprietaryPLC). From this need, the development of amore advanced sensor nodewas decided.
The requirement were to have a standalone system to equip machines withouta PLC or revamping older/not connected machines and that this system was goingto work through an independent infrastructure, therefore not requiring a Wi-Fi incustomers facilities, but only a single network cable.
From these specifications, the IoT sensor node was developed, being able to readanalog and digital inputs and transmit them through MiWi, so through a differentinfrastructure than the WIFI, to a single data gateway, which connects all the sensornodes to the cloud.
In the Fig. 5.13, it is possible to see a typical scenario of usage of the IoT sensornode, with 3 machines without possibility of connection to the PLC (as most ofthe currently on the market machines, due more than to technical issues, to cost oflicenses to acquire PLC schemas).
From the machines data are read through analog connections; the IoT sensor nodetransforms them and sends them inMiWi to the IoT gateway, which, through a cabledconnection transfers them to the cloud.
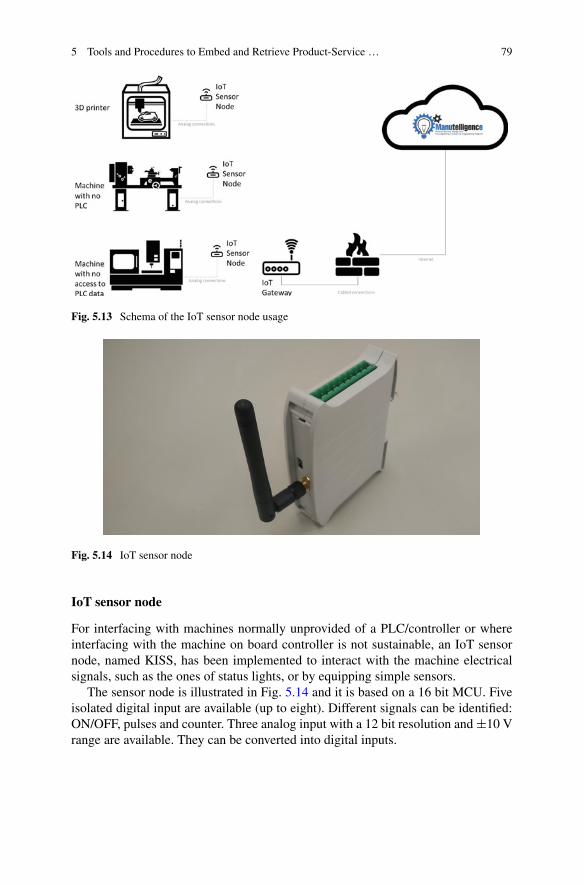
5 Tools and Procedures to Embed and Retrieve Product-Service … 79
Fig. 5.13 Schema of the IoT sensor node usage
Fig. 5.14 IoT sensor node
IoT sensor node
For interfacing with machines normally unprovided of a PLC/controller or whereinterfacing with the machine on board controller is not sustainable, an IoT sensornode, named KISS, has been implemented to interact with the machine electricalsignals, such as the ones of status lights, or by equipping simple sensors.
The sensor node is illustrated in Fig. 5.14 and it is based on a 16 bit MCU. Fiveisolated digital input are available (up to eight). Different signals can be identified:ON/OFF, pulses and counter. Three analog input with a 12 bit resolution and±10 Vrange are available. They can be converted into digital inputs.
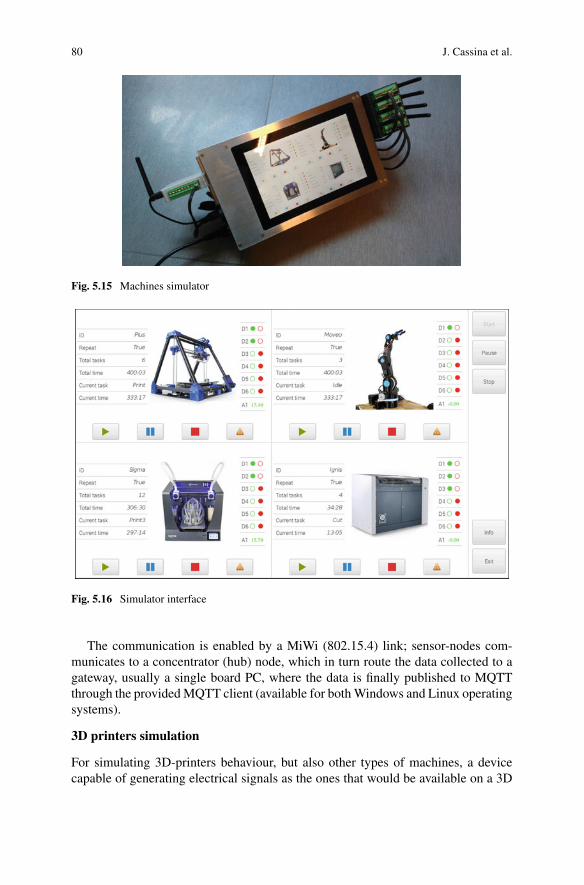
80 J. Cassina et al.
Fig. 5.15 Machines simulator
Fig. 5.16 Simulator interface
The communication is enabled by a MiWi (802.15.4) link; sensor-nodes com-municates to a concentrator (hub) node, which in turn route the data collected to agateway, usually a single board PC, where the data is finally published to MQTTthrough the providedMQTT client (available for bothWindows and Linux operatingsystems).
3D printers simulation
For simulating 3D-printers behaviour, but also other types of machines, a devicecapable of generating electrical signals as the ones that would be available on a 3D
5 Tools and Procedures to Embed and Retrieve Product-Service … 81
printer has been engineered (Fig. 5.15). This device is based on a Raspberry Pi 3single board PC, where a custommade I/O board has been interface to the SPI (SerialPeripheral Interface) bus.
An application has been then developed to control the I/Oboard, capable of pullingup and down digital outputs and of generating simple patterns over the analogicoutput. The patterns are combined into a program, which is defined into a JSON file.
The user interface (Fig. 5.16) presents up to four machines, with the ability tostart, pause and stop their program or putting them in alarm state. All these eventsand data are available in the dashboard application and they can be easily consultable.
Open Access This chapter is licensed under the terms of the Creative Commons Attribution 4.0International License (http://creativecommons.org/licenses/by/4.0/), which permits use, sharing,adaptation, distribution and reproduction in any medium or format, as long as you give appropriatecredit to the original author(s) and the source, provide a link to the Creative Commons license andindicate if changes were made.
The images or other third party material in this chapter are included in the chapter’s CreativeCommons license, unless indicated otherwise in a credit line to the material. If material is notincluded in the chapter’s Creative Commons license and your intended use is not permitted bystatutory regulation or exceeds the permitted use, you will need to obtain permission directly fromthe copyright holder.

Chapter 6Life Cycle Assessment and Life CycleCosting for PSS
Donatella Corti, Alessandro Fontana, Michele De Santis, Christian Nordenand Reinhard Ahlers
Abstract The increasing awareness towards sustainability issues from both practi-tioners and customers makes it necessary to adopt a lifecycle perspective since thedesign phase of PSSs. In this chapter, a tool aimed at carrying out the Life CycleAssessment (called MaGA) and one for the Life Cycle Costing (called BAL.LCPA)are introduced starting from the analysis of requirements carried out to make suretheir use is suitable in a PSS design context. In order to seamlessly include envi-ronmental and economic considerations into the design process, the two stand-alonetools have been integrated with the Manutelligence design platform. Their applica-tion in a Fablab-like environment is described to show how they interact with designtools and to provide examples of the results they get.
6.1 Introduction
The holistic approach promoted by the Manutelligence platform for the design ofproduct service systems (PSSs) integrating a suite of collaborative tools adopts a life-cycle perspective towards amore sustainability-aware design process. In this context,
D. Corti (B) · A. FontanaUniversity of Applied, Sciences and Arts of Southern Switzerland, Via Cantonale, 2C, 6928Manno, Switzerlande-mail: [email protected]
A. Fontanae-mail: [email protected]
M. De SantisRina Consulting S.p.A. Materials, Technology & Innovation, Via B. Ravenna 4, 73100 Lecce, Italye-mail: [email protected]
C. Norden · R. AhlersBALance Technology Consulting GmbH, Contrescarpe 33, 28203 Bremen, Germanye-mail: [email protected]
R. Ahlerse-mail: [email protected]
© The Author(s) 2019L. Cattaneo and S. Terzi (eds.), Models, Methods and Tools for Product ServiceDesign, PoliMI SpringerBriefs, https://doi.org/10.1007/978-3-319-95849-1_6
83
84 D. Corti et al.
the Life Cycle Assessment (LCA) and Life Cycle Costing (LCC) tools developed forthe Manutelligence platform enable the calculation of the expected environmentalimpacts and economic measures characterizing a certain design concept before theproduct/service is actually produced. In the current industrial practice, these tools aremainly used ex-post to assess the actual impacts generated by a product or a process;whereas the concepts of integrated LCA and LCC tools into the platform allow tocompare, in real-time, alternative PSSs concepts also on the base of their sustain-ability impact. Therefore, the LCA and LCC tools have to seamlessly communicatewith other databases that provide the necessary input data for the evaluation andthat, in turn, could use the obtained assessment in their procedures. In this chapter,a brief state-of-the-art of LCA and LCC tools in the field of PSS is presented beforeintroducing the tools developed in the Manutelligence context along with examplesof their validation with project pilots.
6.2 Life Cycle Assessment (LCA) for Product ServiceSystems (PSS)
LCA quantifies all relevant emissions and resources consumed and the relatedimpacts on environment, human health and resources that are associated with anygood or service. The main reference to carry out a Life Cycle Assessment (LCA) isthe ISO 14040:2006 family of standards [7, 8]. They provide a set of internationalguidelines internationally recognized and used as reference at global level. The iden-tified and renowned structure of an LCA study is organized into four phases:
Definition of the goal and scope of LCA. It defines why the LCA is performed, thepossible applications and other preliminary elements needed as a basis for the studysuch as the functional unit, the system boundaries or the allocation procedure.
Life Cycle Inventory (LCI) analysis. The exchanged natural elements between theeco-sphere and the tecno-sphere (the system analyzed), thus the resources entering(e.g. raw material, energy and ancillary material) and those leaving the system ofinterest (e.g. emissions, waste, products and co-products) have to be identified andquantified. This step involves data collection from several different actors and relatedprocesses along the supply network.
Life Cycle Impact Assessment (LCIA). It is meant to calculate the impacts and theeffects on the environment generated by the identified LCI data.
Interpretation. This is the final phase, where the report with the quantified impactsis prepared and the critical review of the LCA results is performed.
The ISO 14040:2006 [7] standard has been developed with a physical productfocus and, even though services are conceptually considered, the PSS concept isnot considered explicitly. For this reason, the ISO-based LCA approach might notbe applied to the PSS context directly. The main difficulty when carrying out an
6 Life Cycle Assessment and Life Cycle Costing for PSS 85
LCA for a PSS is how to integrate the service component into the LCI [4]. In litera-ture, the benefits of methodologies to perform the assessment of PSSs are frequentlydescribed (see for example [2, 13, 17], whilst more rarely contributions describinghow to effectively carry out these evaluations can be found [6, 10]. Often, the sus-tainable design of solutions focuses mainly on the physical product and potentialoptimizations are directed towards its physical subsystems, whilst only later servicesare paid attention. This procedure is not due to a lack of methodologies but rather dueto lack of system thinking [2]. Many contributions dealing with sustainability assess-ment of PSSs depict the maintenance like the only service type [11] and, typically,even if a fewmethodologies are proposed to assess the environmental impacts [1, 15,16], what they propose mainly refers to a specific type of PSS and cannot be easilygeneralized. The lack of general procedures that could be applied to any type of PSScould be due to the wide range of services that can be combined with a product. As aconsequence, the complexity and heterogeneity of the systems that represent the PSSchallenge the development of a method to systematize the information collection.Corti et al. [3] propose an approach to support the LCI phase aimed at formalizingthe integration of information related to the service part of the offer.
6.3 Life Cycle Costing (LCC) for Product Service Systems(PSS)
Life Cycle Costing (LCC) is an accounting method that considers every cost flowthroughout the lifecycle of a product (as defined in ISO 15686:2008 [9]).
Life cycle costs [14] can be divided into three categories: development costs, util-ity/service costs and recycling/reprocessing costs. Similarly to the cost, also revenuesare allocated to the individual phases of a Product System: design phase, usage phaseand recycling phase.
The results of the life cycle cost analysis are also used to optimise the designwithin an improvement cycle. Niemann et al. [14] have identified possible uses,such as calculation of total costs for products; identification of cost and revenuedrivers; impact on outsourcing decisions; analysis of “what if” scenario or analysisof customer lifetime value.
A comprehensive review of the literature on PSS has revealed that currently noquantitative methodologies exist to assess the economic potential of a PSS [18].Datta and Roy [5] explain that methodologies to calculate the LCC for a PSS divergedepending on the PSS model, since the estimation techniques depend on the kindof service-orientation of the system. Considering the estimation of costs, the maindifferences between different kinds of PSSs are the hidden costs, that cannot bequantified with traditional cost estimating methods and are due to the intangiblenature of services.
Van Ostaeyen et al. [18] suggest a methodology to calculate the Life Cycle Costsfor a result-oriented PSS. The methodology follows the main steps of the environ-

86 D. Corti et al.
mental assessment, beginning from goal, scope and definition of a unit of functionaldelivery. Mannweiler et al. [12] provide a step-wise procedure to calculate the LCC(and in particular Life Cycle Cost Indicator, LCCI) with the final aim of choosing themost appropriate PSS variant. They state that the only way to calculate the exact LCCis to collect the detailed information of the lifecycle characteristics that are used todescribe the PSS-application, yet no methodology to correctly get this information issuggested and, in particular, there is no mention to the service part of a PSS. In orderto compete in a transformed environment, companies need to properly assess the costof their service offerings to stay competitive [5]. A classical example of applicationof the LCC on a service regards the maintenance. The maintenance service includesdirect labour, materials, fuel, power, equipment and purchased services.
6.4 Definition of Requirements for LCA and LCC Tools
In engineering activities, such as the development of software tools, the requirementsanalysis is often the first step in the system design process and development, inwhich user’s requirements are gathered and analysed to generate the correspondingtool specifications. Requirements have to be documented, actionable, measurable,testable, traceable, related to identified business needs or opportunities, and definedat a level of detail sufficient for system design. The requirements analysis carriedout in Manutelligence for LCA and LCC tools had a twofold aim: first, to list therequirements these tools should satisfy in order to comply with the integration needsof the Manutelligence platform and the use for the design process; second, to decidewhether to adopt existing tools (available in the market) or to develop new solutionsthat could better fit with the project needs.
Conceptually, requirements analysis included three types of activities:
• elicitation: requirements are gathered through interviews and brainstorming ses-sions involving different stakeholders;
• analysis: identified requirements are analysed to make sure they are clear, com-plete, consistent and unambiguous;
• prioritization: requirements are weighted and scored to distinguish between cru-cial requirements to fulfil the basic functionality and additional features.
Since technical expertise was required as well as knowledge of the Manutelligenceplatform features, the project partners involved in the development and integrationof LCA and LCC tools have elicited the first list of requirements.
The list has been then refined through some iteration of discussions and revisionsinvolving not only the software developers and experts, but also users representedby the pilots participating to the project. In particular, the involvement of users hasbeen fundamental for the prioritization of requirements.
The requirements have been split in two categories: Global Requirements (codedas GR1 to GR27 in Table 6.1) and Phase requirements (coded as PR.B.1 to PR.D.6

6 Life Cycle Assessment and Life Cycle Costing for PSS 87
in Table 6.1). Global requirements concern the software functionalities and theirintegration with theManutelligence platform. Phase requirements are focused on thespecificity of the analysis and look at features related to calculation and presentationof results. For sake of clearness, the Phase requirements have been further clusteredaccording to the analysis phase they refer to: (i) Life Cycle Inventory (LCI) (coded asPR.B.1 to PR.B.5); (ii) Life Cycle Impact assessment (coded as PR.C.1 to PR.C.4)and (iii) interpretation of results (coded as PR.D.1 to PR.D.6). The final list ofrequirements used to develop the tools including the indication of their priority isshown in Table 6.1.
In order tomake easier the integration of the LCA andLCC tools into theManutel-ligence platform and to adapt their use to the design process, the use ofGaBI (themostwidespread commercial LCA tool to assess environmental impact) has been excludedsince it has been considered not flexible enough. It has been decided to extend thefunctionalities of two proprietary tools internally developed by the project partners,namely MaGA (Manutelligence Green Application) tool for LCA and BLA.LCPAfor LCC. Working on their existent versions, they have been extended in order tocover as best as possible the elicited list of requirements.
6.5 The LCA Tool: MaGA
This section describes the MaGA (ManuTelligence Green Application) tool, thesoftware that in the Manutelligence Platform is meant to perform LCA for PSSs.According to the Manutelligence needs, MaGA allows the performing of real timeanalysis aimed at improving the PSS design thanks to the possibility of evaluatingalternative product or process configurations from the environmental point of view.To better manage the tool’s complexity, a modular approach has been adopted. Thesoftware is therefore made of many modules, each one providing specific function-alities and user-interfaces. Figure 6.1 shows the MaGA architecture and its maincomponents.
Main components providing the functionalities needed to allow a user to carryout the LCA analysis are: Global Editor, Project Editor and Operation Editor.
Global Editor. It allows to edit the data needed for the sustainability assessment thatconcern the company’s supply chain actors (such as the list and the impacts of thematerials/operation used, the transportation distances or the supply chain partnerslocation) that are involved in the whole PSS life-cycle and the set of materials andoperations currently used by the company. Through this module, it is possible tointroduce new data (e.g. adding a new supplier to the supply chain or to add oneindicator type) or update the existing one. This data are inserted into the platformonce and can be then exploited every time a new assessment is carried out. This avoidsrepeating the data entry process of company-specific information that are commonfor all the PSS projects.
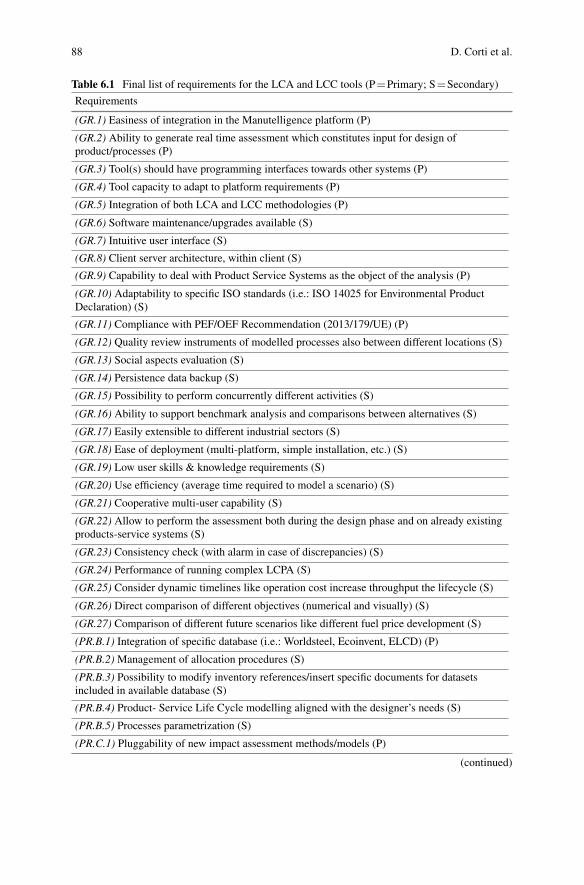
88 D. Corti et al.
Table 6.1 Final list of requirements for the LCA and LCC tools (P�Primary; S�Secondary)
Requirements
(GR.1) Easiness of integration in the Manutelligence platform (P)
(GR.2) Ability to generate real time assessment which constitutes input for design ofproduct/processes (P)
(GR.3) Tool(s) should have programming interfaces towards other systems (P)
(GR.4) Tool capacity to adapt to platform requirements (P)
(GR.5) Integration of both LCA and LCC methodologies (P)
(GR.6) Software maintenance/upgrades available (S)
(GR.7) Intuitive user interface (S)
(GR.8) Client server architecture, within client (S)
(GR.9) Capability to deal with Product Service Systems as the object of the analysis (P)
(GR.10) Adaptability to specific ISO standards (i.e.: ISO 14025 for Environmental ProductDeclaration) (S)
(GR.11) Compliance with PEF/OEF Recommendation (2013/179/UE) (P)
(GR.12) Quality review instruments of modelled processes also between different locations (S)
(GR.13) Social aspects evaluation (S)
(GR.14) Persistence data backup (S)
(GR.15) Possibility to perform concurrently different activities (S)
(GR.16) Ability to support benchmark analysis and comparisons between alternatives (S)
(GR.17) Easily extensible to different industrial sectors (S)
(GR.18) Ease of deployment (multi-platform, simple installation, etc.) (S)
(GR.19) Low user skills & knowledge requirements (S)
(GR.20) Use efficiency (average time required to model a scenario) (S)
(GR.21) Cooperative multi-user capability (S)
(GR.22) Allow to perform the assessment both during the design phase and on already existingproducts-service systems (S)
(GR.23) Consistency check (with alarm in case of discrepancies) (S)
(GR.24) Performance of running complex LCPA (S)
(GR.25) Consider dynamic timelines like operation cost increase throughput the lifecycle (S)
(GR.26) Direct comparison of different objectives (numerical and visually) (S)
(GR.27) Comparison of different future scenarios like different fuel price development (S)
(PR.B.1) Integration of specific database (i.e.: Worldsteel, Ecoinvent, ELCD) (P)
(PR.B.2) Management of allocation procedures (S)
(PR.B.3) Possibility to modify inventory references/insert specific documents for datasetsincluded in available database (S)
(PR.B.4) Product- Service Life Cycle modelling aligned with the designer’s needs (S)
(PR.B.5) Processes parametrization (S)
(PR.C.1) Pluggability of new impact assessment methods/models (P)
(continued)
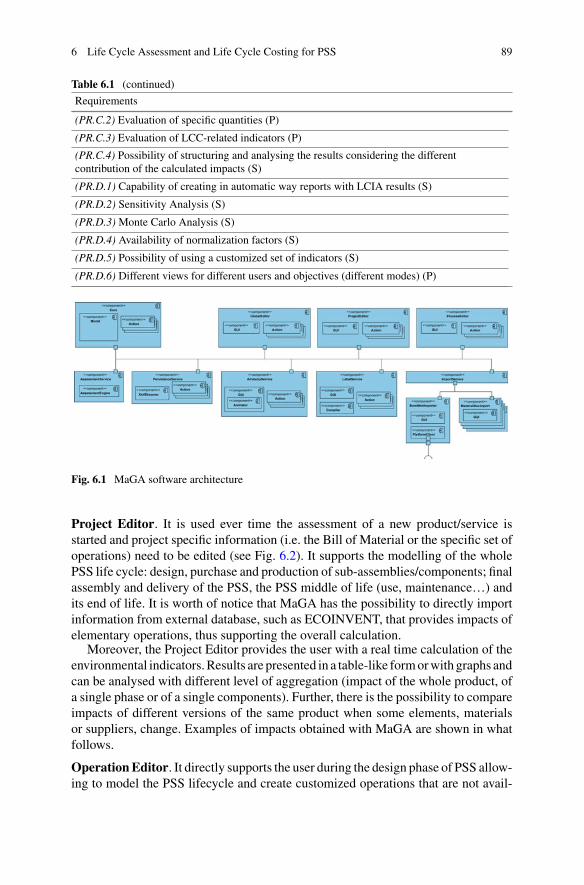
6 Life Cycle Assessment and Life Cycle Costing for PSS 89
Table 6.1 (continued)
Requirements
(PR.C.2) Evaluation of specific quantities (P)
(PR.C.3) Evaluation of LCC-related indicators (P)
(PR.C.4) Possibility of structuring and analysing the results considering the differentcontribution of the calculated impacts (S)
(PR.D.1) Capability of creating in automatic way reports with LCIA results (S)
(PR.D.2) Sensitivity Analysis (S)
(PR.D.3) Monte Carlo Analysis (S)
(PR.D.4) Availability of normalization factors (S)
(PR.D.5) Possibility of using a customized set of indicators (S)
(PR.D.6) Different views for different users and objectives (different modes) (P)
Fig. 6.1 MaGA software architecture
Project Editor. It is used ever time the assessment of a new product/service isstarted and project specific information (i.e. the Bill of Material or the specific set ofoperations) need to be edited (see Fig. 6.2). It supports the modelling of the wholePSS life cycle: design, purchase and production of sub-assemblies/components; finalassembly and delivery of the PSS, the PSS middle of life (use, maintenance…) andits end of life. It is worth of notice that MaGA has the possibility to directly importinformation from external database, such as ECOINVENT, that provides impacts ofelementary operations, thus supporting the overall calculation.
Moreover, the Project Editor provides the user with a real time calculation of theenvironmental indicators.Results are presented in a table-like formorwith graphs andcan be analysed with different level of aggregation (impact of the whole product, ofa single phase or of a single components). Further, there is the possibility to compareimpacts of different versions of the same product when some elements, materialsor suppliers, change. Examples of impacts obtained with MaGA are shown in whatfollows.
OperationEditor. It directly supports the user during the design phase of PSS allow-ing to model the PSS lifecycle and create customized operations that are not avail-

90 D. Corti et al.
able in the General Editor database and are not even available in existing database.Figure 6.3 shows how the Operation Editor has been used, for example, to model the3D printing process.
The integration ofMaGAwith theManutelligence platform enables the followingactivities (Fig. 6.4):
• import of the bill of material (BOM) from the CAD;
Fig. 6.2 Snapshot of the Project Editor of MaGA
Fig. 6.3 Snapshot of the Operation Editor of MaGA showing the modelling of the 3D printingprocess

6 Life Cycle Assessment and Life Cycle Costing for PSS 91
• export of the assessment results and possibility to carry out query of them directlyin the 3D experience;
• import and export of the MaGA project files from/to the 3DExperience platform;• import and export from/to zip files.
6.6 Testing the MaGA Tool in a FabLAB Environment
The MaGA tool has been tested by carrying out the LCA analysis for 3D printedproducts in the FabLAB facility based in Barcelona participating to the project. Inparticular, the environmental impact of a table-lamp (shown in Fig. 6.5) has beenevaluated.
First, the BOM created in the CAD has been imported in MaGA and then themissing data have been inserted manually. The impacts have been calculated also
Project files
Assessment
Project file
GUI
Single zip file
Fig. 6.4 Integration features between MaGA and the 3D Experience Testing the MaGA tool in aFabLAB environment
Fig. 6.5 The 3D printedlamp used to test the MaGAtool
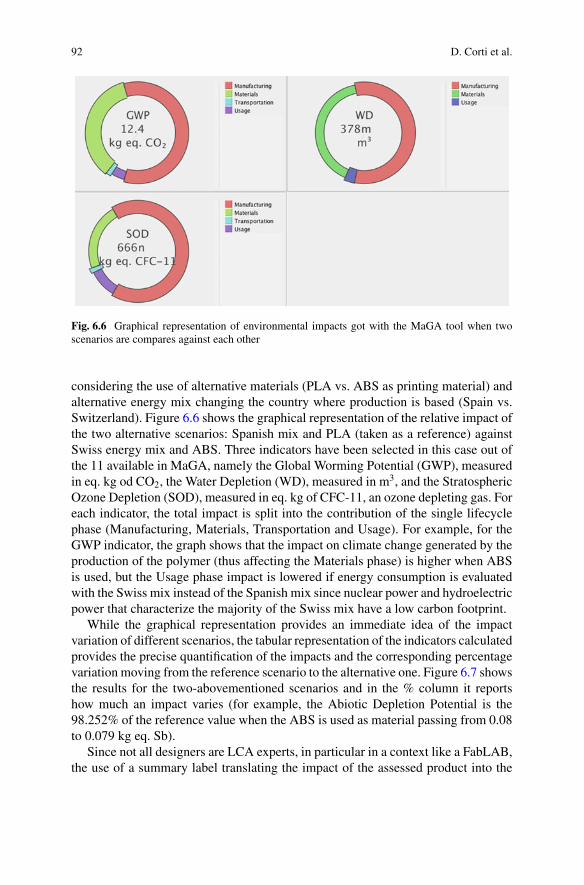
92 D. Corti et al.
Fig. 6.6 Graphical representation of environmental impacts got with the MaGA tool when twoscenarios are compares against each other
considering the use of alternative materials (PLA vs. ABS as printing material) andalternative energy mix changing the country where production is based (Spain vs.Switzerland). Figure 6.6 shows the graphical representation of the relative impact ofthe two alternative scenarios: Spanish mix and PLA (taken as a reference) againstSwiss energy mix and ABS. Three indicators have been selected in this case out ofthe 11 available in MaGA, namely the Global Worming Potential (GWP), measuredin eq. kg od CO2, the Water Depletion (WD), measured in m3, and the StratosphericOzone Depletion (SOD), measured in eq. kg of CFC-11, an ozone depleting gas. Foreach indicator, the total impact is split into the contribution of the single lifecyclephase (Manufacturing, Materials, Transportation and Usage). For example, for theGWP indicator, the graph shows that the impact on climate change generated by theproduction of the polymer (thus affecting the Materials phase) is higher when ABSis used, but the Usage phase impact is lowered if energy consumption is evaluatedwith the Swiss mix instead of the Spanish mix since nuclear power and hydroelectricpower that characterize the majority of the Swiss mix have a low carbon footprint.
While the graphical representation provides an immediate idea of the impactvariation of different scenarios, the tabular representation of the indicators calculatedprovides the precise quantification of the impacts and the corresponding percentagevariation moving from the reference scenario to the alternative one. Figure 6.7 showsthe results for the two-abovementioned scenarios and in the % column it reportshow much an impact varies (for example, the Abiotic Depletion Potential is the98.252% of the reference value when the ABS is used as material passing from 0.08to 0.079 kg eq. Sb).
Since not all designers are LCA experts, in particular in a context like a FabLAB,the use of a summary label translating the impact of the assessed product into the

6 Life Cycle Assessment and Life Cycle Costing for PSS 93
Fig. 6.7 Tabular representation of results in MaGAwhen two scenarios are compared against eachother
equivalent impact of simple examples, like km travelled by cars in order to representthe burden generated by the emissions of CO2 (see Fig. 6.8), has been developed.
MaGa version: 0.4In compliance with SUPSI – Manutelligence LCA Assessment Model Supported by: H2020 - n° . 636951
Global warming potential
Land use
Water depletion
Metal depletion
71.3762
4.3148
3.5498
2966.188
13
2.69
3.54
593m
kg eq. CO₂
m²a
kg eq. FE
m³
A4 Sheets
Glasses ofwater
kmby cars
Date: 13.01.2017
kgof metal
Conversion factor: 0.18 kg CO2 eq. per kilometers travelled by car1
1
Fig. 6.8 Sustainability summary label generated by MaGA

94 D. Corti et al.
6.7 The LCC Tool: BAL.LCPA
In order to satisfy the LCC requirements of theManutelligence platform, the existentBAL.LCPA (Life Cycle Performance Assessment) tool has been adapted. The maineconomic KPI of the LCPA is the net-present value (NPV), which considers everycash flow throughout the life cycle and discounts the cash flows according to thespecific point in time of their occurrence. Since the NPV accounts cash outflows andcost inflows, the flexible approach satisfies the need of determining the life cycle costsand enhances the functionality to a full investment assessment, if the user requiresit. The comparable approach allows the direct investigation of different investmentopportunities against each other.
A meaningful result of the LCC analysis relies on the quality of the input data.As a part of the BAL.LCPA adoption process, the tool is able to connect to theManutelligence database in order to retrieve the required data to perform a life cycleanalysis. Therefore, a dedicated interface has been developed to ease the data import,as depicted in Fig. 6.9. The data import is getting translated into a basic LCPAmodel, in which the different cost items and their associated cost type are assigned(Fig. 6.10). The user has the chance to modify the basic LCPA model accordingto his/her assessment needs, like adding an additional life cycle phase or addingadditional cash flows.
In addition, the user can determine an individual cash flow development for eachcash flow type. Thereby, the tool allows the generation of a cash flow timeline witha fixed annual growth rate or an individual cash flow development to reflect, forinstance, an over proportional increase of maintenance costs throughout the lifecycle.
In the “Global Values” section, the user can determine the NPV interest rate.Moreover, the user determines the price developments for certain global costs cat-egories, like energy prices. BAL.LCPA also allows to consider external costs. Thecorresponding external cost rate per ton of harmful emissions, like CO2, can be setin the “Global Values” as well.
The life cycle cost results are presented in tabular form as well as bar chats andcurves throughout the lifecycle. Each result representation focuses on the compar-ison of different objects, like different design alternatives, to support the life cyclecost analysis. Each visualisation can be customised according to the needs of theuser. The life cycle cost results depend on the input data as well as on the assumedcircumstances of the considered lifecycle. Therefore, BAL.LCPA offers a sensitivityanalysis to test the robustness of the LCC results, when certain input parametersvary. In this way, the impact of a significant energy price increase on the LCC canbe tested and analysed (see sensitivity example in Fig. 6.11).
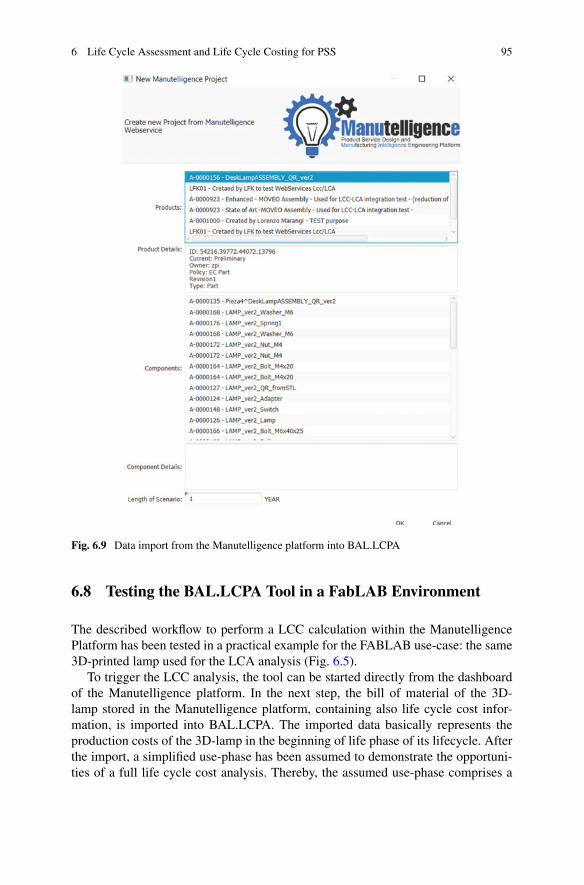
6 Life Cycle Assessment and Life Cycle Costing for PSS 95
Fig. 6.9 Data import from the Manutelligence platform into BAL.LCPA
6.8 Testing the BAL.LCPA Tool in a FabLAB Environment
The described workflow to perform a LCC calculation within the ManutelligencePlatform has been tested in a practical example for the FABLAB use-case: the same3D-printed lamp used for the LCA analysis (Fig. 6.5).
To trigger the LCC analysis, the tool can be started directly from the dashboardof the Manutelligence platform. In the next step, the bill of material of the 3D-lamp stored in the Manutelligence platform, containing also life cycle cost infor-mation, is imported into BAL.LCPA. The imported data basically represents theproduction costs of the 3D-lamp in the beginning of life phase of its lifecycle. Afterthe import, a simplified use-phase has been assumed to demonstrate the opportuni-ties of a full life cycle cost analysis. Thereby, the assumed use-phase comprises a
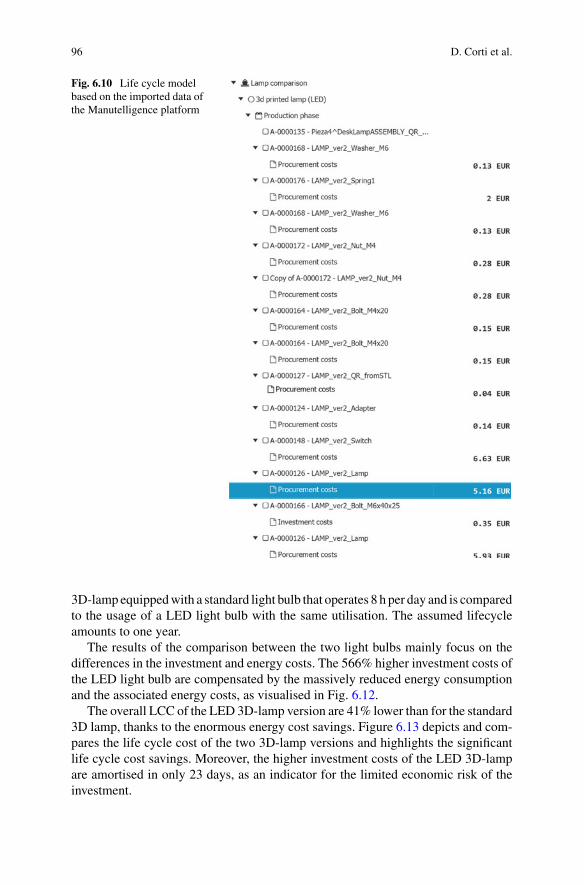
96 D. Corti et al.
Fig. 6.10 Life cycle modelbased on the imported data ofthe Manutelligence platform
3D-lamp equippedwith a standard light bulb that operates 8 h per day and is comparedto the usage of a LED light bulb with the same utilisation. The assumed lifecycleamounts to one year.
The results of the comparison between the two light bulbs mainly focus on thedifferences in the investment and energy costs. The 566% higher investment costs ofthe LED light bulb are compensated by the massively reduced energy consumptionand the associated energy costs, as visualised in Fig. 6.12.
The overall LCC of the LED 3D-lamp version are 41% lower than for the standard3D lamp, thanks to the enormous energy cost savings. Figure 6.13 depicts and com-pares the life cycle cost of the two 3D-lamp versions and highlights the significantlife cycle cost savings. Moreover, the higher investment costs of the LED 3D-lampare amortised in only 23 days, as an indicator for the limited economic risk of theinvestment.

6 Life Cycle Assessment and Life Cycle Costing for PSS 97
Fig. 6.11 Graphical representation of LCC results comparing alternatives scenarios
Fig. 6.12 Cost comparison of the 3D-lamp alternatives
In general, the LCPA approach can be adapted for the assessment of PSSs. Besidesthe relevant input data for products, like investment costs, energy costs, maintenanceand other operating costs, the analysis of the service part requires input data thatis more focused on, for instance, personnel costs, equipment usage to perform theservice, travel costs, as well as service fees as revenues. As a result, the comparativeLCPA approach enables the evaluation of different PSS concepts against each other.
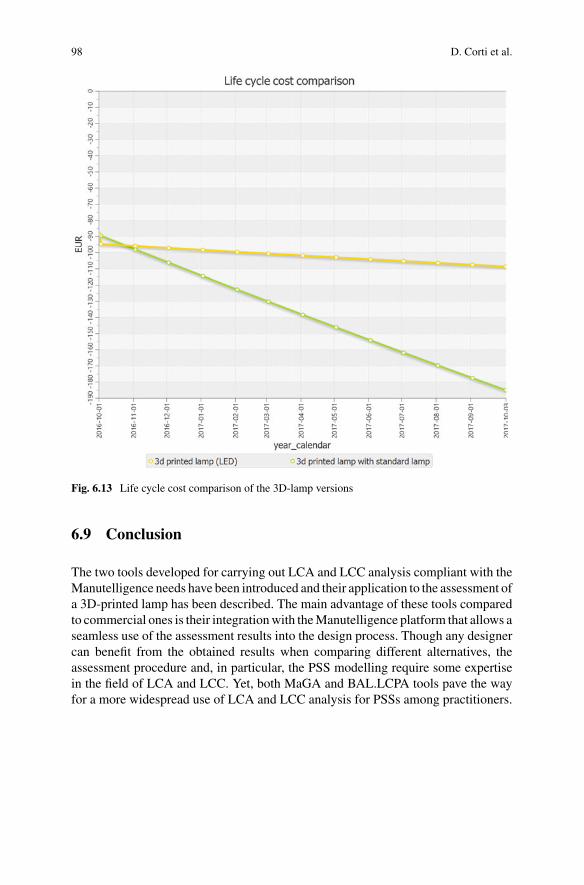
98 D. Corti et al.
Fig. 6.13 Life cycle cost comparison of the 3D-lamp versions
6.9 Conclusion
The two tools developed for carrying out LCA and LCC analysis compliant with theManutelligence needs have been introduced and their application to the assessment ofa 3D-printed lamp has been described. The main advantage of these tools comparedto commercial ones is their integrationwith theManutelligence platform that allows aseamless use of the assessment results into the design process. Though any designercan benefit from the obtained results when comparing different alternatives, theassessment procedure and, in particular, the PSS modelling require some expertisein the field of LCA and LCC. Yet, both MaGA and BAL.LCPA tools pave the wayfor a more widespread use of LCA and LCC analysis for PSSs among practitioners.
6 Life Cycle Assessment and Life Cycle Costing for PSS 99
References
1. Amaya J, Lelah A, Zwolinski P (2014) Design for intensified use in product–service systemsusing life-cycle analysis. J Eng Des 25(7–9):280–302
2. BeyN,McAloone TC (2006) FromLCA to PSS–Making leaps towards sustainability by apply-ing product/service-system thinking in product development. In: 13th CIRP International Con-ference on Life Cycle Engineering: LCE2006-Towards a Closed Loop Economy. pp 571–576
3. Corti D, Fontana A, Montorsi F (2016) Reference data architecture for PSSs Life Cycle Inven-tory. Procedia CIRP 47:300–304
4. Dal Lago M, Corti D, Wellsandt S (2017) Reinterpreting the LCA standard procedure for PSS.Procedia CIRP 64:73–78
5. Datta PP, Roy R (2010) Cost modelling techniques for availability type service support con-tracts: a literature review and empirical study. CIRP J Manufact Sci Technol 3(2):142–157
6. Doualle B, Medini K, Boucher X, Laforest V (2015) Investigating sustainability assessmentmethods of product-service systems. Procedia CIRP 30:161–166
7. ISO 14040 (2006) International standard, environmental management—life cycleassessment—principles and framework. International Organisation for Standardization,Geneva
8. ISO 14044 (2006) International standard, environmental management—life cycleassessment—requirements and guidelines. International Organisation for Standardization,Geneva
9. ISO 15686–5 (2008) Buildings and constructed assets—Service-life planning—Part 5: Life-cycle costing. International Organization for Standardization, Geneva
10. Kjaer LL, Pagoropoulos A, Schmidt JH, McAloone TC (2016) Challenges when evaluatingproduct/service-systems through life cycle assessment. J Clean Prod 120:95–104
11. Kwak M, Kim H (2013) Economic and environmental impacts of product service lifetime:a life-cycle perspective. In: Product-service integration for sustainable solutions. Springer,Berlin, pp 177–189
12. Mannweiler C, Siener M, Aurich JC (2012). Lifecycle cost oriented evaluation and selectionof product-service system variants. In: Proceedings of the 2nd CIRP IPS2 Conference 2010;14–15 April; Linköping; Sweden (No. 077). Linköping University Electronic Press, pp 21–26
13. Matsumoto E, Ohtake J, Okada J, Takata S (2013) A method for selecting delivery modesin environmentally benign product service system design. In: The philosopher’s stone forsustainability. Springer, Berlin, pp 375–380
14. Niemann J, Tichkiewitch S, Westkämper E (2009) Life cycle evaluation. In: Design of sustain-able product life cycle. Springer Science & Business Media, pp 58–59
15. NyH,Hallstedt S, EricsonÅ (2013)A strategic approach for sustainable product service systemdevelopment. In: CIRP design 2012. Springer, London, pp 427–436
16. Peruzzini M, GermaniM (2013) Investigating the sustainability of product and product-servicesystems in the B2C industry. In: Product-service integration for sustainable solutions. Springer,Berlin, pp 421–434
17. Sakao T (2013) Engineering PSS (Product/Service Systems) toward sustainability: review ofresearch. In: Handbook of sustainable engineering. Springer, Dordrecht, pp 597–613
18. Van Ostaeyen J, Kellens K, Van Horenbeek A, Duflou JR (2013) Quantifying the economicpotential of a PSS: methodology and case study. In: The philosopher’s stone for sustainability.Springer, Berlin, pp 523–528

100 D. Corti et al.
Open Access This chapter is licensed under the terms of the Creative Commons Attribution 4.0International License (http://creativecommons.org/licenses/by/4.0/), which permits use, sharing,adaptation, distribution and reproduction in any medium or format, as long as you give appropriatecredit to the original author(s) and the source, provide a link to the Creative Commons license andindicate if changes were made.
The images or other third party material in this chapter are included in the chapter’s CreativeCommons license, unless indicated otherwise in a credit line to the material. If material is notincluded in the chapter’s Creative Commons license and your intended use is not permitted bystatutory regulation or exceeds the permitted use, you will need to obtain permission directly fromthe copyright holder.

Chapter 7Use Cases
Claudio Violi, Laura Calvo Duarte, Catalina Amengual Garí, Pekka Puranen,Christian Norden and Lars Oscarsson
Abstract This chapter describes in details all the different use cases involved inthe project. It is focused on how each of them has applied Manutelligence methodsand tools in order to improve Product-Service system design and management. Aparticular focus is dedicated to the usage of the Manutelligence platform.
7.1 Ferrari Use Case
7.1.1 The Ferrari Company
Ferrari S.p.A. is an Italian luxury sports car designer and manufacturer based inMaranello. Founded by Enzo Ferrari in 1929, as Scuderia Ferrari, the companysponsored drivers and manufactured race cars before moving into production of
C. Violi (B)Ferrari S.p.A. Via dell’ Abetone Inferiore, 4, 41053 Maranello, MO, Italye-mail: [email protected]
L. C. Duarte · C. A. GaríUniversitat Politècnica de Catalunya-BarcelonaTECH, Centre CIM, C/Llorens i Artigas, 12,08028 Barcelona, Spaine-mail: [email protected]
C. A. Garíe-mail: [email protected]
P. PuranenMeyer Turku Oy, Telakkakatu 1, 20240 Turku, Finlande-mail: [email protected]
C. NordenBALance Technology Consulting GmbH, Contrescarpe 33, 28203 Bremen, Germanye-mail: [email protected]
L. OscarssonLindbäcks Bygg AB, Hammarvägen 21, 943 36 Öjebyn, Swedene-mail: [email protected]
© The Author(s) 2019L. Cattaneo and S. Terzi (eds.), Models, Methods and Tools for Product ServiceDesign, PoliMI SpringerBriefs, https://doi.org/10.1007/978-3-319-95849-1_7
101
102 C. Violi et al.
street-legal vehicles in 1947. Since then, Ferrari has caught on race tracks and roadsall over the world more than 5000 victories, creating the basis of the Ferrari legend.Ferrari road cars are generally seen as a symbol of speed, luxury and wealth. Thefamous symbol of the Ferrari race team is the Cavallino Rampante (“prancing horse”)black prancing stallion on a yellow shield, usually with the letters S F (for ScuderiaFerrari), with three stripes of green, white and red (the Italian national colors) at thetop.
7.1.2 The Ferrari Business Challenges
The main challenges in developing Ferrari cars derive from the Ferrari corporatebusiness drivers, which are:
• Deliver outstanding cars (innovative, high performance and reliability, cost con-trolled, enhances Product-Service).
• Deliver best product portfolio (manage product differentiation, exploit specialseries and supercars, high configuration offering, address traditional and newmar-kets).
• Shorten time to market (high frequency of new car introduction, decrease risk offailing behind the market, control product development and manufacturing).
Obviously, these business drivers affect the whole vehicle life cycle from the conceptto the after-sale; furthermore these drivers dictate extremely high rules that the enter-prise has to fulfil towards their customers (product excellence, customer attitude andservice). For these reasons the usual development and the manufacturing functionsin Ferrari are very special. In detail, the process from concept to delivery is very longand sometime could take more than one year and a half. Thus, due to such a longperiod and complexity of processes, several challenges should be taken into account:
1. During the time horizon the technical characteristics as well as the specifics couldchange therefore they have to be integrated into the vehicle, which could bealready entered from the engineering into the manufacturing process. Althoughthis ensure to the customer the best of last technologies and some more featuresnot yet available at the moment of the order, on the other hand it leads a complexprocess of requirements traceability and change.
2. The creation of a vehicle addresses disparate lifecycle phases, especially amongdesign, engineering and manufacturing. One of the most important phases isthe validation of the vehicle in term of design, this means that the virtual andphysical prototype have to be benchmarked as easily and reliably as possibleusing dashboards and KPI. In addition, the resulting data from testing have to beused as feedback in the design and engineering phase in order to optimize theproduct. This triggers the need for fast, ubiquitous and secure sharing of productand service information across the entire Product-Service lifecycle involving allthe relevant decision makers from the different functions.
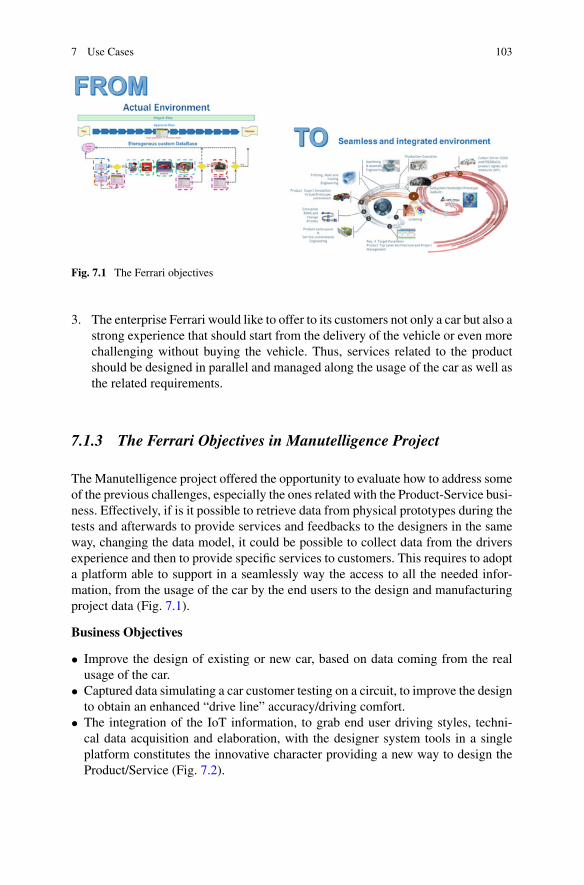
7 Use Cases 103
Fig. 7.1 The Ferrari objectives
3. The enterprise Ferrari would like to offer to its customers not only a car but also astrong experience that should start from the delivery of the vehicle or even morechallenging without buying the vehicle. Thus, services related to the productshould be designed in parallel and managed along the usage of the car as well asthe related requirements.
7.1.3 The Ferrari Objectives in Manutelligence Project
The Manutelligence project offered the opportunity to evaluate how to address someof the previous challenges, especially the ones related with the Product-Service busi-ness. Effectively, if is it possible to retrieve data from physical prototypes during thetests and afterwards to provide services and feedbacks to the designers in the sameway, changing the data model, it could be possible to collect data from the driversexperience and then to provide specific services to customers. This requires to adopta platform able to support in a seamlessly way the access to all the needed infor-mation, from the usage of the car by the end users to the design and manufacturingproject data (Fig. 7.1).
Business Objectives
• Improve the design of existing or new car, based on data coming from the realusage of the car.
• Captured data simulating a car customer testing on a circuit, to improve the designto obtain an enhanced “drive line” accuracy/driving comfort.
• The integration of the IoT information, to grab end user driving styles, techni-cal data acquisition and elaboration, with the designer system tools in a singleplatform constitutes the innovative character providing a new way to design theProduct/Service (Fig. 7.2).
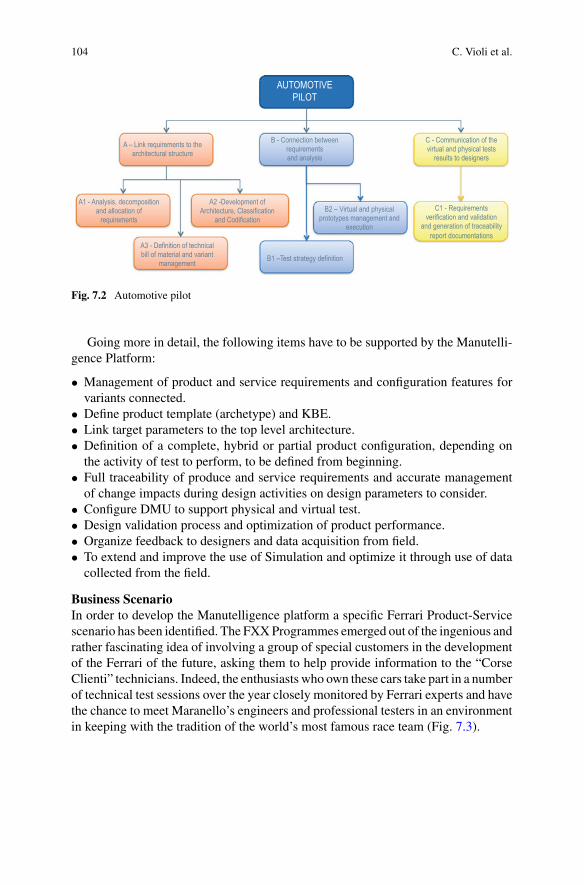
104 C. Violi et al.
AUTOMOTIVEPILOT
C - Communication of thevirtual and physical tests
results to designers
B - Connection betweenrequirementsand analysis
A – Link requirements to thearchitectural structure
A1 - Analysis, decompositionand allocation of
requirements
A2 -Development of Architecture, Classification
and Codification
A3 - Definition of technicalbill of material and variant
management
C1 - Requirementsverification and validation
and generation of traceabilityreport documentations
B2 – Virtual and physicalprototypes management and
execution
B1 –Test strategy definition
Fig. 7.2 Automotive pilot
Going more in detail, the following items have to be supported by the Manutelli-gence Platform:
• Management of product and service requirements and configuration features forvariants connected.
• Define product template (archetype) and KBE.• Link target parameters to the top level architecture.• Definition of a complete, hybrid or partial product configuration, depending onthe activity of test to perform, to be defined from beginning.
• Full traceability of produce and service requirements and accurate managementof change impacts during design activities on design parameters to consider.
• Configure DMU to support physical and virtual test.• Design validation process and optimization of product performance.• Organize feedback to designers and data acquisition from field.• To extend and improve the use of Simulation and optimize it through use of datacollected from the field.
Business ScenarioIn order to develop the Manutelligence platform a specific Ferrari Product-Servicescenario has been identified. The FXXProgrammes emerged out of the ingenious andrather fascinating idea of involving a group of special customers in the developmentof the Ferrari of the future, asking them to help provide information to the “CorseClienti” technicians. Indeed, the enthusiasts who own these cars take part in a numberof technical test sessions over the year closely monitored by Ferrari experts and havethe chance to meet Maranello’s engineers and professional testers in an environmentin keeping with the tradition of the world’s most famous race team (Fig. 7.3).

7 Use Cases 105
Fig. 7.3 FXX programme servitization-driven R&D
7.1.4 Use Case—Drive Style Comfort and Accuracy
In order to validate the Manutelligence platform a specific use case was selected,the Drive Style Comfort and Accuracy. The Drive Style is strongly depending on theaccuracy, i.e. the capability to be precise while using the steeringwheel to execute thebest path, either on the circuit either on the road, and on the comfort, i.e. the easinessto control the steering wheel that requires to minimize any vibration deriving fromthe powertrain transmission system.
The objective is to improve the performance of the driving sensitivity andprecisionat low and high speeds by reducing the amplitude of the vibration of the steering line,caused either by the road irregularities (holes or kerb) either by the vibrations inducedby the system itself. The vibrations cause a loss of sensitivity (sensitivity/drivingaccuracy) so that the driver is reducing speed when on circuit or is subject, whendriving on the road, to a more or less evident fatigue driving.
Then the use case was analyzed executing one session of test on Fiorano circuitusing FXX car and one specialist test driver, capturing the data related to the steeringline, composed by the suspension corner, the steering box, the steering column andthe steering wheel. In parallel the virtual model of the car was developed to executefrequency and modal analysis. Using the test data, the virtual model was calibrated(Figs. 7.4, 7.5, 7.6 and 7.7).
Another fundamental analysis was setup in order to enable the traceability of thetests. The management of the requirements, the target parameters, the test executiondata, the BOM of the specific car used in the test, the test execution measurementswere implemented. This means to manage
• Serialized BOM.• Test case versus test results.• Traceability matrix (components/tests data).

106 C. Violi et al.
Fig. 7.4 Ferrari XX programme Fiorano circuit
Fig. 7.5 Data acquisition from the steering line
Fig. 7.6 Data acquisition on the 3DEXPERIENCE platform
The final target is to improve the development of new car with a process that isable to capture and organize data coming from the real usage of the product by the endusers, leveraging the IoT technology, to develop a virtual model to simulate the realusage in a quick and at less cost way, leveraging on the Design and Manufacturingplatform solution. This iterative processwill support the improvement of the Product-Service design in a more efficient and time-to-market oriented approach (Fig. 7.8).
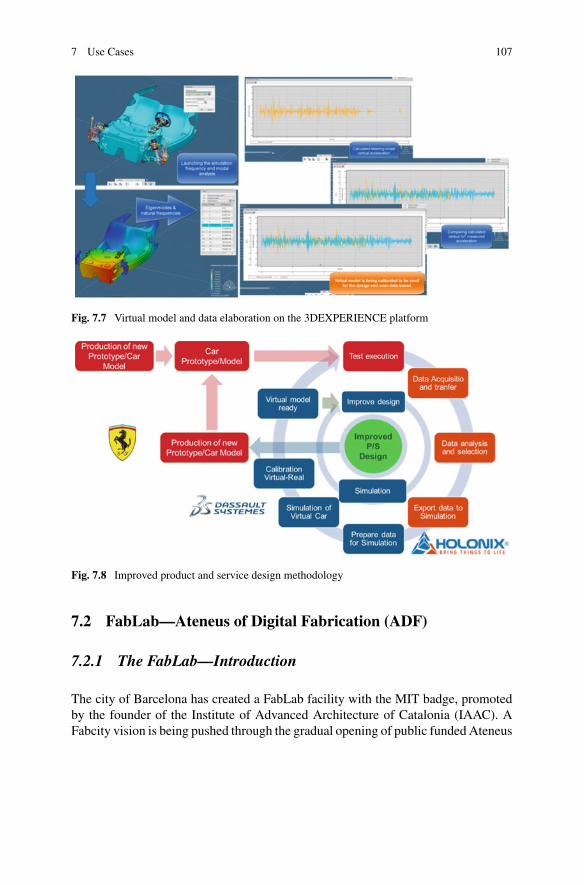
7 Use Cases 107
Fig. 7.7 Virtual model and data elaboration on the 3DEXPERIENCE platform
Fig. 7.8 Improved product and service design methodology
7.2 FabLab—Ateneus of Digital Fabrication (ADF)
7.2.1 The FabLab—Introduction
The city of Barcelona has created a FabLab facility with the MIT badge, promotedby the founder of the Institute of Advanced Architecture of Catalonia (IAAC). AFabcity vision is being pushed through the gradual opening of public funded Ateneus
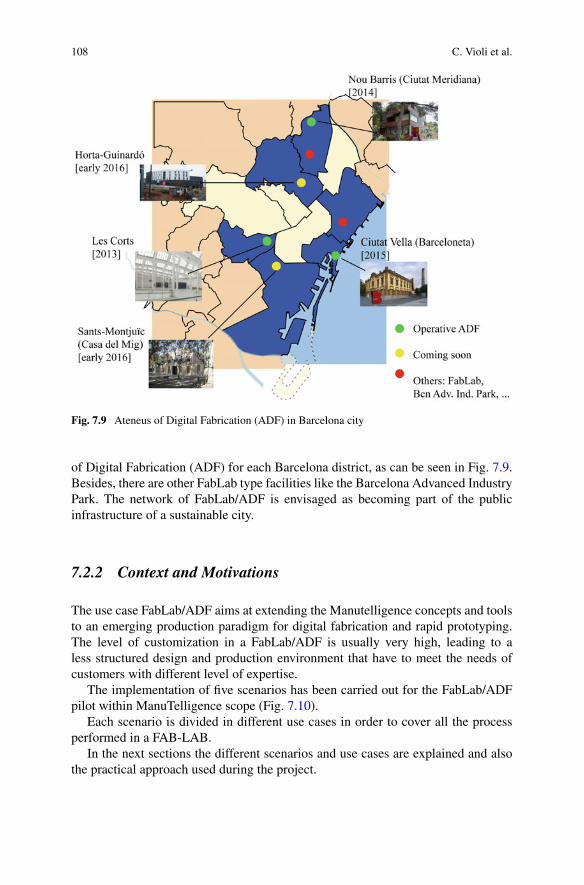
108 C. Violi et al.
Fig. 7.9 Ateneus of Digital Fabrication (ADF) in Barcelona city
of Digital Fabrication (ADF) for each Barcelona district, as can be seen in Fig. 7.9.Besides, there are other FabLab type facilities like the Barcelona Advanced IndustryPark. The network of FabLab/ADF is envisaged as becoming part of the publicinfrastructure of a sustainable city.
7.2.2 Context and Motivations
The use case FabLab/ADF aims at extending the Manutelligence concepts and toolsto an emerging production paradigm for digital fabrication and rapid prototyping.The level of customization in a FabLab/ADF is usually very high, leading to aless structured design and production environment that have to meet the needs ofcustomers with different level of expertise.
The implementation of five scenarios has been carried out for the FabLab/ADFpilot within ManuTelligence scope (Fig. 7.10).
Each scenario is divided in different use cases in order to cover all the processperformed in a FAB-LAB.
In the next sections the different scenarios and use cases are explained and alsothe practical approach used during the project.
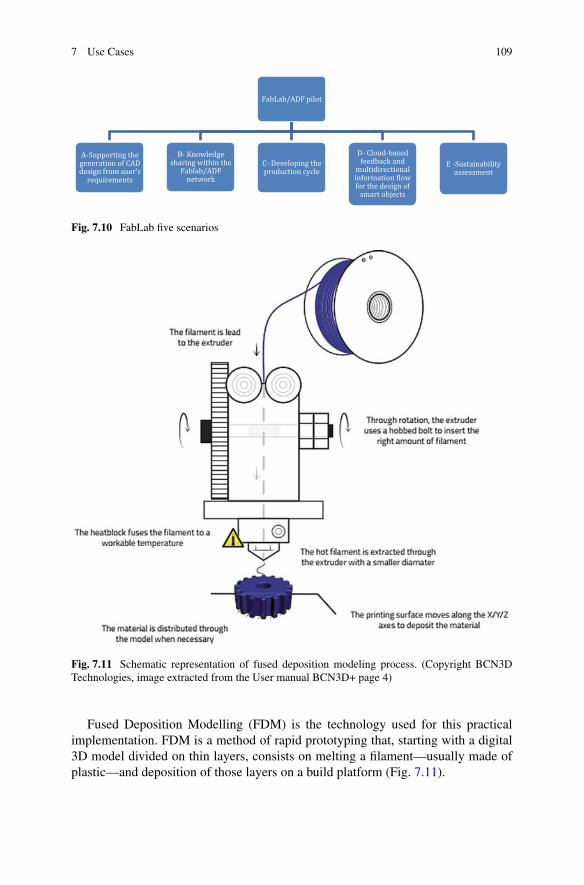
7 Use Cases 109
Fig. 7.10 FabLab five scenarios
Fig. 7.11 Schematic representation of fused deposition modeling process. (Copyright BCN3DTechnologies, image extracted from the User manual BCN3D+ page 4)
Fused Deposition Modelling (FDM) is the technology used for this practicalimplementation. FDM is a method of rapid prototyping that, starting with a digital3D model divided on thin layers, consists on melting a filament—usually made ofplastic—and deposition of those layers on a build platform (Fig. 7.11).
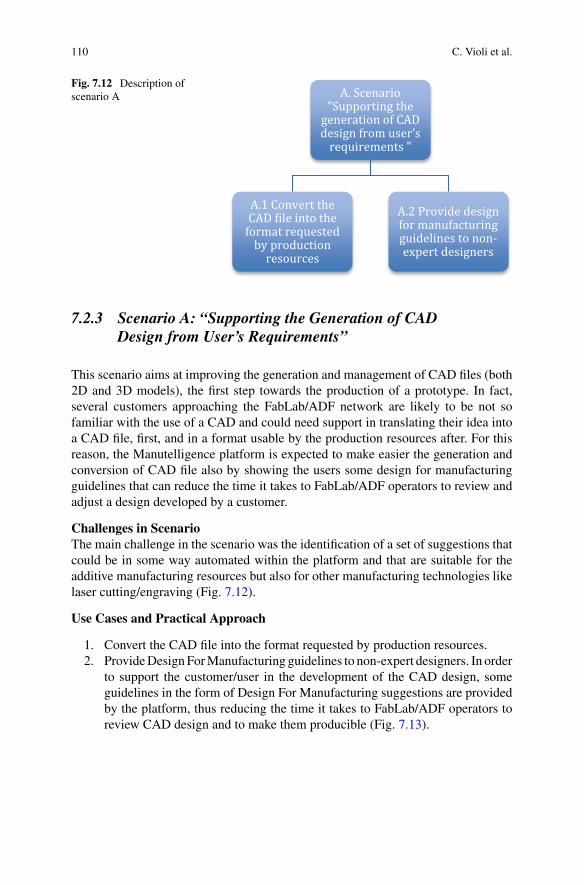
110 C. Violi et al.
Fig. 7.12 Description ofscenario A
7.2.3 Scenario A: “Supporting the Generation of CADDesign from User’s Requirements”
This scenario aims at improving the generation and management of CAD files (both2D and 3D models), the first step towards the production of a prototype. In fact,several customers approaching the FabLab/ADF network are likely to be not sofamiliar with the use of a CAD and could need support in translating their idea intoa CAD file, first, and in a format usable by the production resources after. For thisreason, the Manutelligence platform is expected to make easier the generation andconversion of CAD file also by showing the users some design for manufacturingguidelines that can reduce the time it takes to FabLab/ADF operators to review andadjust a design developed by a customer.
Challenges in ScenarioThe main challenge in the scenario was the identification of a set of suggestions thatcould be in some way automated within the platform and that are suitable for theadditive manufacturing resources but also for other manufacturing technologies likelaser cutting/engraving (Fig. 7.12).
Use Cases and Practical Approach
1. Convert the CAD file into the format requested by production resources.2. ProvideDesign ForManufacturing guidelines to non-expert designers. In order
to support the customer/user in the development of the CAD design, someguidelines in the form of Design For Manufacturing suggestions are providedby the platform, thus reducing the time it takes to FabLab/ADF operators toreview CAD design and to make them producible (Fig. 7.13).
7 Use Cases 111
Fig. 7.13 Guidelines available on the platform
Fig. 7.14 Description of scenario B
7.2.4 Scenario B: “Knowledge Sharing Withinthe FabLab/ADF Network”
The objective of this scenario is to make easier the collaboration, communicationand sharing of information between customers/designers who attend FabLab/ADFfacilities to turn their ideas into real products.
The result of this scenario is also a process design that is more structured than thecurrent one, thanks to the inclusion of the Bill of Material (BOM) of the products,representing a real innovation. Defining BOM of a product is an extended strategyfor more complex industries such as car, ship or aerospace.
Challenges in ScenarioIntegrate different technological platform in the scope of FabLabs/ADF networks(Fig. 7.14).
Use Cases and Practical Approach
1. Crowdsourcing. To involve more people in the realization of a project. Theinclusion of a simplified BOM of a product will facilitate LCA and LCCanalysis (see scenarios E). The possibility to add information in the platformby expert users and the possibility of using forums for the knowledge exchangefacilitates collaboration between different disciplines.
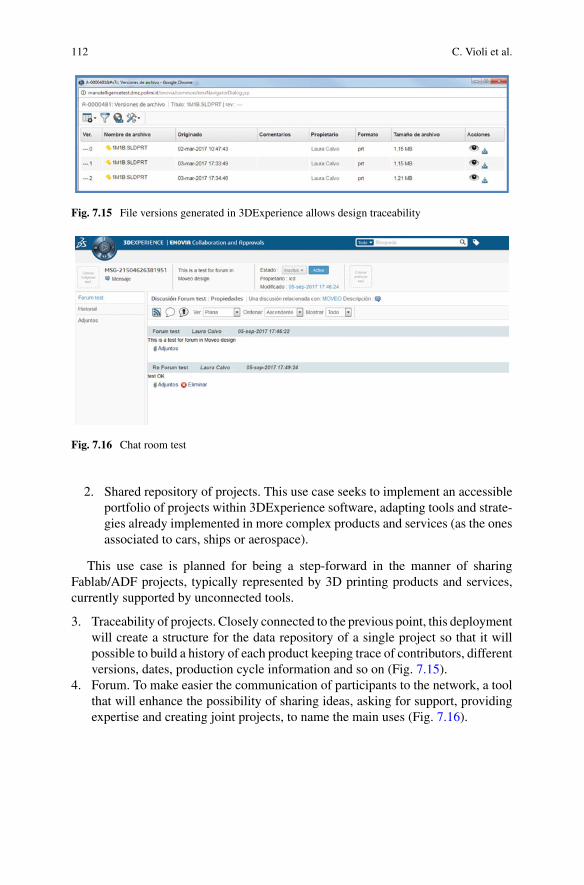
112 C. Violi et al.
Fig. 7.15 File versions generated in 3DExperience allows design traceability
Fig. 7.16 Chat room test
2. Shared repository of projects. This use case seeks to implement an accessibleportfolio of projects within 3DExperience software, adapting tools and strate-gies already implemented in more complex products and services (as the onesassociated to cars, ships or aerospace).
This use case is planned for being a step-forward in the manner of sharingFablab/ADF projects, typically represented by 3D printing products and services,currently supported by unconnected tools.
3. Traceability of projects. Closely connected to the previous point, this deploymentwill create a structure for the data repository of a single project so that it willpossible to build a history of each product keeping trace of contributors, differentversions, dates, production cycle information and so on (Fig. 7.15).
4. Forum. To make easier the communication of participants to the network, a toolthat will enhance the possibility of sharing ideas, asking for support, providingexpertise and creating joint projects, to name the main uses (Fig. 7.16).
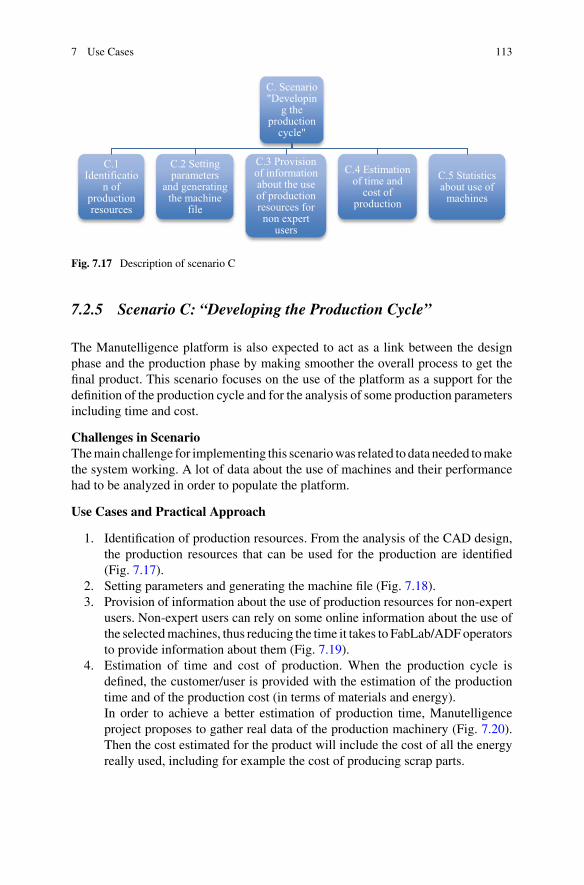
7 Use Cases 113
Fig. 7.17 Description of scenario C
7.2.5 Scenario C: “Developing the Production Cycle”
The Manutelligence platform is also expected to act as a link between the designphase and the production phase by making smoother the overall process to get thefinal product. This scenario focuses on the use of the platform as a support for thedefinition of the production cycle and for the analysis of some production parametersincluding time and cost.
Challenges in ScenarioThemain challenge for implementing this scenariowas related to data needed tomakethe system working. A lot of data about the use of machines and their performancehad to be analyzed in order to populate the platform.
Use Cases and Practical Approach
1. Identification of production resources. From the analysis of the CAD design,the production resources that can be used for the production are identified(Fig. 7.17).
2. Setting parameters and generating the machine file (Fig. 7.18).3. Provision of information about the use of production resources for non-expert
users. Non-expert users can rely on some online information about the use ofthe selectedmachines, thus reducing the time it takes to FabLab/ADFoperatorsto provide information about them (Fig. 7.19).
4. Estimation of time and cost of production. When the production cycle isdefined, the customer/user is provided with the estimation of the productiontime and of the production cost (in terms of materials and energy).In order to achieve a better estimation of production time, Manutelligenceproject proposes to gather real data of the production machinery (Fig. 7.20).Then the cost estimated for the product will include the cost of all the energyreally used, including for example the cost of producing scrap parts.

114 C. Violi et al.
Fig. 7.18 Printing profiles added in the 3DEXPERIENCE
Fig. 7.19 Screenshot from the Platform
Fig. 7.20 Energy monitoring report
5. Statistics about use ofmachines. This pilot aims themonitoring of several digi-tal productionmachinery included in a standard Fablab/ADF facility (3Dprint-ers, laser engravers, vinyl cutters…) with cost-affordable monitoring energysystems, capable of sending data to I-Like software from the Manutelligenceplatform and keeping it in a big database (Fig. 7.21).
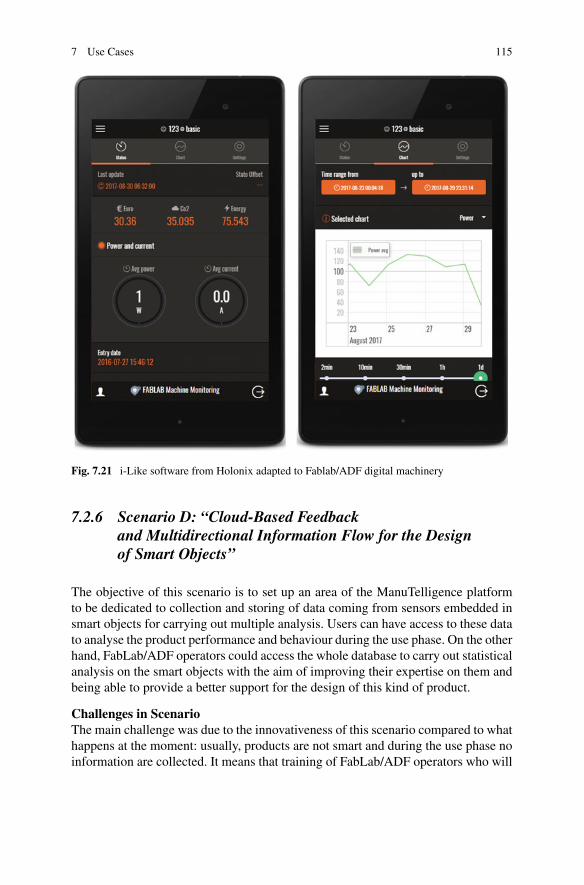
7 Use Cases 115
Fig. 7.21 i-Like software from Holonix adapted to Fablab/ADF digital machinery
7.2.6 Scenario D: “Cloud-Based Feedbackand Multidirectional Information Flow for the Designof Smart Objects”
The objective of this scenario is to set up an area of the ManuTelligence platformto be dedicated to collection and storing of data coming from sensors embedded insmart objects for carrying out multiple analysis. Users can have access to these datato analyse the product performance and behaviour during the use phase. On the otherhand, FabLab/ADF operators could access the whole database to carry out statisticalanalysis on the smart objects with the aim of improving their expertise on them andbeing able to provide a better support for the design of this kind of product.
Challenges in ScenarioThe main challenge was due to the innovativeness of this scenario compared to whathappens at the moment: usually, products are not smart and during the use phase noinformation are collected. It means that training of FabLab/ADF operators who will
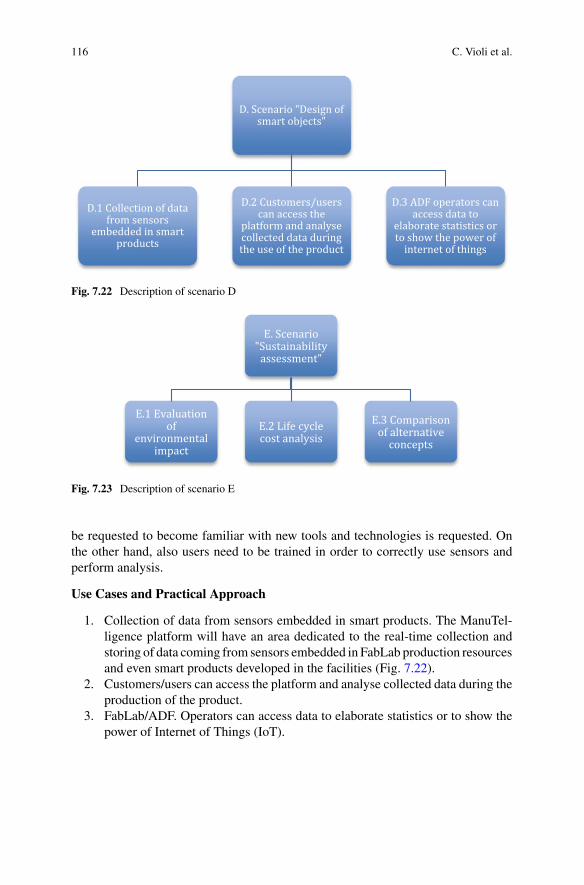
116 C. Violi et al.
Fig. 7.22 Description of scenario D
Fig. 7.23 Description of scenario E
be requested to become familiar with new tools and technologies is requested. Onthe other hand, also users need to be trained in order to correctly use sensors andperform analysis.
Use Cases and Practical Approach
1. Collection of data from sensors embedded in smart products. The ManuTel-ligence platform will have an area dedicated to the real-time collection andstoring of data coming from sensors embedded in FabLab production resourcesand even smart products developed in the facilities (Fig. 7.22).
2. Customers/users can access the platform and analyse collected data during theproduction of the product.
3. FabLab/ADF. Operators can access data to elaborate statistics or to show thepower of Internet of Things (IoT).

7 Use Cases 117
Fig. 7.24 3D printed lamp
7.2.7 Scenario E: “Sustainability Assessment”
The objective of this scenario is the integration of LCC and LCA tools into the designprocess of the FabLabs/ADF. Methods suitable for little structured design processlike the one in FabLabs/ADF have to be developed starting from the Manutelligencetools. During the design process, it is possible to provide information about theenvironmental and the economic sustainability of the product being developed. Onone hand, this allows the choice of the more sustainable solution among the availableoptions thus improving the level of sustainability of the FabLab/ADF production.On the other hand, also users not directly interested in sustainability are made awareof the sustainability impact of their decisions thus increasing the level of knowledgeand attention about this topic that, per se, is a social aim.
Challenges in ScenarioThe main challenge in this case was related to the introduction of one more stepinto the design process that implies also the training of FabLab/ADF operators whohad been be requested to become familiar with new tools and new concepts. Theknowledge of these tools should be enough to support users/customers in their under-standing.
Use Cases and Practical Approach
1. The evaluation of environmental impacts. It was done with theManutelligenceadapted LCA tool, MaGA. The LCA of the lamp was done in MaGa using thedata collectedwhen building the 3Dprinted lamp (Fig. 7.24) (more informationin Chap. 6) (Figs. 7.23 and 7.25).

118 C. Violi et al.
Fig. 7.25 Screen shot showing the creation of the 3D printed process in the MaGA software
2. Currently very simple models or methodologies are used to evaluate the costof products and services developed within a Fablab/ADF, like using a tablebased on an excel sheet.
The aim of this pilot is to advance in evaluating the cost of developing a product andservice within a Fablab/ADF. For this reason, the pilot is developing demo productssuch as the lamp for being implemented in LCPA software module by Balance. Thisuse case is linked with the developments done in the Scenario C.
This way of evaluating the project developed within the Fablab/ADF helps toimprove the evaluation of counterpart services that a customer of an Ateneu of Dig-ital Fabrication (ADF) must do for using for free the digital production machineryinstalled for the city council.
3. Comparison of alternative concepts. The sustainability assessment provides datain (almost) real time so that it is possible to compare different concepts of the sameproduct on the basis of its sustainability impacts. The designer is thus supportedin the selection of the final design making him/her aware of the generated impact(more information in Chap. 6). An example is shown at Figs. 7.38 and 7.39.

7 Use Cases 119
Fig. 7.26 Meyer Turku main scenarios in Manutelligence
7.3 Ship Use Case: Supporting Customer Feedbackfor Product-Service Design
7.3.1 Objectives and Results
The main goal is to move from product information management towards manufac-turing intelligence, through more efficient management and integration of ship dataand information. Focus is given on sharing the ship model to different stakehold-ers and supporting the communication between the different lifecycle phases, bothforward and backward. This is needed to improve the engineering and service devel-opment, both cost- and time-efficiency and quality but also to create preparednessfor offering the ship model as a service to the customer.
In Manutelligence, Meyer Turku currently defined four potential scenarios asdescribed in Fig. 7.26 and several use cases belonging to them. From the beginningit was clear that not all of them could be implemented in Manutelligence. Duringthe project the main focus was given to Scenario A: Enhancing customer feedbackto design. The implementation of the scenario is described more in detail below.
The main objective in Meyer Turku use case is to receive feedback from the yardcustomer (ship owner) with new and more efficient communication methods. Theidea is to add knowledge as a service to the product, to allow customer to view theship with virtual reality and to be able to have more visual communication aboutcurrent product prototype. In shipbuilding, product prototype means first ship in shipseries. Normally one ship series contains 1–5 sister ships. With improved customercommunication, it is possible to increase value of product by fulfilling customer needsin betterway.Virtual reality tools are used as a communicationmethod, because, fromphysically very large objects like a ship, it is difficult to create real 1:1 prototype ormock-ups. This idea can be also used in other product lifecycle phases, like betweendesign and production. With new methods of communication it is possible to havemore streamlined processes and finally to have better and more competitive product(Fig. 7.27).
Traditionally, material value is added in production to convert material into aproduct. In service sector, knowledge is sold as a service product. Combining productand service in the same entity as Product-Service makes better and more intelligentbusiness.
In Meyer Turku use case, new service layer was added to standard shipbuildingprocess (shipbuilding process is basically a material management process).
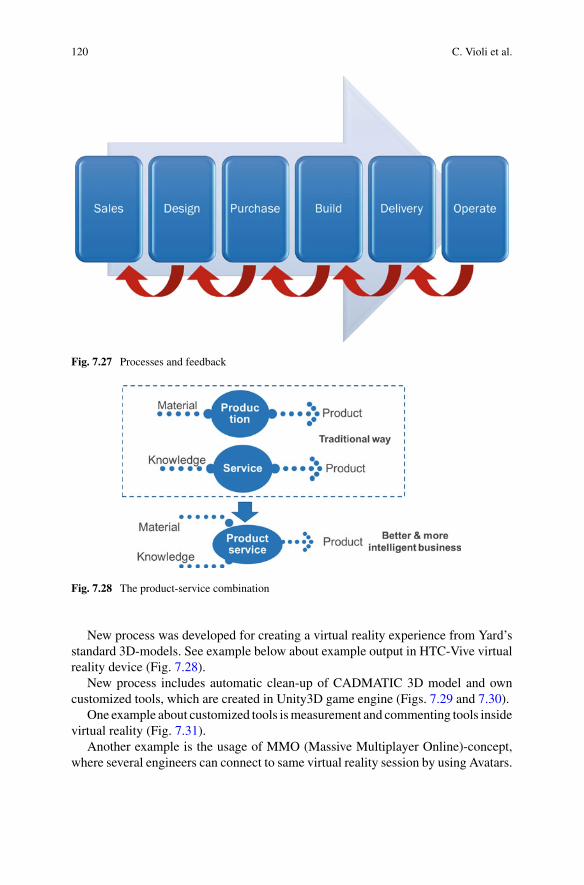
120 C. Violi et al.
Fig. 7.27 Processes and feedback
Fig. 7.28 The product-service combination
New process was developed for creating a virtual reality experience from Yard’sstandard 3D-models. See example below about example output in HTC-Vive virtualreality device (Fig. 7.28).
New process includes automatic clean-up of CADMATIC 3D model and owncustomized tools, which are created in Unity3D game engine (Figs. 7.29 and 7.30).
One example about customized tools ismeasurement and commenting tools insidevirtual reality (Fig. 7.31).
Another example is the usage of MMO (Massive Multiplayer Online)-concept,where several engineers can connect to same virtual reality session by using Avatars.

7 Use Cases 121
Fig. 7.29 Example output in HTC-Vive virtual reality device
Fig. 7.30 Scheme of new developed process
Avatar characters can use different hand movements and also VoIP communicationis possible. (Voice over Internet) (Fig. 7.32).
Meyer Turku has created in Manutelligence project demonstrator, which can beused as a collaborator-tool in real time usage. See picture Fig. 7.33 about idea andlayout of demonstrator.
The parts of the demonstration include:
• Presenter has got Laptop computer or mobile phone, which is connected toMMO-cloud (Massive Multiplayer Online). Presenter can show own desktop with stan-dard data projector.
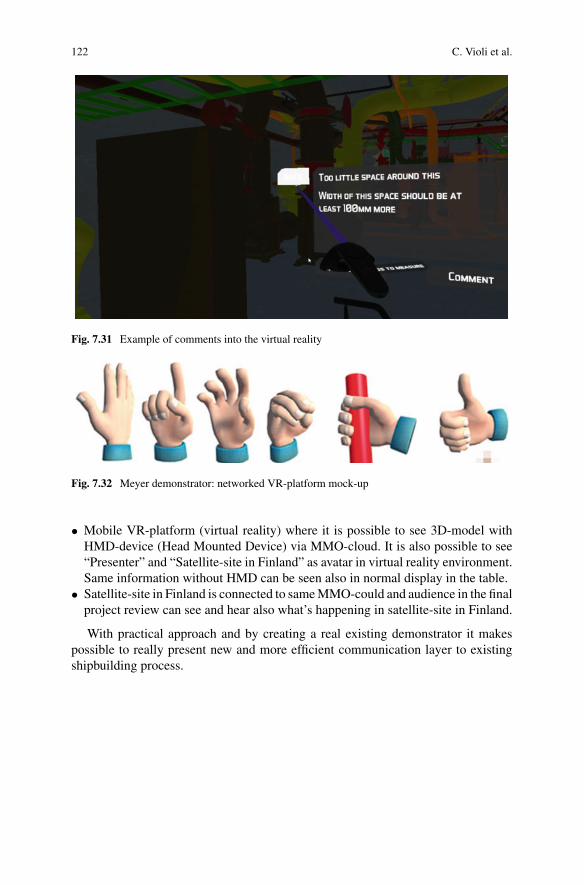
122 C. Violi et al.
Fig. 7.31 Example of comments into the virtual reality
Fig. 7.32 Meyer demonstrator: networked VR-platform mock-up
• Mobile VR-platform (virtual reality) where it is possible to see 3D-model withHMD-device (Head Mounted Device) via MMO-cloud. It is also possible to see“Presenter” and “Satellite-site in Finland” as avatar in virtual reality environment.Same information without HMD can be seen also in normal display in the table.
• Satellite-site in Finland is connected to sameMMO-could and audience in the finalproject review can see and hear also what’s happening in satellite-site in Finland.
With practical approach and by creating a real existing demonstrator it makespossible to really present new and more efficient communication layer to existingshipbuilding process.
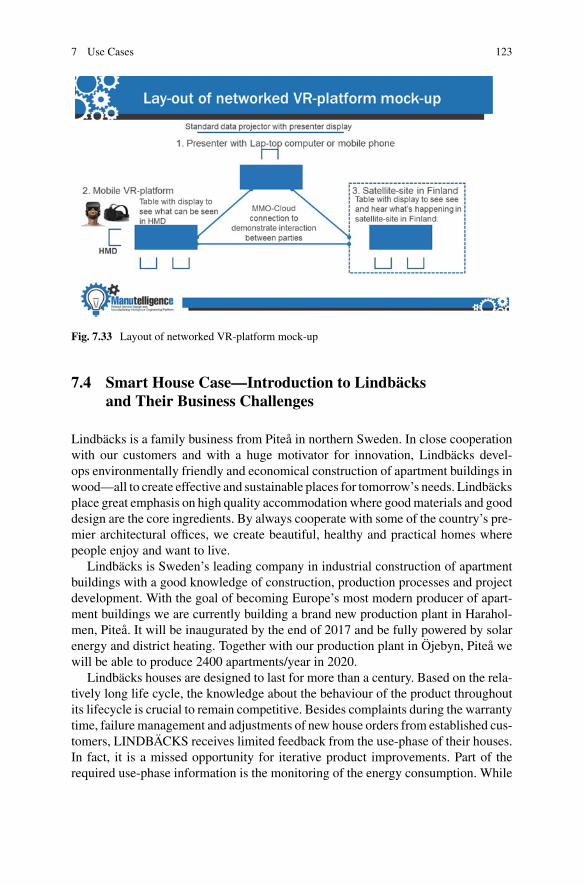
7 Use Cases 123
Fig. 7.33 Layout of networked VR-platform mock-up
7.4 Smart House Case—Introduction to Lindbäcksand Their Business Challenges
Lindbäcks is a family business from Piteå in northern Sweden. In close cooperationwith our customers and with a huge motivator for innovation, Lindbäcks devel-ops environmentally friendly and economical construction of apartment buildings inwood—all to create effective and sustainable places for tomorrow’s needs. Lindbäcksplace great emphasis on high quality accommodation where goodmaterials and gooddesign are the core ingredients. By always cooperate with some of the country’s pre-mier architectural offices, we create beautiful, healthy and practical homes wherepeople enjoy and want to live.
Lindbäcks is Sweden’s leading company in industrial construction of apartmentbuildings with a good knowledge of construction, production processes and projectdevelopment. With the goal of becoming Europe’s most modern producer of apart-ment buildings we are currently building a brand new production plant in Harahol-men, Piteå. It will be inaugurated by the end of 2017 and be fully powered by solarenergy and district heating. Together with our production plant in Öjebyn, Piteå wewill be able to produce 2400 apartments/year in 2020.
Lindbäcks houses are designed to last for more than a century. Based on the rela-tively long life cycle, the knowledge about the behaviour of the product throughoutits lifecycle is crucial to remain competitive. Besides complaints during the warrantytime, failure management and adjustments of new house orders from established cus-tomers, LINDBÄCKS receives limited feedback from the use-phase of their houses.In fact, it is a missed opportunity for iterative product improvements. Part of therequired use-phase information is the monitoring of the energy consumption. While

124 C. Violi et al.
the theoretical energy consumption is calculated in the house design process, thereis no real life validation of the actual energy consumption. Since the energy costsare becoming a cost driver in terms of life cycle costs, the real life proof of energyefficient houses could become a competitive advantage on the market.
Furthermore, Lindbäcks is looking for ways to enhance their business. Addingadditional services to the houses to offer a product-service system is one way ofthinking to approach new business areas. There are several ideas to establish addi-tional services for living and how to integrate them into the product service system.However, the service for living ideas have to serve a market. Therefore, the servicefor living needs an appropriate business model, that relies on a precise cost structure.Internet of things technology could help to analyse the cost structure of the envis-aged service for living offering and thereby support the development of new businessareas. The chapter describes, how the usage of the Manutelligence platform enablesLindbäcks to cope with the addressed business challenges.
7.4.1 Collecting Information of the Use-Phase to ImproveLindbäcks Houses
To tackle the business challenges described in Chap. 1, Lindbäcks pursues theapproach to implement internet of things technology within the Manutelligenceproject. The installation of the sensors is supposed to provide data to track the qualityof Lindbäcks houses throughout the lifecycle and to gather the actual energy con-sumption. The gathered data of the sensors is transferred to the I-like platform ofHolonix to serve as input parameters to the house designer at Lindbäcks and to thetenants, who can track his own energy consumption. Moreover, life cycle analysisbased on the measurement data could serve as marketing instrument for Lindbäcksto position their houses as sustainable in the market (Fig. 7.34).
In a first step, Lindbäcks selected several key parameters to measure throughoutthe lifecycle.
Key parameters in the LINDBÄCKS use-case
Cold water
Water warm
Heating system
Humidity in wood
Humidity air
Temperature air
Water leakage kitchen sink
Energy consumption of floor heating systems
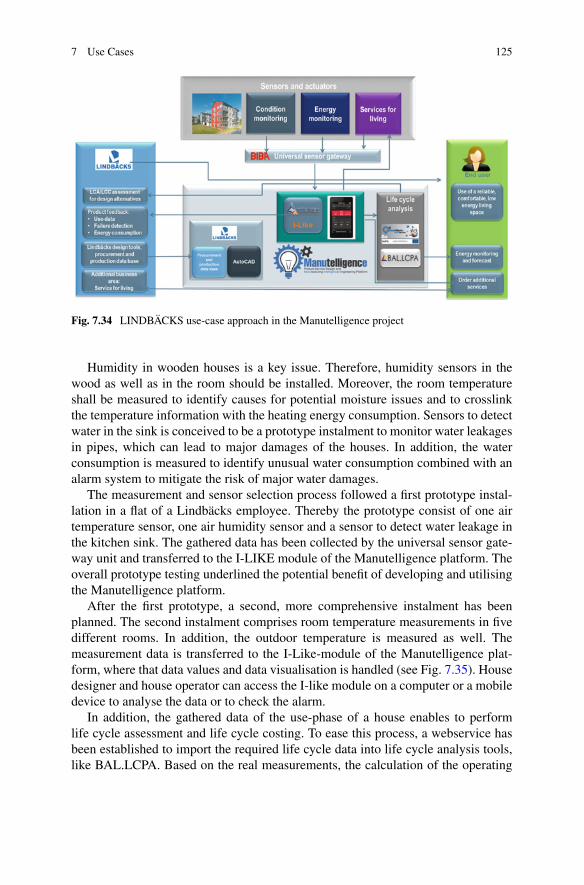
7 Use Cases 125
Fig. 7.34 LINDBÄCKS use-case approach in the Manutelligence project
Humidity in wooden houses is a key issue. Therefore, humidity sensors in thewood as well as in the room should be installed. Moreover, the room temperatureshall be measured to identify causes for potential moisture issues and to crosslinkthe temperature information with the heating energy consumption. Sensors to detectwater in the sink is conceived to be a prototype instalment to monitor water leakagesin pipes, which can lead to major damages of the houses. In addition, the waterconsumption is measured to identify unusual water consumption combined with analarm system to mitigate the risk of major water damages.
The measurement and sensor selection process followed a first prototype instal-lation in a flat of a Lindbäcks employee. Thereby the prototype consist of one airtemperature sensor, one air humidity sensor and a sensor to detect water leakage inthe kitchen sink. The gathered data has been collected by the universal sensor gate-way unit and transferred to the I-LIKE module of the Manutelligence platform. Theoverall prototype testing underlined the potential benefit of developing and utilisingthe Manutelligence platform.
After the first prototype, a second, more comprehensive instalment has beenplanned. The second instalment comprises room temperature measurements in fivedifferent rooms. In addition, the outdoor temperature is measured as well. Themeasurement data is transferred to the I-Like-module of the Manutelligence plat-form, where that data values and data visualisation is handled (see Fig. 7.35). Housedesigner and house operator can access the I-like module on a computer or a mobiledevice to analyse the data or to check the alarm.
In addition, the gathered data of the use-phase of a house enables to performlife cycle assessment and life cycle costing. To ease this process, a webservice hasbeen established to import the required life cycle data into life cycle analysis tools,like BAL.LCPA. Based on the real measurements, the calculation of the operating
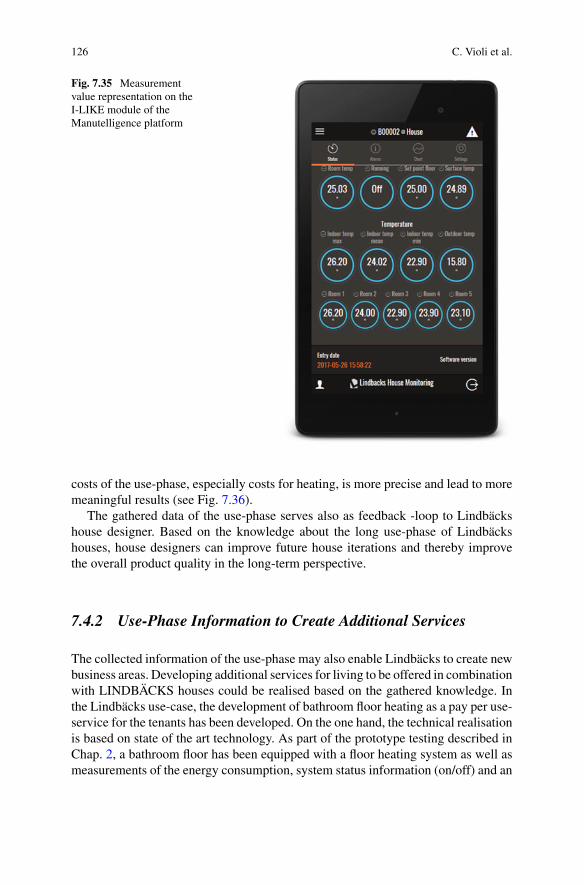
126 C. Violi et al.
Fig. 7.35 Measurementvalue representation on theI-LIKE module of theManutelligence platform
costs of the use-phase, especially costs for heating, is more precise and lead to moremeaningful results (see Fig. 7.36).
The gathered data of the use-phase serves also as feedback -loop to Lindbäckshouse designer. Based on the knowledge about the long use-phase of Lindbäckshouses, house designers can improve future house iterations and thereby improvethe overall product quality in the long-term perspective.
7.4.2 Use-Phase Information to Create Additional Services
The collected information of the use-phase may also enable Lindbäcks to create newbusiness areas. Developing additional services for living to be offered in combinationwith LINDBÄCKS houses could be realised based on the gathered knowledge. Inthe Lindbäcks use-case, the development of bathroom floor heating as a pay per use-service for the tenants has been developed. On the one hand, the technical realisationis based on state of the art technology. As part of the prototype testing described inChap. 2, a bathroom floor has been equipped with a floor heating system as well asmeasurements of the energy consumption, system status information (on/off) and an

7 Use Cases 127
Fig. 7.36 Energy costs comparison theoretical values versus measured values
Fig. 7.37 Manutelligence PSS system development methodology
actuator to change the system status remotely. On the other hand, the developmentof the service including business model, pricing and payment options is more com-plex. Therefore, the Lindbäcks use-case applies the PSS system development of theManutelligence project to create a new product service system (see Fig. 7.37).
128 C. Violi et al.
The PSS development methodology starts with the development of a businessmodel for the PSS in a business model canvas. In the second step, a quality functiondeployment is carried out. A third step includes an evaluation of the IoT functionalityof the PSS. Concurrent to the first three steps, a life cyclemodel is developed contain-ing relevant processes, stakeholders, and flows along the life cycle of the PSS. In alast step, the life cycle model is imported to life cycle analysis tools like BAL.LCPA,to evaluate the long-term profitability potential of the developed PSS. Part of theprofitability analysis is the price definition of the pay-per-use service. Thereby, twodifferent approaches for price finding are supported: On the one hand, a detailed lifecycle cost analysis with profit margin can determine the price, or focus group testingamong potential customers identifies the accepted price for the offered service.
7.4.3 Conclusion
TheManutelligence platform enables Lindbäcks to tackle their business challenge interms of gathering product feedback throughout the lifecycle, optimising the actualenergy consumption of their houses and developing new business areas. In particu-lar, the internet of things implementation combined with the I-Like platform for dataanalysis and -visualisation creates valuable product feedback to improve Lindbäckshouses in the long-term perspective. Based on the gathered information of the use-phase, Lindbäcks expects to reduce material and construction failures, lower repaircosts due to earlier recognition and optimise the energy efficiency of their houses. Inaddition, the life cycle analysis tools supports the product optimisation process andtheir results are supporting Lindbäcks in positioning their wooden houses as sustain-able products in themarket. TheManutelligence platform also encourages Lindbäcksto explore new business areas with its own methodology to develop product-servicesystems.
In fact, after the end of the Manutelligence project, Lindbäcks envisages to installIoT sensors in multiple commercial houses to gain the described benefits.
7 Use Cases 129
Open Access This chapter is licensed under the terms of the Creative Commons Attribution 4.0International License (http://creativecommons.org/licenses/by/4.0/), which permits use, sharing,adaptation, distribution and reproduction in any medium or format, as long as you give appropriatecredit to the original author(s) and the source, provide a link to the Creative Commons license andindicate if changes were made.
The images or other third party material in this chapter are included in the chapter’s CreativeCommons license, unless indicated otherwise in a credit line to the material. If material is notincluded in the chapter’s Creative Commons license and your intended use is not permitted bystatutory regulation or exceeds the permitted use, you will need to obtain permission directly fromthe copyright holder.
Chapter 8Business Exploitation
Manuela Zacchei, Silvia Capato and Gianicola Loriga
Abstract Business based on Product-Services is growing within the manufacturingsector, where companies are increasingly improving the service component of theiroffering to gain competitive advantage. Actually, the aggregation of product and ser-vice lifecycle engineering tools is able to generate a significant added value and theanalysis carried out in the following paragraphs is going to deeply illustrate the busi-ness potential of such tools within the manufacturing sector, with particular attentionto the use cases of the Manutelligence project. The whole process (the aggregationand the value creation) will be therefore investigated and the starting point will be theanalysis of Product Lifecycle Management, the relative technologies and the marketassociated. From the scenario analysis of the global PLM sector emerged that theaggregation of product and service lifecycle engineering tools is able to generate sig-nificant added value highlighting in this way the relevant commercial perspectives ofthe Manutelligence platform. Finally a business model for the Platform is presented.
8.1 Product/Service Life Cycle Management Scenario,Market Trends and Challenges
Insights into the global PLM market are given by CIMdata Inc., strategic consultingand research firm, which publishes every year global and regional analysis reportscovering the Product Lifecycle Management (PLM) market. According to CIM-data’s analysis, in year 2016, the PLM market grew to $40.6 billion overall, 5.0%growth in U.S. dollars over 2015. By analysing the specific PLM solution segments,
M. Zacchei (B) · S. Capato · G. LorigaRina Consulting S.p.A. Materials, Technology & Innovation, Via San Nazaro, 19, 16145 Genoa,Italye-mail: [email protected]
S. Capatoe-mail: [email protected]
G. Lorigae-mail: [email protected]
© The Author(s) 2019L. Cattaneo and S. Terzi (eds.), Models, Methods and Tools for Product ServiceDesign, PoliMI SpringerBriefs, https://doi.org/10.1007/978-3-319-95849-1_8
131

132 M. Zacchei et al.
Electronic Design Automation (EDA) counts for about 20.6% ($8.3 billion) of theoverall market, Systems Integrator/Reseller/VAR represents the 15.7% ($6.3 billion),cPDm (collaborative Product Definition management) is the third most importantsegment within the PLMmarket with a share 13.9% ($5.6 billion), S&A (Simulation& Analysis) counts for 13% ($5.2 billion) whereas Architectural, Engineering, andConstruction (AEC) represents about the 8.3% ($3.3 billion). After the five mostrelevant segments, there are: Mechanical Computer-Aided Design (MCAD) Multi-Discipline counting for about 8.8% ($3.5 billion) of the market, MCAD focusedrepresenting about 6.5% ($2.6 billion), Focused Application Providers (includingvisualization and collaboration, content, document management, etc.) with a shareof 5.1% ($2.0 billion), NC (Numerical Control) Non-Bundled with 3.1% ($1.2 bil-lion) and Digital Manufacturing counting for 1.8% ($717 million).1
Most of the PLMmarket leaders presented a relevant growth in the last years andcontinued to make strategic acquisitions to expand their portfolios as well as in somecases, to enter new markets. In this framework, CIMdata forecasts the PLM marketto grow at CAGR of 6.3% to $52.3 billion in 2020.2
Currently, in the PLM market among the solution providers there are four bigplayers (Autodesk, Dassault Systèmes, PTC and Siemens PLM), Enterprise resourceplanning (ERP) vendors (Infor, Oracle, SAP) and others providers including newplayers offering different kind of PLM solutions among other products. The productinnovation, product development and engineering processes result to be the prioritiesin today’s vendors objectives. As far as the larger players are concerned, the PLMmarket is evolving on 4 key aspects: (1) Reaching more people (more customers,including also SMEs with cloud-based solutions); (2) Covering a richer view ofthe product; (3) Enabling more processes; (4) Supporting further up and down theproduct lifecycle.3
The current PLM solutions mostly rely on managing CAD models, documents,BOM, Product configurations and Simulations, more andmore enlarging the scope tothe manufacturing planning and management, with a minor coverage of the productlifecycle tasks following the delivery to customer.
Hence, business potential is envisaged for advancedPLMsolutions able tomanageall the processes related to the product lifecycle, including also the service compo-nent: there is the need to have a PLM solution that integrates in one platform everyaspect of the entire product-service lifecycle.
More in details4,5 the PLM market is going towards a significant transformationand the main trends are the following:
1https://www.cimdata.com/en/news/item/8281-cimdata-publishes-executive-plm-market-report(CIMdata 2017 Executive PLM Market Report).2https://www.cimdata.com/en/news/item/6459-cimdata-publishes-plm-market-and-solution-provider-report (The CIMdata 2016 PLM Market and Solution Provider Analysis Report).3http://tech-clarity.com/plm-vendors-2015/4269 (Strategies of the Major PLM Vendors 2015+).4http://tech-clarity.com/strategies-of-the-major-plm-vendors-2016/5048 (Strategies of the MajorPLM Vendors 2016+).5https://blogs.oracle.com/PLM/entry/3_trends_driving_big_changes.
8 Business Exploitation 133
1. Platformization: there is a transition from standalone PLM, CAD, CAM, andCAE tools to Integrated Innovation Platforms able to provide a holistic, inte-grated approach enabling cross functional collaboration. There is the need ofadvanced capabilities in order to manage all the different phases and data relatedto the entire product lifecycle (i.e. from innovation and product development, tocommercialization and service management).
2. ServiceManagement: there are great business potential for commercialization ofPLM tools that handle the service management across the whole product lifecy-cle, considering services integrated with the product-related data and activities.
3. Market dynamics changedby the cloud: there is relevant number ofmanufacturersand vendors that are beginning the transition to the Cloud.
4. Internet of Things (IoT): IoT and Industry 4.0 are dramatically reshaping thePLM sector.
5. Innovation platform: PLM solutions are evolving towards the support to bottomup innovation, providing companies with a systematic approach to capture, selectand invest in the promising innovative ideas, allowing at the same time finan-cial and cost analysis. PLM solutions are becoming a business strategy, helpingcompanies to be competitive and innovative in their sectors.
6. Industry specialization: vendors are continuing their industry specialization.
8.2 Business Potential of the Manutelligence Platform
Product-Service Life Cycle Management (P-SLM) in fact enables manufacturingenterprises to drastically improve their development, production processes and deliv-ery of personalized product-service, adding customer-focused innovative services.P-SLM takes into account the entire life cycle of a Product-Service, it stronglyreduces new processes and plant designs time and allows planning and integratingnew processes and procedures.
However, advanced tools, ICT platforms and methodologies are not enough. Adedicated business strategy is needed to maximise the exploitation potential of theManutelligence solution, which will facilitate the shift from PLM to P-SLM.
After having analysed the reference PLMmarket and the current trends, the focusof this paragraph is therefore on the definition of the business potential enabling theManutelligence consortium partners to create a shared business vision and to definetheir position in the market. This will facilitate their collaboration and different roles,and put the basis for the business and exploitation planning after the end of the project.
In particular, the business potential will be analysed at three different levels, whichwill correspond to three distinct exploitation strategies: (1) Platform developers; (2)Consulting business; (3) Specific use cases.

134 M. Zacchei et al.
8.2.1 Platform Developers
The business strategy for the platform developers foresees the exploitation of boththe overall Manutelligence platform and of the standalone modules.
The partners involved in the development of the platform and in the integrationsof the different modules are several: Dassault Systemes, Biba, Balance, Holonix andSUPSI. The final platform will be based on Dassault 3D EXPERIENCE platform.This platform is already providing solutions for different industry sectors leveragingthe differentmodules (brands) that offer embedded processes and functionalities (e.g.CATIA and Solidworks for 3D modelling or ENOVIA for collaboration and BOMmanagement) In addition, different modules could be customised for each use case.
In particular, the modules developed in the project—such as the LCA/LCC (theMAGAmodule from SUPSI and the BAL.LCPAmodule from Balance respectively)and IoT modules—could either become central applications or interface with theplatform as standalone tools or pure standalone without interfaces. In the latter case,end-users of the individual modules will not be able to use and manage all the databelonging to the 3D EXPERIENCE environment. The stand-alone modules will beowned by the single partners that developed them (and they could be separately soldby each developer) and a joint exploitation strategy will be defined by the end of theproject by the different developers for the overall platform including all the modules.
The main users of the platformwill be designers involved in the definition processof the product-service, marketing people and product managers that will be able tocollaborate with each other as well as with the manufacturers all along the productdevelopment process. Anyhow, also the other actors engaged in the manufactur-ing value chain will be possible users of the platform, interacting and collaboratingthrough that with the other players. Last but not least, the platform will allow fol-lowing the maintenance product phase and will provide means to sustain the servicebusiness by collecting via IoT all the product usage information. The assessmentsoftware tool included into the platform, based on well-known methodologies ofLCA and LCC, will support the modelling of the product service system and the col-lection of the huge amount of data, shortening the time occurring between a changein the design and the sustainability assessment.
The platform will provide an integrated environment for the management of allphases of product lifecycle, addressing a wide range of industries. Great businesspotential is envisaged for the exploitation of this platform in themanufacturing sectorwhere the increased servitization, complexity of processes and use of cloud and bigdata require advanced instruments for the product-services lifecycles management.As a consequence, the business potential for Manutelligence software developersstands on the opportunity to integrate their own software, already used in severalindustrial sectors, into the overall Manutelligence platform, offering a competitivetool able to store all the information concerning the product lifecycle in a homoge-neous way.
Initially, the platform will be based on a generic concept of product-service life-cycle and this could represent a weakness of the product for those industrial sectors

8 Business Exploitation 135
demanding specific requirements. However, following adaptations and improve-ments of the platform may be implemented in order to create more customizablesolutions and enhance their usability in specific sectors according to the trends under-lined in the previous paragraph. Considering that currently, in the market, none of theexisting tools provides functionalities tailored to PSS, with environmental and eco-nomic evaluation integrated in the same solution, the value added of Manutelligenceplatform entails great market perspectives.
8.2.2 Consulting Business
Manutelligence consulting business companies can exploit the Manutelligence plat-form as a mean to support industrial customers in process/product development aswell as by offering them training on the management of product lifecycle and knowl-edge based on advanced S-PLM technologies.
The Manutelligence platform helps increasing the quality of interaction with cus-tomers and third parties, besides improving collaboration between different businessareas inside the company itself. Quality of the services provided will be enhancedbecause the platform allows industrial clients to develop innovation within their busi-nesses, providing them with full traceability of all data related to product lifecyclestages. The market trends of the manufacturing sector (i.e. servitization, evolutiontowards global market, etc.) work as opportunities for the exploitation of the plat-form by consulting companies. Several industrial companies in fact need support forcomplex product development activities, whereas product-related services have tobe managed in relation to the product lifecycle. Even more important, manufacturingcompanies need to find innovative solutions to differentiate from competitors anddefend/acquire market share. Overall, the targeted customers will be small-mediummanufacturers (SMEs), aiming to reach the global market in the consumer goods,automotive, home & architecture, civil engineering, energy, automation and pack-aging sectors. All these sectors, for the most part, are not mature yet for a completeunderstanding and utilization of S-PLM technologies, thus they need to be trainedbefore being interested direct buyers for Manutelligence platform. Ideally, the targetcustomers have low development rate (products change every 2/3 years) or smallportfolio of products, a not fully structured technical office and they are fostering aninnovative approach to design.Among theManutelligence partners usually providingconsulting services, it is worth to mention Rina Consulting (formerly D’Appolonia),VTT, BIBA, Politecnico di Milano and Balance.

136 M. Zacchei et al.
8.2.3 Uses Cases
The users of the Product-Service Lifecycle Management system (i.e. Ferrari, MeyerTurku Oy, Lindbäcks and Fundacio CIM) will have the opportunity to unlock asignificant market potential and gain a clear competitive edge through the develop-ment of customized and knowledge intensive products and services.
AutomotiveTheAutomotive use case is conducted at Ferrari facilities. Ferrari is leader of this pilotwhile other beneficiaries, namely Politecnico di Milano and Dassault, are involvedwith the aim of scientific, methodological and technical support.
Ferrari represents the luxury segment of the automotive sector and its businesshas a strong focus on the delivery of innovative product-services, in order to offer acustomer experience based on the “thrill of driving”.
The whole automotive industry has been experiencing an evolution towards servi-tization. In the last decade, automotive companies faced the economic crisis exploit-ing revenues deriving from services linked to the purchase of a vehicle. Hence,manufacturers and dealers continue to expand the service offering, providing clientswith customizable services across all phases of the product lifecycle. Therefore, theautomotive sector deals with both important technical and “experience” aspects, butit is still centred on product development activities. Firms need new business modelsbased on a product-service concept, besides advanced software tools able to managebig amount of data related to products’ lifecycles increasingly complex. Therefore,a huge business potential could be unlocked by the Manutelligence platform withinthe automotive sector. Manufacturers will benefit from a tool that can be integratedwith existing software to perform, in addition to other more traditional tasks, alsosustainability assessments through LCA and LCC methodologies and the manage-ment of all customers’ data. More specifically, automotive manufacturers will havethe competitive advantage to guarantee the customers with the best technology andtechnical specifications available at the time of delivery and not at the time of theorder, since status of the car under manufacturing will be traceable at eachmoment ofits lifecycle (3D virtual representation) and advancements occurring between designand delivery stages could be implemented. Other consequent benefits rely on reduc-tion of the time before delivery, better quality of product-services provided, thanksto clients’ feedback data, and increased cost savings which is a high priority formanufacturers. In fact, Manutelligence platform will allow data from testing and useof the car to be feedback into the design and engineering phases in a standardizedmanner in order to optimise the product ordered.
ShipbuildingThe Shipbuilding pilot is led by Meyer Turku Oy, one of the leading European ship-building companies. The company provides state-of-the-art technology solutions,advanced construction processes and innovations for cruise operators and other shipowners. The cruise sector is based on strong branding/marketing strategies aimed atalways attracting new customers. Cruise operators are challenged to develop compet-itive cruise packages involving a high-quality stay onboard, an array of shore-based
8 Business Exploitation 137
activities offering access to a variety of cultures and sites and easy transfers to/fromthe vessel. The ship itself is designed as a tourist attraction.6 As a matter of fact,to fulfil the desires of its guest and attract new customers, the cruise industry hasstarted diversifying the cruise product, to be able to respond to the preferences of awide range of customer groups. To this purpose, the industry has innovated throughthe development of new destinations, new ship designs, new and diverse onboardamenities, facilities and services. Also for this reason, cruise liners are among thelargest and most complex products made. Such complicated and interconnected sys-tems hold a great market potential for the Manutelligence platform. Shipbuildingcompanies will be able to benefit from a tool that supports and enhances the inter-actions between engineering, ship manufacturing and construction, customers andusers and which could also be integrated with existing and new software.
Smart HouseThe Smart house pilot is focused on the combination of modular housing compo-nents with sensing and communication technology, for the design and constructionof future student homes. The pilot leader is Lindbäcks. The development and theconstruction of healthy homes indoor, which are then assembled quickly on site,have a high potential. The objective of this pilot is to demonstrate that room design-ers and manufacturers can provide personalised housing solutions—both productand services—to student residents. The data of usage gathered and the sensors mea-surement will in fact give valuable feedback to design and production departments.Moreover, additional apartment features will help the construction company gain acompetitive advantage. Considering the trends in the overall construction industry,a great business potential will also be exploited with the introduction of additionalper-use services, thanks to the installation of several sensors. These services include:
7. Service for living the apartment, for example adjust apartment setting like roomtemperature by voice, control of pets, older people, burglar alarm;
8. Service for maintenance, including sensors for humidity, control-system forwater, heat and air consumption;
9. Service for construction, such as temperature, humidity, air pressure, etc.
In addition, other pay-per-use services could be investigated in the smart houseuse case to create an opportunity for additional business area. Pay per use servicesinclude: speaker in the kitchen, electrical heating floor, windowwith darken function,order kitchen equipment when needed, laundry by tube, carpool and bike pool inbasement, pay rent after use of apartment. These services could be integrated inproduct offering, creating the opportunity to address customers’ requirements acrossthe entire lifecycle of the project. As a matter of fact, student residents will be able toadapt the rooms to their preferences and needs and be involved in the design phase.
Nevertheless, aspects related to data protection will have to be investigated toallow a full exploitation of the Manutelligence platform.
6J. Brida and S. Zapata, “Cruise Tourism: Economic, Socio-Cultural and Environmental Impacts,”International Journal of Leisure and Tourism Marketing, vol. 1, no. 3, 2010.
138 M. Zacchei et al.
Fab LabThe FabLab use case is focused on FabLab-like facilities called Ateneus of Digi-tal Fabrication (ADF), promoted by the Barcelona city council within the strategicSmart Cities framework. Fab Ateneus is a space dedicated to creation and learningconnected to social innovation, new technologies and, especially, digital fabrication,where citizens are the active users and protagonists.
The objective of this use case is to give to Fab Ateneus users the possibility tolearn and start using the potential of 3D printing and the “Internet of Things”. Inparticular, the aim is twofold; first of all to enable collaborative design for FabLabs,allowing “makers” to cooperate using best in class design collaboration tools. Sec-ondly, to enable the manufacturing of IoT enabled objects, through the possibilityof adding single boards PCs with sensors to a fully working IoT platform. This willsupport the growth of the future generation of designers and engineers, used to thinkfrom the beginning to product-services and Internet enabled things. As above men-tioned, Fab Ateneus exists to promote activities and projects to improve society (i.e.the neighbourhood, the city and the world) using new models of organization (co-creation, open source collaboration, crowdsourcing, crowdfounding, etc.) and open,networked learning and social media to share acquired knowledge. The Manutelli-gence platformwill help “makers” undertake projects that will have a positive impacton the neighbourhood, the city and the world providing a platform that:
10. Supports the generation of CADdesign fromuser’s requirements,making easierthe conversion and generation of CAD design from ideas just even sketched ina paper into readable format;
11. Enhances knowledge sharingwithin theFabLab/ADFnetwork,with the creationof a network that allows the sharing of data about product design leading to amore efficient design process and to a better service for those customers whoare not skilled;
12. Develops the production cycle, from the CAD file to the production resourcesneeded for the realisation of the product, for the different digital fabricationtechnologies;
13. Gets cloud-based feedback and multidirectional information flow for smartobjects;
14. Allows sustainability assessment. Environmental and economic sustainabilityfactors will be included in the design phase to increase the level of aware-ness of FabLab/ADF customers and create more sustainable products, with lessenvironmental impacts.
More generally, the Manutelligence platform will enable the transformation ofthe knowledge characteristic of the Information society into new economics formscentred on people, exploiting an important social vector.
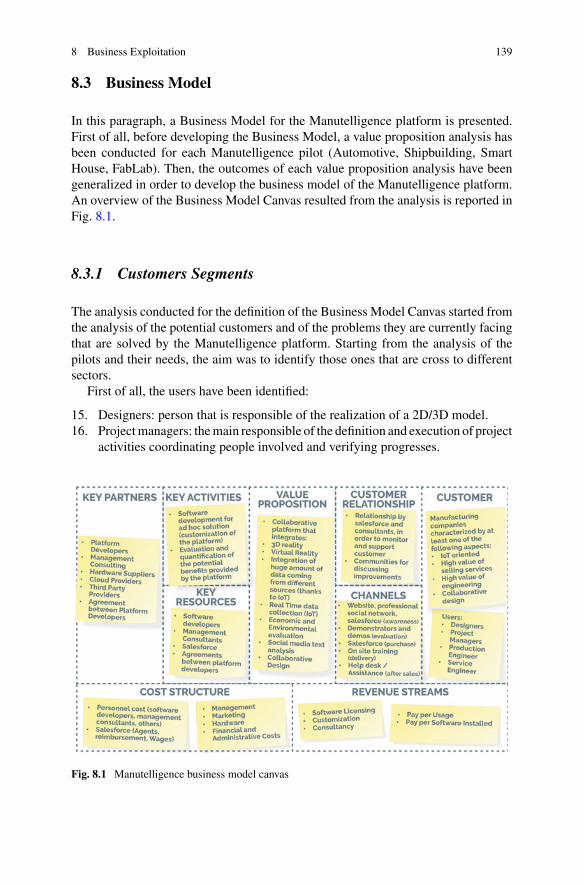
8 Business Exploitation 139
8.3 Business Model
In this paragraph, a Business Model for the Manutelligence platform is presented.First of all, before developing the Business Model, a value proposition analysis hasbeen conducted for each Manutelligence pilot (Automotive, Shipbuilding, SmartHouse, FabLab). Then, the outcomes of each value proposition analysis have beengeneralized in order to develop the business model of the Manutelligence platform.An overview of the Business Model Canvas resulted from the analysis is reported inFig. 8.1.
8.3.1 Customers Segments
The analysis conducted for the definition of the Business Model Canvas started fromthe analysis of the potential customers and of the problems they are currently facingthat are solved by the Manutelligence platform. Starting from the analysis of thepilots and their needs, the aim was to identify those ones that are cross to differentsectors.
First of all, the users have been identified:
15. Designers: person that is responsible of the realization of a 2D/3D model.16. Projectmanagers: themain responsible of the definition and execution of project
activities coordinating people involved and verifying progresses.
Fig. 8.1 Manutelligence business model canvas
140 M. Zacchei et al.
17. Product engineers: responsible to define and control design activities and relatedresources as well as of the realization of the product.
18. Service engineers: responsible to define and control service activities and relatedresources as well as of to the realization of the service.
Furthermore, a list of characteristics of companies potentially interested inManutelligence platform has been listed:
19. IoT oriented: manufacturing companies with the objective of the developmentof new smart products, provide new services to their customers, collect highamount of data from product or sensors, or gather real time information frommachines.
20. High value of selling services: companies characterized by the creation of alarge part of revenues from the selling of services.
21. High value of engineering: companies characterized by intense engineeringactivities where knowledge from previous project became essential to decreasethe impact of the engineering within the overall cost of the developed solution.This requirement is typically requested by Aerospace, Aeronautical, Naval,Major Infrastructure, Oil & Gas industries.
22. Collaborative Design: companies interested on the improvement of the col-laboration between different domain experts. This is typical from the alreadymentioned companies however this aspect could be crucial also forMechanical,Software Houses, Creative, FabLab companies.
8.3.2 Value Proposition
The value proposition of the Manutelligence platform is the proposal of a collabo-rative platform that integrates different features, such as:
23. Physical and Virtual experience and information, integrated in the 3DEXPERI-ENCE of Dassault Systemes.
24. Integration of huge amount of data coming from different sources (thanks toIoT), integrated in the IoT Module of Holonix and Real Time data collection.
25. Economic and Environmental evaluation, integrated in the BAL.LCPA module(economic evaluation) and in the MAGA module (environmental evaluation),leveraging on interface with 3DEXPERIENCE of Dassault.
26. Social media text analysis of BIBA.27. Collaborative design, integrated in the 3DEXPERIENCE of Dassault.
8.3.3 Customer Relationships and Channels
The different ways to reach customers creating awareness, selling and delivery of theManutelligence platform have been identified. Concerning the creation of awareness,
8 Business Exploitation 141
the development of an “ad hoc” website, the advertising on different professionalsocial network (such as Linkedin) and the salesforce have been identified how effec-tive streams for reaching the potential customers. In order to enable the customers toevaluate the potentialities and the benefits of the Manutelligence platform, the ideais to develop some demonstration and demos that show how the platform works.Salesforce is used to sell the platform to the interested customers, providing alsoconsultancy and training activities (on site). The relation with customers after thesales is managed mainly through a helpdesk, based on a website platform, or througha direct assistance.
8.3.4 Revenue Models
In this area possible ways to gain revenues have been identified. A first way isthe sell software licenses. Secondly, it is possible to create revenues through theconsultancy and the customization of the platform, according to the customer’s needs.Furthermore, it is possible to consider the Manutelligence platform as a service,therefore using other ways of revenues, such as the pay per usage (the customer paysjust when it uses the platform) or pay per software installed (the customer pays onlyfor the software it needs).
8.3.5 Key Activities and Resources
The key activities to make the Manutelligence platform a commercial solution readyfor the industrial environment can be summarized in:
28. Software development for ad hoc solution (customization of the platform), inorder to satisfy the customers’ needs.
29. Evaluation and quantification of the potential benefits provided by the platformthrough precise and measurable KPIs.
The key resources to provide the platform on the market are:
30. The solution architect, in order to finalize the platform design for the dailybusiness activities.
31. The software developers, in order to implement the platform according to thesolution architect design.
32. The management consultants, in order to support customers in the choice of theproper platform.
33. The salesforce, in order to facilitate the communication of benefits and advan-tages reachable through the platform.
34. Agreements between platform developers in order to provide the platform onthe market and realize some pilots/demonstrators.
142 M. Zacchei et al.
8.3.6 Key Partners
Key relationships have to be established in order to facilitate the market introductionof the Manutelligence platform. First of all, an ad hoc agreement between platformdevelopers is necessary to be signed in order to share revenues and investments. Thisis crucial for the joint exploitation of the project results. Clearly, the key partners willbe the platform developers and an important role can be labelled by managementconsulting.External consortiumpartners, such as hardware suppliers, cloudprovidersand third party providers, are necessary to provide a complete solution, composedof the software (developed within the Manutelligence project) and of the hardware(provided by external partners).
8.3.7 Cost Structure
The cost structure distinguishes the periodic and the variable costs. Personnel costscover a significant part within the whole costs. It is composed of the solution archi-tects, the software developers, the management consultants and other costs. Anotherimportant part of the cost is composed of the salesforce, composed of agents’ salaries,reimbursements and wages. Finally the management have a significant cost to coor-dinate the work giving a strategic vision. Other costs can be summarized in: (1)Marketing Costs; (2) Hardware; (3) Financial Expenses; Administrative Costs.
References
1. International Labour Organization “Construction sector” [Online]. Available http://www.ilo.org/global/industries-and-sectors/construction/lang–en/index.htm. Accessed November 2015
2. Osterwalder A, Pigneur Y (2010) Businessmodel generation: a handbook for visionaries, gamechangers, and challengers. Wiley
3. Osterwalder A, Pigneur Y, Bernarda G, Smith A (2014) Value proposition design: how to createproducts and services customers want. Wiley
4. https://www.scottish-enterprise.com/~/media/se/resources/documents/stuv/sustainable-business-models.pdf
5. Vosgien T (2015)Model-based system engineering enabling design-analysis data integration indigital design environments: application to collaborative aeronautics simulation-based designprocess and turbojet integration studies. Ecole Centrale Paris
6. Barkay J (2014) Service lifecycle managemen. Siemens PLM Software7. McKinsey & Company (2013) The road to 2020 and beyond: what’s driving the global auto-
motive industry?8. Lay G (2014) Servitization in industry. Springer International Publishing9. Rodrigue J, Notteboom T (2013) The geography of cruise shipping: itineraries. Capacity
deployment and ports of call, 3rd edn. Routledge, New York10. BusinessWire (2014) The global prefabricated buildingsmarket—key trends and opportunities
to 201711. Menichinelli M (2014) Come construire un FabLab. Design
8 Business Exploitation 143
Open Access This chapter is licensed under the terms of the Creative Commons Attribution 4.0International License (http://creativecommons.org/licenses/by/4.0/), which permits use, sharing,adaptation, distribution and reproduction in any medium or format, as long as you give appropriatecredit to the original author(s) and the source, provide a link to the Creative Commons license andindicate if changes were made.
The images or other third party material in this chapter are included in the chapter’s CreativeCommons license, unless indicated otherwise in a credit line to the material. If material is notincluded in the chapter’s Creative Commons license and your intended use is not permitted bystatutory regulation or exceeds the permitted use, you will need to obtain permission directly fromthe copyright holder.