latin american mega trends - … · other family types 23.9% two parents with kids ... • conform...
TRANSCRIPT

1
Latin American Mega TrendsTheir economic, social and political impact
By John Price, Managing Director, Americas Market Intelligence

2
Disclaimer
Wherever possible, AMI has verified the accuracy of information provided by third parties, but does notunder any circumstances accept responsibility for such inaccuracies should they remain unverified.
It is expected that the reader will use the information provided in this presentation in conjunction withother information and with sound management practices. AMI therefore will not assume responsibility forcommercial loss due to business decisions made based on the use or non-use of the information provided.

32017 Latin America Forecast
AMI credentials

4
More than two decades of seeking to understand the region
1993 1995 1997 1999 2000 2002 2003 2006 2007 2011 2015 2017
InfoMex is founded inMexico City
First studies conducted in
South America, name changed to
InfoAmericas
Office opened in Sao Paulo
Tendencias launched, the
most widely read regional
intelligence newsletter
Office opened in Miami
InfoAmericas joins the Global
Intelligence Alliance (GIA) as
its Latin American member
Five industry practices are introduced
AMI consultants complete their 1,000th client
engagement in Latin America
InfoAmericas is sold to Kroll,
forming Kroll’s first market intelligence
division
Key members of the former InfoAmericas team form AMI, with offices in Miami and
Mexico City
AMI launches Sao Paulo affiliate
office
2,000th client engagement completed
AMI Perspectiva launched. Chile affiliate office
launched.

5
We deliver the intelligence
Growth
Opportunity Benchmarking
Market Assessment
Customer Research
Investment Viability
Partnering
Strategic Planning
Competition
Unethical competitors
Political
Reputational
Economic
Performance
Market Share
Best Practices
Brand Awareness
Customer Satisfaction
Risk
How AMI services its market intelligence clientsWe provide our clients with the intelligence and advice they need to make big decisions that help them grow, mitigate risk and measure performance
6
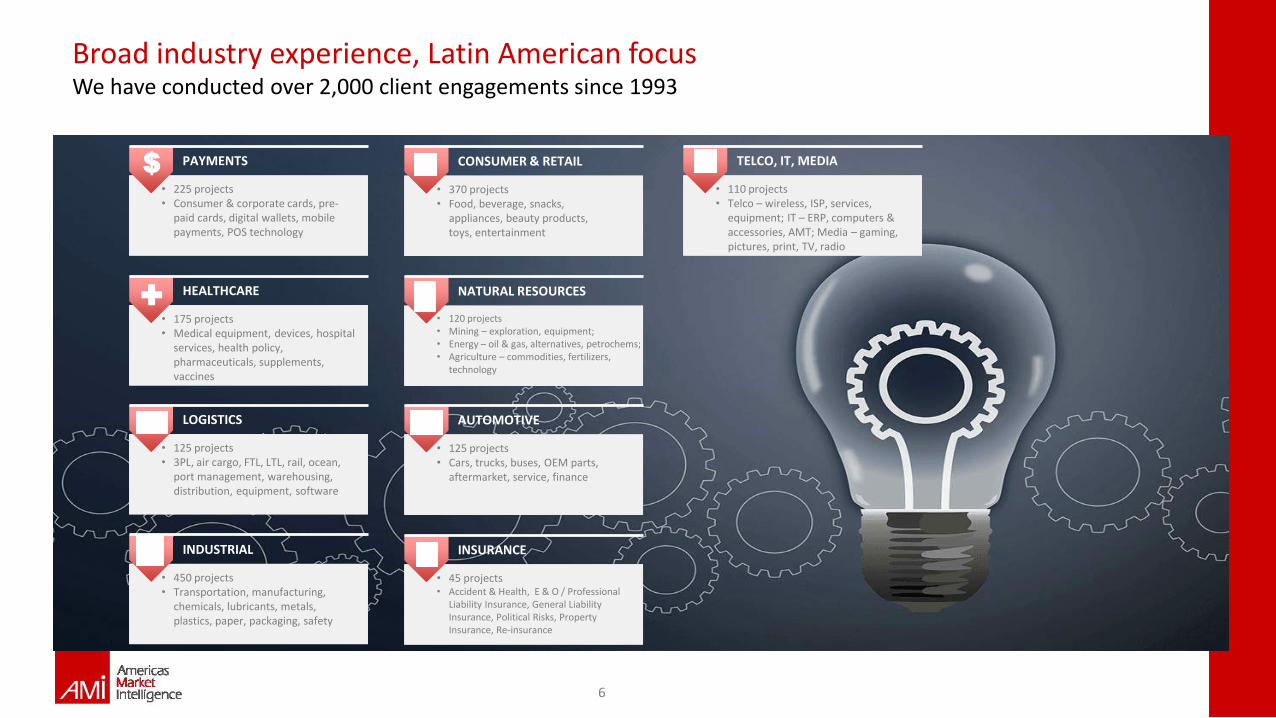
• 225 projects• Consumer & corporate cards, pre-
paid cards, digital wallets, mobile payments, POS technology
PAYMENTS$
• 450 projects• Transportation, manufacturing,
chemicals, lubricants, metals, plastics, paper, packaging, safety
INDUSTRIAL
• 175 projects• Medical equipment, devices, hospital
services, health policy, pharmaceuticals, supplements, vaccines
HEALTHCARE+
• 125 projects• 3PL, air cargo, FTL, LTL, rail, ocean,
port management, warehousing, distribution, equipment, software
LOGISTICS
• 370 projects• Food, beverage, snacks,
appliances, beauty products, toys, entertainment
CONSUMER & RETAIL
• 45 projects• Accident & Health, E & O / Professional
Liability Insurance, General Liability Insurance, Political Risks, Property Insurance, Re-insurance
INSURANCE
• 120 projects• Mining – exploration, equipment;• Energy – oil & gas, alternatives, petrochems; • Agriculture – commodities, fertilizers,
technology
NATURAL RESOURCES
• 125 projects• Cars, trucks, buses, OEM parts,
aftermarket, service, finance
AUTOMOTIVE
• 110 projects• Telco – wireless, ISP, services,
equipment; IT – ERP, computers & accessories, AMT; Media – gaming, pictures, print, TV, radio
TELCO, IT, MEDIA
AM Industry expertise in LAC markets
Our industry practice approach provides deep knowledge to our clients
Broad industry experience, Latin American focusWe have conducted over 2,000 client engagements since 1993
7
Megatrend #1 – Aging Demographics

8
Population by age group in Latin American for 2010 & 2020
2010 2020
57 mi 83 mi
255 mi 296 mi
104 mi 105 mi
160 mi 149 mi
60+
25-59
15-24
0-14
Sources – ECLAC, AMI Analysis
99 mi 97 miMillennials (14-32) Millennials (24-42)
Latin America is the fastest-aging region in the worldIn just a decade, the elderly outgrew the population of all young people (under 30 years of age)

9
For the next 25 years, the demographic dividend will continue to benefit LAC marketsThe working age (15-60) % of the population will keep climbing (until 2025), at which point it will begin to decline
GLOBAL RANK COUNTRY MEDIAN AGE
33 Cuba 38.4
48 Uruguay 33.6
56 Chile 32.1
61 Argentina 30.5
71 Brazil 29.3
78 Colombia 28.0
82 Mexico 27.1
85 Peru 26.2
86 Dom Rep 26.1
86 Venezuela 26.1
87 Ecuador 25.7
94 El Salvador 24.3
95 Jamaica 24.2
103 Bolivia 22.5
114 Guatemala 20.0
LatAm’s 40
year
demographic
window
Source – www.investmentu.com

10
By 2040, the largest voting block will be the elderly
-
20
40
60
80
100
120
140
160
180
200
under 15 15 - 29 30 - 45 45-60 over 60
Mill
ion
s o
f p
eop
le
2015 2055
130 million more elderly
Source – Center for Strategic & International Studies

11
Sub
-tre
nd
sSu
b-t
ren
ds
Economic impactEconomic impact
The impacts of an aging population
10+% CAGR in healthcareStrong growth in financial services
Society must now cater to the elderly, rather than to children
More mature (conservative) voters
02 Large elderly populationImpact on housing market – empty nesters are independent
Stronger than the baby-boomer effect in the US
Political priorities shift away from education towards healthcare funding pensions
03Short term demographic dividend (2015-2030)
Continued strong growth in consumption
Continued aspirational consumerismDeficit driven fiscal expansionStrong investment in infrastructure
04Long term demographic demise (2030-2050)
Chronic low growth (like Japan today)
Decline of materialism. Return of savings culture. Opening to immigration (from Africa).
Fiscal prudence. Higher taxes. Privatization of healthcare. More immigration.
05 Fewer childrenDivestment in early education infrastructure
Nurturing children will be replaced by nurturing the elderly. Re-engineering of public spaces.
Tax breaks for additional children. Cuts in education, children health.
Backlash?Will Latin America have its own Generation X (who resentfully funds the elderly)?How will Mexico, a homogeneous society accept African immigrants? (Case study may be Ireland)
Social impactSocial impact Political impactPolitical impact
Older on average01

12
Megatrend #2 – Rising Individualism

13
The family “unit” is in decline. Segmentation is on the rise.Non-traditional household structures are replacing the conventional household
CAGRPercentage Growth
of market share
1990-2010
Source: ECLAC
Often brutal economic reforms in the
1990’s eroded the real incomes of middle
and working class segments, forcing both
parents to work. Modernizing ways
encouraged upper and middle class
women to hold onto their careers.
Latin America’s
fastest growing
segment is elderly
living without
children
Emigration and
divorce have created
more single mothers
Non Family14.5%
Nuclear Family61.6%
Other Family Types23.9%
Two Parents with Kids42.0%
Extended Family21.7%
Dual Income19.8%
Un
wed
, Stu
den
tsFr
ien
ds
5.0
%
Single Income22.2%
Livi
ng
Alo
ne
9.5
%
Sin
gle
Inco
me
4.7
%
Du
al In
com
e3
.4%
Co
up
le, n
o k
ids
8.1
%
Sin
gle
Par
ent
(Fem
ale)
9.9
%
Sin
gle
Par
en
t(M
ale
) 1
.5%
Co
mp
osi
te F
amily
2.2
%
Wo
rkin
g M
oth
er6
.3%
Un
emp
loye
d
Mo
the
r 3
.6%
100%
Conte
nt
develo
ped b
y w
ww
.am
ericasm
i.com

14
Consumers and voters are more empoweredThe instinct to conform declines while individualism and materialism ascend
• 5.3 people per HH
• Ages 30-40 fastest growing
• 3% car ownership
• <3% have credit cards
• Shrinking middle class
• Economic crisis
• Conform to tradition
• Fitting in (collective)
• Undemanding consumers
• Cost conscious
• Traditional media, Predictable
opinions
• 5.3 people per HH
• Ages 30-40 fastest growing
• 3% car ownership
• <3% have credit cards
• Shrinking middle class
• Economic crisis
• Conform to tradition
• Fitting in (collective)
• Undemanding consumers
• Cost conscious
• Traditional media, Predictable
opinions
• 4.1 people per HH
• Age 60+ fastest growing
• 21% car ownership
• >25% have credit cards
• Expanding middle class
• Social crisis
• Seek pleasure
• Gaining power (individual)
• Very demanding customer
• Value & convenience driven
• Social media, unpredictable
• 4.1 people per HH
• Age 60+ fastest growing
• 21% car ownership
• >25% have credit cards
• Expanding middle class
• Social crisis
• Seek pleasure
• Gaining power (individual)
• Very demanding customer
• Value & convenience driven
• Social media, unpredictable
1990 household 2020 household

15
Sub
-tre
nd
sSu
b-t
ren
ds
Economic impactEconomic impact
The impacts of rising individualism
Growing non-traditional households
More homes needed, more household items (furniture, appliances, etc.)
Changing norms. Rise of political correctness
Wider spread legalization of gay marriage, light drugs, etc.
02 Declining role of church Rising “vice” economyHigher divorce, unmarried parents, abortion. Loss of support for most vulnerable. Emancipation of some.
Changing political platforms. Move away from social conservatism towards kinder conservatism.
03More demanding consumer and voter
More emphasis on customer serviceMore social, consumer and political advocacy.
Greater transparency and accountability
04 More choicesExpanding retail economy (for 20 years)
Initial boost in materialism followed by more conscientious consumption
Rise of issue parties (think Israeli Knesset)
05 Less conformistMore diversity of product and service offerings. More outbound travelling.
Coming into the light of repressed groups
More diverse political class
Social impactSocial impact Political impactPolitical impact
Backlash?The weight of the elderly population may lead to some backlash on social liberalization. Politics may become divided by age more than any other factor.
01

16
Megatrend #3 – Migration

17
Inter-country migration to continue growingEventual labor shortages will change migration from escaping crisis to embracing opportunity
• Millions of migrants cross borders within Latin America each year, usually from poorer countries to middle income countries in search of employment: e.g. Paraguayans and Bolivians moving to Argentina, Peruvians & Bolivians moving to Chile, Haitians moving to the Dominican Republic, Cubans to Panama and Ecuador, etc.
• Latin Americans (mostly from Mexico and Central America) continue to leave the region but in declining numbers due to stricter immigration controls in the US and Europe.
• Latin American countries attract few immigrants from outside the region.

18
Megacities and Emerging Megacities in Latin AmericaBy 2025, 86% of the population (567 million people) will live in cities and towns. Latin America is already the most urbanized region in the world
Mega cities
Emerging mega cities
GuadalajaraPopulation 2025:
5.7 million
GuadalajaraPopulation 2025:
5.7 million
Mexico CityPopulation 2025:
24.6 millionGDP 2025:
$713.5 billion
Mexico CityPopulation 2025:
24.6 millionGDP 2025:
$713.5 billion
BogotaPopulation 2025:
11.4 millionGDP 2025:
$298.0 billion
BogotaPopulation 2025:
11.4 millionGDP 2025:
$298.0 billion
LimaPopulation 2025:
11.5 million
LimaPopulation 2025:
11.5 million
Rio de JanerioPopulation 2025:
13.6 millionGDP 2025:
$327.1 billion
Rio de JanerioPopulation 2025:
13.6 millionGDP 2025:
$327.1 billion
Sao PauloPopulation 2025:
23.2 millionGDP 2025:
$643.9 billion
Sao PauloPopulation 2025:
23.2 millionGDP 2025:
$643.9 billion
Buenos AiresPopulation 2025:
15.5 millionGDP 2025:
$327.1 billion
Buenos AiresPopulation 2025:
15.5 millionGDP 2025:
$327.1 billion
SantiagoPopulation 2025:
7.1 million
SantiagoPopulation 2025:
7.1 million

19
Sub
-tre
nd
sSu
b-t
ren
ds
Economic impactEconomic impact
The impacts of migration
More trafficProductivity gains offered by urban concentration will be limited by lack of infrastructure
People and businesses will move out of mega-cities
More spending on public transit. More privatization of transit.
02 More immigrantsEconomic boost to receptor countries, drain on emigration countries.
Challenging for homogeneous cultures. A boost to heterogeneous ones (Brazil, Argentina, Chile)
May cause some backlash, resentment and nativism (e.g. elections in Chile)
03 More balanced employmentProvides some GDP boost with a more fluid labor pool.
More people will move away from home to find work. Further erosion of family structure.
Pressure to spend on training, keep people at home. Regionalism in politics.
Social impactSocial impact Political impactPolitical impact
Backlash?Stronger sense of regionalism in politics will test national unitySome cultures will struggle with the economic imperative to accept more immigrants
01

20
Megatrend #4 – Technology Disruption
21
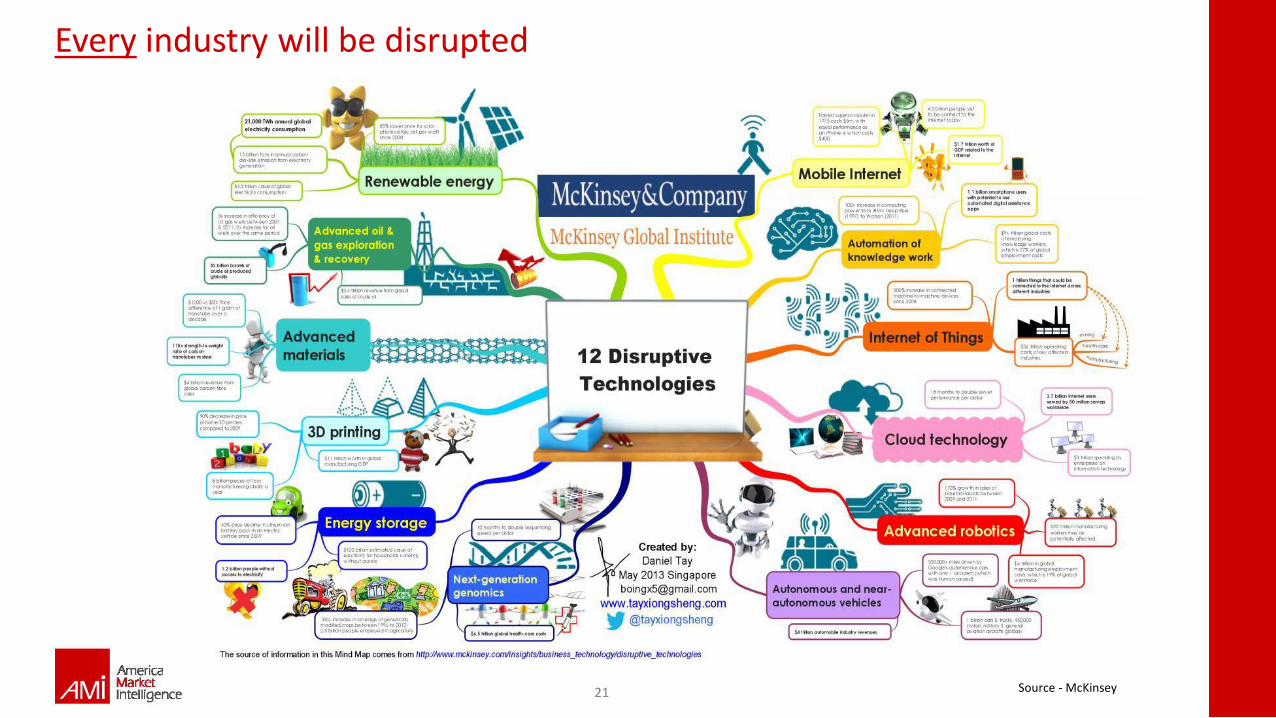
Every industry will be disrupted
Source - McKinsey
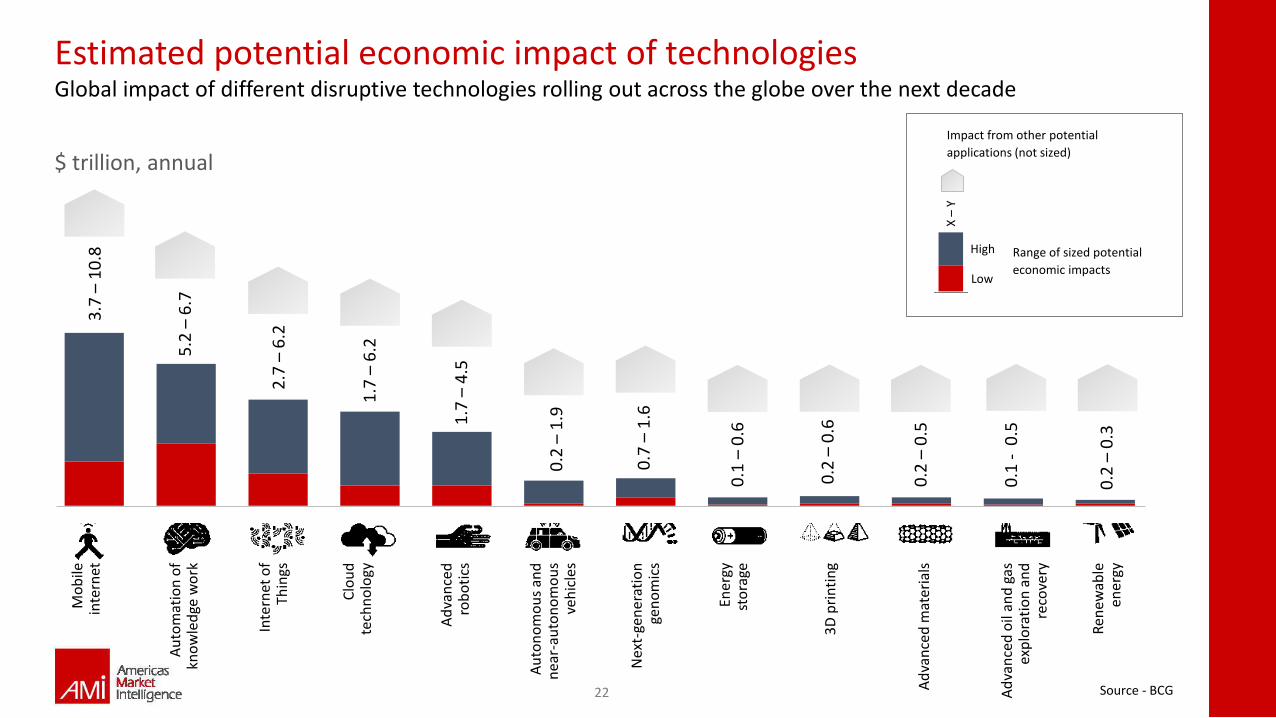
22
Estimated potential economic impact of technologies Global impact of different disruptive technologies rolling out across the globe over the next decade
$ trillion, annual
Mo
bile
inte
rnet
3.7
–1
0.8
5.2
–6
.7
2.7
–6
.2
1.7
–6
.2
1.7
–4
.5
0.2
–1
.9
0.7
–1
.6
0.1
–0
.6
0.2
–0
.6
0.2
–0
.5
0.1
-0
.5
0.2
–0
.3
Au
tom
atio
n o
f kn
ow
led
ge w
ork
Inte
rnet
of
Thin
gs
Clo
ud
tech
no
logy
Ad
van
ced
rob
oti
cs
Au
ton
om
ou
s an
d
nea
r-au
ton
om
ou
s ve
hic
les
Nex
t-ge
ner
atio
n
gen
om
ics
Ener
gyst
ora
ge
3D
pri
nti
ng
Ad
van
ced
mat
eria
ls
Ad
van
ced
oil
and
gas
ex
plo
rati
on
an
d
reco
very
Ren
ewab
leen
ergy
Range of sized potential
economic impacts
High
Low
X –
Y
Impact from other potential
applications (not sized)
Source - BCG

23
Latin America has a dismal track record of creating commercially viable technologyChina publishes 50 times more patents PER CAPITA than Latin America
Some US universities publish more patents on their own than all patents published across Latin America
22%
5%
4%
3%
2%
2%
-1%
-2%
-3%
China
Colombia
USA
Mexico
Canada
Brazil
Uruguay
Israel
Argentina
Low trust
Legal risk
Lack of risk
capital
Country Patent per capita 24 yr CAGR
Source – World Bank

24
Sub
-tre
nd
sSu
b-t
ren
ds
Economic impactEconomic impact
The impacts of technology disruption
Efficiency gains Wealth creation Job losses in low skill labor Pressure to provide training
02 DeflationTends to help middle classes more than working classes
Tends to worsen income polarizationPressure on government to curb spending, which tends to outpace private sector inflation
03 Technology importWill boost productivity and consumption, especially among middle – upper classes
Will abandon many national pastimes and adopt foreign customs
Will cause trade deficits
04 UnemploymentMove even further towards service economy – larger service underclass
Strong resentment of low skilled workers put out of work by machines
Potential backlash – Donald Trump / Bernie Sanders style
05 Technology divide Greater economic divideBegin reversing recent income distribution gains
Pressure to make technology more accessible
Social impactSocial impact Political impactPolitical impact
Backlash?Automation, relying on imported technologies, will generate far more net unemployment in Latin America than it has in US and Europe. Anticipate a political backlash
01

25
Megatrend #5 – Connectivity & Social Media

26
Smartphones are now in the hands of the entire middle classPrivacy is dying. Transparency (including the spotlight on political misdeeds) is ascending.
Mobile phone connections*, million Smartphone subscribers
682
829
0
100
200
300
400
500
600
700
800
900
2015 2020
4.0%CAGR
262
577
0
100
200
300
400
500
600
700
800
900
2015 2020
17.1%CAGR
Note: Excluding M2M
Source: GSMA

27
Latin Americans are avid consumers of technology
245million smartphone users are forecast in
LatAm by 2019
36%projected growth in tablet users in Latin
America by 2020 versus 2015
121%Growth of 4G connections in LatAm in 2016
35%Growth of mobile money accounts in
LatAm in 2016
450mobile Internet
subscribers in LatAm by 2020
36%Brazil and Mexico are
both ranked in the top 15 world e-
commerce markets
10%Cloud computing will
grow at over 10+% per year through
2021, making LatAm one of the fastest growing regions in
the world.
$27Bvalue projected for
Latin America’s 3D/4D technology market by 2021,
19.21% CAGR
$4.37BValue of LatAm data
center services market revenue by
2021—52% increase over 2015
17.5%Capnography
equipment market set to grow with CAGR of
17.5% in LatAm through 2021
40%Growth of wearable
sensors market in LatAm set per year between now and
2020
25%Growth
projected for LatAm telehealth
market
Latin America is the fastest growing IT spend region in the world currently with a CAGRof 5.5% through 2021
Brazil (#2), Mexico (#6), and Argentina (#8)
are among the highest ranked markets
worldwide for total hours per week spent on
the internet
Brazil (#2), Argentina (#3) and Mexico (#4)
are among the highest users of Social Media
worldwide
5.5%
28
Sub
-tre
nd
sSu
b-t
ren
ds
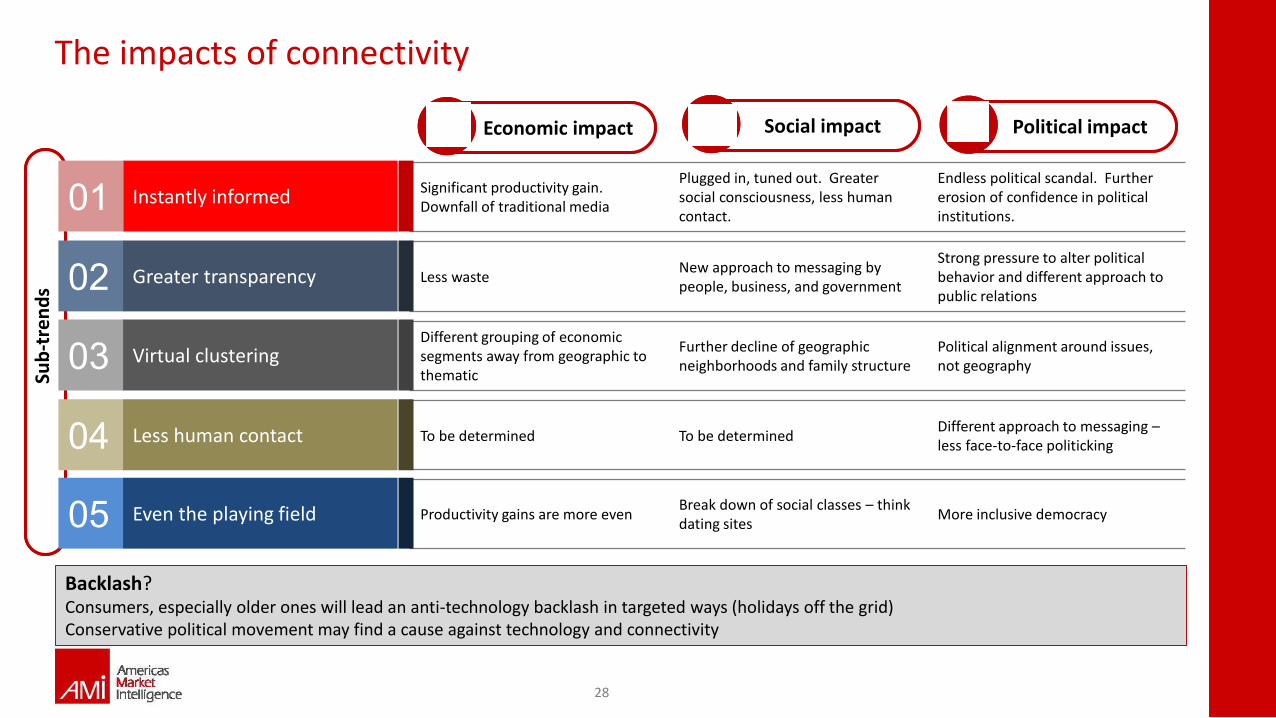
Economic impactEconomic impact
The impacts of connectivity
Instantly informedSignificant productivity gain. Downfall of traditional media
Plugged in, tuned out. Greater social consciousness, less human contact.
Endless political scandal. Further erosion of confidence in political institutions.
02 Greater transparency Less wasteNew approach to messaging by people, business, and government
Strong pressure to alter political behavior and different approach to public relations
03 Virtual clusteringDifferent grouping of economic segments away from geographic to thematic
Further decline of geographic neighborhoods and family structure
Political alignment around issues, not geography
04 Less human contact To be determined To be determinedDifferent approach to messaging –less face-to-face politicking
05 Even the playing field Productivity gains are more evenBreak down of social classes – think dating sites
More inclusive democracy
Social impactSocial impact Political impactPolitical impact
Backlash?Consumers, especially older ones will lead an anti-technology backlash in targeted ways (holidays off the grid)Conservative political movement may find a cause against technology and connectivity
01

01AMI is Latin America’s leading independent
market intelligence consultancy
02Our founding partners helped pioneer
the field of market intelligence in Latin America
03Our consultants have advised a third of the region’s
100 largest strategic investors over a span of two decades
04AMI consultants have conducted over 2,000 client
engagements in Latin America since 1993
05Our holistic approach to market intelligence is unique. We combine
market research, competitive intelligence, political analysis and economic
forecasting in our studies. Few others do the same in Latin America
+1 (305) 441-9300
About AMI