latent liquidity and corporate bond yield...
TRANSCRIPT

Latent Liquidity and Corporate Bond Yield Spreads
Sriketan Mahanti∗ Amrut Nashikkar† Marti Subrahmanyam‡
August 8, 2007
Abstract
Recent research has shown that default risk accounts for only a part of the total yield spread on riskycorporate bonds relative to their risk-less benchmarks. One candidate for the unexplained portion of thespread is a premium for liquidity. We investigate this possibility by relating the liquidity of corporatebonds, as measured by their ease of market access, to the basis between the credit default swap (CDS)price of the issuer and the par-equivalent corporate bond yield spread. The ease of access of a bond ismeasured using a recently developed measure called latent liquidity, which is defined as the weightedaverage turnover of funds holding the bond, where the weights are their fractional holdings of the bond.We find that bonds with higher latent liquidity are more expensive relative to their CDS contracts,after controlling for other realized measures of liquidity. Additionally, we document the positive effectsof liquidity in the CDS market on the CDS-bond basis. We also find that several firm-level variablesrelated to credit risk negatively affect the basis, indicating that the CDS price does not fully capture thecredit risk of the bond. In a similar vein, we document that bond-level variables related to features ofthe contract that may be related to credit risk, such as the presence of covenants, have a negative impacton the CDS-bond basis. These findings are consistent with the presence of frictions in the arbitragemechanism between the CDS and bond markets, due to the costs of “shorting” bonds.
JEL Classification: G100 (General Financial Markets)
Keywords: Corporate Bonds, Credit Risk, Credit Default Swaps, Basis, Liquidity, Latent Liquidity
We acknowledge the generous support of State Street Corporation in providing the resources for conducting theresearch reported in this paper. We thank Craig Emrick, Gaurav Mallik, Jeffrey Sutthoff and Caroline Shi at StateStreet Corporation for helpful discussions and their unstinting support in putting together the databases used inthis research. We thank George Chacko, Mike Piwowar and Lasse Pedersen for suggestions regarding the researchdesign and comments on previous versions of the paper. We also thank participants at the 2006 NBER conference onmicrostructure, and seminar participants at Carnegie-Mellon University, Imperial College, London, London BusinessSchool, University of Melbourne, Universita Ca’ Foscari, Venice, and Bocconi University, Milan, for their valuablesuggestions. All errors remain our own.∗email: [email protected]; Tel: +1 508 517 2636. Sriketan Mahanti is a Principal at the Orissagroup and was formerly
Vice President, State Street Global Markets.†email: [email protected]; Tel: +1 212 998 0718. Amrut Nashikkar is a PhD candidate at the Stern School of
Business, New York University.‡email: [email protected]; Tel: +1 212 998 0348. Marti Subrahmanyam (the corresponding author) is on the faculty
at the Stern School of Business, New York University.
1
1 Introduction
Corporate bonds are amongst the least understood instruments in the US financial markets. This
is surprising given the sheer size of the US corporate bond market, about 5.3 trillion dollars out-
standing in June 2006, which makes such bonds an important source of capital for US firms. These
bonds carry a risk of default, and hence command a yield premium or spread relative to their
risk-less counterparts. However, the academic literature in finance has been unable to explain a
significant component of corporate bond yields/prices in relation to their Treasury counterparts,
despite using a range of pricing models and calibration techniques.
Prior studies have noted that although default risk is an important determinant of the yield
spread, there are other factors such as liquidity, taxes, and aggregate market risk variables (other
than credit risk) that may also play a significant role in determining the spread. Of these other
factors, it has been conjectured that liquidity effects have a large role to play in the pricing of
corporate bonds.1 Unfortunately, the non-default component of corporate bond yields/prices or
CDS-bond basis (the difference between the CDS price and the corporate bond yield) has been
inadequately studied, largely due to the paucity of data. In particular, the absence of frequent
trades in corporate bonds makes it difficult to compute market micro-structure measures of liquidity
based on quoted/traded prices or yields to measure liquidity, as has been done in the equity markets.
It is difficult, therefore, to measure the liquidity of corporate bonds directly. Consequently, it is a
challenge to directly study the impact of liquidity on corporate bond yields and prices, thus leaving
the discussion of corporate bond spreads somewhat incomplete.
In this paper, we study the difference or CDS-bond basis between the CDS premium of the
issuer and the par-equivalent credit spread of the bond, as a measure of the non-default component
of the bond yield and relate it to liquidity and other variables such as bond characteristics, firm level
credit risk effects and liquidity in the CDS market itself. In doing so we use and further validate a
new measure of liquidity, called latent liquidity, proposed by Mahanti, Nashikkar, Subrahmanyam,
Chacko, and Mallik (2007), which is based on the holdings of bonds by investors, and thus does not1See, for example, the discussion below on papers by Longstaff, Mithal, and Neis (2005), Elton, Gruber, Agrawal,
and Mann (2001), Eom, Helwege, and Uno (2003) and others.
2
require a large number of observed trades for its computation. This measure weights the turnover
of the funds that own the bond by their fractional holdings; thus, it is a measure of the accessibility
of a bond to market participants. The attractive feature of this measure is that it circumvents the
problem of non-availability of transaction data for corporate bonds and yet provides a reasonable
proxy for liquidity.
Conceptually, our measure is related to the theory proposed by Amihud and Mendelson (1986)
according to which, in equilibrium, assets with the lowest transaction costs are held by investors
with the shortest trading horizon, and have higher prices. Our metric can thus be thought of as a
direct measure of the activity of funds holding a particular bond. It is also related to the literature
on liquidity and asset prices, most notably Vayanos and Wang (2006), who use a search-based
model to provide for an endogenous concentration of liquidity in particular assets. This leads to
active investors participating in the assets, thus lowering transaction costs and leading to higher
prices at the same time. In this sense, our measure can be thought of as directly measuring the
extent of search frictions when the marginal holders of a particular bond wish to trade.
Our measure of latent liquidity is computed using a database of corporate bonds assembled
by State Street Corporation (SSC), one of the largest custodians in the global markets. The use
of this metric of liquidity has several unique advantages, as argued by Mahanti, Nashikkar, Sub-
rahmanyam, Chacko, and Mallik (2007). Primarily, since the custodian has information regarding
the ultimate ownership of the bonds, it is possible to compute a holdings-based predictive measure
of the accessibility of the bonds in the period ahead. Additionally, we use realized measures of
liquidity such as traded volume, number of trades and the number of days on which a bond is
traded within a quarter, to the extent permitted by the data, to test if latent liquidity has an effect
on the basis, over and above these conventional measures.
Our bond price data come from transacted prices and volumes as reported on the Trade
Reporting And Compliance Engine (TRACE) system assembled by the National Association of
Securities Dealers (NASD). Introduced in the second quarter of 2002, TRACE has, over time,
come to represent the most comprehensive database of all (TRACE-eligible) corporate bonds that
are traded in the U.S. market. Our CDS price data are obtained from two different sources, Credit
3
Market Analytics (CMA) DataVision and GFI Group Inc. We use the CDS bid and ask prices as
reported on Bloomberg by CMA DataVision, after October 1, 2004, when they became available
from this source. In order to extend the series backwards to the extent possible, prior to October
1, 2004, we use data from GFI Group Inc., the largest institutional broker in the CDS market.
(We conduct tests to ensure consistency between the two series, in the period where there was an
overlap between them, as discussed in section 3 below.)
The analysis in this paper focuses on how liquidity as well as firm financial ratios, such as
leverage, and bond level characteristics, such as covenants, affect corporate bond yields/prices,
after controlling for credit risk. We document several interesting relationships between liquidity
and these other variables in our study. First, we find that liquidity explains a statistically and
economically significant part of the CDS-bond basis and the bond yield. This conclusion lends
support to the traditional hypothesis that the greater the liquidity, the lower the non-default
component of their yield spread, or the CDS-bond basis, and hence, the greater the bond price.2
Second, and equally important, we find that latent liquidity, as a measure of liquidity, has an effect
on the bond price over and above realized measures of liquidity such as trading volume. In addition,
latent liquidity at the beginning of the quarter can be used to predict the basis during the quarter,
as opposed to trading volume data which are only available ex-post.
We also examine how the liquidity in the CDS market itself affects the basis. This is intuitive
because the CDS-bond basis is a measure of the expected return on a strategy that holds a long
position in the bond, along with protection bought in the CDS market, and is thus affected by
both bond market and CDS market liquidity. Hence, the CDS-bond basis reflects, to some extent,
a premium for the relative illiquidity of the corporate bond market compared with that of the
CDS market. The less liquid the bond is relative to the CDS, the more negative is the basis, thus
indicating a positive relationship between liquidity and the CDS-bond basis. For measuring the
liquidity in the CDS market, we use more traditional transaction liquidity metrics such as bid-ask
spreads, to the extent that they are available in our sample. Given the generally higher liquidity in
the CDS market, in many cases, such metrics of liquidity may be meaningful. We find that, over2The earliest proponents of this hypothesis, at a general level, were Amihud and Mendelson (1986). Subsequently
this hypothesis was tested in a variety of markets.
4
and above bond-specific liquidity measures, the liquidity of the corresponding CDS contract affects
the CDS-bond basis. Bonds of issuers whose CDS contracts enjoy greater liquidity tend to be more
expensive (have lower yields) in the cross-section, compared with their less liquid counterparts,
after adjusting for various bond characteristics.
We also examine several relationships documented in the previous literature about the effect of
factors like coupon, amount outstanding and age on the liquidity of bonds, and hence on the basis,
using a much more current and extensive data-set than has been used in previous studies. We find
that firm-level variables that account for credit risk turn out to be significant in explaining the
basis, indicating that the CDS spread does not fully control for the credit risk in corporate bonds.
This contrasts with the approach of Longstaff, Mithal, and Neis (2005) who use the CDS premium
as a pure measure of credit risk. We also find that bond-level characteristics such as tax status, and
the presence or absence of bond covenants leads to differences in the CDS-bond basis. While some
of these characteristics may be related liquidity and tax considerations, others are clearly related
to credit risk characteristics, which may affect the costs of “shorting” the bond. This lends support
to the view that there are significant frictions in the arbitrage between the CDS market and the
corporate bond market.
This paper is divided into the following sections. Section 2 reviews the literature from the
point of view of our measure. Section 3 describes our data sources. Section 4 discusses the latent
liquidity measure proposed by Mahanti, Nashikkar, Subrahmanyam, Chacko, and Mallik (2007)
and the manner in which we compute the CDS-bond basis. Section 5 discusses the results of our
study explaining the basis in terms of liquidity metrics of the bond and CDS markets, as well as
firm and bond characteristics. Section 6 concludes.
2 Literature Review
This paper is related to the considerable volume of literature that attempts to describe the effect
of liquidity on asset prices. Most of this literature has to do with the concept of liquidity costs and
associated liquidity premia in stocks, although there is a somewhat sparse, recent literature that
deals with corporate bonds. While a comprehensive survey of this literature is beyond the scope of
5

this study, we touch upon a few contributions that underpin the prevailing academic perspective on
the effects of liquidity on asset prices.3 In an early contribution in this area, Amihud and Mendelson
(1986) argue that transaction costs result in liquidity premia in equilibrium, reflecting the differing
expected returns for investors with different trading horizons who have to defray their transaction
costs. There is an implicit clientele effect, due to which securities that are more illiquid, and are
cheaper as a result, are held in equilibrium by investors with longer holding periods. This work has
been extended and modified in different directions over the years.4
A closely related branch of literature has to do with modeling liquidity costs in corporate
bonds. The earliest study of this nature is by Fisher (1959), who uses the amount outstanding of
a bond as a measure of liquidity and the earnings volatility as a measure of the credit risk of the
firm, and finds that yield spreads on bonds with low issue sizes (illiquid bonds) are higher. Also
notable is a recent paper by Chen, Lesmond, and Wei (2007), who provide a method for estimating
transaction costs in the corporate bond market and relating them to corporate bond returns. Our
paper uses more detailed data on institutional holdings of bonds to construct an alternative measure
of liquidity, which can be used even in the absence of transaction cost information. The relationship
between this measure and transaction costs and market impact has been demonstrated by Mahanti,
Nashikkar, Subrahmanyam, Chacko, and Mallik (2007).
There have also been attempts to decompose the yield spread on corporate bonds in terms of
the components that are related to the defaultable nature of these securities, versus other factors.
For instance, Eom, Helwege, and Uno (2003) and Huang and Huang (2003) use structural models
to explain the spreads on corporate bonds and find that most structural models are only able to
explain about half of the corporate bond spreads for a range of reasonable parameters assumed for
the firm value process. Elton, Gruber, Agrawal, and Mann (2001) find evidence of a significant
coupon effect in corporate bonds which they attribute to the differential treatment of coupons on
corporate bonds relative to treasury securities.
An important related paper in this strand of the literature is by Longstaff, Mithal, and Neis3The literature on liquidity effects in the broad context of asset pricing is too vast for us to detail here. See
Amihud, Mendelson, and Pedersen (2006) for a comprehensive survey.4See Huang (2003) and Acharya and Pedersen (2005), for examples.
6
(2005), who fit a common model of credit risk both to corporate bonds and to credit default swaps.
Assuming that the CDS price completely captures the default-related part of the corporate bond
yield, they find evidence of a significant non-default component in the yield spread and are able to
relate it to the coupon as well as variables that are related to the liquidity of a bond, such as the
amount outstanding (in the cross-section), bid/ask spreads, and the liquidity premium for on-the-
run treasury securities in the time series. Blanco, Brennan, and Marsh (2005) take another approach
to the problem by studying the co-integration relationship between corporate bond spreads and
CDS spreads. They document the presence of a strongly mean-reverting, non-default component
in corporate bond yields. They also find, based on their model of information flows, that the CDS
market leads the corporate bond market, and that most of the corrections introduced by this lead-
lag relationship take place through the non-default component of corporate bond yields. Our paper
adds to this literature by examining the role of liquidity more closely. We also examine whether
frictions in the arbitrage process between bonds and the CDS contracts cause the CDS contract to
capture the underlying credit risk less than completely.
The other strand of the literature that is pertinent to our research here is the work on measures
of liquidity that are appropriate for the corporate bond market. Some papers that study liquidity
effects using transactions based data on bonds include Chakravarty and Sarkar (1999), Hong and
Warga (2000), Schultz (2001) and Hotchkiss, Warga, and Jostova (2002). More recently, there is a
paper by Houweling, Mentink, and Vorst (2005) that uses liquidity-sorted portfolios in the European
market, constructed using nine proxies for liquidity including issued amount, listed, currency, on-
the-run, age, missing prices, yield volatility, number of quote contributors, and yield dispersion.
However, it is not clear that these approaches directly control for the credit risk of the bond, as
efficiently as the CDS market.
The concept of latent liquidity that is used in this paper draws from Mahanti, Nashikkar,
Subrahmanyam, Chacko, and Mallik (2007). They introduce this measure of liquidity and relate it
to bond-specific characteristics, such as maturity, age, coupon, rating, the presence or absence of
put/call options and other covenants. They also show that latent liquidity has explanatory power
for both transaction costs and market impact.
7

3 Data Sources
Our primary source of data for prices and realized liquidity measures for the corporate bond market
is the Trade Reporting and Compliance Engine (TRACE) database of the National Association of
Securities Dealers (NASD). We first calculate the volume-weighted average price of a bond on
any given day after eliminating cancellations and trade reversals from our data. In order to limit
contamination by off-market trades, we consider only days when the total traded volume is greater
than USD 100,000. We obtain details of bond characteristics such as coupon, issue date, maturity
and issue size from Bloomberg, and match them with the TRACE data by their Committee on
Uniform Securities Identification Procedures (CUSIP) number. We confirm the reported yield on
the bond by performing our own yield computation and rejecting those observations for which our
calculations and the reported yields differ substantially. Unlike Longstaff, Mithal, and Neis (2005),
who restrict their sample to bonds around a five-year maturity, we include bonds of all maturities
but include a control for maturity in our computations. From the TRACE data, we also compute
the number of trades in a quarter, the number of traded days in a quarter and the total quantity
of any bond traded within a given quarter.
In order to compute our measure of latent liquidity, we use the corporate bond holdings and
transactions database of the State Street Corporation (SSC), one of the largest custodians in the
global financial markets. A custodian provides trade clearance, asset tracking, and valuation service
support to institutional investors. The client of the custodian is the fund, i.e., the owner of the asset,
which may deal with diverse broker-dealers. All these trades are cleared through the custodian,
who thus has access to information about a larger number of trades than an individual broker-
dealer. In addition, custodians have access to information on who holds the corporate bonds, and
this data allows the construction of the latent liquidity measure that we employ in this research.
Our database contains the end-of-quarter holdings information on all the bonds in our sample,
based on which the latent liquidity measure is computed. The database covers around 15% of all
bonds traded in the US markets and is reasonably representative of the overall US corporate bond
market, as we show below.5 A brief description of the construction of the latent liquidity measure5For a detailed exposition and analysis of the representativeness of the database, please refer to Mahanti, Nashikkar,
8

is presented in section 4.
Our CDS data are derived from two separate sources. Prior to October 2004, we use CDS
prices supplied by GFI Group Inc, the leading broker in the CDS market.6 The database covers
over 1,000 leading corporate names on which credit protection is bought or sold on a fairly regular
basis. It includes daily prices for CDSs for the period from April 1999 to July 2005. Since October
1, 2004, a much wider coverage of CDS names is available from CMA DataVision via the Bloomberg
data service, in a reliable fashion. These data cover over 2,000 issuers on whom CDS contracts are
traded, and subsequent to this date, we, therefore, use these quoted CDS prices (both bid-, ask-
and mid-) for our basis computation. During the period in which the two data sources overlap, we
confirm that they are substantially in agreement. This gives us confidence that our results prior
to October 2004 are comparable to those after October 2004. We also confirm this by performing
robustness checks by conducting our empirical analysis on the sub-sample after October 2004. (This
is presented in tables 9 and 10.)
There are several advantages to using our combined data-set in relation to the those used in
prior research:
• Our dataset covers a longer time period than has been covered by previous studies. Most no-
table amongst these studies is by Longstaff, Mithal, and Neis (2005), which uses a proprietary
database of CDS prices that covers 52 firms over a much shorter time period (from March
2001 to October 2002). The data-set used by Blanco, Brennan, and Marsh (2005) covers only
33 firms from Jan 2001 to June 2002. Our combined database covers 1,167 firms and 4,972
bonds over the period July 2002 to June 2006, with a total of 33,000 bond-quarters.
• There have been significant changes in the market for corporate bonds with the advent of
hedge funds and credit derivatives over the last ten years. Our data-set covers the latter half
of this period, and thus, includes more recent data. This is in contrast to the data used by
many of the previous studies on corporate bond yields, which are, in many cases, based on
the Warga (1997) Fixed Income Securities Database, which contains data prior to 1996, and
Subrahmanyam, Chacko, and Mallik (2007).6More information about GFI and their CDS database is available at http://www.gfinet.com.
9
has data on about 700 bonds.7
• Our data-set contains quotes by a large number of CDS market-makers, and is thus quite
inclusive and reliable.
Data on interest rates, such as swap rates and treasury rates, are obtained from Datastream.
These data are also matched by date with those for corporate bond and CDS trades in our data-set.
In order to focus on the pricing of corporate bonds relative to the CDS contract, we restrict our
attention to data on days on which we observe at least a quote, if not a trade, in both the CDS market
and trades in the corporate bond market. This eliminates, as far as possible, timing mismatches
in the data, and accurately captures the effect of time variation in the default risk inherent in
the bond. For each bond, we also obtain data on the corresponding bond characteristics, such as
coupon, rating, outstanding volume, and bond-specific features such as covenants, tax status and
issuance methods from Bloomberg.8
Additionally, we match the firms in the Compustat quarterly database by ticker and name with
the bonds available in the TRACE database. This allows us to compute firm level-financial ratios
such as leverage and the proportion of tangible assets that we might expect to have a significant
bearing on the credit risk of the firm. In cases where data are not available quarterly, we use data
available as of the previous financial year. In order to account for reporting delays and to make
sure that the information is available to the market participants at the time of the trade, we use
data from the quarter prior to the one for which we compute the basis and the liquidity measures.
Table 2 shows the decomposition of the sample by credit rating. The sample is reasonably
representative of the overall composition of the corporate bond market. It also shows the rating
distribution in the holdings database as well as the overall universe. The top four ratings account
for around 74% of all corporate bonds outstanding, which suggests that the sample is biased toward
investment grade issues. The sample is broadly similar to the samples used in prior studies of the
corporate CDS market, but with many more observations, both cross-sectionally and over time.9
7See for example papers by Elton, Gruber, Agrawal, and Mann (2001), Huang and Huang (2003), Eom, Helwege,and Uno (2003) and others.
8In the empirical estimations, we follow the numerical scheme used by Compustat to assign numbers to ratings,where AAA is coded as 1, AA+ is coded as 2 and so on.
9See, for example, Blanco, Brennan, and Marsh (2005) and Longstaff, Mithal, and Neis (2005).
10

4 Methodology
4.1 Latent Liquidity
In this section, we describe in brief the methodology used to compute the latent liquidity measure.
In simple terms, latent liquidity is the weighted average turnover of the funds holding a particular
bond, the weights being the fractions of the total outstanding amount of a bond held by various
funds at the beginning of the month.10 The argument behind this computation is that since
there is considerable persistence in turnover, bonds that are held by funds that have a larger
turnover are likely to be more accessible and hence more highly traded. Mahanti, Nashikkar,
Subrahmanyam, Chacko, and Mallik (2007) show that this measure of latent liquidity is correlated
with other transaction-based measures of liquidity, such as trading volume and bid-ask spreads, in
the relatively liquid segment of the market where reliable micro-structure based data are available.
However, the advantage of this measure is that it does not require trade-based information, and is
thus available ex-ante for a broader cross-section of bonds.
Let πij,t denote the fractional holding of a bond i, i = 1, 2, ...I, by fund j, j = 1, 2, ...J , at time
t. Let Tj,t denote the average portfolio turnover of a fund in the months from t to t − 12, where
turnover is defined as the ratio of the dollar trading volume of the fund between time t andt−12 to
the value of the fund at time t. The latent liquidity measure for bond i at time t is simply defined
as:
Lit =J∑j=1
πij,tTj,t (1)
We use equation 1 to compute a quarterly value for the latent liquidity of each bond in our
sample where the latent liquidity is expressed in annual turnover terms. Note that, in this sense,
the latent liquidity of the bond indicates the average trading frequency of the agents holding the
bond, and consequently, the ease with which it may be traded in the presence of search frictions.10For a more detailed description of the computation, as well as the relationship between latent liquidity and bond
characteristics, the reader is referred to Mahanti, Nashikkar, Subrahmanyam, Chacko, and Mallik (2007).
11
4.2 The Basis between CDS prices and Bond Prices
The recent academic literature on corporate bond pricing has attempted to isolate the component
of corporate bond yields that is not attributable to default risk (the non-default component). Most
of the earlier papers in this area use an explicit model for pricing credit risk.11 However, the
advent of the CDS market makes it possible to isolate default risk in corporate bonds issued by
a certain issuer without relying too heavily on a particular model of credit risk and a specific
parameterization, since a direct reading of the market’s pricing of credit risk is available. Most
CDS contracts specify a particular reference asset, but allow for settlement by physical delivery
of other similar obligations of the same issuer.12 Hence, since CDS contracts price default risk
explicitly, they are a good benchmark for the pure credit risk of the firm, and hence apply to all
its traded obligations. Indeed, as argued by Duffie (1999), to a first-order approximation, there is
an equivalence between the CDS price and the spread on the floating rate obligation of a similar
maturity issued by a firm. It must be noted that most corporate bonds issued by firms tend to be
fixed-rate bonds, and thus, this equivalence does not hold exactly. More importantly, as shown by
Longstaff, Mithal, and Neis (2005), the pure corporate bond spread is a biased measure.
This equivalence is further complicated by differing definitions of the CDS contract, especially
in the early years of our sample period. However, with the increasing use of standard International
Swaps and Derivatives Association (ISDA) agreements between counter-parties, this is less of a
problem in recent years. Even so, the problem of delivery terms remains. In case of a default,
a typical CDS contract requires the delivery of the reference obligation (or a similar obligation)
in exchange for face value. However, if the deliverable bonds are illiquid, the buyer of the CDS
(protection) who needs to deliver them may incur an additional liquidity cost to source the bonds
in the market. Hence, there are frictions in the arbitrage mechanism between the CDS contract
and the bond, primarily due to the costs of “shorting” the bond. In addition, the bond that is
deliverable into the CDS contract would be the cheapest among the candidate bonds; hence, the
other bonds would trade at a price premium or yield discount to the cheapest-to-deliver bond.13
11For example, see papers by Huang and Huang (2003) and Eom, Helwege, and Uno (2003).12There are some recent moves to switch to cash settlement, rather than physical delivery, to avoid the possibility
of a squeeze on the reference bond.13This problem exists even with cash settlement, since the settlement price is established based on polling dealers
12

Subject to the above caveats, there are different approaches to isolating the non-default part
of the corporate bond spread, which could then be related, at least in part, to liquidity effects. One
possible approach is to use the difference between the CDS price and the simple corporate bond
yield as a model-independent (albeit noisy) proxy for the non-default component of the corporate
bond yield spread. However, this leads to biases when we are comparing spreads on high yield
bonds which have substantially higher probabilities of default and trade much below par. This is
because the CDS contract offers protection equivalent to the difference between the post-default
market value of the bond and the face value of the bond. Thus, a bond that is trading substantially
below par before default cannot be effectively hedged by a single CDS contract.
A second approach, proposed by Longstaff, Mithal, and Neis (2005), is to apply a theoretical
model of credit risk to price both the CDS and the corporate bonds simultaneously. This latter
method has the advantage that any potential biases are addressed explicitly. However, the proce-
dure is dependent on the choice of the credit risk model. The literature on credit risk models shows
us that there remain significant pricing errors in all the models that have been used so far.14
Most market participants use a third method called the par-equivalent CDS spread of the
bond, in order to compute the basis. This method adjusts for deviations of the bond value from
par so as to make the spread of the bond comparable with a CDS contract. We use this method
in this paper. This method is similar to the one used in Longstaff, Mithal, and Neis (2005), with
the essential difference that it assumes assumes discrete annual payments of coupons and uses an
annual default probability. However, it is model independent in the sense that it does not require
the calibration of a model of credit risk because it assumes that the term structure of credit spreads
is essentially flat. Details of the methodology are provided in Appendix A.
Following Grinblatt (2001) and Longstaff, Mithal, and Neis (2005), as well as standard market
practice, we use the USD-LIBOR swap curve as a measure of the risk free rate in our par-equivalent
spread computation, i.e., the spread between the yield on a par-equivalent bond and the benchmark
rate.15 This curve is available from Datastream. We linearly interpolate between points on the
for quotes.14See Huang and Huang (2003) and Eom, Helwege, and Uno (2003) for tests of a range of credit risk pricing models.15In previous drafts of the paper, we used both the swap curve and the US Treasury curve as benchmarks. While
the results for the two alternative benchmarks are qualitatively similar, liquidity effects in the Treasury curve may
13

swap curve to obtain the corresponding discount factors at semi-annual intervals, for the purpose
of computing the par-equivalent spreads.
An important issue for us to address here is the issue of shorting costs. When the CDS-bond
basis is negative, an appropriate arbitrage strategy would involve holding the bond and buying
protection on it through the CDS contract to maturity. This has the effect of hedging away the
credit risk in the bond, while earning the non-default component, absent liquidity costs. On the
other hand, if the basis is positive, the arbitrage strategy involves “shorting” the bond and selling
protection on it through the CDS contract. Selling corporate bonds short is costly because corporate
bonds are difficult to “find” in the securities borrowing and lending market.16 Typically, a rebate
rate is paid on the cash collateral that is used to borrow a bond, and if this rebate rate is less than
the repurchase rate on general collateral in the market, it constitutes a cost to an agent that shorts
a bond. The shorting cost is priced into the bond, and constitutes a price premium.
From the above discussion, it would be useful to account for shorting costs, particularly when
the basis is negative, in our analysis. We were able to obtain access to a data-set for realized
borrowing costs; unfortunately this data-set covers only a small part of our sample period and
our analysis was somewhat restricted. However, in this limited sample, we find that “shorting”
corporate bonds is almost always costly, with an average shorting cost of 0.31% (calculated as the
difference between the general collateral (GC) rate and the rebate rate on a bond). Shorting costs
are typically high when differences of opinion about firm values are high, which might be the case
when firms are in distress and have high CDS spreads. Since these costs can be quite high, we
would expect the basis to be incorporated into the yield, and hence the CDS-bond basis.
Since we do not have data on shorting costs for our entire sample, it is difficult to analyze
the impact of shorting costs on the non-default component. For the limited data that we have,
we find little relationship between shorting costs and latent liquidity.17 This finding is consistent
with the evidence presented in Nashikkar and Pedersen (2006), who also find that there is a rather
themselves affect our results. The disadvantage of using the swap curve as a benchmark is that swaps themselvescarry some credit risk, and hence, may slightly underestimate the credit spread implied in the corporate bond yield.We believe that the latter is likely to be a smaller effect than the liquidity effect in the US Treasury curve.
16See Duffie (1996) and Duffie, Garleanu, and Pedersen (2002b) for details of the implications of “shorting” costs.17These results are not presented here to conserve space. They are available, upon request from the authors.
14
weak relationship between shorting costs and the liquidity of the bond, owing to the fact that both
supply and demand are likely to be high for liquid bonds in the borrowing and lending market. If
this relationship extends to the larger sample, we do not expect “shorting” costs to influence the
conclusions of our study as far as liquidity is concerned.
4.3 Liquidity in the CDS market
As argued earlier, the CDS price-bond yield spread basis may reflect the relative liquidity of the
corporate bond versus the corresponding CDS. To the extent that the absolute liquidity of the
bond market is what gets priced into the corporate bond yields, it is necessary to account for the
liquidity in the CDS market. As stated earlier, the intuition behind this argument is that the
CD-bond basis represents an investor’s expected return from a strategy that involves holding a
long position in the bond and buying protection on the issuer in the CDS market. Such an investor
will demand compensation for the relative liquidity of the corporate bond market compared with
the CDS market. Therefore, in order to account for the liquidity of the CDS market, we study
measures of CDS market liquidity that have an indirect effect on the corporate bond prices, in
addition to bond-specific liquidity.
Since the CDS market is fairly liquid, we are able to use transactional measures of liquidity.
One measure of CDS market liquidity is the bid-ask spread. The other is the bid-ask spread
normalized by the CDS mid-price. These two measures have somewhat different implications on
transaction costs. If the bid-ask spread is highly correlated with measurement errors in the CDS
prices, it is likely to lead to a spurious coefficient when used by itself. On the other hand, the
percentage bid-ask spread is likely to ignore potentially valuable relationships between CDS prices
and liquidity. We use both measures in our estimation. Additionally, when the credit markets
are highly volatile, there is a considerable amount of arbitrage risk involved in a CDS-Bond trade.
To proxy for this risk, we use the standard deviation of CDS price changes during the quarter, as
another CDS market measure that might affect the basis.
15

4.4 Firm-Specific Effects
If there are no frictions in the CDS and the bond markets, all information regarding default and
recovery rates should be incorporated in both the CDS price and the bond yield spreads. Hence,
we would not expect the basis to depend on firm-specific variables. However, there are significant
frictions in the bond market. On an average, bonds trade with much lower frequencies than the
CDS contracts, and as shown by Blanco, Brennan, and Marsh (2005), changes in bond yield spreads
lag changes in CDS spreads. While this statement applies to the yield spreads and hence the basis
on any given date, we expect the effects of these lags to be mitigated when we study the average
basis over any long term horizon such as a quarter.
On the other hand, if there are structural reasons which cause the basis to be biased in one
direction, we could expect variables related to credit risk to affect the basis, even over a longer
period. There are three possible structural reasons that might lead to a persistent bias:
• The first has to do with the definition of the contracts. Since a buyer of CDS protection gets
a payoff equal to the face value of the bond on default, he stands to lose or gain depending
upon whether the bond is trading at a premium or a discount. This means that relative to
the market values of those bonds, recovery rates on those bonds are implicitly different. The
computation of a par CDS equivalent yield spread on the bond mitigates this problem to a
large extent. Hence, we would not expect the basis to be systematically affected by whether
a bond is trading at par, or is at a premium or a discount, or by firm-level variables.
• Secondly, the arbitrage between the bond and the CDS contract is frictionless only in one
direction; while it is easy to buy protection and take a long position in a bond, sellers of
protection through the CDS contract can only hedge their exposures through a costly process
of “shorting” the corporate bond, leading to a wedge between the corporate bond yield spread
and the CDS spread. This is likely to be exacerbated just prior to default, because larger
differences in beliefs across market participants about firm values in times of financial distress,
together with “shorting” frictions are likely to make “shorting” even more difficult. Since
investors rationally anticipate this, the price of the bond relative to the CDS contract is
16
likely to be high. Moreover, we would expect the basis itself to be higher during times when
default becomes more likely. This is one possible mechanism through which firm-level credit
variables can be expected to affect the basis. A variable that proxies for higher default risk is
likely to cause the bond to be more expensive relative to the CDS, thus increasing the basis.
Additionally, we would expect that firms likely to have a lower dispersion of opinions about
recovery values in the event of default, such as firms with high levels of tangible assets, would
have lower shorting costs, and hence, a lower basis.
• Another explanation, which is somewhat related to the above point about shorting costs
is that different agents operate in the two markets and can become capital-constrained at
different times.18 Economically, selling protection through a CDS contract is equivalent in
risk exposure to buying the bond. If a default event causes sellers of protection to become
capital constrained to a greater extent than funds which typically have a long position in the
corporate bond, then “shorting” frictions will make it impossible for prices between the two
markets to equalize. If investors anticipate this, bond prices will again be higher than those
implied by CDS prices. Note, however, that the difference between this and the previous
explanation is about which market correctly incorporates information about default risk and
recovery rates. They have the same implication for the basis.
• There is typically a cheapest-to-deliver option implicit in the CDS contract. The price of the
cheapest-to-deliver bond is likely to track the CDS price most closely. Since, by definition,
other bonds are more expensive, their basis is positive, relative to the cheapest-to-deliver
bond. Bond prices may have a wider dispersion when there is greater heterogeneity in investor
beliefs about firm value, particularly just prior to defaults, and for firms that have lower
levels of tangible assets. This, again, has the same implication for basis as the above two
explanations.
If the above factors are true, it is possible that firm-specific variables will also affect the basis.
To test for this hypothesis, we use firm-specific data relating to the issuer of the bonds. We collect18See, for example, Brunnermeir and Pedersen (2006)
17
data on firm-specific characteristics by matching the available bonds in our sample by their ticker
symbol with firms in the Compustat quarterly database. A wide variety of firm-variables have been
used in the literature on default and recovery rates.19 We would not expect these variables to affect
the basis, since the CDS price is a more direct proxy of credit risk than a lagged financial ratio.
If, on the other hand, the basis reflects residual credit risk not captured by the CDS spread for
structural reasons, these financial ratios may have an effect on the basis. The firm-specific variables
that we use in our study, also used commonly in credit analysis, to proxy for the likely frictions in
the arbitrage process in the process of “shorting” the bond are:
1. Leverage: The firm’s financial leverage measures the fixed obligation of the firm and is a
likely predictor of financial distress. We define the leverage as the ratio of the book value of
debt to the sum of the book value of debt and the average market value of equity during a
quarter.
2. Tangible Assets: Recovery rates on firms with a higher proportion of tangible assets are
believed to be higher than those with a lower proportion of tangible assets.20 Accordingly,
we include the proportion of property, plant and equipment to total assets in the firm as the
proxy for the tangibility of a firm’s assets. A higher level of tangible assets implies a higher
recovery value in case of default.
3. Current Ratio: Leverage is associated with the long term credit risk of the firm. However,
firms may default on their obligations because they are unable to meet their liabilities in the
short term. To control for this effect we use the current ratio - the ratio of current assets
to current liabilities (including any debt maturing within the year). A higher current ratio
implies a lower likelihood of default, and higher recovery rates, in the short run.19While an exhaustive list of these effects is beyond the scope of this study, the reader is urged to refer to Acharya,
Bharath and Srinivasan (2006) for an exposition and implementation of firm- and industry-level variables.20See, inter alia, Acharya, Bharath and Srinivasan (2006)
18

4.5 Covenants and other bond characteristics
The presence or absence of specific covenants in the bond has an important implication for the basis.
In a frictionless market, the CDS market should price in the covenants on the cheapest-to-deliver
reference obligation issued by the entity. However, different bonds issued by the same obligor may
vary in terms of the extent of protection they offer in case of default, due to the presence or absence
of covenants. Hence, these convenants may affect the relative prices of the bonds. Additionally
bonds with different levels of protection may behave quite differently in case of non-default corporate
events such as a leveraged buy-out or an acquisition. For example, leveraged buy-outs hurt sellers
of protection on the CDS contract because they make default more likely. However, holders of
bonds may be protected in terms of their seniority vis-a-vis new debt issued by the acquirer. There
may also be features like special put options which allow investors to sell back the bonds to the
issuer in case of acquisition.21
In addition to covenants, there may be other bond characteristics that might cause differences
in their tax-status and/liquidity. For instance, exchange-listed bonds may be more liquid than those
that are unlisted. In addition, they may be subject to additional regulatory oversight. Alternatively,
some bonds, such as industrial revenue bonds ???? might have a different tax status compared
to others.
To address these issues, we obtain an extensive list of covenants and other binary bond char-
acteristics from Bloomberg, and use them in the form of dummy variables for the presence or
absence of a specific covenant. The dummy variables we use, along with their definitions are listed
in Appendix A. We also include a column for the likely effect we expect these dummy variables to
have on the basis, and a brief explanation for why we expect such an effect.
4.6 Summary Statistics
Table 3 presents the summary statistics for the sample of bonds that we obtain after the filtering
process, averaged at the level of the bond. It can be seen that there is considerable variation in both
the latent liquidity measure and the trading volume of the bond (the two main liquidity variables21The presence of such covenants may also create situations where the CDS contract is “orphaned” due to the
disappearance of the reference obligations, following their buy-back.
19
that we use in the bond market), as well as the CDS-bond basis. The latent liquidity of bonds in
our sample varies between 0 and 10.78. The mean latent liquidity is 0.32 per year, with a standard
deviation of around 0.47 per year. The number of trades per quarter ranges from a minimum of
one trade to a maximum of around 28,000 trades, with a mean of 226 trades per quarter. The
bonds in our sample range from newly issued bonds to twenty year old bonds, with an average age
of around four years and an average maturity of around seven years, while the ratings range from
the highest grade (AAA) to bonds that have defaulted or are no longer rated.
There is significant variation in the CDS bid-ask spreads, ranging from almost zero to around
29%, indicating that there can be severe liquidity constraints in the CDS market. The firms in our
sample range from those that have no leverage in the previous quarter, to those that are highly
levered with a leverage ratio of almost 1. On an average the firms are financed by about 36% debt.
We also see a significant variation in the current ratio, from 19% to 1,182% and the proportion of
the firm’s fixed assets, from firms that have virtually no fixed assets to firms that almost entirely
consist of fixed assets (94%).
5 Results
5.1 Bond Characteristics, Latent Liquidity and Other Liquidity Metrics
In order to study the relationship between latent liquidity and other bond-specific variables, we
first look at the correlations between latent liquidity and other liquidity-related metrics such as
the trading volume of the bond in any quarter, the number of days on which it is traded, and the
number of trades in the bond, in addition to its issue size and age. The main aim of this exercise
is to confirm that these empirical estimates agree with those presented in Mahanti, Nashikkar,
Subrahmanyam, Chacko, and Mallik (2007) who use a much larger sample of bonds, many of
which do not have CDS contracts associated with them. The correlations between these liquidity
measures are shown in table 4. We find that the age of the bond is negatively correlated with all
the other liquidity metrics - as a bond gets older, its liquidity decreases. The correlations between
the number of days traded, the number of trades and the volume traded are quite high, as is to
20

be expected, since these are all measures of realized trading activity. The latent liquidity at the
beginning of the quarter is also positively correlated with the measures of realized trading activity
in the following quarter. In other words, the latent liquidity of a bond at the beginning of a period
appears to predict the transaction-based measures of liquidity in the subsequent period.
Additionally, we perform pooled regressions using bond-quarter observations to study how
latent liquidity is affected by bond-specific variables such as coupon, amount outstanding, rating,
age, maturity, as well as CDS market-related variables such as the CDS price (to account for the
effect of credit risk on the latent liquidity) and the CDS bid-ask spread (to account for the relation-
ship between CDS market liquidity and bond market liquidity). Again, this exercise is similar to
that in Mahanti, Nashikkar, Subrahmanyam, Chacko, and Mallik (2007), with the addition of the
CDS market variables, and confirms that the drivers of latent liquidity in our sample are similar
to those they observe. Table 5 shows the determinants of average latent liquidity for the bonds in
our sample. It shows that the age of the bond is strongly negatively related to latent liquidity -
older bonds have poorer latent liquidity. There are also some clear coupon effects. Higher coupon
bonds seem to have higher latent liquidity as compared to lower coupon bonds. At the same time,
bonds with poorer credit ratings tend to have higher latent liquidity. However, when we control
for CDS liquidity and firm-specific ratios related to credit risk, it appears that a poorer rating in
itself leads to lower latent liquidity. We can also see that bonds with higher issue sizes tend to be
more liquid, which is intuitively reasonable. Overall, our results confirm the findings of Mahanti,
Nashikkar, Subrahmanyam, Chacko, and Mallik (2007), albeit for a smaller sample of bonds with
CDS contracts traded on the issuer.
We next analyze the percentage bid/ask spread on the CDS contract, in order to investigate
if cross-sectional differences in bond liquidity are driven by CDS market liquidity. We find that
the percentage bid-ask spread on the CDS contract has some explanatory power for the latent
liquidity of the bond. When the percentage bid-ask spread of the CDS contract is higher, the
bonds themselves tend to be less liquid. This is over and above the bond-specific liquidity variables
that we mention above. Interestingly, leverage seems to be a strong determinant of latent liquidity.
Bonds issued by highly levered firms tend to be held more by active investors than bonds of firms
21

with lower leverage, indicating that there are credit clientele effects related to the trading activity
of the agents holding those bonds. This could be because highly levered firms are generally financial
firms, with large amounts of liquid debt outstanding.
5.2 Time-series Behavior of the Aggregate Average Basis
We first examine the behavior of the aggregate average basis across bonds in our sample and
compare it with the aggregate average latent liquidity (the simple average of the latent liquidity of
bonds included in our sample in any quarter) at the beginning of the period.22 This analysis helps
us make qualitative statements about relationships between our various liquidity variables and the
CDS market liquidity, at the aggregate level over time. This is equivalent to treating our sample
as a portfolio and computing the average basis for every quarter, and similar averages of the other
measures. An advantage of this approach is that errors in the measurement of latent liquidity for
individual bonds are unlikely to be correlated across bonds. Hence, portfolio-level average latent
liquidity is significantly less noisy than the latent liquidity of individual bonds.
Figure 1 shows the variation in the aggregate average basis over time, along with the average
latent liquidity of the bonds in the sample at the beginning of the period, for each quarter July
1, 2002 to June 30, 2006. It shows that the average basis of bonds in our sample decreased over
time, and so has the average latent liquidity of the bonds. The graph suggests that there is a
positive correlation between the aggregate latent liquidity and the aggregate average basis of the
bonds in our sample: when the aggregate average liquidity in the market is high, the bonds trade
at lower yield spreads, relative to the corresponding CDS prices. Figure 2 shows the variation in22This measure has an intuitive interpretation in terms of the average turnover of funds. Summing equation 1
over i gives us:
Lt =
∑Ii=1
∑Jj=1 π
ij,tTj,t
I
=
∑Ii=1
∑Jj=1 π
ij,tTj,t
I
=
∑Jj=1 Tj,t
I
(2)
This is equal to the average turnover of funds under the assumption that the ratio of the number of funds to thenumber of bonds stays constant over time. It is a measure of aggregate corporate bond market liquidity. However,this does not necessarily hold for a sub-sample of bonds, such as ours.
22

the aggregate average basis in relation to the aggregate average trade count of bonds in a given
quarter in our sample. While the figure suggests that there is a positive correlation between trading
activity and the basis, the relationship seems to be less clear-cut for trade count than that for latent
liquidity.
5.3 Determinants of the CDS-Bond Basis
Section 5.2 suggests that there is a positive relationship between the aggregate average basis and
aggregate average latent liquidity. Since latent liquidity is measured at a quarterly frequency, it
is difficult to perform a time-series analysis separately for each individual bond, over a four-year
period, especially when there are missing observations for some of them. Instead, we pool the all
the observations across bonds and quarters. In order to perform the regressions, we compute the
average quarterly basis for each bond and match it with its latent liquidity at the beginning of the
quarter, along with other bond-specific variables for that quarter. This gives us about 29,000 bond-
quarter observations, with all bond-specific variables included, a small reduction in our sample. The
pooled regression estimates are consistent as long as the standard errors are adjusted for residual
correlations within each bond group. To incorporate this adjustment, we use standard errors,
clustered by bond.
5.4 Bond Liquidity
We first perform univariate pooled regressions of the average basis of a bond, during the quarter,
on variables related to the liquidity of the bond, namely its latent liquidity at the beginning of the
quarter, the number of days it traded during a quarter, the number of trades during the quarter,
the logarithm of the traded market value during the quarter, the issue size of the bond, and the
age of the bond at the beginning of the quarter. The standard errors are adjusted to account for
clustering within bonds. We find that each of these explanatory variables is statistically significant.
An increase in latent liquidity by one standard deviation leads to an increase in the basis (and a
decrease in the yield of the bond) by ten basis points. An increase in the number of trades by one
standard deviation leads to an increase in the basis by about nine basis points. An increase of one
23

standard deviation in the number of days traded per quarter leads to an increase of eight basis
points in the average basis. An increase of one standard deviation in the quantity traded leads to
an increase of five basis points in the basis. As bonds age, their basis reduces, leading to higher
yields and lower prices. An increase of a year in the age leads to a reduction of about four basis
points in the basis. Surprisingly, although issue size by itself leads to an increase in the basis, it is
not statistically significant.
While the univariate relationships are as expected, it is important to see which of these liquidity
variables are significant, once other variables have been accounted for. Specifically, we are interested
in seeing if latent liquidity has explanatory power for the basis over and above other realized
liquidity-related variables. We next proceed to investigate this issue in detail. In doing so, we
confirm several empirical findings from the literature and generate new findings of our own.
Table 7 shows the relationship between the CDS-bond basis of individual corporate bonds, the
bond-specific characteristics and liquidity for a range of alternate specifications that include latent
liquidity and other bond-specific liquidity measures, CDS market-specific effects and firm-level
financial variables. In all the specifications presented in the table, latent liquidity has significant
explanatory power for the basis, even after the inclusion of realized trading activity. This finding
indicates that the liquidity premium of a bond is determined not only by the actual trading activity
in the bond, measured by transaction metrics, but also by the pattern of investors holding the bond
in terms of their potential trading activity, as proxied by the latent liquidity measure. This evidence
provides strong support for the hypothesis that there is extra information related to liquidity in the
latent liquidity measure, and that it is priced in the corporate bonds. On an average, an increase
of one unit in the latent liquidity seems to increase the basis by 20 bps, or reduce bond yields by
around 20 bps. Between the most liquid decile and least liquid decile of bonds in our sample, this
indicates a difference of 1% in yield, an economically significant difference.
The significant coefficient of the coupon rate variable persists even after the inclusion of a
large number of liquidity-related variables. Traditionally, as in Elton, Gruber, Agrawal, and Mann
(2001), this relationship has been explained as a tax effect. However, as has been argued more
recently by Longstaff, Mithal, and Neis (2005), the tax treatment on coupon income and swap
24

rates is the same, and therefore, one would not expect to find a tax effect the difference between
corporate bond yields and the swap rates. The fact that part of the coupon effect remains even
when swap rates are used as the benchmark indicates that this explanation can only be partly true,
at best.23 In addition, there is anecdotal evidence that many of the participants in the corporate
bond markets, such as long term pension funds, are tax-exempt. Even hedge-funds, which in recent
years have become significant players in the CDS and CDO markets, as well as the corporate bond
market directly, tend to be tax-neutral between income and capital gains. Given the large sizes
of these two segments of the market, it is difficult to conclude that the marginal investor in the
corporate bond market has a strong tax preference.
An alternate explanation of the coupon effect may have to do with the different levels of
protection implicit in the definition of the CDS contract. While hedging the default risk in a
corporate bond with a CDS, if default occurs on a bond that was bought at a premium to par,
the protection on the bond is only up to the face value of that bond. Hence, an investor who
buys a premium (discount) bond that defaults unexpectedly loses more (less) value relative to an
investor who buys a par bond by the same issuer. This makes active investors averse to holding
bonds trading substantially above or below par. Although we try to control for this effect in our
computation of the par equivalent spread of the bond, we cannot control for any explicit aversion
to hold bonds away from par, due to this level of protection.
A larger amount outstanding of a bond tends to increase the CDS-bond basis, and makes the
bond more expensive, thus increasing the CDS-bond basis. This is because bonds with larger issue
sizes are likely to be more liquid relative to bonds with smaller issue sizes, even after controlling
for latent liquidity, and hence have lower transaction costs. Older bonds are likely to be less liquid
than newer bonds, because they get locked up in the portfolios of passive investors. Thus, after
controlling for latent liquidity, we should not expect age to have a significant effect on the basis. The
results lend support to this hypothesis. Although the coefficient of age in the first two regressions
is positive, its sign changes after the inclusion of firm level effects, indicating that age in itself is23The values of the coefficient of the coupon rate in the case of swap and treasury rates are similar as documented
by Longstaff, Mithal, and Neis (2005), as well as in empirical tests using our dataset (not reported here), with swapand treasury rates as benchmarks. This evidence casts doubt on the conventional explanation of the coupon effectas being due to differential taxation of corporate versus treasury bonds.
25
not a good measure of liquidity.
The relationship between the basis and the number of trades in the bond is also significant.
Note that the number of trades is a measure of the realized liquidity of the bond. As expected,
it has a positive coefficient in the first two regressions. It should be noted that for every time
period, latent liquidity is available ex-ante, while the realized trading volume is an ex-post measure
of liquidity. Thus, latent liquidity can be used to predict the non-default component in the bonds,
as opposed to trading volume, which is only available ex-post or, at best contemporaneously, with
the basis.
5.5 CDS Market Effects
In addition to bond-specific liquidity effects, we find that the bid-ask spread in the CDS market
has explanatory power for the basis, over and above the liquidity of the bond in itself. This is
noteworthy, because it indicates that liquidity in the CDS market affects the prices of bonds in the
cross-section. This is a phenomenon that has not been documented in the previous literature. Our
results show that both bond market and CDS market liquidity variables have a strong effect on
the CDS-bond basis. In fact, an increase by one basis point in the CDS bid-ask spread leads to an
increase of two basis points in the CDS-bond basis. This indicates that bonds are relatively more
expensive compared to the CDS contracts, when the CDS market illiquidity is high. There are two
possible explanations for this. First, less liquidity in the CDS market is likely to drive investors
toward the corporate bond market, making bonds relatively more expensive. There is some support
for this explanation. Figure 3 shows the relationship between the average bid-ask spread in the
CDS market and the average trade count of bonds in our sample in any given quarter. It is apparent
from the figure that as the CDS market has become more liquid, average trading volume in the
bond market has actually decreased. Second, episodes of poor liquidity in the CDS market are
often connected with negative news about the issuers on whom the CDS contracts are traded. It
is generally difficult to “short” corporate bonds, which leads to corporate bonds becoming more
expensive relative to the CDS contracts on the respective issues particularly during illiquid periods,
in the market as a whole. Unfortunately, in the absence of detailed data on shorting costs, we have
26
no clear way of distinguishing between these two hypotheses.
We find, however, that a higher percentage bid-ask spread on the CDS contract leads to a lower
basis. However, this effect seems to be related to the credit risk of the issuer, as the inclusion of firm-
level financial ratios removes the explanatory power of the percentage bid-ask spread. The above
results are interesting because they show that the CDS market liquidity has explanatory power for
bond yield spreads, over and above bond-specific liquidity variables, thus providing evidence of a
liquidity spill-over effects from the CDS market into the bond-market.
We include the CDS market volatility as a control for the riskiness of the CDS market. We
find that the basis is negatively related to CDS market volatility, after controlling for other factors.
Higher volatility in the CDS market makes a bond cheaper relative to the CDS contract, indicating
that a strategy of buying the bond and buying protection on it in the CDS market has higher
returns when the volatility of the CDS spread is high, indicating that a part of the CDS-bond basis
is compensation for this risk.
5.6 Firm-Specific Effects
As argued earlier, if the CDS price completely accounts for the credit risk of the issuer, we would not
expect firm-specific financial variables, such as leverage and the percentage of tangible assets on the
balance sheet, to have any effect on the CDS-bond basis. However, we find that these firm-specific
variables have strong explanatory power for the basis. This finding can either mean that some of
these variables affect the basis through other channels such as liquidity, or more plausibly, that the
credit risk of the bond is not fully captured in the price of the CDS contract, because of frictions
that exist in the arbitrage between the CDS market and the bond market. The firm’s leverage,
computed as the ratio of long term debt to the sum of long term debt and market value of equity
of the firm, turns out to have significant explanatory power on the basis. Firms with high leverage
tend to have substantially higher basis compared to firms with low leverage. This effect seems to
be clearly related to credit risk, as the inclusion of leverage drives away any explanatory power that
the rating of the firms have. It indicates that bonds issued by highly leveraged firms tend to be
more expensive relative to their CDS contracts. This could possibly have to do with the difficulty
27

of “shorting” these bonds because of frictions in the corporate bond borrowing and lending market,
and segmentation between corporate bonds and CDS, whereby holders of corporate bond may have
different beliefs about default probabilities and recovery rates, as compared to agents who trade in
the CDS market.
While the current ratio does not seem to be particularly significant, the proportion of property,
plant and equipment to total assets, which is used as a measure of the firms tangible assets has
a strong negative coefficient. A firm with higher tangible assets has a lower basis. This is likely
because firms with higher tangible assets are likely to suffer from a lower dispersion of beliefs about
firm values, leading to lower shorting costs in the event of default, and thus, a lower basis.
5.7 The Effects of Individual Bond Characteristics
Bonds are unique and have several distinguishing characteristics, particularly covenants that make
them different from the CDS contract in terms of credit risk. In this section, we look at how the
characteristics of these covenants affect their basis. The full list of these covenants, along with
their definitions and the expected signs of the coefficients, is given in Appendix A. These results,
reported in table 8, represent the coefficients of the dummy variables associated with each covenant
in a pooled regression controlling for the bond specific, firm-specific, and CDS market variables
included above.
We find that credit-sensitive bonds have a higher basis (are more expensive) of almost ten basis
points, on average, compared to other bonds, although this effect is not statistically significant.
Bonds that have an option to be defeased have a lower basis by up to eight basis points. This is
puzzling and seems to indicate that defeasence only serves as a signal that the issuer is more likely
to free itself from covenants when it is advantageous for the issuer to do so. Bonds subject to the
E.U. Savings Directive tax tend to have a lower basis of almost 20 basis points, indicating that
they are cheaper.24 This could indicate some non-linearity of the basis with respect to age (since
these taxes apply only to bonds issued after the year 2001, and hence are newer). Alternately,
it could be because investors based in tax havens such as the Cayman Islands are subject to the24These taxes apply to all publicly issued bonds issued after July, 2001, and held by an investor based in the E.U.
and dependent countries.
28
increased taxes. Bonds that are based on an equity claw-back provision are cheaper, by about
12 basis points. Secured bonds have a higher basis of up to 26 basis points as compared to
unsecured bonds, indicating that they are more expensive. Similarly bonds that have third party
guarantees also have a higher basis, although it is marginally significant, statistically. Exchange-
listed bonds seem to have a marginally higher basis (although not significant) and could point to
greater liquidity. Funded bonds (bonds where the issuer has the obligation to partly redeem the
bond before maturity) seem to have a higher basis and are expensive relative to the CDS contract.
This effect is marginally significant. Surprisingly, the effect of special put options related to asset
sales or acquisitions does not seem to have a significant effect on the basis. It is possible that
these have any value only when there is a high likelihood of a corporate event such as a take over.
Tax-related call options seem to make the bonds marginally more expensive relative to other bonds.
Overall, with the exception of the defeasence option, the signs on the coefficients seem consistent
with the hypotheses listed in Appendix A.
6 Conclusion
The existing literature on the yield spread of US corporate bonds argues that the non-default
component of corporate yields may be related to factors associated with liquidity, such as age,
outstanding amount and maturity. However, since liquidity metrics based on transaction prices
and volumes are difficult to compute due to infrequent trading in the corporate bond market, this
conjecture is difficult to confirm at the level of individual bonds. We use a uniquely constructed
data-set from one of the largest corporate bond custodians in the market to evaluate the ease of
access of a bond using a recently developed measure called latent liquidity. We also use transactions
data for the corporate bond market obtained from NASD’s TRACE database to compute a range
of realized liquidity measures for corporate bonds and show that latent liquidity has explanatory
power over and above these measures in explaining the non-default component of yield spreads.
We use the CDS-bond basis, which is the difference between the CDS price of a bond and its par
equivalent credit spread, as a measure of the non-default component.
First, we confirm several relationships documented in the previous literature on the effect
29
of factors like coupon, amount outstanding, age and trading volume on latent liquidity in the
corporate bond market, on a much more current and extensive data-set, and in particular, on the
latent liquidity measure. Second, we show that the average level of the non-default component of
the bond yields - the CDS-bond basis - in our sample, at the aggregate level, is contemporaneously
related to the average latent liquidity: An increase in aggregate average latent liquidity leads to
a decrease in the average CDS-bond basis. Third, at the level of individual bonds, we link latent
liquidity to the yields/prices of the bonds, and find that bonds that are primarily held by funds
that trade actively are more expensive, when adjusted for credit risk, than those that are held by
funds that trade less actively. Additionally, the effect of latent liquidity on the CDS-bond basis
is not captured even by the realized trading volume, in spite of the fact that the latent liquidity
measure is available ex-ante, as opposed to trading volume which is available ex-post.
We have a new result that shows that the liquidity of the CDS contract, as measured both
by the bid-ask spread, and the riskiness of the CDS market, as measured by the CDS market
volatility, have explanatory power for the basis of bonds, over and above bond-specific liquidity
variables. This is evidence that bond market participants account for the liquidity of the CDS
market when they price corporate bonds, due to the ease of hedging their positions. Accordingly,
as the CDS market becomes more and more liquid, we expect the CDS-bond basis to decrease over
time.
We also demonstrate that the CDS price does not fully account for the effect of credit risk on
bond prices - there are several firm level effects related to credit risk that seem to have explanatory
power over the CDS bond basis, even after we account for the differences between bonds that
arise because of liquidity. We relate these variables to difference of beliefs about the firm value
around the time of default, leading to costs of shorting the bonds. We also show that cross-section
variations in the CDS-bond basis of different bonds may arise due to varying levels of protection
due to covenants, listing, and tax status may.
In conclusion, we present and validate a measure of corporate bond liquidity that is available
ex-ante, does not require transaction data, has additional explanatory power, and offers interesting
insights into processes that drive liquidity in the corporate bond markets. In doing so, we generate
30

several new stylized facts on the factors that affect bond yields.
31
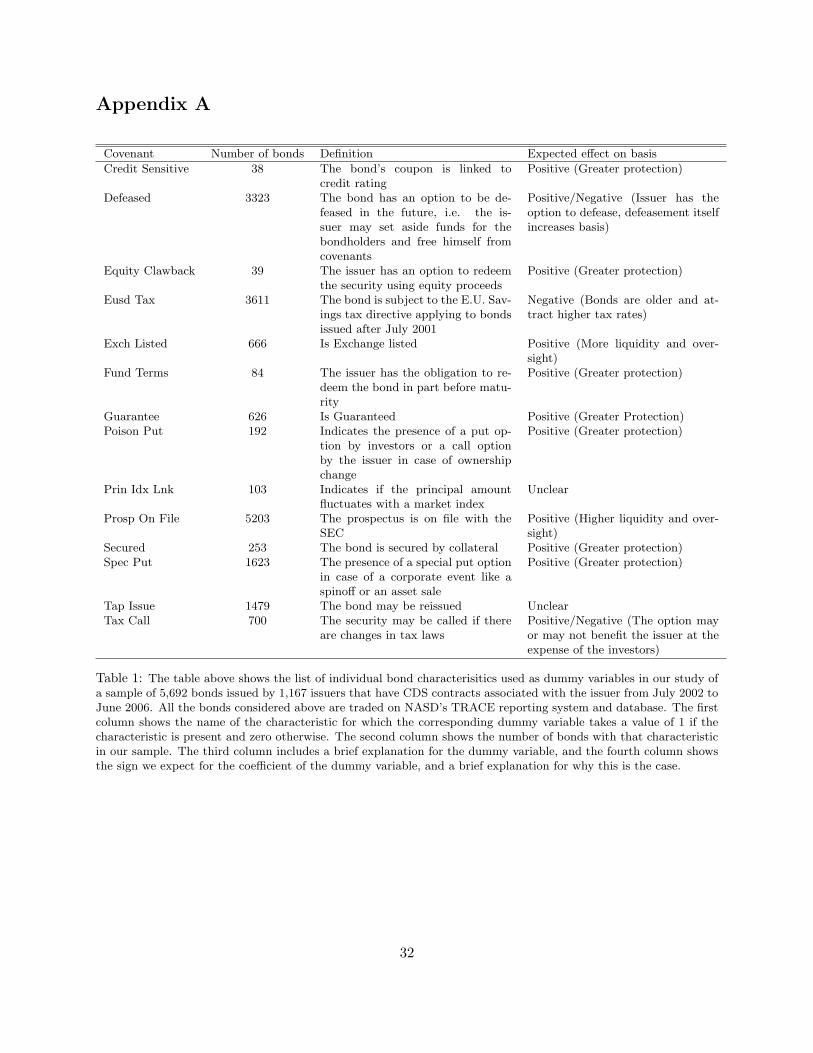
Appendix A
Covenant Number of bonds Definition Expected effect on basis
Credit Sensitive 38 The bond’s coupon is linked tocredit rating
Positive (Greater protection)
Defeased 3323 The bond has an option to be de-feased in the future, i.e. the is-suer may set aside funds for thebondholders and free himself fromcovenants
Positive/Negative (Issuer has theoption to defease, defeasement itselfincreases basis)
Equity Clawback 39 The issuer has an option to redeemthe security using equity proceeds
Positive (Greater protection)
Eusd Tax 3611 The bond is subject to the E.U. Sav-ings tax directive applying to bondsissued after July 2001
Negative (Bonds are older and at-tract higher tax rates)
Exch Listed 666 Is Exchange listed Positive (More liquidity and over-sight)
Fund Terms 84 The issuer has the obligation to re-deem the bond in part before matu-rity
Positive (Greater protection)
Guarantee 626 Is Guaranteed Positive (Greater Protection)Poison Put 192 Indicates the presence of a put op-
tion by investors or a call optionby the issuer in case of ownershipchange
Positive (Greater protection)
Prin Idx Lnk 103 Indicates if the principal amountfluctuates with a market index
Unclear
Prosp On File 5203 The prospectus is on file with theSEC
Positive (Higher liquidity and over-sight)
Secured 253 The bond is secured by collateral Positive (Greater protection)Spec Put 1623 The presence of a special put option
in case of a corporate event like aspinoff or an asset sale
Positive (Greater protection)
Tap Issue 1479 The bond may be reissued UnclearTax Call 700 The security may be called if there
are changes in tax lawsPositive/Negative (The option mayor may not benefit the issuer at theexpense of the investors)
Table 1: The table above shows the list of individual bond characterisitics used as dummy variables in our study ofa sample of 5,692 bonds issued by 1,167 issuers that have CDS contracts associated with the issuer from July 2002 toJune 2006. All the bonds considered above are traded on NASD’s TRACE reporting system and database. The firstcolumn shows the name of the characteristic for which the corresponding dummy variable takes a value of 1 if thecharacteristic is present and zero otherwise. The second column shows the number of bonds with that characteristicin our sample. The third column includes a brief explanation for the dummy variable, and the fourth column showsthe sign we expect for the coefficient of the dummy variable, and a brief explanation for why this is the case.
32
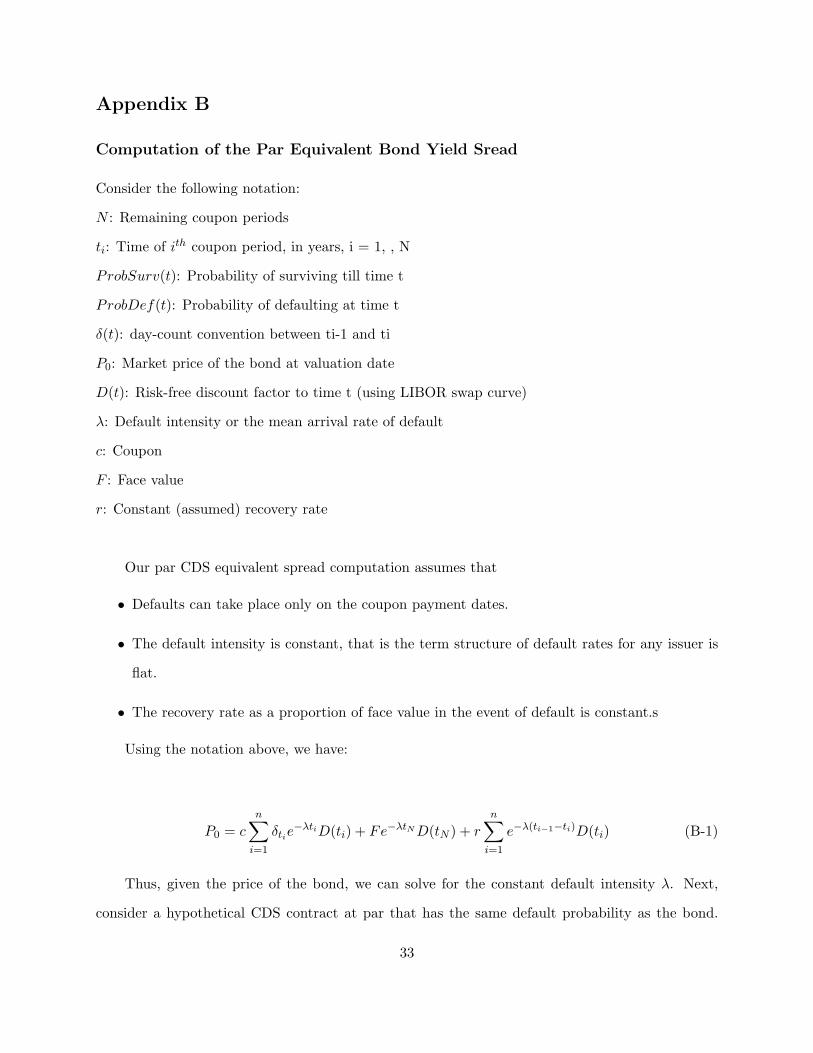
Appendix B
Computation of the Par Equivalent Bond Yield Sread
Consider the following notation:
N : Remaining coupon periods
ti: Time of ith coupon period, in years, i = 1, , N
ProbSurv(t): Probability of surviving till time t
ProbDef(t): Probability of defaulting at time t
δ(t): day-count convention between ti-1 and ti
P0: Market price of the bond at valuation date
D(t): Risk-free discount factor to time t (using LIBOR swap curve)
λ: Default intensity or the mean arrival rate of default
c: Coupon
F : Face value
r: Constant (assumed) recovery rate
Our par CDS equivalent spread computation assumes that
• Defaults can take place only on the coupon payment dates.
• The default intensity is constant, that is the term structure of default rates for any issuer is
flat.
• The recovery rate as a proportion of face value in the event of default is constant.s
Using the notation above, we have:
P0 = c
n∑i=1
δtie−λtiD(ti) + Fe−λtND(tN ) + r
n∑i=1
e−λ(ti−1−ti)D(ti) (B-1)
Thus, given the price of the bond, we can solve for the constant default intensity λ. Next,
consider a hypothetical CDS contract at par that has the same default probability as the bond.
33

The following holds at initiation:
PV (feeleg) = PV (contingentleg) (B-2)
where the left hand side is the present value of the expected fees to be earned on the hypothetical
CDS contract, and the right hand side is the present value of the expected payment to be made in
case default occurs.
Thus, the bond is equivalent to a hypothetical par CDS contract with the following spread.
ParCDSequivalentspread =(1− rr)
∑ni=1 e
−λ(ti−1−ti)D(ti)∑ni=1 δtie
−λtiD(ti) +∑n
i=1δti2 e−λ(ti−1−ti)D(ti)
(B-3)
The basis is simply computed as the difference between the above spread and the spread on
an actual CDS contract trading in the market.
34
References
Acharya, V., S. Bharath, and A. Srinivasan, 2007, Does industry wide distress affect defaulted
firms?, Journal of Financial Economics, forthcoming.
Acharya, V., and L. Pedersen, 2005, Asset pricing with liquidity risk, Journal of Financial Eco-
nomics 77(2), 375 – 410.
Admati, A., and P. Pfleiderer, 1988, A theory of intraday patterns: Volume and price variability,
Review of Financial Studies 3, 40.
, 1989, Divide and conquer: A theory of intraday and day-of-the-week mean effects, Review
of Financial Studies 2, 189–224.
Alexander, G., A. Edwards, and M. Ferri, 2000, The determinants of the trading volume of high
yield corporate bonds, Journal of Financial Markets 3, 177–204.
Amihud, Y., 2002, Illiquidity and stock returns: cross-section and time series effects, Journal of
Financial Markets 5, 31–56.
, and H. Mendelson, 1980, Dealership market: Market making with inventory, Journal of
Financial Economics 5, 31–53.
Amihud, Y, and H Mendelson, 1986, Asset pricing and the bid ask spread, Journal of Financial
Economics 17, 223–249.
, 1991, Liquidity, maturity, and the yields on United States Treasury securities, Journal of
Finance 46, 1411–1425.
Amihud, Y., H. Mendelson, and L. Pedersen, 2006, Liquidity and asset prices, Foundations and
Trends in Finance 1, 269–364.
Assagai, S., and M. Gentler, 1991, Asset returns, transactions cost and uninsured individual risk:
A Stage II exercise, Journal of Monetary Economics 27, 309–331.
Bagehot, W., 1971, The only game in town, Financial Analysts Journal 27, 12–14.
35

Baluchi, P., S. Dab, and S. Forest, 2002, The central tendency: A second factor in bond yields,
Review of Economics and Statistics 80, 60–72.
Bessembinder, H., W.F. Maxwell, and K. Venkataraman, 2005, Optimal market transparency : Ev-
idence from the initiation of trade reporting in corporate bonds, Journal of Financial Economics
(forthcoming).
Bias, B., 1998, Price formation and equilibrium liquidity in fragmented and centralized markets,
Journal of Finance 48, 157–185.
Blanco, R., S. Brennan, and I. Marsh, 2005, An empirical analysis of the dynamic relation between
investment-grade bonds and credit default swaps, Journal of Finance 60, 2255–2281.
Brace, A., and M. Musiela, 1997, The market model of interest rate dynamics, Mathematical
Finance 7, 127–147.
Chakravarty, S., and A. Sarkar, 1999, Liquidity in US fixed income markets: A comparison of
the bid-ask spread in corporate, government, and municipal bond markets, Staff Report of the
Federal Reserve Bank of New York 73.
Chen, L., D. Lesmond, and J. Wei, 2007, Corporate yield spreads and bond liquidity, Journal of
Finance (forthcoming).
Copeland, T., and D. Galai, 1983, Information effects and the bid-ask spread, Journal of Finance
38, 1457–1469.
Datar, V., N. Naik, and R. Radcliffe, 1998, Liquidity and stock returns: An alternative test, Journal
of Financial Markets 1, 203–219.
De Jong, F., and J. Driessen, 2006, Liquidity risk premia in corporate bonds, Working Paper,
University of Amsterdam.
Demsetz, H., 1968, The cost of transacting, Quarterly Journal of Economics 80.
Downing, C., S. Underwood, and Y. Xing, 2006, Is liquidity priced in corporate bonds?, Working
Paper, Rice Univerity.
36

Duffie, D., 1996, Special repo rates, Journal of Finance 51, 493–526.
, 1999, Credit swap valuation, Financial Analysts Journal 55, 73 87.
, M. Garleanu, and L. Pedersen, 2002a, Securities lending, pricing and shorting, Journal of
Financial Economics 66, 307–339.
Duffie, D., N. Garleanu, and L.H. Pedersen, 2002b, Securities lending, pricing and shorting, Journal
of Financial Economics 66, 307–339.
Easley, D., and M. O’Hara, 1987, Price, trade size, and information in securities markets, Journal
of Financial Economics 19, 69–90.
, 2004, Information and the cost of capital, Journal of Finance 59, 1153 – 1183.
Easley, D.and Hvidkjaer, S., and M. O’Hara, 2002, Is information risk a determinant of asset
returns, Journal of Finance 57, 2185–2222.
Edwards, A, Lawrence Harris, and Michael Piwowar, 2007, Corporate bond market transparency
and transaction costs, Journal of Finance (Forthcoming).
Elton, E., and C.T. Green, 1998, Tax and liquidity effects in pricing government bonds, The Journal
of Finance 53, 1533.
Elton, E., M. Gruber, D. Agrawal, and C. Mann, 2001, Explaining the rate spread on corporate
bonds, The Journal of Finance 56, 247–277.
Eom, Y.H., J. Helwege, and J. Uno, 2003, Structural models of corporate bond pricing : An
empirical analysis, Review of Financial Studies 17, 499–544.
Eom, Y.H., M.G. Subrahmanyam, and J. Uno, 1998, Coupon effects and the pricing of Japanese
government bonds- an empirical analysis, Journal of Fixed Income 8, 69 – 86.
Fama, E.F., and J. Macbeth, 1973, Risk, return, and equilibrium: Empirical tests, Journal of
Political Economy 81, 601–636.
37

Feldhutter, P., and D. Lando, 2005, Decomposing swap spreads, Working Paper, Copenhagen
Business School.
Fisher, L., 1959, Determinants of risk premiums on corporate bonds, Journal of Political Economy
xx, 217–317.
Foster, F., and S. Viswanathan, 1990, A theory of intraday variations in volume, variance, and
trading costs in securities markets, Review of Financial Studies 3, 593–624.
Garman, M., 1976, Market microstructure, Journal of Financial Economics 3, 257–275.
Geske, R., 1977, The valuation of corporate liabilities as compound options, The Journal of Finan-
cial and Quantitative Analysis pp. 541–552.
Glosten, L., and P. Milgrom, 1985, Bid, ask, and transaction prices in a specialist market with
heterogeneously informed traders, Journal of Financial Economics 14, 71–100.
Goldstein, M.A., E.S. Hotchkiss, and E.R. Sirri, 2005, Transparency and liquidity: A controlled
experiment on corporate bonds, Working Paper, Babson College and Boston College.
Greene, William H., 2000, Econometric Analysis (Prentice Hall) 6 edn.
Grinblatt, M., 2001, An analytic solution for interest rate swap spreads, International Review of
Finance 2, 541–552.
Grossman, S., and M. Miller, 1988, Liquidity and market structure, Journal of Finance 43, 617–633.
Grossman, S., and J. Stiglitz, 1980, On the impossibility of informationally efficient markets, Amer-
ican Economic Review 70, 393–408.
Hasbrouck, J., and D. Seppi, 2001, Common factors in prices, order flows, and liquidity, Journal
of Financial Economics 59, 383–411.
Ho, T., and H. Stoll, 1981, Optimal dealer pricing under transactions and return uncertainty,
Journal of Financial Economics 9, 47–73.
38
Hong, G., and A Warga, 2000, An empirical study of bond market transactions, Financial Analysts
Journal 56, 32–46.
Hotchkiss, E., and T. Ronen, 1999, The informational efficiency of the corporate bond market: An
intraday analysis, Review of Financial Studies 15, 1325–1354.
Hotchkiss, E., A. Warga, and G. Jostova, 2002, Determinants of corporate bond trading: A compre-
hensive analysis, Working Paper, University of Houston, Boston College and George Washington
University.
Houweling, P., A. Mentink, and T. Vorst, 2005, Comparing possible proxies of corporate bond
liquidity, Journal of Banking and Finance 29, 1331–1358.
Huang, J., and M. Huang, 2003, How much of the corporate yield spread is due to credit risk?, 14th
Annual Conference on Financial Economics and Accounting (FEA); Texas Finance Festival.
Huang, M., 2003, Liquidity shocks and equilibrium risk premia, Journal of Economic Theory 109,
104–129.
Huberman, G., and D. Halka, 2001, Systematic liquidity, Journal of Financial Research 24, 161–
178.
Kyle, A., 1985, Continuous auctions and insider trading, Econometrica 53, 1315–1335.
Longstaff, Francis, 2004, The flight-to-liquidity premium in u.s. treasury bond prices, The Journal
of Business 77, 511–526.
Longstaff, F., S. Mithal, and E. Neis, 2005, Corporate yield spreads: Default risk or liquidity? New
evidence from the credit default swap market, Journal of Finance LX, 2213–2253.
Madhavan, A., and S. Smidt, 1993, An analysis of daily changes in specialist inventories and
quotations, Journal of Finance 48, 189–210.
Mahanti, S., A. Nashikkar, M.G. Subrahmanyam, G. Chacko, and G. Mallik, 2007, Latent liquid-
ity: A new measure of liquidity with an application to corporate bonds, Journal of Financial
Economics, forthcoming.
39
Merton, R., 1974, On the pricing of corporate debt: The risk structure of interest rates, Journal of
Finance 29(2), 449–270.
Nashikkar, A., and L. Pedersen, 2006, Corporate bond specialness, Working paper, Stern School
of Business.
O’Hara, M., and G. Oldfeld, 1986, The microeconomics of market making, Journal of Financial
and Quantitative Analysis 21, 361–376.
Pastor, L., and R. Stambaugh, 2003, Liquidity risk and expected stock returns, Journal of Political
Economy 111(3), 642–685.
Sarig, O., and A. Warga, 1989, Bond price data and bond market liquidity, Journal of Financial
and Quantitative Analysis 24, 367–378.
Schultz, P., 2001, Corporate bond trading costs: A peak behind the curtain, Journal of Finance
56, 677–698.
Seppi, D., 1990, Equilibrium block trading and asymmetric information, Journal of Finance 45,
73–94.
Staiger, D., and J. Stock, 1997, Instrumental variables regression with weak instruments, Econo-
metrica 65, 557–586.
Stoll, H., 1978, The supply of dealer services in securities markets, Journal of Finance 33, 1133–
1151.
Vayanos, D., 1998, Transaction costs and asset prices: A dynamic equilibrium model, Review of
Financial Studies 11, 1–58.
, and JL. Vila, 1999, Equilibrium interest rates and liquidity premium with transaction
costs, Economic Theory 13, 509–539.
Vayanos, D., and T. Wang, 2006, Search and endogenous concentration of liquidity in asset markets,
Journal of Economic Theory (Forthcoming).
40

Warga, A., 1992, Bond returns, liquidity, and missing data, Journal of Financial and Quantitative
Analysis 27, 605–617.
41

Figure 1: Average latent liquidity and the CDS-bond basis over time: This plot shows the averagelatent liquidity of the sample of bonds and the associated CDS-bond basis relative to swap rates over theperiod from July 2002 to July 2006. The sample consists of around 5,792 bonds issued by 1,217 issuers. Notall bonds are traded in every quarter. Latent liquidity is a liquidity measure that weights the turnover offunds holding the bond by their fractional holdings of the bond. The basis is computed as the differencebetween the CDS price and the par-equivalent CDS spread of the corresponding bond. CDS prices are froma combination of data obtained from GFI Group Inc (prior to October 2004) and CMA Datavision (afterOctober 2004). Bond prices and trade counts are obtained as a volume-weighted average from NASD’sTRACE database.
42

Figure 2: Trade count and the CDS-bond basis over time: This plot shows the average number ofquarterly trades of the sample of bonds and the associated non-default component of their yields relativeto to swap rates over the period from July 2002 to June 2006. The sample consists of around 5,792 bondsissued by 1,167 issuers. Not all bonds are traded in every quarter. Latent liquidity is a liquidity measurethat weights the turnover of funds holding the bond by their fractional holdings of the bond. The basis iscomputed as the difference between the CDS price and the par-equivalent CDS spread of the correspondingbond. CDS prices are from a combination of data obtained from GFI Group Inc (prior to October 2004)and CMA Datavision (after October 2004). Bond prices and trade counts are obtained as a volume weightedaverage from NASD’s TRACE database.
43
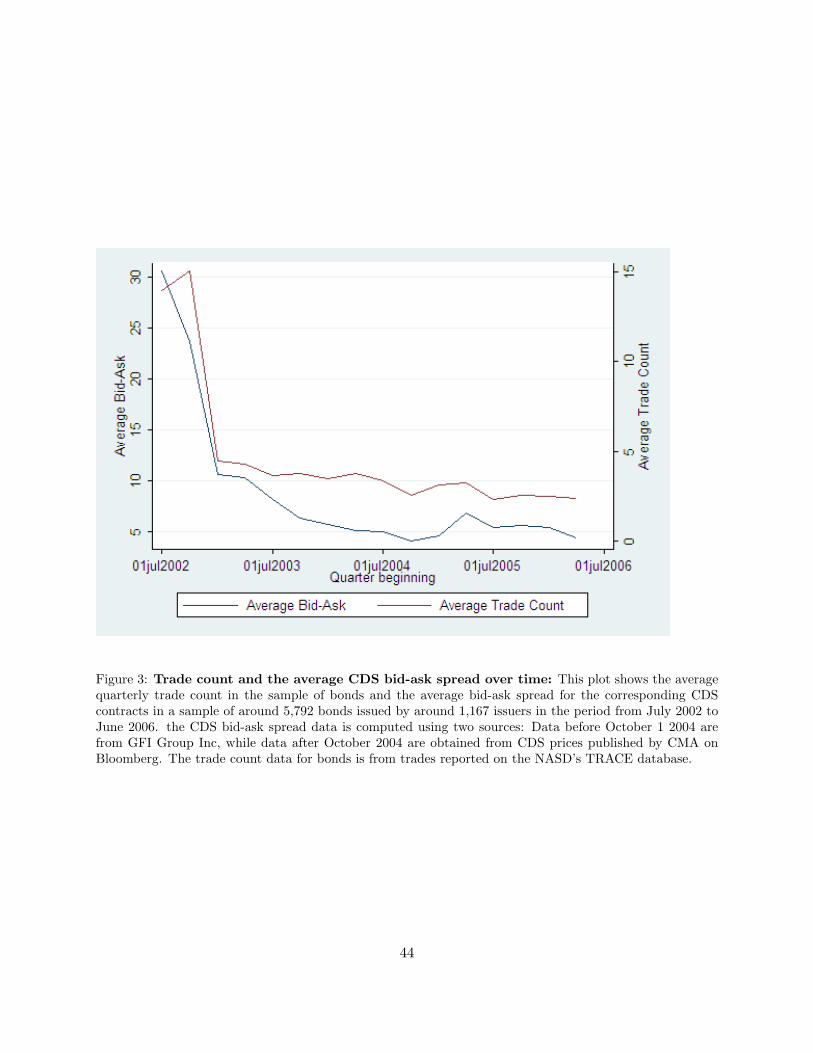
Figure 3: Trade count and the average CDS bid-ask spread over time: This plot shows the averagequarterly trade count in the sample of bonds and the average bid-ask spread for the corresponding CDScontracts in a sample of around 5,792 bonds issued by around 1,167 issuers in the period from July 2002 toJune 2006. the CDS bid-ask spread data is computed using two sources: Data before October 1 2004 arefrom GFI Group Inc, while data after October 2004 are obtained from CDS prices published by CMA onBloomberg. The trade count data for bonds is from trades reported on the NASD’s TRACE database.
44
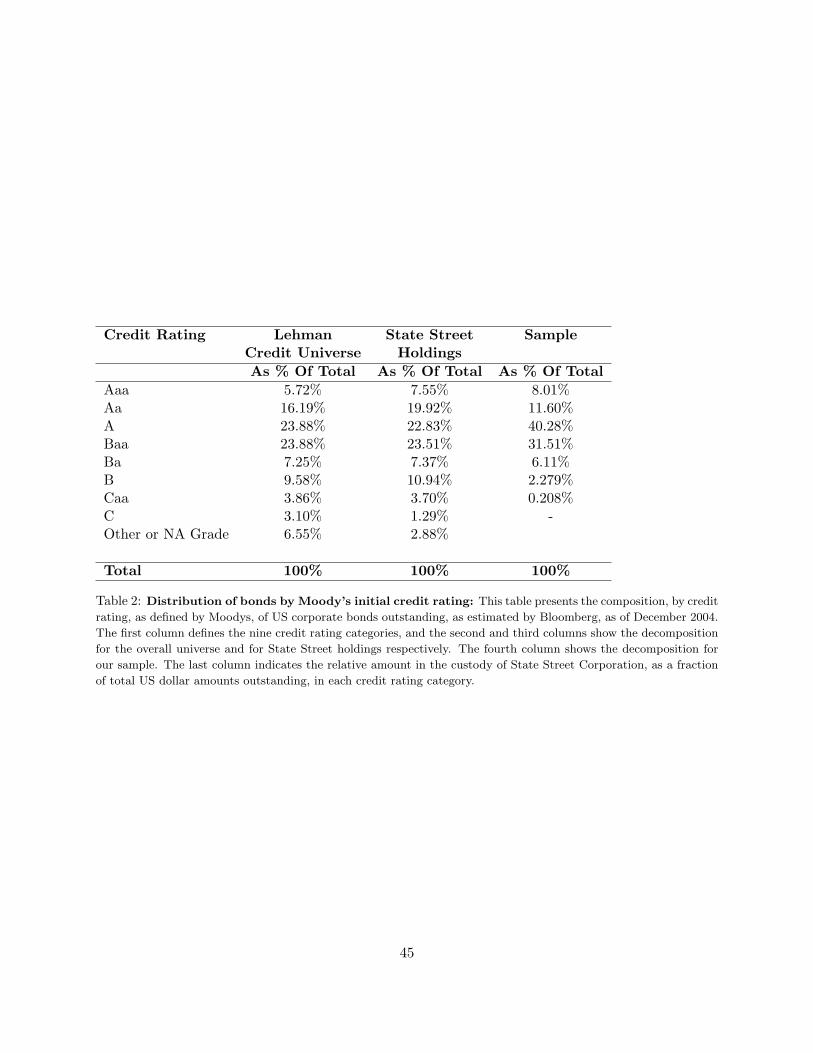
Credit Rating Lehman State Street SampleCredit Universe HoldingsAs % Of Total As % Of Total As % Of Total
Aaa 5.72% 7.55% 8.01%Aa 16.19% 19.92% 11.60%A 23.88% 22.83% 40.28%Baa 23.88% 23.51% 31.51%Ba 7.25% 7.37% 6.11%B 9.58% 10.94% 2.279%Caa 3.86% 3.70% 0.208%C 3.10% 1.29% -Other or NA Grade 6.55% 2.88%
Total 100% 100% 100%
Table 2: Distribution of bonds by Moody’s initial credit rating: This table presents the composition, by credit
rating, as defined by Moodys, of US corporate bonds outstanding, as estimated by Bloomberg, as of December 2004.
The first column defines the nine credit rating categories, and the second and third columns show the decomposition
for the overall universe and for State Street holdings respectively. The fourth column shows the decomposition for
our sample. The last column indicates the relative amount in the custody of State Street Corporation, as a fraction
of total US dollar amounts outstanding, in each credit rating category.
45
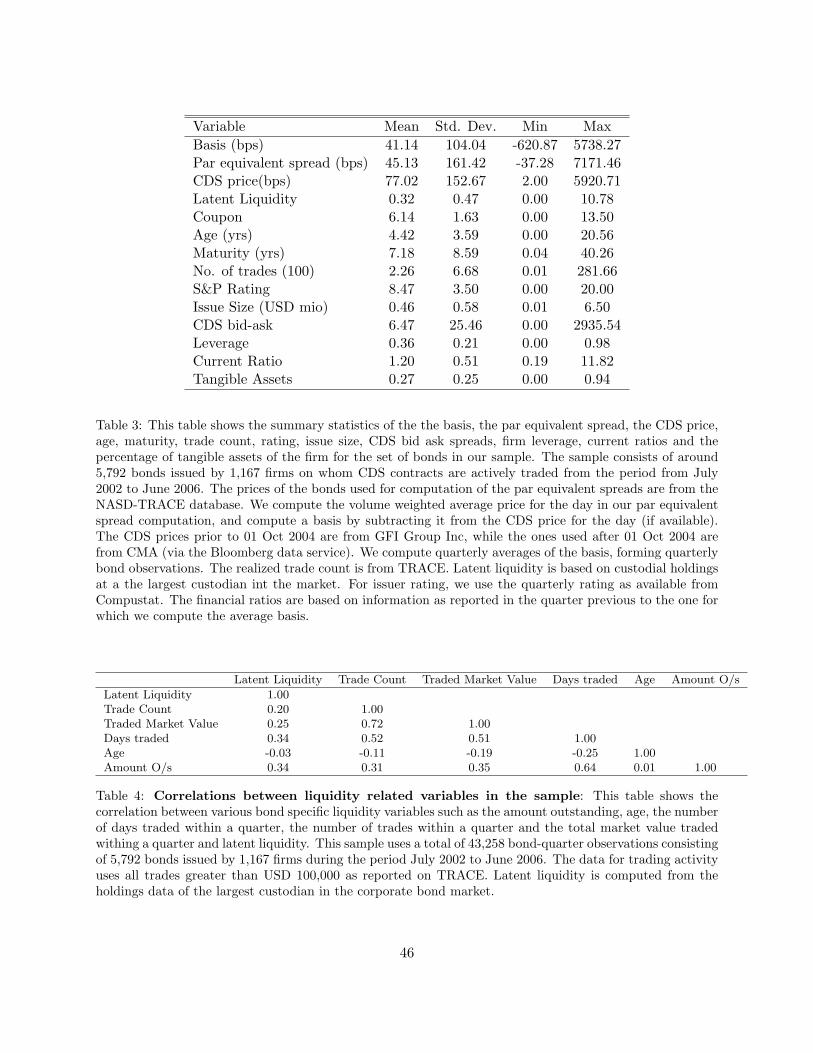
Variable Mean Std. Dev. Min MaxBasis (bps) 41.14 104.04 -620.87 5738.27Par equivalent spread (bps) 45.13 161.42 -37.28 7171.46CDS price(bps) 77.02 152.67 2.00 5920.71Latent Liquidity 0.32 0.47 0.00 10.78Coupon 6.14 1.63 0.00 13.50Age (yrs) 4.42 3.59 0.00 20.56Maturity (yrs) 7.18 8.59 0.04 40.26No. of trades (100) 2.26 6.68 0.01 281.66S&P Rating 8.47 3.50 0.00 20.00Issue Size (USD mio) 0.46 0.58 0.01 6.50CDS bid-ask 6.47 25.46 0.00 2935.54Leverage 0.36 0.21 0.00 0.98Current Ratio 1.20 0.51 0.19 11.82Tangible Assets 0.27 0.25 0.00 0.94
Table 3: This table shows the summary statistics of the the basis, the par equivalent spread, the CDS price,age, maturity, trade count, rating, issue size, CDS bid ask spreads, firm leverage, current ratios and thepercentage of tangible assets of the firm for the set of bonds in our sample. The sample consists of around5,792 bonds issued by 1,167 firms on whom CDS contracts are actively traded from the period from July2002 to June 2006. The prices of the bonds used for computation of the par equivalent spreads are from theNASD-TRACE database. We compute the volume weighted average price for the day in our par equivalentspread computation, and compute a basis by subtracting it from the CDS price for the day (if available).The CDS prices prior to 01 Oct 2004 are from GFI Group Inc, while the ones used after 01 Oct 2004 arefrom CMA (via the Bloomberg data service). We compute quarterly averages of the basis, forming quarterlybond observations. The realized trade count is from TRACE. Latent liquidity is based on custodial holdingsat a the largest custodian int the market. For issuer rating, we use the quarterly rating as available fromCompustat. The financial ratios are based on information as reported in the quarter previous to the one forwhich we compute the average basis.
Latent Liquidity Trade Count Traded Market Value Days traded Age Amount O/s
Latent Liquidity 1.00Trade Count 0.20 1.00Traded Market Value 0.25 0.72 1.00Days traded 0.34 0.52 0.51 1.00Age -0.03 -0.11 -0.19 -0.25 1.00Amount O/s 0.34 0.31 0.35 0.64 0.01 1.00
Table 4: Correlations between liquidity related variables in the sample: This table shows thecorrelation between various bond specific liquidity variables such as the amount outstanding, age, the numberof days traded within a quarter, the number of trades within a quarter and the total market value tradedwithing a quarter and latent liquidity. This sample uses a total of 43,258 bond-quarter observations consistingof 5,792 bonds issued by 1,167 firms during the period July 2002 to June 2006. The data for trading activityuses all trades greater than USD 100,000 as reported on TRACE. Latent liquidity is computed from theholdings data of the largest custodian in the corporate bond market.
46
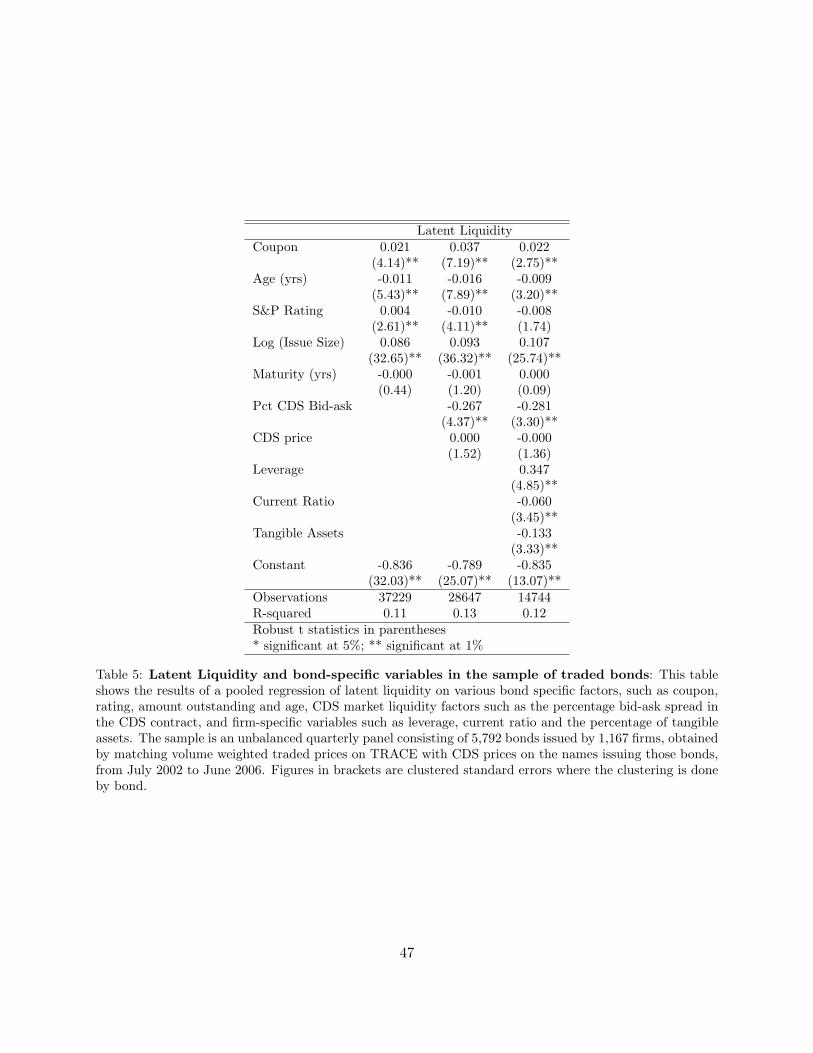
Latent LiquidityCoupon 0.021 0.037 0.022
(4.14)** (7.19)** (2.75)**Age (yrs) -0.011 -0.016 -0.009
(5.43)** (7.89)** (3.20)**S&P Rating 0.004 -0.010 -0.008
(2.61)** (4.11)** (1.74)Log (Issue Size) 0.086 0.093 0.107
(32.65)** (36.32)** (25.74)**Maturity (yrs) -0.000 -0.001 0.000
(0.44) (1.20) (0.09)Pct CDS Bid-ask -0.267 -0.281
(4.37)** (3.30)**CDS price 0.000 -0.000
(1.52) (1.36)Leverage 0.347
(4.85)**Current Ratio -0.060
(3.45)**Tangible Assets -0.133
(3.33)**Constant -0.836 -0.789 -0.835
(32.03)** (25.07)** (13.07)**Observations 37229 28647 14744R-squared 0.11 0.13 0.12Robust t statistics in parentheses* significant at 5%; ** significant at 1%
Table 5: Latent Liquidity and bond-specific variables in the sample of traded bonds: This tableshows the results of a pooled regression of latent liquidity on various bond specific factors, such as coupon,rating, amount outstanding and age, CDS market liquidity factors such as the percentage bid-ask spread inthe CDS contract, and firm-specific variables such as leverage, current ratio and the percentage of tangibleassets. The sample is an unbalanced quarterly panel consisting of 5,792 bonds issued by 1,167 firms, obtainedby matching volume weighted traded prices on TRACE with CDS prices on the names issuing those bonds,from July 2002 to June 2006. Figures in brackets are clustered standard errors where the clustering is doneby bond.
47
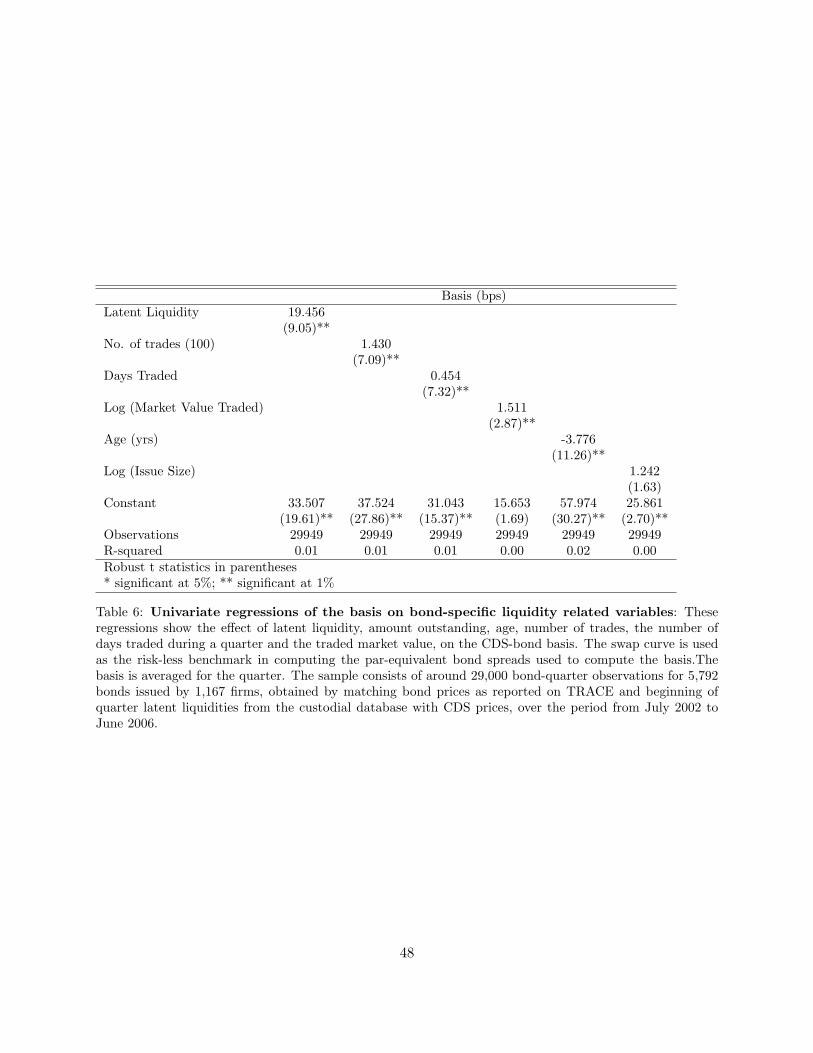
Basis (bps)Latent Liquidity 19.456
(9.05)**No. of trades (100) 1.430
(7.09)**Days Traded 0.454
(7.32)**Log (Market Value Traded) 1.511
(2.87)**Age (yrs) -3.776
(11.26)**Log (Issue Size) 1.242
(1.63)Constant 33.507 37.524 31.043 15.653 57.974 25.861
(19.61)** (27.86)** (15.37)** (1.69) (30.27)** (2.70)**Observations 29949 29949 29949 29949 29949 29949R-squared 0.01 0.01 0.01 0.00 0.02 0.00Robust t statistics in parentheses* significant at 5%; ** significant at 1%
Table 6: Univariate regressions of the basis on bond-specific liquidity related variables: Theseregressions show the effect of latent liquidity, amount outstanding, age, number of trades, the number ofdays traded during a quarter and the traded market value, on the CDS-bond basis. The swap curve is usedas the risk-less benchmark in computing the par-equivalent bond spreads used to compute the basis.Thebasis is averaged for the quarter. The sample consists of around 29,000 bond-quarter observations for 5,792bonds issued by 1,167 firms, obtained by matching bond prices as reported on TRACE and beginning ofquarter latent liquidities from the custodial database with CDS prices, over the period from July 2002 toJune 2006.
48

Dependent variable : Average CDS-Bond basisCoupon -15.043 -17.112 -8.808 -8.624
(9.66)** (11.62)** (5.81)** (5.14)**Latent Liquidity 20.985 17.929 10.242 9.852
(11.15)** (10.70)** (4.62)** (4.91)**No. of trades (100) 1.037 0.646 -0.941 -0.815
(7.44)** (5.53)** (3.19)** (2.75)**Maturity (yrs) -2.582 -2.481 -2.395 -2.394
(13.44)** (13.56)** (12.46)** (12.54)**Age (yrs) 0.903 1.323 -0.152 -2.554
(2.01)* (3.13)** (0.34) (4.76)**Log (Issue Size) 2.662 3.530 10.279 11.300
(3.86)** (5.72)** (11.45)** (6.96)**S&P Rating 8.037 3.737 -0.616 -0.170
(11.38)** (7.89)** (0.72) (0.21)CDS Vol 0.054 -0.011 -0.019
(0.99) (0.22) (0.38)CDS bid-ask 2.209 2.110 2.085
(10.49)** (11.43)** (11.87)**CDS percent bid-ask -112.124 24.765 18.167
(9.54)** (1.75) (1.32)Leverage 68.699 55.460
(6.63)** (5.59)**Tangible Assets -9.749 -16.628
(2.49)* (3.30)**Current Ratio 0.921 1.927
(0.56) (1.16)Constant 32.711 73.168 -51.015 -42.200
(3.17)** (7.64)** (4.33)** (1.88)Observations 28631 28364 14568 14568R-squared 0.15 0.44 0.60 0.61Robust t statistics in parentheses* significant at 5%; ** significant at 1%
Table 7: Pooled regressions of the average basis: This table shows the coefficients on various bondcharacteristic dummy variables including covenants for pooled regressions on around 29,000 bond-quarterobservations for 5,792 bonds issued by 1,167 firms for the period from July 2002 to June 2006. The dependentvariable is the average quarterly CDS-bond basis computed using par equivalent corporate bond spreadscalculated using TRACE data and CDS prices from GFI/CMA. The basis is the difference between theCDS spread and the par equivalent spread of the corporate bond. Latent liquidity information is from thecustodial database, while trade count for corporate bonds is computed using TRACE data. The rating refersto the Compustat numerical code used to represent quarterly S&P ratings on domestic debt obtained fromCompustat. The bond covenants are taken from Bloomberg’s list of bond covenants. Firm level variablessuch as leverage and tangible assets are calculated using the Compustat quarterly data for the previousquarter. CDS market liquidity and standard deviations are computed using GFI/CMA CDS prices.
49
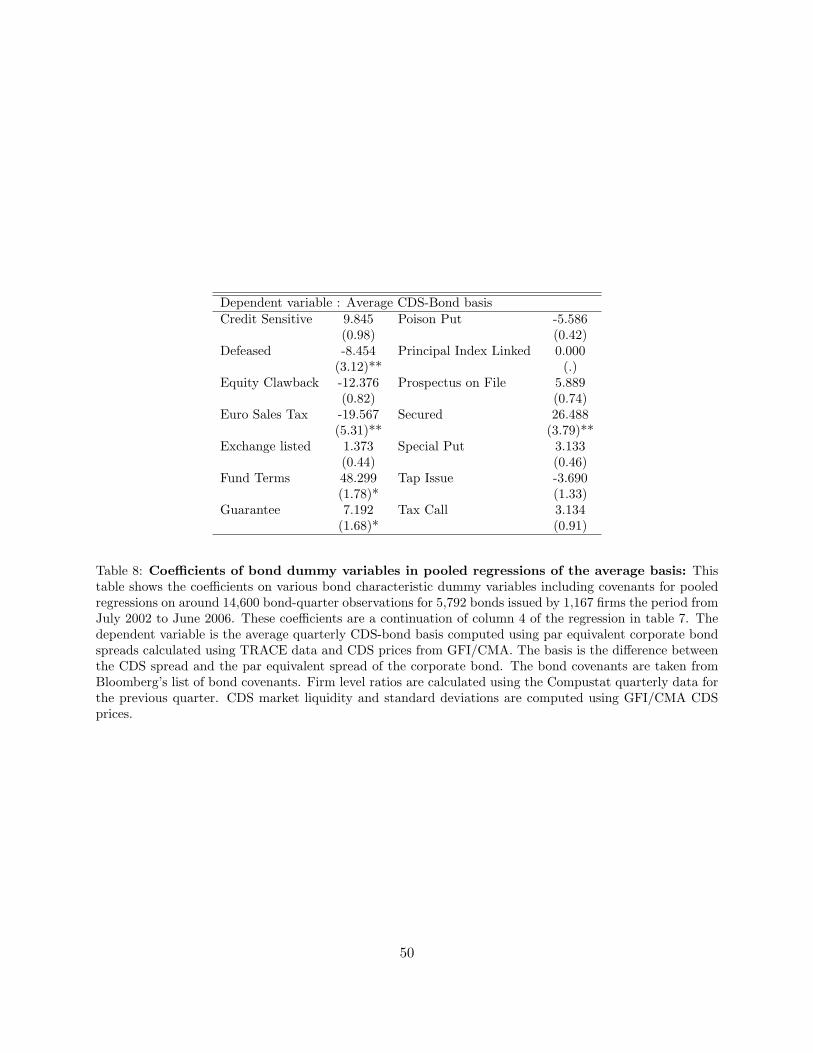
Dependent variable : Average CDS-Bond basisCredit Sensitive 9.845 Poison Put -5.586
(0.98) (0.42)Defeased -8.454 Principal Index Linked 0.000
(3.12)** (.)Equity Clawback -12.376 Prospectus on File 5.889
(0.82) (0.74)Euro Sales Tax -19.567 Secured 26.488
(5.31)** (3.79)**Exchange listed 1.373 Special Put 3.133
(0.44) (0.46)Fund Terms 48.299 Tap Issue -3.690
(1.78)* (1.33)Guarantee 7.192 Tax Call 3.134
(1.68)* (0.91)
Table 8: Coefficients of bond dummy variables in pooled regressions of the average basis: Thistable shows the coefficients on various bond characteristic dummy variables including covenants for pooledregressions on around 14,600 bond-quarter observations for 5,792 bonds issued by 1,167 firms the period fromJuly 2002 to June 2006. These coefficients are a continuation of column 4 of the regression in table 7. Thedependent variable is the average quarterly CDS-bond basis computed using par equivalent corporate bondspreads calculated using TRACE data and CDS prices from GFI/CMA. The basis is the difference betweenthe CDS spread and the par equivalent spread of the corporate bond. The bond covenants are taken fromBloomberg’s list of bond covenants. Firm level ratios are calculated using the Compustat quarterly data forthe previous quarter. CDS market liquidity and standard deviations are computed using GFI/CMA CDSprices.
50
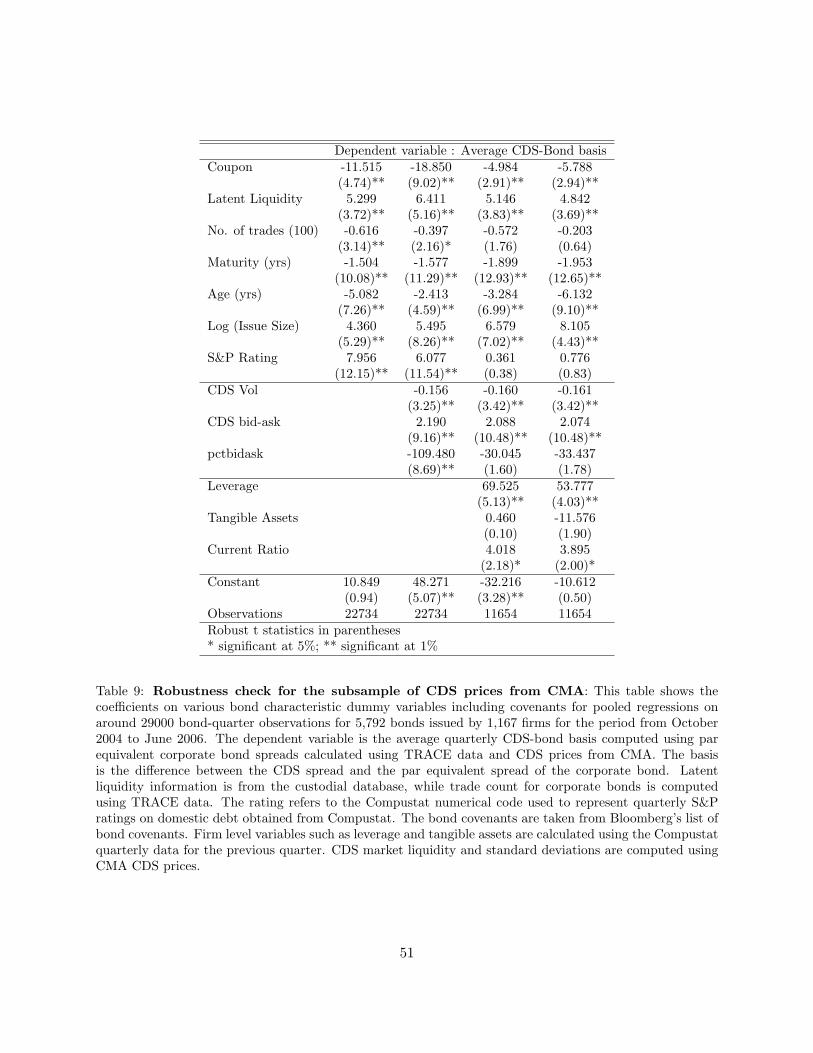
Dependent variable : Average CDS-Bond basisCoupon -11.515 -18.850 -4.984 -5.788
(4.74)** (9.02)** (2.91)** (2.94)**Latent Liquidity 5.299 6.411 5.146 4.842
(3.72)** (5.16)** (3.83)** (3.69)**No. of trades (100) -0.616 -0.397 -0.572 -0.203
(3.14)** (2.16)* (1.76) (0.64)Maturity (yrs) -1.504 -1.577 -1.899 -1.953
(10.08)** (11.29)** (12.93)** (12.65)**Age (yrs) -5.082 -2.413 -3.284 -6.132
(7.26)** (4.59)** (6.99)** (9.10)**Log (Issue Size) 4.360 5.495 6.579 8.105
(5.29)** (8.26)** (7.02)** (4.43)**S&P Rating 7.956 6.077 0.361 0.776
(12.15)** (11.54)** (0.38) (0.83)CDS Vol -0.156 -0.160 -0.161
(3.25)** (3.42)** (3.42)**CDS bid-ask 2.190 2.088 2.074
(9.16)** (10.48)** (10.48)**pctbidask -109.480 -30.045 -33.437
(8.69)** (1.60) (1.78)Leverage 69.525 53.777
(5.13)** (4.03)**Tangible Assets 0.460 -11.576
(0.10) (1.90)Current Ratio 4.018 3.895
(2.18)* (2.00)*Constant 10.849 48.271 -32.216 -10.612
(0.94) (5.07)** (3.28)** (0.50)Observations 22734 22734 11654 11654Robust t statistics in parentheses* significant at 5%; ** significant at 1%
Table 9: Robustness check for the subsample of CDS prices from CMA: This table shows thecoefficients on various bond characteristic dummy variables including covenants for pooled regressions onaround 29000 bond-quarter observations for 5,792 bonds issued by 1,167 firms for the period from October2004 to June 2006. The dependent variable is the average quarterly CDS-bond basis computed using parequivalent corporate bond spreads calculated using TRACE data and CDS prices from CMA. The basisis the difference between the CDS spread and the par equivalent spread of the corporate bond. Latentliquidity information is from the custodial database, while trade count for corporate bonds is computedusing TRACE data. The rating refers to the Compustat numerical code used to represent quarterly S&Pratings on domestic debt obtained from Compustat. The bond covenants are taken from Bloomberg’s list ofbond covenants. Firm level variables such as leverage and tangible assets are calculated using the Compustatquarterly data for the previous quarter. CDS market liquidity and standard deviations are computed usingCMA CDS prices.
51

Dependent Variable: Average CDS Bond basisCredit Sensitive -3.454 Guarantee 7.551
(0.17) (1.17)Defeased -12.628 Poison Put 2.919
(3.72)** (0.20)Equity Clawback -23.490 Prospectus on File 9.256
(1.52) (1.05)Euro Sales Tax -28.651 Secured 21.036
(5.01)** (1.95)Exchange Listed -1.901 Special Put 0.835
(0.47) (0.11)Fund Terms 64.679 Tap Issue -5.143
(2.28)* (1.42)Tax Call -3.204
(0.60)
Table 10: Coefficients on bond dummy variables in subsample consisting exclusively of CMAprices: This table shows the coefficients on various bond characteristic dummy variables including covenantsfor pooled regressions on around 14,600 bond-quarter observations for 5,792 bonds issued by 1,167 firms forthe period from July 2002 to June 2006. These coefficients are a continuation of column 4 of the regressionin table 7. The dependent variable is the average quarterly CDS-bond basis computed using par equivalentcorporate bond spreads calculated using TRACE data and CDS prices from GFI/CMA. The basis is thedifference between the CDS spread and the par equivalent spread of the corporate bond. The bond covenantsare taken from Bloomberg’s list of bond covenants. Firm level ratios are calculated using the Compustatquarterly data for the previous quarter. CDS market liquidity and standard deviations are computed usingGFI/CMA CDS prices.
52