latency outliers root cause analysis in the field by combining
TRANSCRIPT

Latency Outliers Root Cause Analysisin the Field by Combining
Aggregation and Tracing Tools
LinuxCon North America 2016
Presenters
● Mathieu Desnoyers– CEO at EfficiOS
– LTTng, Linux, Userspace RCU, Babeltrace maintainer.
● Julien Desfossez– Software Developer at EfficiOS
– Latency Tracker, LTTng-Analyses, LTTngTop maintainer.
3
Content
● Trace buffering vs in-place aggregation● Automate problem analysis by combining aggregation and post-
processing tools● Periodic use-case demo
– Jack audio server
● Aperiodic use-cases demos– Memcached
● Benchmarks● Future Work

4
Trace Buffering vs In-Place Aggregation
● Trace buffering:– Store events into a buffer,
– Analysis performed at post-processing,
– Multiple analyses can be performed on the same recorded trace,
– E.g. Ftrace, Perf, LTTng.
● In-place aggregation:– Run-time analysis directly using event input,
– Aggregation performed in the traced execution context,
– E.g. eBPF, DTrace, SystemTAP.

5
Trace Buffering vs In-Place Aggregation
● Often presented as competing tracing solutions,● In reality, can be combined to create powerful analysis tools.
6
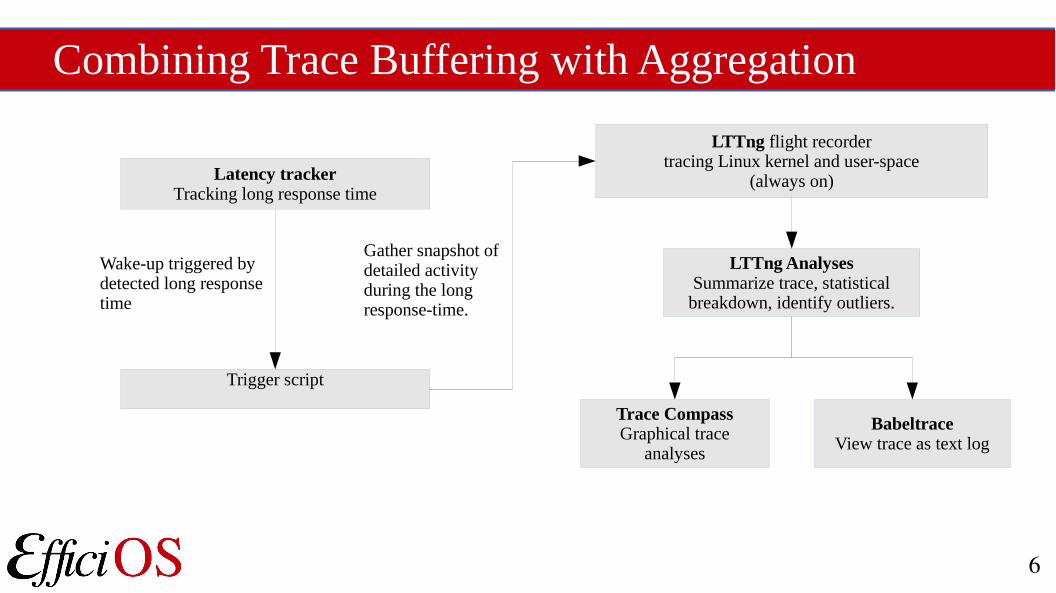
Combining Trace Buffering with Aggregation
LTTng flight recordertracing Linux kernel and user-space
(always on)Latency trackerTracking long response time
Trigger script
Wake-up triggered bydetected long responsetime
Gather snapshot ofdetailed activityduring the longresponse-time.
LTTng AnalysesSummarize trace, statistical
breakdown, identify outliers.
Trace CompassGraphical trace
analyses
BabeltraceView trace as text log

7
Latency Tracker
● Kernel module to track down latency problems at run-time,● Simple API that can be called from anywhere in the kernel
(tracepoints, kprobes, netfilter hooks, hardcoded in other module or the kernel tree source code),
● Keep track of entry/exit events and calls a callback if the delay between the two events is higher than a threshold.
8
Latency Tracker Usage
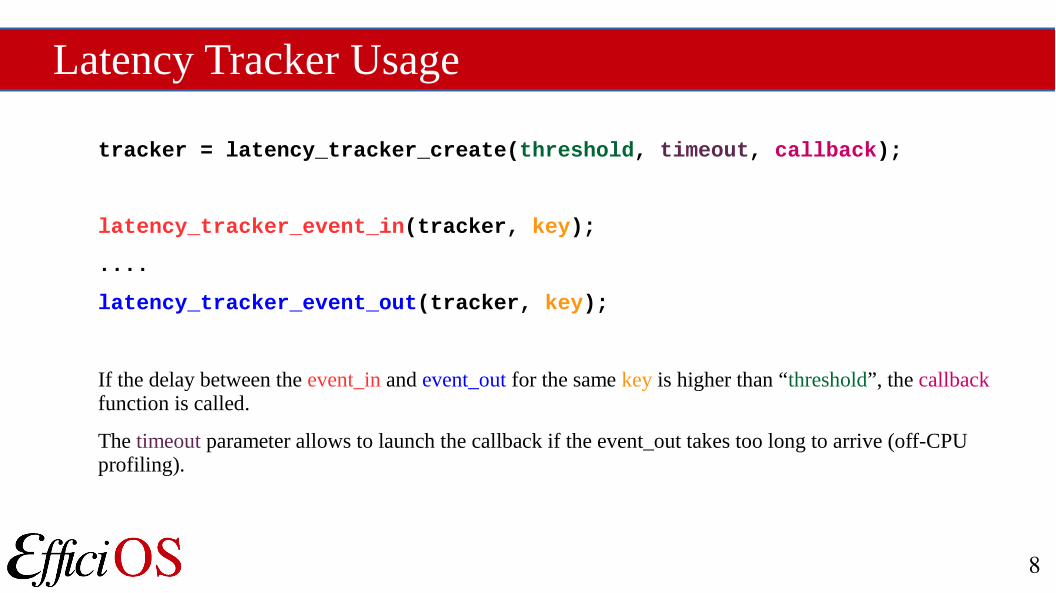
tracker = latency_tracker_create(threshold, timeout, callback);
latency_tracker_event_in(tracker, key);
....
latency_tracker_event_out(tracker, key);
If the delay between the event_in and event_out for the same key is higher than “threshold”, the callback function is called.
The timeout parameter allows to launch the callback if the event_out takes too long to arrive (off-CPU profiling).
9
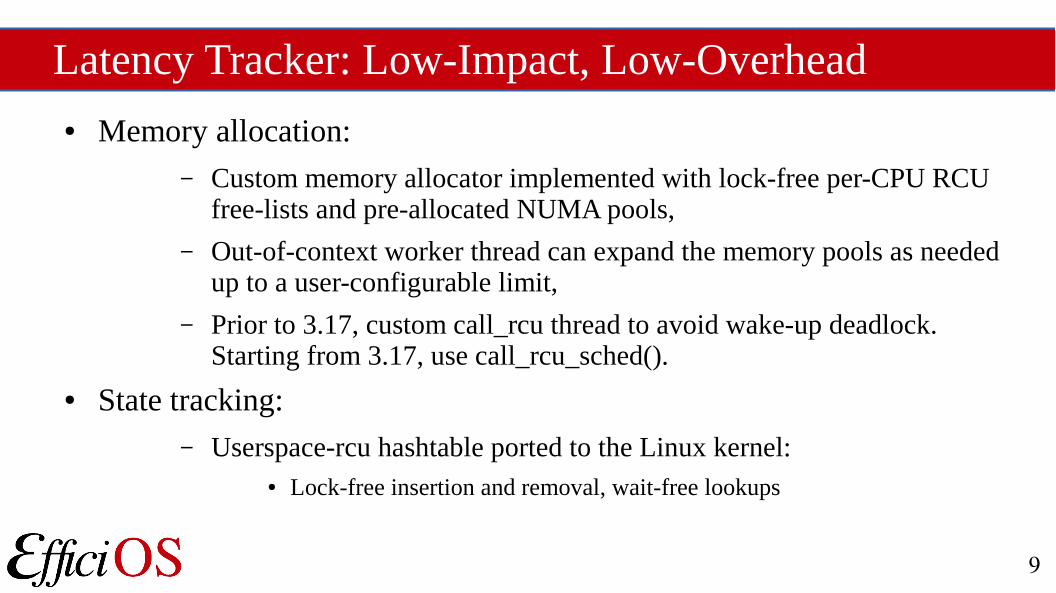
Latency Tracker: Low-Impact, Low-Overhead
● Memory allocation:– Custom memory allocator implemented with lock-free per-CPU RCU
free-lists and pre-allocated NUMA pools,
– Out-of-context worker thread can expand the memory pools as needed up to a user-configurable limit,
– Prior to 3.17, custom call_rcu thread to avoid wake-up deadlock. Starting from 3.17, use call_rcu_sched().
● State tracking:– Userspace-rcu hashtable ported to the Linux kernel:
● Lock-free insertion and removal, wait-free lookups

10
Implemented Latency Trackers
● Block layer: from block request issue to completion,
● Network: from socket buffer receive to consumption by user-space,
● Wake-up: from each thread wake-up to next scheduling of that thread,
● Off-cpu: from each thread preemption/blocking to next execution of that thread,
● IRQ handler: from irq handler entry to exit,
● System call: from system call entry to exit.
11
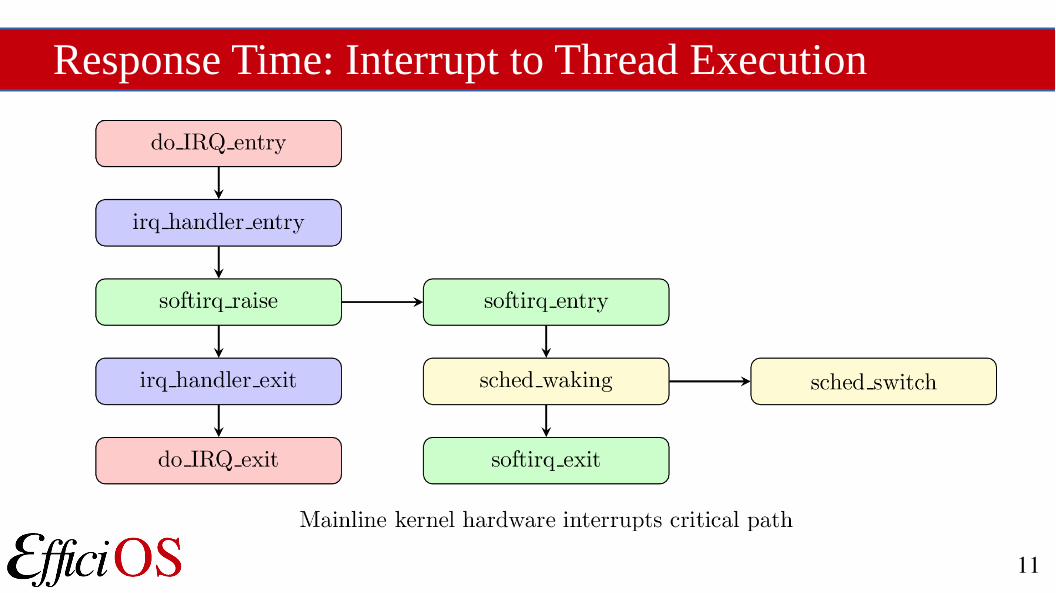
Response Time: Interrupt to Thread Execution

12
Latency Tracker: Online Critical Path Analysis
● Measure response time,● Execution contexts and wakeup chains tracking in kernel module
– For both mainline kernel and preempt-rt,
– NMI, IRQ, SoftIRQ, wakeup/scheduling chains.
● Follow critical path from interrupt servicing to completion of task,● Can perform user-defined action when latencies are higher than a
specified threshold,

13
Online Critical Path Analysis Configuration
● Passing parameters to latency tracker kernel module– Latency threshold,
– Chain filters:● User-space task, pid, process name, RT task, Interrupt source (timer or
IRQ/SoftIRQ number),
– Chain stops when target task starts to run,
– Chain stops when target task blocks,
● Track work begin/end with identifiers from instrumented user-space– Complex asynchronous use-cases.

14
LTTng Kernel and User-Space Tracers
● Low-overhead, correlated kernel and user-space tracing,– Ring buffers in shared memory.
● User-defined filtering on event arguments,● System-wide or tracking of specific processes,● Optionally gather performance counters and extra fields as contexts.● Support disk I/O output, in-memory flight recorder, network
streaming, live reading.
15
LTTng Kernel Tracer (LTTng-modules)
● Load kernel tracer modules (no kernel patching required!), or build into the Linux kernel image,
● LTTng kernel tracer hooks on:– Tracepoints,
– System call entry/exit with detailed argument content,
– Kprobes,
– Kretprobes.

16
LTTng User-Space Tracer (LTTng-UST)
● Dynamically loaded shared library,● Fast user-space tracing, fast-path entirely in user-space,● Instruments:
– Application and libraries with lttng-ust tracepoints, tracef, tracelog,
– Java JUL and Log4j loggers, Python logger,
– Malloc, pthread mutex with symbol override,
– Function entry/exit by compiling with -finstrument-functions.
● Dumps base address information required to map process addresses to executable and library functions/source code using ELF and DWARF.
17
LTTng Analyses
● Offline analysis based on LTTng traces,● Analyze CPU, memory, I/O, interrupts, scheduling, system calls,● Distribution, top, log over threshold:
– I/O latency,
– IRQ handler duration, SoftIRQ raise latency, handler duration,
– Thread wakeup latency (sched_waking to sched_switch in),
– User-defined periods based on kernel and user-space events.
● Integrated with Trace Compass graphical user interface.
18
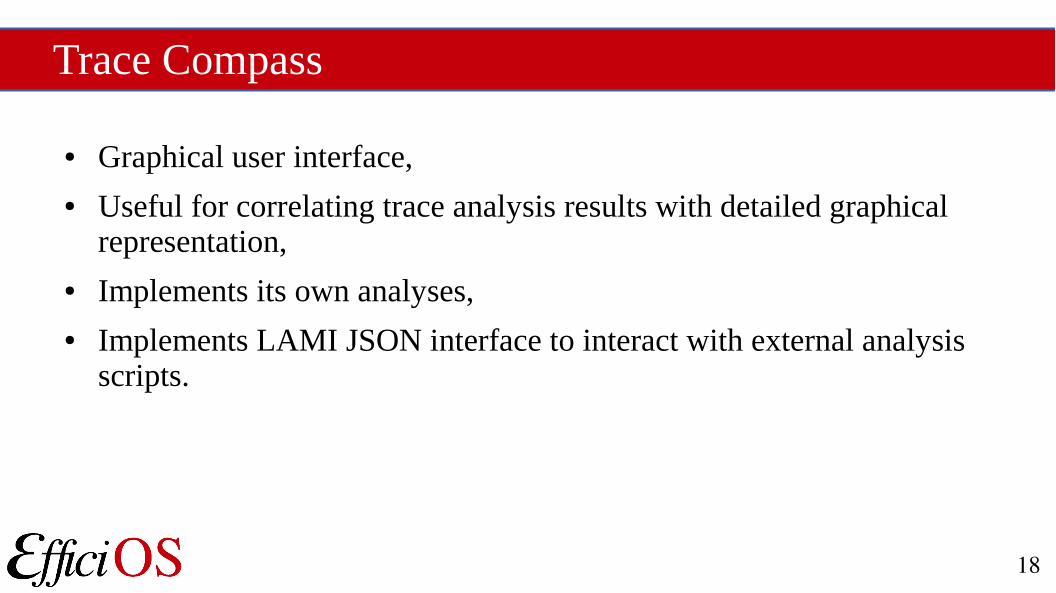
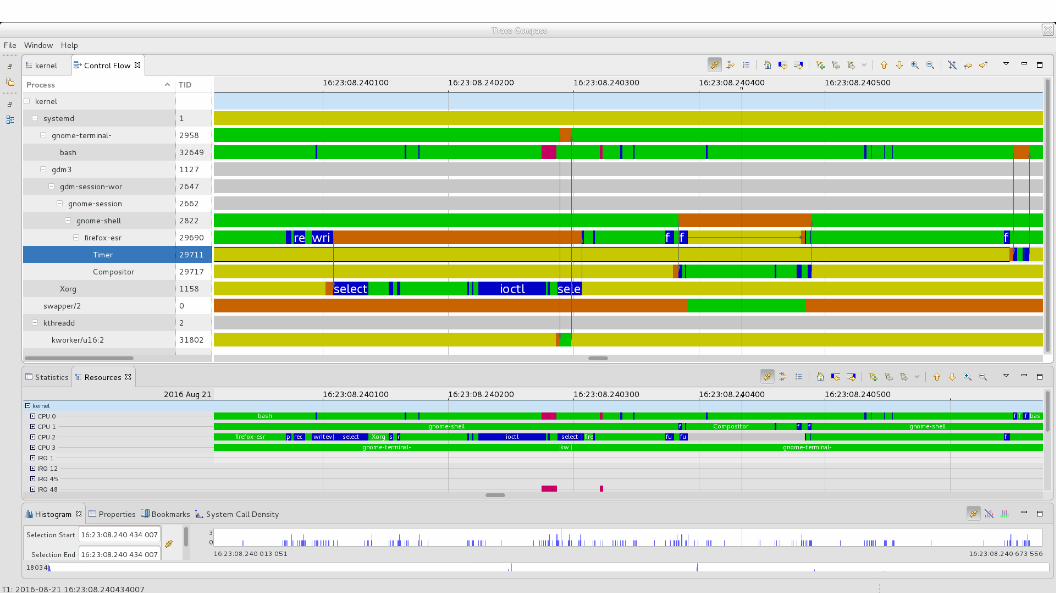
Trace Compass
● Graphical user interface,● Useful for correlating trace analysis results with detailed graphical
representation,● Implements its own analyses,● Implements LAMI JSON interface to interact with external analysis
scripts.
19

20(ns)
21
Babeltrace
● Common Trace Format (CTF) trace reader/converter,● Performs time-based trace correlation/merge,● Expose APIs (C, C++, Python) for reading CTF traces,● Pretty-print traces into text log.

22
Periodic Use-Case Demo
● Jack– Infrastructure for communication between audio applications and with
audio hardware
– http://www.jackaudio.org
– Scheduling latency caused by unsuitable priorities.

23
Aperiodic Use-Cases Demos
● Memcached– Distributed in-memory object caching system
– http://memcached.org
– Response-time to start handling client query● Interrupt servicing latency caused by long driver interrupt handler
– Response-time to complete client query handling● I/O latency caused by logging
24
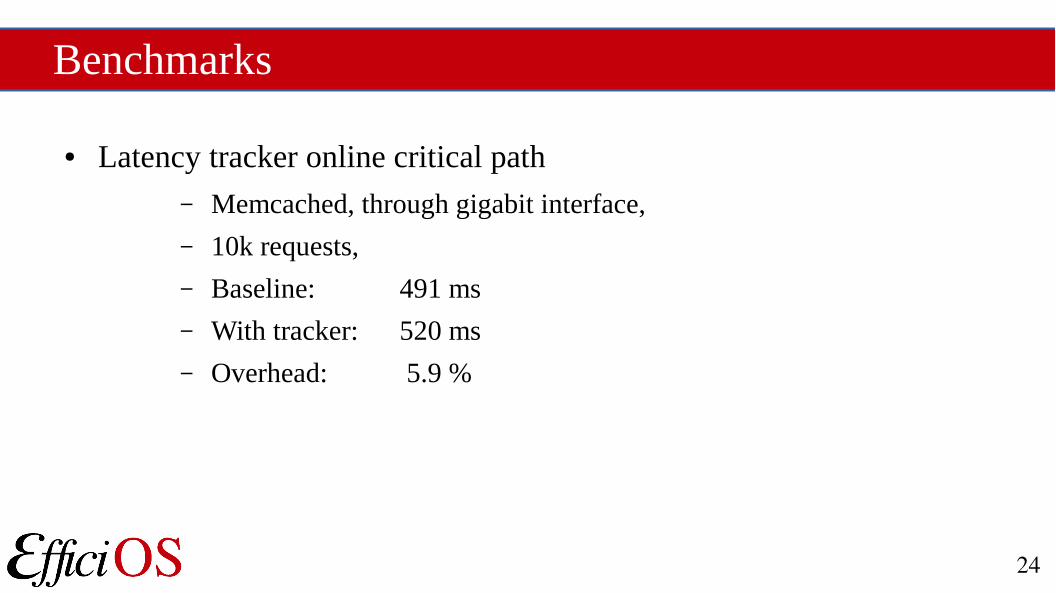
Benchmarks
● Latency tracker online critical path– Memcached, through gigabit interface,
– 10k requests,
– Baseline: 491 ms
– With tracker: 520 ms
– Overhead: 5.9 %
25
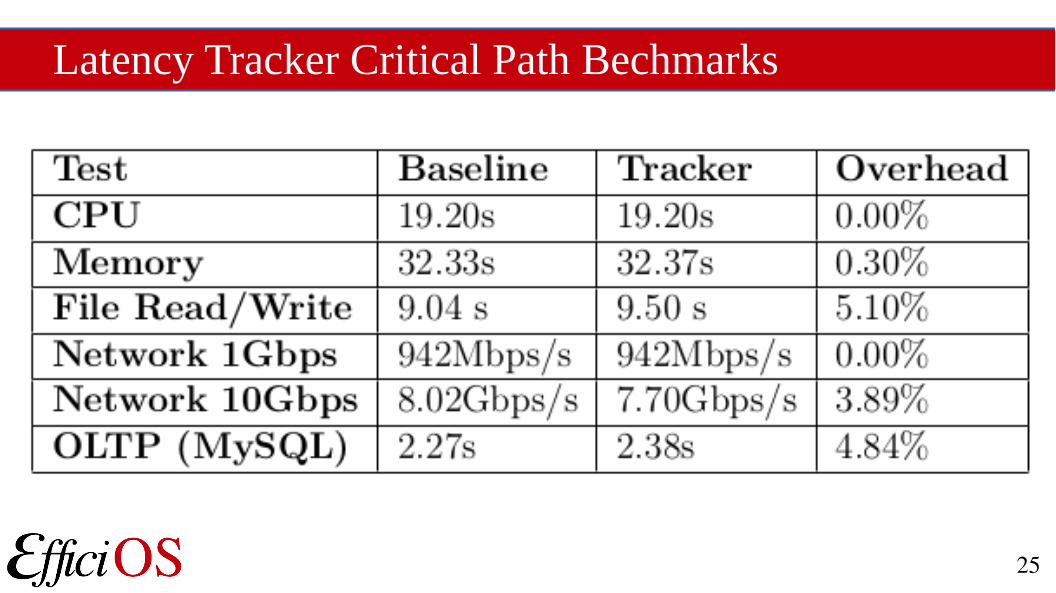
Latency Tracker Critical Path Bechmarks
26
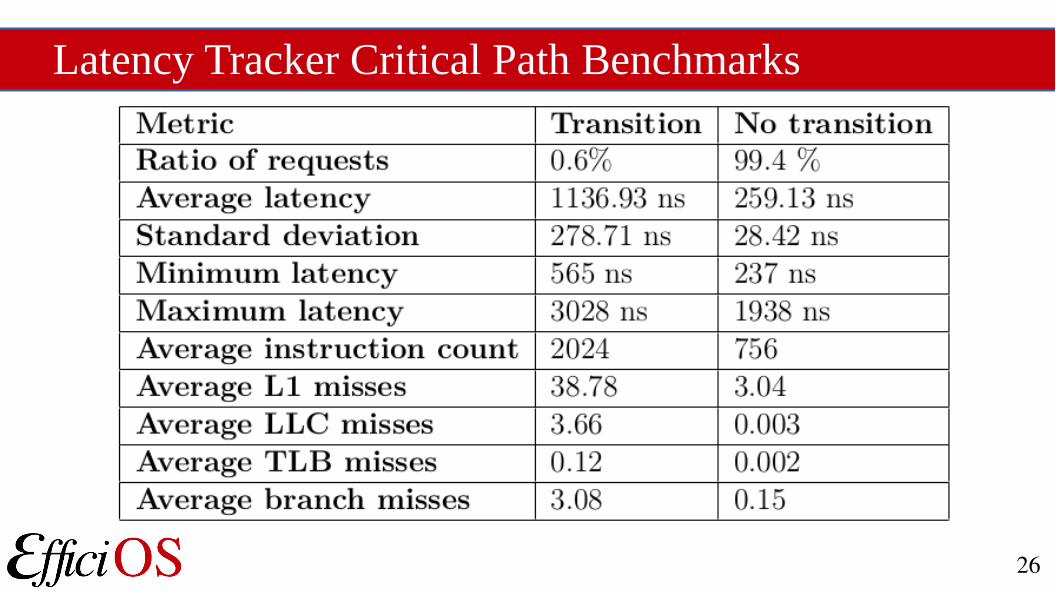
Latency Tracker Critical Path Benchmarks

27
Future Work
● Expose API to lock-free memory allocator, hash table, and latency tracker for use in eBPF scripts. Would provide:
– NMI-safe lock-free memory allocator vs per-freelist spin lock with interrupts off,
– NMI-safe lock-free hash table vs per-bucket locking with interrupts off,
– Would allow hooking eBPF scripts to perf NMIs triggered on performance counter overflows.
● Re-implement latency tracker online critical path module state-machine as eBPF high-level code (bcc).
28
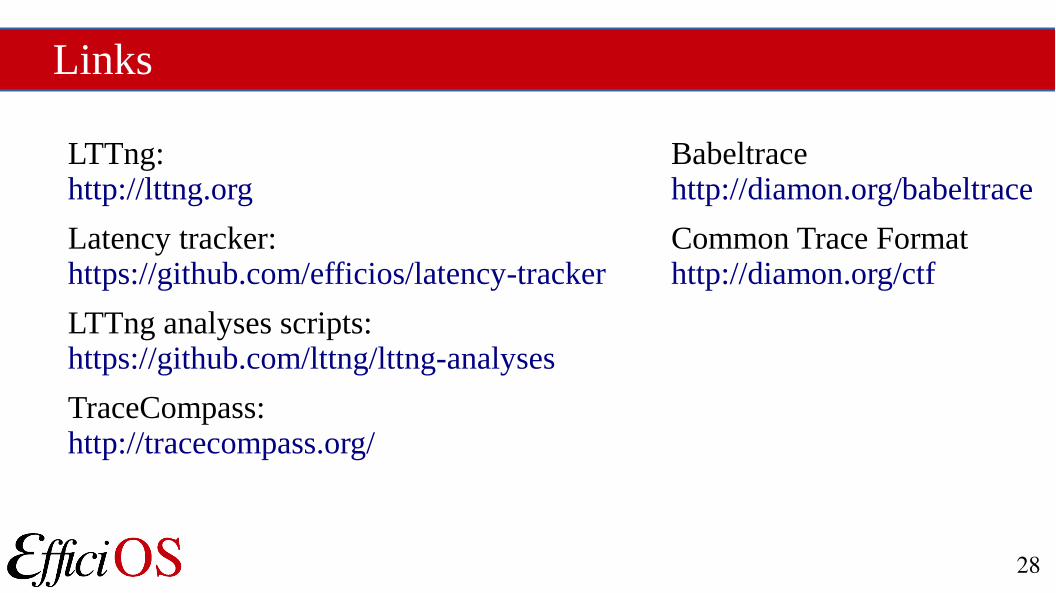
Links
LTTng:http://lttng.org
Latency tracker:https://github.com/efficios/latency-tracker
LTTng analyses scripts:https://github.com/lttng/lttng-analyses
TraceCompass:http://tracecompass.org/
Babeltracehttp://diamon.org/babeltrace
Common Trace Formathttp://diamon.org/ctf

29
Questions ?
? lttng.org
@lttng_project
www.efficios.com