late winter under ice pelagic microbial communities in the
TRANSCRIPT

ORIGINAL RESEARCH ARTICLEpublished: 29 September 2014doi: 10.3389/fmicb.2014.00490
Late winter under ice pelagic microbial communities in thehigh Arctic Ocean and the impact of short-term exposure toelevated CO2 levelsAdam Monier1,2 † ‡, Helen S. Findlay3 ‡, Sophie Charvet1 † and Connie Lovejoy1, 2*
1 Département de Biologie, Québec Océan and Institut de Biologie Intégrative et des Systèmes, Université Laval, Québec, QC, Canada2 Takuvik Joint International Laboratory (CNRS UMI-3376), Université Laval, Québec, QC, Canada3 Plymouth Marine Laboratory, Plymouth, UK
Edited by:
Michael Rappe, University of Hawaiiat Manoa, USA
Reviewed by:
Om V. Singh, University ofPitsburgh, USAIda Helene Steen, University ofBergen, Norway
*Correspondence:
Connie Lovejoy, Département deBiologie, Université Laval, PavillonAlexandre Vachon, 1045 Avenue dela Médecine, Québec, QCG1V 0A6, Canadae-mail: [email protected]†Present address:
Adam Monier, Biosciences, Collegeof Life and Environmental Sciences,University of Exeter, Exeter, UK;Sophie Charvet, IOW Leibniz-Institutfor Baltic Research Warnemünde,Germany
‡These authors have contributedequally to this work.
Polar Oceans are natural CO2 sinks because of the enhanced solubility of CO2 in coldwater. The Arctic Ocean is at additional risk of accelerated ocean acidification (OA) becauseof freshwater inputs from sea ice and rivers, which influence the carbonate system.Winter conditions in the Arctic are of interest because of both cold temperatures andlimited CO2 venting to the atmosphere when sea ice is present. Earlier OA experimentson Arctic microbial communities conducted in the absence of ice cover, hinted at shiftsin taxa dominance and diversity under lowered pH. The Catlin Arctic Survey providedan opportunity to conduct in situ, under-ice, OA experiments during late Arctic winter.Seawater was collected from under the sea ice off Ellef Ringnes Island, and communitieswere exposed to three CO2 levels for 6 days. Phylogenetic diversity was greater inthe attached fraction compared to the free-living fraction in situ, in the controls andin the treatments. The dominant taxa in all cases were Gammaproteobacteria butacidification had little effect compared to the effects of containment. Phylogenetic netrelatedness indices suggested that acidification may have decreased the diversity withinsome bacterial orders, but overall there was no clear trend. Within the experimentalcommunities, alkalinity best explained the variance among samples and replicates,suggesting subtle changes in the carbonate system need to be considered in suchexperiments. We conclude that under ice communities have the capacity to respond eitherby selection or phenotypic plasticity to heightened CO2 levels over the short term.
Keywords: ocean acidification, Arctic Ocean, community structure, phylogenetic diversity, NRI, bottle effect
INTRODUCTIONSince the industrial revolution, it has been estimated that theworld’s oceans have absorbed ∼25% of all carbon dioxide (CO2)emitted into the atmosphere (Sabine et al., 2004; Sarmiento et al.,2010). This continual and rapid uptake of CO2 into the oceansis resulting in a shift in the ocean carbonate chemistry and areduction in ocean pH, a process that has been termed ocean acid-ification (Caldeira and Wickett, 2003; Raven et al., 2005; Doneyet al., 2009). The Polar Oceans naturally are sinks to CO2 becauseCO2 is more soluble in cold water. The Arctic Ocean is believedto be more at risk to accelerated ocean acidification because ofthe freshwater influence from sea ice and through river inputs(Steinacher et al., 2009). There is already evidence of low pHand undersaturated conditions in some areas of the Arctic Ocean(Bates et al., 2009; Mathis et al., 2012), and during winter, micro-bial respiration acts to further elevate CO2 in the surface watersunder sea ice (Sabine et al., 2004; Sarmiento et al., 2010; Milleret al., 2011).
Microbial processes are responsible for biogeochemical cyclingand functioning of marine ecosystems (Caldeira and Wickett,
2003; Raven et al., 2005; Azam and Malfatti, 2007; Doney et al.,2009) and the Arctic Ocean is no exception, with active bacte-rial production occurring even in the dark of winter (Garneauet al., 2008; Steinacher et al., 2009). Although ice covered regionsappear to have lower bacterial production and abundance thanice-free areas, they also have much higher ratios of bacteria tophytoplankton production (Rich et al., 1997; Bates et al., 2009;Mathis et al., 2012), implying high levels of bacterial respiration.There are few reports of microbial community composition andactivity during the Arctic winter, although a number of bacte-rial taxa remain active over the winter (Krembs et al., 2002; Jungeet al., 2004; Galand et al., 2008, 2013). However, the majority ofstudies to date have investigated microbial processes during thespring, summer and early autumn when the Arctic Ocean is moreaccessible and under ice winter bacterial communities and pro-cesses remain understudied. The continued remineralization ofcarbon by pelagic bacteria throughout the winter under the seaice is believed to contribute a significant fraction of the CO2 to thewater column (Miller et al., 2011). On a seasonal cycle, the addi-tion or removal of CO2 by microbes contributes significantly to
www.frontiersin.org September 2014 | Volume 5 | Article 490 | 1

Monier et al. Ocean acidification and Arctic bacteria
the mediation of ocean acidification, which can have implicationsfor the timing and rate of acidification. Therefore, understand-ing how a shift in climate or ocean acidification might impactbacterial abundance, community or activity is important fordetermining the feedbacks on biogeochemical cycling.
In the majority of recent ocean acidification experiments, bac-terial abundance seems to be unaffected by CO2 levels (Rochelle-Newall et al., 2004; Grossart et al., 2006; Allgaier et al., 2008).The response of bacterial production to elevated CO2 conditionsis not uniform; but most studies show an increase in bacterialproduction when exposed to elevated CO2 (Liu et al., 2010).The effect of acidification on bacterial community compositionis variable; with either no change with increasing CO2 (Mühlinget al., 2006; Allgaier et al., 2008; Tanaka et al., 2008), a shift toa community representing an “unhealthy” system, for examplein coral-associated bacteria (Thurber et al., 2009), or an indirecteffect with community changes associated with a phytoplanktonbloom (Allgaier et al., 2008).
Studies addressing the effect of CO2 levels in Arctic Seas areparticularly rare but a recent mesocosm experiment in an ice-free Arctic fjord reported that Gammaproteobacteria were theonly taxon that showed significant changes with increasing CO2.In addition, the relative abundance of 15 rare taxa was signifi-cantly correlated with increasing CO2 concentration (Roy et al.,2013). The change in relative abundance of these rare taxa hintsat potential shifts in taxa dominance or diversity, but overallthe results were difficult to interpret, with major differencesbetween the natural communities of the fjord and those in themesocosm.
Our study aimed to investigate the direct effects of oceanacidification on under-ice Arctic pelagic bacteria, using culture-independent, high-resolution molecular techniques to not onlyassess changes in community structure, but also investigatechanges in phylogenetic taxa dominance and diversity betweenboth the particle-attached and the free-living communities. Sincethe natural community was also monitored before and after theexperiment, our analysis also provided an opportunity to explorethe influence of confinement, the so-called “bottle effect” onmicrobial communities.
MATERIALS AND METHODSFIELD AND EXPERIMENTAL PROCEDURESIce baseFrom 15th March to 30th April 2010, the Catlin Ice Base (CIB)was situated at N 78◦ 43.11′, W 104◦ 47.44′ on a region of flat,first year sea ice, which extended east to west from Ellef RingnesIsland seaward (Supplementary Figure 1). The sea ice in the areawas between 1.5 and 1.7 m thick. The water depth under theice was not precisely known, although the maximum depth ofthe wire on the winch used for obtaining water samples wasroughly 230 m, and this did not reach the bottom. The CanadianHydrographic Service Chart #7953 (last updated 17/03/1972)suggests that the area is between soundings of 290 and 420 m.
Seawater collection, experimental set up and samplingSeawater was collected, using a 10 L Niskin water bottle througha 1.3 × 1.1 m hole in the sea ice, from 25 m depth and placed
initially into three sterilized 25 L water containers on the 19thApril 2010. In each container the carbonate chemistry was manip-ulated using HCl and NaHCO3 based on measurements of pHand alkalinity (Table 1) and calculated using the Seacarb program(Lavigne and Gattuso, 2010) as detailed in the EPOCA Guideto Best Practices (Riebesell et al., 2010). The carbonate systemwas manipulated so that there were three atmospheric CO2 con-centration scenarios: “ambient-CO2” (∼400 ppm), “mid-CO2”(∼880 ppm), and “high-CO2” (∼1800 ppm). After the manip-ulations were made, seawater was decanted into three replicate2 L incubation bottles (Thermo Scientific Nalgene polycarbonatenarrow-mouth bottle) for each treatment. The incubation bottleswere maintained at ambient seawater conditions by suspendingthem on a line through a hole in the sea ice (the hole was ∼1 m2).The bottles were held 1.5 m under the ice for the duration ofthe experiment (6 days). The hole was maintained accessible (i.e.,minimizing ice growth) by covering with wooden boards at night-time and removing ice during the day. Because of limited sampleprocessing capacity, the three comparative in situ communitieswere from separate 10 m deep seawater samples; two samples werecollected prior to OA experiments on 18/04/2010 and 22/04/2010and one just after the experiment on 04/26/2010 (Table 1) forboth free-living and attached fractions.
Temperature, salinity and pH were measured at the beginningand the end of the experiment in water samples taken from each
Table 1 | Environmental conditions from the water column under the
sea ice over the same period as the ocean acidification experiment
(before, during and after): salinity, temperature, dissolved inorganic
carbon (DIC), and alkalinity were measured alongside chlorophyll,
ammonium, phosphate, nitrate and silicate.
18/04/10 22/04/10 26/04/10
Salinity 30.31 ( ± 0.22) 30.36 ( ± 0.26) 30.33 ( ± 0.12)Temp (◦C) −1.652 ( ± 0.002) −1.650 ( ± 0.003) −1.654 ( ± 0.006)Alkalinity (µmol kg−1) 2140.5 ( ± 4.8) 2143.3 ( ± 6.8) 2141.1 ( ± 2.2)DIC (µmol kg−1) 2023.5 ( ± 0.6) 2020.8 ( ± 2.1) 2023.9 ( ± 1.3)pHT 8.137 ( ± 0.012) 8.152 ( ± 0.026) 8.137 ( ± 0.007)HCO−
3 (µmol kg−1) 1914.8 ( ± 1.5) 1909.7 ( ± 5.7) 1915.1 ( ± 2.4)CO2−
3 (µmol kg−1) 88.7 ( ± 2.5) 91.9 ( ± 5.0) 88.9 ( ± 1.6)CO2 (µmol kg−1) 20.0 ( ± 1.5) 19.2 ( ± 4.3) 19.9 ( ± 1.8)pCO2 (µatm) 290.4 ( ± 8.2) 279.6 ( ± 16.9) 290.1 ( ± 5.5)�Cal 2.18 ( ± 0.06) 2.25 ( ± 0.13) 2.18 ( ± 0.04)�Arg 1.35 ( ± 0.04) 1.40 ( ± 0.08) 1.35 ( ± 0.03)Chlorophyll (µg L−1) 0.58 ( ± 0.11) 0.69 ( ± 0.06) 0.73 ( ± 0.14)Ammonium (µM) 0.26 ( ± 0.24) 0.40 ( ± 0.15) 0.22 ( ± 0.06)Phosphate (µM) 0.77 ( ± 0.11) 0.70 ( ± 0.12) 0.78 ( ± 0.03)Nitrate (µM) 1.04 ( ± 0.15) 1.15 ( ± 0.21) 1.18 ( ± 0.28)Silicate (µM) 6.70 ( ± 1.11) 5.93 ( ± 1.12) 6.31 ( ± 0.55)Daily Surface PAR(W m−2)
18.66 22.86 28.81
pHT , bicarbonate ion (HCO−3 ), carbonate ion (CO 2−
3 ) and aqueous CO2 concen-
trations, pCO2 and saturation states of calcite (�Cal ) and aragonite (�Arg ) were
calculated from the measured parameters using CO2sys. Values are mean ± 1
standard deviation of the surface water measurements (0.5, 3, 5, and 10 m).
Daily surface PAR values were estimated from the NCEP/NCAR surface level
downward solar radiation flux (W m−2; 6 h measurements); values are daily
integrations.
Frontiers in Microbiology | Extreme Microbiology September 2014 | Volume 5 | Article 490 | 2
Monier et al. Ocean acidification and Arctic bacteria
of the incubation bottles (Table 2). Temperature and salinity weremeasured using a handheld WTW LF197 multi-meter with aTetra con 325 electrode, and pH was measured using a hand-held a Metrohm 826 pH meter and pH electrode (6.0228.000),and using Amp- and Tris- buffers, to give pH on total scale,following Dickson et al. (2007). Alkalinity was measured bycollecting water samples in 250 mL borosilicate glass bottleswith ground glass stoppers according to standard proceduresdetailed in Dickson et al. (2007). Samples were stored unfrozenand returned to Plymouth Marine Laboratory (UK) for anal-ysis using the open-cell potentiometric titration method usingan automated titrator (repeatability: max. ± 0.1% at alkalin-ity ∼2300 µmol kg−1). Calibration was made using DicksonCertified Reference Materials. For community DNA, 2 L of sea-water was collected at the end of the experiment, and was firstpassed through a 50 µm mesh then sequentially filtered onto a3 µm polycarbonate filter (Millipore) and a Sterivex 0.2 µm fil-ter (Millipore). Filters were stored in lysis buffer (50 mM Tris,40 mM EDTA, 0.75 M sucrose) and kept in liquid nitrogen untilextractions at Université Laval (Canada).
DNA extraction, amplification and sequencingCommunity DNA was extracted using a salt (NaCl) extractionprotocol (Aljanabi and Martinez, 1997) as modified in Hardinget al. (2011) and stored at −20◦C until shipment to ArgonneNational Laboratory where the DNA samples were amplifiedwith identifier tags along with 16S primers covering the V3−V4region (Prof. J. A. Gilbert, Argonne National Laboratory, USA),then cleaned using the MoBio Ultra Clean htp 96 well clean-upkit. The clean amplicons were then quantified using InvitrogenPicoGreen reagent and a plate reader. Different volumes of theamplicons were pooled together into one tube with a targetof 10–35 ng of amplicon DNA. The aim was to have similarquantities from each of the samples. Total DNA was quantified
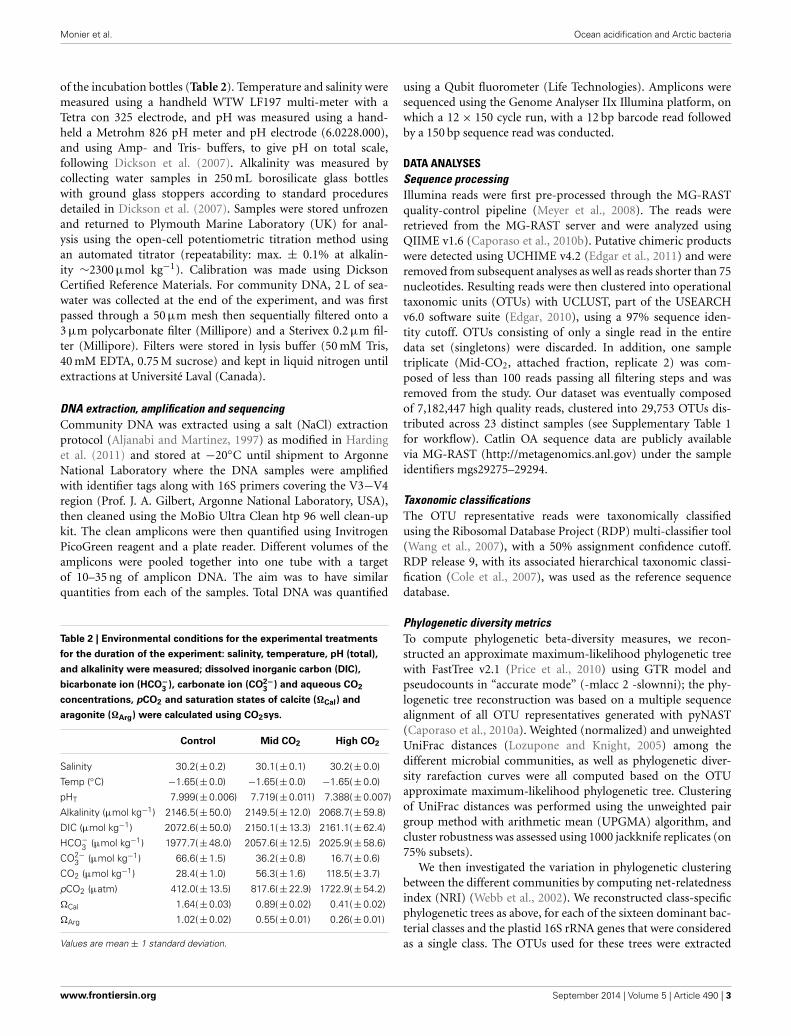
Table 2 | Environmental conditions for the experimental treatments
for the duration of the experiment: salinity, temperature, pH (total),
and alkalinity were measured; dissolved inorganic carbon (DIC),
bicarbonate ion (HCO−3
), carbonate ion (CO2−3
) and aqueous CO2
concentrations, pCO2 and saturation states of calcite (�Cal) and
aragonite (�Arg) were calculated using CO2sys.
Control Mid CO2 High CO2
Salinity 30.2( ± 0.2) 30.1( ± 0.1) 30.2( ± 0.0)
Temp (◦C) −1.65( ± 0.0) −1.65( ± 0.0) −1.65( ± 0.0)
pHT 7.999( ± 0.006) 7.719( ± 0.011) 7.388( ± 0.007)
Alkalinity (µmol kg−1) 2146.5( ± 50.0) 2149.5( ± 12.0) 2068.7( ± 59.8)
DIC (µmol kg−1) 2072.6( ± 50.0) 2150.1( ± 13.3) 2161.1( ± 62.4)
HCO−3 (µmol kg−1) 1977.7( ± 48.0) 2057.6( ± 12.5) 2025.9( ± 58.6)
CO2−3 (µmol kg−1) 66.6( ± 1.5) 36.2( ± 0.8) 16.7( ± 0.6)
CO2 (µmol kg−1) 28.4( ± 1.0) 56.3( ± 1.6) 118.5( ± 3.7)
pCO2 (µatm) 412.0( ± 13.5) 817.6( ± 22.9) 1722.9( ± 54.2)
�Cal 1.64( ± 0.03) 0.89( ± 0.02) 0.41( ± 0.02)
�Arg 1.02( ± 0.02) 0.55( ± 0.01) 0.26( ± 0.01)
Values are mean ± 1 standard deviation.
using a Qubit fluorometer (Life Technologies). Amplicons weresequenced using the Genome Analyser IIx Illumina platform, onwhich a 12 × 150 cycle run, with a 12 bp barcode read followedby a 150 bp sequence read was conducted.
DATA ANALYSESSequence processingIllumina reads were first pre-processed through the MG-RASTquality-control pipeline (Meyer et al., 2008). The reads wereretrieved from the MG-RAST server and were analyzed usingQIIME v1.6 (Caporaso et al., 2010b). Putative chimeric productswere detected using UCHIME v4.2 (Edgar et al., 2011) and wereremoved from subsequent analyses as well as reads shorter than 75nucleotides. Resulting reads were then clustered into operationaltaxonomic units (OTUs) with UCLUST, part of the USEARCHv6.0 software suite (Edgar, 2010), using a 97% sequence iden-tity cutoff. OTUs consisting of only a single read in the entiredata set (singletons) were discarded. In addition, one sampletriplicate (Mid-CO2, attached fraction, replicate 2) was com-posed of less than 100 reads passing all filtering steps and wasremoved from the study. Our dataset was eventually composedof 7,182,447 high quality reads, clustered into 29,753 OTUs dis-tributed across 23 distinct samples (see Supplementary Table 1for workflow). Catlin OA sequence data are publicly availablevia MG-RAST (http://metagenomics.anl.gov) under the sampleidentifiers mgs29275–29294.
Taxonomic classificationsThe OTU representative reads were taxonomically classifiedusing the Ribosomal Database Project (RDP) multi-classifier tool(Wang et al., 2007), with a 50% assignment confidence cutoff.RDP release 9, with its associated hierarchical taxonomic classi-fication (Cole et al., 2007), was used as the reference sequencedatabase.
Phylogenetic diversity metricsTo compute phylogenetic beta-diversity measures, we recon-structed an approximate maximum-likelihood phylogenetic treewith FastTree v2.1 (Price et al., 2010) using GTR model andpseudocounts in “accurate mode” (-mlacc 2 -slownni); the phy-logenetic tree reconstruction was based on a multiple sequencealignment of all OTU representatives generated with pyNAST(Caporaso et al., 2010a). Weighted (normalized) and unweightedUniFrac distances (Lozupone and Knight, 2005) among thedifferent microbial communities, as well as phylogenetic diver-sity rarefaction curves were all computed based on the OTUapproximate maximum-likelihood phylogenetic tree. Clusteringof UniFrac distances was performed using the unweighted pairgroup method with arithmetic mean (UPGMA) algorithm, andcluster robustness was assessed using 1000 jackknife replicates (on75% subsets).
We then investigated the variation in phylogenetic clusteringbetween the different communities by computing net-relatednessindex (NRI) (Webb et al., 2002). We reconstructed class-specificphylogenetic trees as above, for each of the sixteen dominant bac-terial classes and the plastid 16S rRNA genes that were consideredas a single class. The OTUs used for these trees were extracted
www.frontiersin.org September 2014 | Volume 5 | Article 490 | 3

Monier et al. Ocean acidification and Arctic bacteria
from the multiple sequence alignments. Each phylogenetic treewas then analyzed with the R package “picante” v1.5 (Kembelet al., 2010) to compute abundance weighted mean pairwisedistance (MPD) against a null model comprised of 999 random-ized trees with taxa shuffling, leading to standardized metrics(SESMPD, corresponding to −1 × NRI).
Statistical analysesSignificances in taxonomic diversity differences and phylogeneticmetrics among samples were assessed using analyses of variance(ANOVA) and Tukey’s HSD post-hoc tests in the R environment(R Development Core Team; www.R-project.org).
For canonical correspondence analyses (CCA), we first con-ducted a correlation analysis on the environmental variables(Table 1) to avoid redundancy in the multivariate analyses.Correlations were detected between CO2 and pCO2 (of which wekept pCO2) and between CO3 and the calcite and aragonite sat-uration states (of which we kept CO3). Subsequently, two CCAwere conducted to determine which environmental variables werecorrelated with changes among the microbial communities for the12 most abundant phyla and for the Gammaproteobacteria. TheOTU abundance data were transformed to relative proportionsbefore conducting the CCA. Both correlation and ordinationanalyses were performed using PAST software (Hammer et al.,2009).
RESULTSENVIRONMENTAL PARAMETERSTo achieve these objectives, we sequenced the V3−V4 regions ofthe 16S small subunit rRNA gene (hereafter 16S) retrieved from
natural microbial communities (“in situ”) and communities thatwere subjected to experimental manipulations. The experimen-tal samples were put into 2 L containers and with three differentCO2 concentrations including a bottle control “ambient-CO2”:(400 ppm), “mid-CO2” (880 ppm), and “high-CO2” (1800 ppm).Microbial assemblages were retrieved from two size fractions:small or “free-living” (0.2–3 µm), and large or “attached”(>3–50 µm).
The conditions within the experimental containers were main-tained and stable over the 6 days. The salinity, temperature andtotal alkalinity in the control matched the in situ under-ice surfacewater conditions, however there were slight differences in otherparameters, with lower pH and higher DIC and pCO2 conditionsin the containers compared to in situ (Tables 1, 2).
PHYLOGENETIC DIVERSITY OF NATURAL AND CO2-TREATED ARCTICMICROBIAL COMMUNITIESOur final 16S sequence dataset was composed of more than7 million quality-controlled reads totaling ∼30 k OTUs, acrossall samples (Supplementary Table 1). Clustering and principalcoordinate analyses (PCoA) on both weighted and unweightedUniFrac distances indicated that size fraction (i.e., free-livingvs. attached) mainly drove the phylogenetic beta-diversity acrossmicrobial assemblages (Figure 1 and Supplementary Figure 2,respectively). Weighted and unweighted distance clusteringclearly separated the two size fractions, indicating their dis-tinct phylogenetic compositions (Figure 1A and SupplementaryFigure 2A). Moreover, the PCoA showed that phylogeneticcompositions of communities from the attached fraction wereremarkably more varied compared to those of the free-living
FIGURE 1 | (A) Clustering of 23 Arctic pelagic microbial samples based onUPGMA of weighted and normalized UniFrac distances. Microbialcommunities were retrieved from two distinct size fractions (free-living:0.2–3 µm; attached: >3 µm) and were sampled from natural conditions(in situ; dark blue) or from different CO2 concentration treatments:
ambient-CO2 (400 ppm; clear blue), mid-CO2 (880 ppm; orange) andhigh-CO2 (1800 ppm; red). Samples are identified using replicate number.Cluster supports were computed using 1000 jackknife replicates. (B)
Corresponding principal coordinate analysis (PCoA) using weighted andnormalized UniFrac distances (PC: principal coordinate).
Frontiers in Microbiology | Extreme Microbiology September 2014 | Volume 5 | Article 490 | 4

Monier et al. Ocean acidification and Arctic bacteria
communities (Figure 1B and Supplementary Figure 2B; alongprincipal coordinate 2). Communities from the free-living frac-tion were more clustered along principal coordinates, indicatinggreater phylogenetic similarity among communities than thosefrom the attached fraction.
There was little clustering by treatment with the replicatesfor the in situ, control, and the mid- and high-CO2 samplesinterspersed. The free-living fraction of the CO2-treated commu-nities grouped into several supported clusters (Figure 1A), butwith no pattern by treatment, and the clustering was not evi-dent when using unweighted UniFrac distances (SupplementaryFigure 2A). Two control samples were moderately distant fromothers when using weighted UniFrac distances (Figure 1B; alongprincipal coordinate 1) but not unweighted ones (SupplementaryFigure 2B). For the attached fraction, phylogenetic communitycomposition of one of the high-CO2 replicates was very distantfrom all other samples, including from other high-CO2 sam-ples, as determined by both weighted and unweighted PCoAanalyses (Figure 1B and Supplementary Figure 2B). Also for theparticle-attached size fraction, three samples from mid-CO2 andhigh-CO2 treatments significantly clustered together (Figure 1Aand Supplementary Figure 2A).
To test how acidification influenced the diversity of Arcticmicrobial assemblages, we computed the phylogenetic diversity(PD) of each sample. Using 1000 rarefaction iterations, no sig-nificant difference was found in PD among in situ, control andCO2−treated communities, for either size fractions (Figure 2).However, again there was much more variability within theattached fraction, compared to the free-living fraction.
ACIDIFICATION AND DETAILED COMMUNITY TAXONOMICCOMPOSITIONThe taxonomic composition of each microbial community wasinvestigated by comparing relative abundances of 16S sequencesamong major Phyla and Classes of Proteobacteria, Actinobacteriaand Planctomycetes, defined as those with a relative abun-dance >1% in at least one sample (Figure 3). OTUs classifiedas Gammaproteobacteria were by far the most abundant in
both size fractions. Alphaproteobacteria, Betaproteobacteria andDeltaproteobacteria were more abundant in the free-living sizefraction than in the attached. In the free-living fraction, seven ofthese major groups had significant differential relative abundancebetween in situ and CO2-treatments or across CO2-treatments(Figure 3 and Supplementary Table 2). Four of these were bac-terial groups: SAR202 in the phylum Chloroflexi (P = 0.017),OM190 in the Planctomycetes (P = 0.024), SAR406 in theAB16 (P = 0.022) and Verrucomicrobiae in the Verrucomicrobia(P = 0.047). Both dominant archaeal groups were also foundwith differential relative abundances in the free-living frac-tion: Thaumarchaeota (P = 0.094) and Thermoplasmata in theEuryarchaeota (P = 0.026). Eukaryotic microbial phytoplank-ton detected by chloroplast 16S reads were also significantlyaffected by treatments (P = 0.011), being less abundant exper-imental containers compared to in situ. In the attached frac-tion, only OTUs classified as Flavobacteria in the Bacteroidetes(P = 0.079) were found with significant differential relativeabundance, with fewer Flavobacteria reads in the containers com-pared to in situ.
Because Gammaproteobacteria were overall the most abun-dant class, we increased its taxonomic resolution to determine ifthe relative abundance of specific clades had been affected by theexperimental conditions (Figure 4 and Supplementary Table 3).Alteromonadales constituted by far the most abundant lineageof Gammaproteobacteria in both size fractions, and were differ-entially abundant across samples in the free-living fraction (P =0.054); free-living Alteromonadales were most abundant in thecontrol samples, with a mean relative abundance of 0.29 (SD ±0.12) compared to an in situ relative abundance of 0.1 (± 0.04).Interestingly, in both the CO2-treatments (mid- and high-CO2)values were similar to those in situ suggesting no or little “bottleeffect”; free-living Alteromonadales, had similar relative abun-dances to those found in natural conditions (SupplementaryTable 3). In the attached fraction, only Oceanospirillales werefound to have significant differential relative abundances acrossconditions (P = 0.001); attached Oceanospirillales were quiteabundant in the natural samples (0.098 ± 0.03), but their relative
FIGURE 2 | Phylogenetic diversity rarefaction curves. Phylogeneticdiversity (mean ± s.e.m.) was measured as the sum of branch lengths of the16S OTU phylogenetic tree for each rarefied sequence pool. Sequence
datasets were rarefied to 10,000 sequences and were sampled using a stepof 50 sequences; rarefaction sampling was reiterated 1000 times. Samplecolor code is as in Figure 1.
www.frontiersin.org September 2014 | Volume 5 | Article 490 | 5

Monier et al. Ocean acidification and Arctic bacteria
FIGURE 3 | Taxonomic compositions of Arctic pelagic microbial
communities based on relative abundances (mean ± s.e.m.) of 16S
sequences. Only taxonomic groups with mean relative abundances >1% in
at least one sample are shown. Sample color code is as in Figure 1.Asterisks indicate taxonomic groups with significantly different relativeabundances between conditions (ANOVA; ∗P < 0.1, ∗∗P < 0.05).
FIGURE 4 | Taxonomic compositions of the most abundant
Gammaproteobacteria taxa (mean relative abundances >0.5% in at least
one sample) based on relative abundances (mean ± s.e.m.) of 16S
sequences. Sample color code as in Figure 1. Asterisks indicate taxonomicgroups with significantly different relative abundances between conditions(ANOVA; ∗P < 0.1, ∗∗∗P < 0.01).
abundance was nearly 10-fold lower in the bottles, especially inthe control (0.014 ± 0.008) and CO2-treated (e.g., mid-CO2:0.013 ± 0.002) conditions.
ACIDIFICATION EFFECTS ON COMMUNITY PHYLOGENETIC STRUCTUREWe next examined the effects of CO2-treatments on the phy-logenetic structure of each dominant taxonomic group. Tothis end, we used the net relatedness index (NRI) as a proxyfor phylogenetic clustering (Webb et al., 2002). For a given
community, positive NRI reflects phylogenetic clustering, indi-cating that the community is composed of taxa more evolu-tionarily related than randomly assembled communities. Suchclustering can be an indicator of habitat filtering, where envi-ronmental conditions favor taxa with specific ecological traits,implying phylogenetic relatedness among taxa. In contrast,negative NRI reveals phylogenetic overdispersion, which indi-cates that taxa are less related than expected by chance. Thisoverdispersion can potentially reflect exclusion by competition,
Frontiers in Microbiology | Extreme Microbiology September 2014 | Volume 5 | Article 490 | 6

Monier et al. Ocean acidification and Arctic bacteria
where a taxon outcompeted closely related organisms exhibitingsimilar ecological traits.
Overall, we found that the different dominant taxonomicgroups were phylogenetically structured, with a large majority ofthese exhibiting positive NRI values (Figure 5 and SupplementaryTable 4). Five dominant taxonomic groups in the free-livingfraction and three in the particle-attached had significant dif-ferences in their NRI across conditions. However, we foundonly a few cases of the phylogenetic structure of groups beingimpacted by CO2-treatment, specifically; Acidimicrobiia andDeltaproteobacteria. Acidimicrobiia was the only clade foundto have significantly different NRI values in both size fractions.Free-living Acidimicrobiia communities were overdispersed innatural conditions but became clustered once isolated in bot-tles for control or CO2-treatements (Supplementary Table 4),with significant differences in NRI (P = 0.097). In contrast totheir free-living counterparts, attached Acidimicrobiia becamemore overdispersed under higher CO2 levels (P = 0.005). Weobserved that the NRI of free-living Deltaproteobacteria com-munities decreased when exposed to higher CO2 levels. BottledVerrucomicrobia communities from the small size fraction werefound to have higher NRI values than in situ counterparts.
MULTIVARIATE ANALYSISThe shifts in community structure were investigated further usingcanonical correspondence analysis (CCA) of the OTUs alongsidethe carbonate system parameters measured in each treatment.
The ordination distributions confirmed the difference in com-munities between the free-living (Supplementary Figure 3A) andattached (Supplementary Figure 3B) fractions. In terms of wholecommunities, the particle-attached bacteria showed higher vari-ability among treatments, especially along axis 1 representing87.54% of the variation, which was influenced by alkalinity,HCO3 and DIC. Conversely, the free-living communities of thetreatments clustered together in ordination space along axis 1(67.6% of the variation), which was largely affected by pCO2,CO2−
3 and pH.The attached Gammaproteobacteria communities were
divided mostly according to alkalinity (axis 2; 22% of thevariation) (Supplementary Figure 4A). Although axis 1 explained77.9% of the variation, it primarily affected the separation ofone outlier replicate of the high-CO2 treatment. The free-livingGammaproteobacteria communities were affected by changes inpCO2, DIC and HCO−
3 (axis 1; 60.4% of the variation), mostlyseparating the mid-CO2 and high-CO2 treatments from the con-trols (Supplementary Figure 4B). The alkalinity also influencedthese free-living Gammaproteobacteria communities, comparedto the whole community (Axis 2; 34.6% of the variation).
DISCUSSIONCOMMUNITY DIFFERENCESThe goal of our study was to assess the major components ofthe community changed, in terms of phylogenetic and taxonomicstructure, in response to short-term pH modifications. Miller
FIGURE 5 | Phylogenetic clustering of the Arctic pelagic microbial
communities exposed to different CO2 concentrations. Net-relatednessindex (NRI, based on mean pairwise distances) measures branch-tip
phylogenetic clustering. Sample color code as in Figure 1. Asterisks indicatetaxonomic groups with significantly different NRI between conditions(ANOVA; ∗P < 0.1, ∗∗P < 0.05, ∗∗∗P < 0.01).
www.frontiersin.org September 2014 | Volume 5 | Article 490 | 7

Monier et al. Ocean acidification and Arctic bacteria
et al. (2011) reported rapid increases in pCO2 below Arctic iceand for this reason the experiments were carried out over 6days to assess community response to such short-term increasesin CO2. A major goal was to assess whether such increaseswould change the community structure, for example by select-ing taxa more able to cope with more acidic conditions or ifthe community remained the same, implying more physiologi-cal plasticity among the microbes present. It would follow thatif communities are plastic then these communities would remaintaxonomically stable over the long term, despite anthropogenicincreases of pCO2, provided these changes were of the same order.The NRI values provided us with a means of comparing thephylogenetic structure of the natural and CO2-exposed commu-nities. The advantage of this approach is that it is independentfrom any “taxonomic lexicon,” that is, the phylogenetic informa-tion is used directly rather than mapping OTUs onto taxonomicinformation. Using NRI, we could determine and test for thefluctuations in phylogenetic structure across natural, control andCO2-exposed communities, rather than just relying on taxonomicnomenclature.
The major differences detected were between the attachedand free-living communities, with significant differences in beta-diversity, taxonomy, and phylogenetic structure in free-livingcompared to the particle-attached communities (Figures 1, 2).Although in the open ocean the differences between attachedand free-living communities vary, generally there are differencesin coastal regions (Campbell and Kirchman, 2012; Mohit et al.,2014). Most studies in the Arctic are in more coastal waters,and it is clear that the particles represent a distinct environ-ment in these regions (Garneau et al., 2006, 2009), as well asin the more offshore Beaufort Sea open ocean region (Kelloggand Deming, 2009; Ortega-Retuerta et al., 2013). Differencesin taxonomic compositions of the particle-attached and free-living communities are likely dependent on the origin and age ofparticles, which influences their physical properties and organiccontent (Pinhassi et al., 1999; Ortega-Retuerta et al., 2013). Interms of alpha-diversity, the Arctic free-living communities weremore diverse than the particle-attached assemblages (Figure 2).Interestingly Kellogg and Deming (2009) reported lower diversityfor attached than free-living communities in the Laptev Sea, how-ever in Kongsfjord, Svalbard and along the Beaufort Shelf particleattached bacteria were more diverse (Ortega-Retuerta et al., 2013;Sperling et al., 2013). This limited data would be consistent withregions away from direct river or coastal influence having lessdiverse particle types and as a consequence the attached bacte-ria are less diverse. Our data could therefore be indicative of thewinter-time conditions when there is minimal river and/or coastalinfluence.
The attached communities in our study were also more over-dispersed than the free-living, which would be consistent withpatchiness of particles within the environment and an artifact ofthe low volumes filtered. Each particle can be considered as a dis-tinct habitat, with an initial founder community that is graduallyreplaced by a succession of bacteria that eventually results in thecomplete the degradation of the particle (Huston and Deming,2002; Arnosti, 2008). The effect would force the net relatednessindex of their combined communities to be over-dispersed. In
contrast, the free-living organisms are affected by the environ-mental conditions at smaller scales and an incubation volumeof 2 L would include more of the range of possible conditionsselecting for a more closely related consortium. In sum, theattached communities may have been under-sampled, causingthis lower overall diversity and strong variability. Neither commu-nity reached asymptotic and further high-throughput samplingmay be required.
In general, for the Arctic marine microbial communities foundin our study, the experimental CO2 enrichment had little influ-ence on alpha- or beta-diversity. Other studies of ocean acidifi-cation on Arctic marine bacterioplankton communities similarlyreport that acidification does not appear to be a major fac-tor influencing microbial community assemblages. A mesocosmacidification experiment on Arctic plankton communities car-ried out in Kongsfjord Svalbard revealed that the compositionalchange was explained by a concomitant phytoplankton bloomand temperature changes with little or no effect attributed directlyto acidification levels (Roy et al., 2013). Sperling et al. (2013) sug-gested that any effect of acidification was indirectly a response toviral lysis of phytoplankton in the post-bloom phase under higherCO2 leading to the release of particulate organic substrates, whichstimulated the bacterial community. Since we did not create abloom in our experiment, nor monitor viral production, the twoexperiments are difficult to reconcile, except to state that acidifica-tion per se probably has little influence on bacterial communitiesin the Arctic over the short term. Indeed, although there was widevariability, the results of the CCA analysis suggest that in severalcases alkalinity was a stronger driver than pH or pCO2 conditions(Supplementary Figures 3, 4). Alkalinity shifts could be impor-tant for the Arctic, as alkalinity is influenced by freshening andriver inputs and flow, and thus requires further investigation.
For the free-living fraction there were more instances ofchanges between the in situ and control communities com-pared to the in situ and high CO2 treatments in our study,suggesting that a parameter in the higher CO2 treatments com-pensated for containerization. In contrast, there was no suchpattern in the attached communities. Similarly, Allgaier et al.(2008) reported changes in the community of free-living bac-teria but not in the larger size fraction in response to changesin acidification. Roy et al. (2013) also found a greater effecton the Gammaproteobacteria in the free-living fraction thanwith the particle-attached communities at higher pCO2 levels.A more pronounced response of the smaller free-living cells tothe ambient conditions may be a consequence the greater influ-ence of molecular diffusive processes on smaller cells (Yoshiyamaand Klausmeier, 2008), whereas bacteria attached to particlesare more likely to be surrounded by larger organic molecules(Malfatti and Azam, 2009) offering some protection from rapidchemical changes in the environment. However, the net effecton bacterial production is a separate question, which we did notaddress as we did not measure production. Interestingly, Grossartet al. (2006), found that in response to high pCO2, particle-attached communities were more active, in terms of proteinproduction, than the free-living communities.
In most previous acidification experiments on microbialcommunities, changes in the bacterial communities were closely
Frontiers in Microbiology | Extreme Microbiology September 2014 | Volume 5 | Article 490 | 8

Monier et al. Ocean acidification and Arctic bacteria
correlated with system productivity (Grossart et al., 2006; Allgaieret al., 2008; Roy et al., 2013). Additionally, Newbold et al. (2012)showed that acidification has a greater effect on picoeukaryotesthan bacteria, supporting the idea that the changing pCO2 con-ditions have an indirect effect on bacterial communities throughthe re-structuring of phytoplankton communities. Additionally,acidification could hamper compositional shifts orchestrated byother environmental variables, as indicated by reports that theshift in Arctic bacterial community composition induced by glu-cose amendments is mitigated under acidified conditions (Rayet al., 2012). Therefore, although increased pCO2 had little directimpacts on the prokaryote taxonomic composition and phyloge-netic structure, it could have indirect effects on microbial com-munities. The Catlin Arctic Survey also investigated the effectsof OA at higher trophic levels and report that Pteropods wereonly weakly affected by acidification (Comeau et al., 2012) andcopepod species showed contrasting responses to acidification,with the small Oithona species reacting more strongly than thelarger Calanus (Lewis et al., 2013). The latter conducts deep ver-tical migrations through the water column under the winter icewhereas Oithona stay in the surface water layer. Hence Calanusand similarly the pteropods, are regularly exposed to varyingconcentrations of CO2 as they undergo their daily vertical migra-tion, potentially making them less sensitive to changes in CO2
compared to the smaller non-vertically migrating Oithona (Lewiset al., 2013). These contrasting results across the food webs war-rant further, collaborative investigations into whole ecosystemresponses to OA. In addition, to predict the net effects of OA thereis a need to evaluate the indirect responses of microbial commu-nities perhaps by investigating many communities under a rangeof conditions including naturally high CO2 conditions related toincreased photosynthesis or venting.
The minimal responses of bacterial communities to acidifica-tion reported here and elsewhere are likely the result of a toleranceof the microbial communities to changes in pH and CO2 estab-lished by the natural variability in ocean conditions (McNeil,2010; McNeil et al., 2010; Gilbert, 2011). Daily pH variability iscaused by tides, upwelling of deep waters and other ocean pro-cesses affecting mostly coastal systems and causing fluctuationsof pH > 0.25 (Hofmann et al., 2011). While daily variability isless accentuated in the Antarctic (McNeil, 2010; Matson et al.,2011), there is limited comparable data for the Arctic. Howeverformation and melting of ice can heighten the extent of pHand pCO2 excursions that microbial communities must contendwith on a seasonal scale (Shadwick et al., 2013). The presenceof sea ice induces a disequilibrium of CO2 exchanges betweenthe water and the atmosphere, and during its formation expul-sion of brines containing higher concentrations of Total InorganicCarbon (TIC) into the underlying waters will cause an increase intheir pCO2 content (Miller et al., 2011).
Moreover, a large part of the seasonal variability in the ArcticOcean pH and pCO2 is a consequence of microbial activities; het-erotrophic bacterial communities tend to increase pCO2 throughrespiration within and under the ice (Bates and Mathis, 2009;Nguyen et al., 2012). These biologically induced changes in pHand pCO2 take place on time scales much shorter than the pro-jected OA due to climate change. The marine microorganisms
behind these biogeochemical processes might already be adaptedto respond to varying pH and pCO2 conditions. Indeed, pH andpCO2 also varies with depth, and hence microbial assemblagescan contain similar bacterial lineages along a range of condi-tions (DeLong et al., 2006). This spatial and temporal variabilityis consistent with our results in the sense that the experimentalCO2 treatments were likely not far outside the range of naturalshort-term variability experienced by the microbial communityas a whole, thus precluding any marked taxonomic changes in thecommunities.
HIGHER TAXONOMIC RESOLUTION: GAMMAPROTEOBACTERIAGammaproteobacteria were by far the most abundant taxa inboth size fractions, consistent with the report of clone librariesof >3 and <3 µm fractions dominated by Gammaproteobacteriain the Laptev Sea (Kellogg and Deming, 2009). In contrast, Collinset al. (2010) found Alphaproteobacteria to dominate the micro-bial communities, mostly from the SAR11 clade during the sameseason as our study. Alonso-Sáez et al. (2012) found, using flu-orescence in situ hybridizations combined with autoradiography,that under the ice Gammaproteobacteria appeared at lower con-centrations but had a greater proportion of active cells comparedto the numerically dominant SAR11 clade.
In contrast to reports from post-bloom conditions, whereGammaproteobacteria are the only free-living taxon affected byacidification (Roy et al., 2013), the Gammaproteobacteria relativeabundance did not vary with containment or CO2-treatment inour experiment. Nonetheless, exploring higher taxonomic resolu-tions revealed some variability within the Gammaproteobacteriamostly in response to containment. Alternomonadales in the free-living community increased when contained in the incubationbottles, but was nearer the in situ proportion in the higher CO2
treatments. Alternomonadales are among the most easily iso-lated marine bacteria from enrichment cultures (Lovejoy personalobservation) and the change in pH may have influenced quo-rum sensing in the containers. In the particle-attached fractionthe Oceanospirillales were significantly less abundant in all exper-imental bottles compared to the in situ samples, and may havereflected a lack of suitable high molecular weight substrate forthis group or the effect of the 50 micron pre-screening if theOceanospirillales were associated with animals (La Riviere et al.,2013).
In terms of phylogenetic structure, Gammaproteobacteriadid not show significant responses to either acidification orbottle containment. This resilience of Gammaproteobacteria toincreased CO2 levels could be linked to maintenance of intracellu-lar pH homeostasis at higher environmental CO2, as reported forseveral Gammaproteobacteria species (Zhao and Houry, 2010).
The in situ prevalence of free-living archaeal Thaumarcheota,in surface waters of the Arctic has been reported previously(Garneau et al., 2006; Comeau et al., 2011), although they repre-sented <10% of the total prokaryote reads, compared to 18% inice-covered surface waters of the Beaufort Sea (Alonso-Sáez et al.,2012). The lower relative abundance of Thaumarcheota in ourstudy may have been related to substrate availability (Pedneaultet al., 2014). Alternatively, methodological differences and primerbias cannot be discounted. The somewhat significant differences
www.frontiersin.org September 2014 | Volume 5 | Article 490 | 9

Monier et al. Ocean acidification and Arctic bacteria
in the Thaumarcheota among experimental treatments appear tobe more closely linked to containment than to the effects of CO2
(Supplementary Table 2).
BOTTLE AND MULTIPLE DOMAIN EFFECTSOverall although we found a number of clusters with high sup-port suggesting similarity of communities, there was no clearassociation with any particular treatment and we were not ableto identify any factors driving community composition. In fact,this suggests that there were a finite number of community out-comes from the starting community and stochastic processes werepredominant. Containment facilitates experimental manipula-tion of growth conditions and is a valuable tool for understandinghow living organisms and communities react to specific vari-ables, it can also be used to select for species with traits thatenable growth under specific conditions (Zobell, 1943; Fergusonet al., 1984; Massana et al., 2001). However, in nature planktonare subjected to advective flow and diffusion in addition to bio-logical processes and interactions. Since containment ceases theadvective flow of cells, nutrients, and metabolites, it can causebias by what is referred to as the "bottle effect" (Whipple, 1901).Here we compared in situ samples with ambiant-CO2, mid-CO2
and high CO2conditions, with the aim to control for the effectof experimental confinement on natural bacterial communitycomposition. In fact, the majority of the significant changes intaxonomic abundance and phylogenetic structure, particularlyfor the attached communities, were in response to containment.
Interestingly more significant changes were observed betweenthe in situ and the control (ambiant-CO2) bottles, with fewer dif-ferences detected between the in situ and mid- and high-CO2
treatments. Hence, we cannot rule out that higher CO2 may haveinfluenced some unmeasured factors including viral infection orpredation, which could increase within bottles, therefore mimick-ing the effects of a more open “natural” system, where growth andloss rates are balanced.
In contrast to other studies on Arctic waters, we have mon-itored the effects of acidification on Bacteria and Archaea com-munities independent of a phytoplankton bloom and suggestthat some of the reported effects on bacterial communities wereindirect and due to higher primary production and perhaps addi-tional containment effects. While it has been suggested that OAshould not have a significant impact on ocean biogeochemicalprocesses, aside from calcification (Joint et al., 2010), the strongbottle effects suggests we are hampered in our ability to gen-uinely test the effect of acidification on microbial communities.However, despite this we were able to detect small shifts in phy-logenetic structure and diversity that could have subtle effectson the maintenance of functionality in a complex community.New in situ tools need to be developed that could monitor suchchanges.
AUTHOR CONTRIBUTIONSAll authors wrote the article; Helen S. Findlay designed and con-ducted field and experimental work; Adam Monier and ConnieLovejoy designed bioinformatics analyses; Adam Monier con-ducted bioinformatics analyses; Sophie Charvet conducted CCAanalysis and provided logistic support:.
ACKNOWLEDGMENTSThe Catlin Arctic Survey was funded by Catlin Ltd. and coor-dinated by Geo Mission Ltd. Helen S. Findlay was supportedby the PML Lord Kingsland Fellowship and received the RalphBrown Expedition Grant from the Royal Geographical Society(with IBG) and a Royal Society Travel Grant. The authors areextremely grateful to the Ice Base and Geo Missions staff for theirsupport in carrying out field work, and the other field scientistsfor assistance in the field. The authors thank J. Gilbert, ArgonneNational Laboratory, for discussions on experimental design andfor sequence analysis. Sample processing, sequencing and coreamplicon data analysis were performed by the Earth MicrobiomeProject (www.earthmicrobiome.org) and all amplicon and meta-data have been made public through the data portal (www.
microbio.me/emp). Computing support from CLUMEQ andCompute Canada was appreciated. Partial funding for data analy-ses was from a Natural Science and Engineering Council (NSERC)of Canada and a discovery grant to Connie Lovejoy. AdamMonier is funded through the Canadian Excellence ResearchChair (CERC) in remote sensing of Canada’s new Arctic frontier.This is a contribution to ArcticNet.
SUPPLEMENTARY MATERIALThe Supplementary Material for this article can be foundonline at: http://www.frontiersin.org/journal/10.3389/fmicb.
2014.00490/abstract
REFERENCESAljanabi, S. M., and Martinez, I. (1997). Universal and rapid salt-extraction of
high quality genomic DNA for PCR-based techniques. Nucleic Acids Res. 25,4692–4693. doi: 10.1093/nar/25.22.4692
Allgaier, M., Riebesell, U., Vogt, M., Thyrhaug, R., and Grossart, H.-P. (2008).Coupling of heterotrophic bacteria to phytoplankton bloom development atdifferent pCO 2 levels: a mesocosm study. Biogeosciences 5, 1007–1022. doi:10.5194/bg-5-1007-2008
Alonso-Sáez, L., Waller, A. S., Mende, D. R., Bakker, K., Farnelid, H., Yager, P. L.,et al. (2012). Role for urea in nitrification by polar marine Archaea. Proc. Natl.Acad. Sci. U.S.A. 109, 17989–17994. doi: 10.1073/pnas.1201914109
Arnosti, C. (2008). Functional differences between Arctic seawater and sedimentarymicrobial communities: contrasts in microbial hydrolysis of complex substrates.FEMS Microbiol. Ecol. 66, 343–351. doi: 10.1111/j.1574-6941.2008.00587.x
Azam, F., and Malfatti, F. (2007). Microbial structuring of marine ecosystems. Nat.Rev. Microbiol. 5, 782–791. doi: 10.1038/nrmicro1747
Bates, N. R., and Mathis, J. T. (2009). The Arctic Ocean marine carbon cycle: eval-uation of air-sea CO 2 exchanges, ocean acidification impacts and potentialfeedbacks. Biogeosciences 6, 2433–2459. doi: 10.5194/bg-6-2433-2009
Bates, N. R., Mathis, J. T., and Cooper, L. W. (2009). Ocean acidification and biolog-ically induced seasonality of carbonate mineral saturation states in the westernArctic Ocean. J. Geophys. Res. 114, 1978–2012. doi: 10.1029/2008JC004862
Caldeira, K., and Wickett, M. E. (2003). Oceanography: anthropogenic carbon andocean pH. Nature 425, 365–365. doi: 10.1038/425365a
Campbell, B. J., and Kirchman, D. L. (2012). Bacterial diversity, community struc-ture and potential growth rates along an estuarine salinity gradient. ISME J. 7,210–220. doi: 10.1038/ismej.2012.93
Caporaso, J. G., Bittinger, K., Bushman, F. D., DeSantis, T. Z., Andersen, G. L.,and Knight, R. (2010a). PyNAST: a flexible tool for aligning sequences to atemplate alignment. Bioinformatics 26, 266–267. doi: 10.1093/bioinformatics/btp636
Caporaso, J. G., Kuczynski, J., Stombaugh, J., Bittinger, K., Bushman, F. D., Costello,E. K. et al. (2010b). QIIME allows analysis of high-throughput communitysequencing data. Nat. Methods 7, 335–336. doi: 10.1038/nmeth.f.303
Cole, J. R., Wang, Q., Cardenas, E., Fish, J., Chai, B., Farris, R. J., et al.(2007). The ribosomal database project (RDP-II): introducing myRDP space
Frontiers in Microbiology | Extreme Microbiology September 2014 | Volume 5 | Article 490 | 10

Monier et al. Ocean acidification and Arctic bacteria
and quality controlled public data. Nucleic Acids Res. 35, D169–D172. doi:10.1093/nar/gkl889
Collins, R. E., Rocap, G., and Deming, J. W. (2010). Persistence of bacterial andarchaeal communities in sea ice through an Arctic winter. Environ. Microbiol.12, 1828–1841. doi: 10.1111/j.1462-2920.2010.02179.x
Comeau, A. M., Li, W. K. W., Tremblay, J.-É., Carmack, E. C., and Lovejoy,C. (2011). Arctic ocean microbial community structure before and after the2007 record sea ice minimum. PLoS ONE 6:e27492. doi: 10.1371/journal.pone.0027492
Comeau, S., Alliouane, S., and Gattuso, J.-P. (2012). Effects of ocean acidificationon overwintering juvenile Arctic pteropods Limacina helicina. Mar. Ecol. Prog.Ser. 456, 279–284. doi: 10.3354/meps09696
DeLong, E. F., Preston, C. M., Mincer, T., Rich, V., Hallam, S. J., Frigaard,N.-U., et al. (2006). Community genomics among stratified microbial assem-blages in the ocean’s interior. Science 311, 496–503. doi: 10.1126/science.1120250
Dickson, A. G., Sabine, C. L., and Christian, J. R. (2007). Guide to Best Practices forOcean CO2 Measurements. Sidney: North Pacific Marine Science Organization.
Doney, S. C., Fabry, V. J., Feely, R. A., and Kleypas, J. A. (2009). Ocean acidification:the other CO2 problem. Marine Sci. 1, 169–192. doi: 10.1146/annurev.marine.010908.163834
Edgar, R. C. (2010). Search and clustering orders of magnitude faster than BLAST.Bioinformatics 26, 2460–2461. doi: 10.1093/bioinformatics/btq461
Edgar, R. C., Haas, B. J., Clemente, J. C., Quince, C., and Knight, R. (2011).UCHIME improves sensitivity and speed of chimera detection. Bioinformatics27, 2194–2200. doi: 10.1093/bioinformatics/btr381
Ferguson, R. L., Buckley, E. N., and Palumbo, A. V. (1984). Response of marinebacterioplankton to differential filtration and confinement. Appl. Environ.Microbiol. 47, 49–55.
Galand, P. E., Alonso-Sáez, L., Bertilsson, S., Lovejoy, C., and Casamayor, E. O.(2013). Contrasting activity patterns determined by BrdU incorporation in bac-terial ribotypes from the Arctic Ocean in winter. Front. Microbiol. 4:118. doi:10.3389/fmicb.2013.00118
Galand, P. E., Lovejoy, C., Pouliot, J., Garneau, M.-E., and Vincent, W. F. (2008).Microbial community diversity and heterotrophic production in a coastal Arcticecosystem: a stamukhi lake and its source waters. Limnol. Oceanogr. 53, 813. doi:10.4319/lo.2008.53.2.0813
Garneau, M.-E., Roy, S., Lovejoy, C., Gratton, Y., and Vincent, W. F. (2008).Seasonal dynamics of bacterial biomass and production in a coastal arc-tic ecosystem: Franklin Bay, western Canadian Arctic. J. Geophys. Res. 113,1978–2012. doi: 10.1029/2007JC004281
Garneau, M.-E., Vincent, W. F., Alonso-Sáez, L., Gratton, Y., and Lovejoy, C.(2006). Prokaryotic community structure and heterotrophic production in ariver-influenced coastal arctic ecosystem. Aquat. Microb. Ecol. 42, 27–40. doi:10.3354/ame042027
Garneau, M.-E., Vincent, W. F., Terrado, R., and Lovejoy, C. (2009). Importanceof particle-associated bacterial heterotrophy in a coastal Arctic ecosystem.J. Marine Syst. 75, 185–197. doi: 10.1016/j.jmarsys.2008.09.002
Gilbert, B. (2011). Joint consequences of dispersal and niche overlap onlocal diversity and resource use. J. Ecol. 100, 287–296. doi: 10.1111/j.1365-2745.2011.01908.x
Grossart, H.-P., Allgaier, M., Passow, U., and Riebesell, U. (2006). Testing the effectof CO2 concentration on dynamics of marine heterotrophic bacterioplankton.Limnol. Oceanogr. 51, 1–11. doi: 10.4319/lo.2006.51.1.0001
Hammer, Ø., Harper, D., and Ryan, P. D. (2009). PAST-PAlaeontological STatistics,Ver. 1.89.
Harding, T., Jungblut, A. D., Lovejoy, C., and Vincent, W. F. (2011). Microbesin high arctic snow and implications for the cold biosphere. Appl. Environ.Microbiol. 77, 3234–3243. doi: 10.1128/AEM.02611-10
Hofmann, G. E., Smith, J. E., Johnson, K. S., Send, U., Levin, L. A., Micheli, F., et al.(2011). High-frequency dynamics of ocean pH: a multi-ecosystem comparison.PLoS ONE 6:e28983. doi: 10.1371/journal.pone.0028983
Huston, A. L., and Deming, J. W. (2002). Relationships between micro-bial extracellular enzymatic activity and suspended and sinking particu-late organic matter: seasonal transformations in the North Water. Deep SeaRes. II Top. Stud. Oceanogr. 49, 5211–5225. doi: 10.1016/S0967-0645(02)00186-8
Joint, I., Doney, S. C., and Karl, D. M. (2010). Will ocean acidification affect marinemicrobes and quest. ISME J. 5, 1–7. doi: 10.1038/ismej.2010.79
Junge, K., Eicken, H., and Deming, J. W. (2004). Bacterial activity at- 2 to- 20C in Arctic wintertime sea ice. Appl. Environ. Microbiol. 70, 550–557. doi:10.1128/AEM.70.1.550-557.2004
Kellogg, C. T., and Deming, J. W. (2009). Comparison of free-living, suspended par-ticle, and aggregate-associated bacterial and archaeal communities in the LaptevSea. Aquat. Microb. Ecol. 57, 1–18. doi: 10.3354/ame01317
Kembel, S. W., Cowan, P. D., Helmus, M. R., Cornwell, W. K., Morlon, H., Ackerly,D. D., et al. (2010). Picante: R tools for integrating phylogenies and ecology.Bioinformatics 26, 1463–1464. doi: 10.1093/bioinformatics/btq166
Krembs, C. E., Eicken, H., Junge, K., and Deming, J. W. (2002). High concentrationsof exopolymeric substances in Arctic winter sea ice: implications for the polarocean carbon cycle and cryoprotection of diatoms. Deep Sea Res. I Oceanogr.Res. Pap. 49, 2163–2181. doi: 10.1016/S0967-0637(02)00122-X
La Riviere, M., Roumagnac, M., Garrabou, J., and Bally, M. (2013). Transient shiftsin bacterial communities associated with the temperate gorgonian Paramuriceaclavata in the Northwestern Mediterranean Sea. PLoS ONE 8:e57385 doi:10.1371/journal.pone.0057385
Lavigne, H., and Gattuso, J.-P. (2010). Seacarb: Seawater Carbonate Chemistry withR. R Package Version 2.3. 3.
Lewis, C. N., Brown, K. A., Edwards, L. A., Cooper, G., and Findlay, H. S. (2013).Sensitivity to ocean acidification parallels natural pCO2 gradients experiencedby Arctic copepods under winter sea ice. Proc. Natl. Acad. Sci. U.S.A. 110,E4960–E4967. doi: 10.1073/pnas.1315162110
Liu, J., Weinbauer, M. G., Maier, C., Dai, M., and Gattuso, J.-P. (2010). Effectof ocean acidification on microbial diversity and on microbe-driven biogeo-chemistry and ecosystem functioning. Aquat. Microb. Ecol. 61, 291–305. doi:10.3354/ame01446
Lozupone, C., and Knight, R. (2005). UniFrac: a new phylogenetic method for com-paring microbial communities. Appl. Environ. Microbiol. 71, 8228–8235. doi:10.1128/AEM.71.12.8228-8235.2005
Malfatti, F., and Azam, F. (2009). Atomic force microscopy reveals microscale net-works and possible symbioses among pelagic marine bacteria. Aquat. Microb.Ecol. 58, 1–14. doi: 10.3354/ame01355
Massana, R., Pedrós-Alió, C., Casamayor, E. O., and Gasol, J. M. (2001).Changes in marine bacterioplankton phylogenetic composition during incu-bations designed to measure biogeochemically significant parameters. Limnol.Oceanogr. 46, 1181–1188. doi: 10.4319/lo.2001.46.5.1181
Mathis, J. T., Pickart, R. S., Byrne, R. H., McNeil, C. L., Moore, G., Juranek, L. W.,et al. (2012). Storm-induced upwelling of high pCO2 waters onto the continen-tal shelf of the western Arctic Ocean and implications for carbonate mineralsaturation states. Geophys. Res. Lett. 39:L07606. doi: 10.1029/2012GL051574
Matson, P. G., Martz, T. R., and Hofmann, G. E. (2011). High-frequency observa-tions of pH under Antarctic sea ice in the southern Ross Sea. Antarct. Sci. 23,607–613. doi: 10.1017/S0954102011000551
McNeil, B. I. (2010). Diagnosing coastal ocean CO2 interannual variability froma 40 year hydrographic time series station off the east coast of Australia. Glob.Biogeochem. Cycles 24:GB4034. doi: 10.1029/2010GB003870
McNeil, B. I., Tagliabue, A., and Sweeney, C. (2010). A multi-decadal delayin the onset of corrosive “acidified” waters in the Ross Sea of Antarcticadue to strong air-sea CO2 disequilibrium. Geophys. Res. Lett. 37:L19607. doi:10.1029/2010GL044597
Meyer, F., Paarmann, D., D’Souza, M., Olson, R., Glass, E. M., Kubal, M., et al.(2008). The metagenomics RAST server–a public resource for the automaticphylogenetic and functional analysis of metagenomes. BMC Bioinformatics9:386. doi: 10.1186/1471-2105-9-386
Miller, L. A., Papakyriakou, T. N., Collins, R. E., Deming, J. W., Ehn, J. K.,Macdonald, R. W., et al. (2011). Carbon dynamics in sea ice: a winter flux timeseries. J. Geophys. Res. 116, 1978–2012. doi: 10.1029/2009JC006058
Mohit, V., Archambault, P., Toupoint, N., and Lovejoy, C. (2014). Phylogenetic dif-ferences in attached and free-living bacterial communities in a temperate coastallagoon during summer, revealed via high-throughput 16S rRNA gene sequenc-ing. Appl. Environ. Microbiol. 80, 2071–2083. doi: 10.1128/AEM.02916-13
Mühling, M., Fuller, N. J., Somerfield, P. J., Post, A. F., Wilson, W. H., Scanlan, D. J.,et al. (2006). High resolution genetic diversity studies of marine Synechococcusisolates using rpoC1-based restriction fragment length polymorphism. Aquat.Microb. Ecol. 45, 263–275. doi: 10.3354/ame045263
Newbold, L. K., Oliver, A. E., Booth, T., Tiwari, B., DeSantis, T., Maguire, M., et al.(2012). The response of marine picoplankton to ocean acidification. Environ.Microbiol. 14, 2293–2307. doi: 10.1111/j.1462-2920.2012.02762.x
www.frontiersin.org September 2014 | Volume 5 | Article 490 | 11

Monier et al. Ocean acidification and Arctic bacteria
Nguyen, D., Maranger, R., Tremblay, J.-É., and Gosselin, M. (2012). Respirationand bacterial carbon dynamics in the Amundsen Gulf, western Canadian Arctic.J. Geophys. Res. 117, 1978–2012. doi: 10.1029/2011JC007343
Ortega-Retuerta, E., Joux, F., Jeffrey, W. H., and Ghiglione, J. F. (2013). Spatial vari-ability of particle-attached and free-living bacterial diversity in surface watersfrom the Mackenzie River to the Beaufort Sea (Canadian Arctic). Biogeosciences10, 2747–2759. doi: 10.5194/bg-10-2747-2013
Pedneault, E., Galand, P. E., Potvin, M., Tremblay, J.-É., and Lovejoy, C. (2014).Archaeal amoA and ureC genes and their transcriptional activity in the ArcticOcean. Sci. Rep. 4:4661. doi: 10.1038/srep04661
Pinhassi, J., Azam, F., Hemphälä, J., Long, R. A., Martinez, J., Zweifel, U. L., et al.(1999). Coupling between bacterioplankton species composition, populationdynamics, and organic matter degradation. Aquat. Microb. Ecol. 17:13. doi:10.3354/ame017013
Price, M. N., Dehal, P. S., and Arkin, A. P. (2010). FastTree 2–approximatelymaximum-likelihood trees for large alignments. PLoS ONE 5:e9490. doi:10.1371/journal.pone.0009490
Raven, J., Caldeira, K., Elderfield, H., Hoegh-Guldberg, O., Liss, P., Riebesell, U.,et al. (2005). Ocean Acidification Due to Increasing Atmospheric Carbon Dioxide.London: The Royal Society.
Ray, J. L., Töpper, B., An, S., Silyakova, A., Spindelböck, J., Thyrhaug, R., et al.(2012). Effect of increased pCO2 on bacterial assemblage shifts in response toglucose addition in Fram Strait seawater mesocosms. FEMS Microbiol. Ecol. 82,713–723. doi: 10.1111/j.1574-6941.2012.01443.x
Rich, J., Gosselin, M., Sherr, E., Sherr, B., and Kirchman, D. L. (1997). High bac-terial production, uptake and concentrations of dissolved organic matter in theCentral Arctic Ocean. Deep Sea Res. II Top. Stud. Oceanogr. 44, 1645–1663. doi:10.1016/S0967-0645(97)00058-1
Riebesell, U., Fabry, V. J., Hansson, L., and Gattuso, J.-P. (2010). Guide to BestPractices for Ocean Acidification Research and Data Reporting. Luxembourg:Publications Office of the European Union Luxembourg.
Rochelle-Newall, E., Delille, B., Frankignoulle, M., Gattuso, J.-P., Jacquet, S.,Riebesell, U., et al. (2004). Chromophoric dissolved organic matter in exper-imental mesocosms maintained under different pCO2 levels. Mar. Ecol. Prog.Ser. 272, 25–31. doi: 10.3354/meps272025
Roy, A.-S., Gibbons, S. M., Schunck, H., Owens, S., Caporaso, J. G., Sperling, M.,et al. (2013). Ocean acidification shows negligible impacts on high-latitudebacterial community structure in coastal pelagic mesocosms. Biogeosciences 10,555–566. doi: 10.5194/bg-10-555-2013
Sabine, C. L., Feely, R. A., Gruber, N., Key, R. M., Lee, K., Bullister, J. L., et al.(2004). The oceanic sink for anthropogenic CO2. Science 305, 367–371. doi:10.1126/science.1097403
Sarmiento, J. L., Gloor, M., Gruber, N., Beaulieu, C., Jacobson, A. R., MikaloffFletcher, S. E., et al. (2010). Trends and regional distributions of land and oceancarbon sinks. Biogeosciences 7, 2351–2367. doi: 10.5194/bg-7-2351-2010
Shadwick, E. H., Trull, T. W., Thomas, H., and Gibson, J. (2013). Vulnerability ofpolar oceans to anthropogenic acidification: comparison of arctic and antarcticseasonal cycles. Sci. Rep. 3:2339. doi: 10.1038/srep02339
Sperling, M., Piontek, J., Gerdts, G., Wichels, A., Schunck, H., Roy, A. S., et al.(2013). Effect of elevated CO2 on the dynamics of particle-attached and
free-living bacterioplankton communities in an Arctic fjord. Biogeosciences 10,181–191. doi: 10.5194/bg-10-181-2013
Steinacher, M., Joos, F., Frölicher, T. L., Plattner, G.-K., and Doney, S. C. (2009).Imminent ocean acidification in the Arctic projected with the NCAR globalcoupled carbon cycle-climate model. Biogeosciences 6, 515–533. doi: 10.5194/bg-6-515-2009
Tanaka, T., Thingstad, T. F., Lovdal, T., Grossart, H.-P., Larsen, A., Allgaier, M.,et al. (2008). Availability of phosphate for phytoplankton and bacteria and oflabile organic carbon for bacteria at different pCO2 levels in a mesocosm study.Biogeosciences 5, 669–678. doi: 10.5194/bg-5-669-2008
Thurber, R. V., Willner Hall, D., Rodriguez-Mueller, B., Desnues, C., Edwards,R. A., Angly, F., et al. (2009). Metagenomic analysis of stressed coral holo-bionts. Environ. Microbiol. 11, 2148–2163. doi: 10.1111/j.1462-2920.2009.01935.x
Wang, Q., Garrity, G. M., Tiedje, J. M., and Cole, J. R. (2007). Naive bayesianclassifier for rapid assignment of rRNA sequences into the new bacte-rial taxonomy. Appl. Environ. Microbiol. 73, 5261–5267. doi: 10.1128/AEM.00062-07
Webb, C. O., Ackerly, D. D., McPeek, M. A., and Donoghue, M. J. (2002).Phylogenies and community ecology. Annu. Rev. Ecol. Syst. 33, 475–505. doi:10.1146/annurev.ecolsys.33.010802.150448
Whipple, G. C. (1901). Changes that take place in the bacterial contents of watersduring transportation. Tech. Q. MIT 14, 21.
Yoshiyama, K., and Klausmeier, C. A. (2008). Optimal cell size for resource uptakein fluids: a new facet of resource competition. Am. Nat. 171, 59–70. doi:10.1086/523950
Zhao, B., and Houry, W. A. (2010). Acid stress response in enteropathogenicgammaproteobacteria: an aptitude for survival1. Biochem. Cell Biol. 88,301–314. doi: 10.1139/O09-182
Zobell, C. E. (1943). The effect of solid surfaces upon bacterial activity. J. Bacteriol.46, 39. doi: 10.1371/journal.pone.0057385
Conflict of Interest Statement: The authors declare that the research was con-ducted in the absence of any commercial or financial relationships that could beconstrued as a potential conflict of interest.
Received: 02 July 2014; accepted: 01 September 2014; published online: 29 September2014.Citation: Monier A, Findlay HS, Charvet S and Lovejoy C (2014) Late winter underice pelagic microbial communities in the high Arctic Ocean and the impact of short-term exposure to elevated CO2 levels. Front. Microbiol. 5:490. doi: 10.3389/fmicb.2014.00490This article was submitted to Extreme Microbiology, a section of the journal Frontiersin Microbiology.Copyright © 2014 Monier, Findlay, Charvet and Lovejoy. This is an open-accessarticle distributed under the terms of the Creative Commons Attribution License(CC BY). The use, distribution or reproduction in other forums is permitted, providedthe original author(s) or licensor are credited and that the original publication in thisjournal is cited, in accordance with accepted academic practice. No use, distribution orreproduction is permitted which does not comply with these terms.
Frontiers in Microbiology | Extreme Microbiology September 2014 | Volume 5 | Article 490 | 12