ofcollectionscanada.gc.ca/obj/s4/f2/dsk2/ftp04/mq22083.pdf · lastly, but by far the mos t...
TRANSCRIPT

The Enectiveness of Animation and N d o n in Cornputer-based Instruction
Tracy Hutcheson
A thesis presented in partial fulfiument-of the requkemenrs for the degree of Mater
of Arts
Depamnent of Psychology
Carle ton University
Ottawa, Ontario
January, 1997
O Tracy Hutcheson, 1997

National tibrary Bibliothèque nationale du Canada
Acquisitions and Acquisitions et Bibliographie Services seMces bibliographiques
395 Wellington Street 395, nie Wellington ûttawa ON KIA ON4 ûtfawa ON K I A ON4 Canada Canada
varale VolrsrtilérwKe
Our II& Noire r8Mrence
The author has granted a non- L'auteur a accordé une licence non exclusive licence allowing the exclusive permettant à la National Library of Canada to Bibliothèque nationale du Canada de reproduce, loan, distribute or sell reproduire, prêter, distribuer ou copies of this thesis in microfonn, vendre des copies de cette thèse sous paper or electronic formats. la forme de microfiche/film, de
reproduction sur papier ou sur foxmat électronique.
The author retains ownership of the L'auteur conserve la propriété du copyright in this thesis. Neither the droit d'auteur qui protège cette thèse. thesis nor substantial extracts fiom it Ni la thèse ni des extraits substantiels may be printed or otheIWise de celle-ci ne doivent être imprimés reproduced without the author's ou autrement reproduits sans son permission. autorisation.
Canada

Abstract
Subjects were given one of two computer leamkg tutorials on ANCOVA, the
statistical rechnique. Subjects perfomed no better on a quiz when expenencing an
animation tutorial with voice narration than subjects who experienced a non-
animation tutonal with no voice narration. Analyses on the quiz data, foilowing the
tutorial, revealed that both groups perforrned equally poor on fundamental concept
questions. Subjects pefionned poorly on animation-spatial questions, specially
designed to test the ANCOVA concepts in the animations. One of two possibilities
exisr, 1) that animations do not facilitate learning compared to non-animation static
graphics or, 2) this study, and much of the research, is deficient in testing
animations appropriately. A view is put forward that there is the possibility that
animation has not been tested appropriately and that it may yet prove to facilitate
learning-

Acknowledgrnents
1 would like to thank both of my thesis advisors, Dr. Richard Dillon and Dr.
Chris Herdmah Dr. Dillon's unwavering support and availability far exceed any
professor's I have yet encountered. His attention to detaü in W i ~ g has given me n
new appreciation for the incredible hard work involved in works of this nature. Dr.
Herdman's calming effec t in the midst of student panic, and his intelligent ideas
together with great writing s N s have taught me a great deal over the past several
Yeats.
1 wouId also iike to express my gratitude to Dr. JO Wood for her focusing
ideas.
Lastly, but by far the mos t important, 1 would Iike to thank my parmer of 1 2
years, Julie Makrai. Without Julie's temfic insight, patience, and occasional
document production expertise the completion of this thesis would never have been
possible. 1 cannot thank her enough for her support, love, and understanding.

Table of Contents
Acceptance F m Absmct Achowledgments Table of Contents List of Tables List of Figures List of Appendices
Introduction Background Research Purpose of the Present Research
Method Subjects Apparatu s Materials
Tutorial s w
Procedure
Results Quiz Question Types Analyses
Quizmrnacy Tutorial time and quiz time Page time and number of page accesses
Discussion The Possibility that Animations do not Help The Possibility that Animations have not been Adequately Evaluated
v 1
vii . . . VIli
Appendices

List of Tables
Table 1. Percent Conect on Quiz with Smdard Errors of the Mean 21
Table 2. Mean Time in Minutes to Complete the Quiz with Standard Errors of the Mean 24
Lit of Figures
Figure 1. Animation page. 5
Figure 2. Non-animation page. 12
Figure 3. Question 9: A spatial question 16
Figure 4. Question 20: An animation-spatial question 18
Figure 5. Percentage of people by condition who answered the question correct1 y for each type. 33
Figure 6. Mean time spent on page type by condition. 26
Figure 7. Number of accesses by page type by condition. 28

List of Appendices
Appendix A. Performan~e Quiz 40
Appendix B. Animation Narration 57
Appendix C. Mean Number of Page Accesses by Machine Type for Animation
Pages 60
AppendUt D. ANOVA Summary Table for Percentage Correct on the Quiz for ail
A c m c y Measures 61
Appendut E. Experimentai Instructions 62

Animation Effects 1
The Efféctiveness of Animation and Narration in Cornputer-Based Instruction
There is support for the position that appropriately designeci computer
graphics facilitate leaming in computer-based instruction (CBI) (Aiesandrini,
1987). For example, it has been suggested that graphics may serve as a mnemonic
for remembering both verbal information and concrete concepts (Paivio & Csapo,
1973; Pressley, 1976). Computer animation as a subset of computer graphics has
been enwuraged as a good method of presentation in CBI (Alesandrini, 1987;
Bork, 198 1; Caldwell, 1980). The primaxy goal of the current study was to
determine whether animation facilitated leaming as compared with sratic or non-
animation graphics when presented in a cornputer-based leaming tutorial.
Background Research
Computer technology continues to improve to make animation presenrari on
in CBI an attractive method to teach ad& in schools and in the workplace. The
majority of the animation research with adults, on the other hand does not show an
advanrage to leamhg when using animation graphics as compared to static (non-
animation) graphics (e.g., Caraballo, A., 1985; Caraballo, J., 1985; King, 1975;
Moore, Nawrocki, & Simutis, 1979; Rieber, 1989; Rieber, 1990; Rieber, Boyce &
Assad, 1990; Wong, 1994).' Rieber's (1990) review of the literature showed that
of dl the srudies with adults, only one (Baek & Lape, 1988) showed an effect for
animation and used sound methodology.
In one typical study, Rieber, Boyce and Assad (1990) presented subjects
with one of three CBI rutorials: an animation tutorial, a static graphic tutorial, and a
no-graphic tutorial. The tutorials explaineci and demonstrated Newton's laws of
For a comprehensive review of the literature see Rieber (1990) and Wong (1994).

Animation Effecis 2
motion. The motion in the static graphic tutorial was represented by m w s . The
no-graphic tutmial was presented with textual information alone. AU three tutorials
presented the same texr information. Immediately following the tutonal lesson,
subjecu were given a retention test of howledge of Newtonian p~c ip les . Rieber
et al. found no ciifferences in performance between subjects in any of the three
p u p s . The absence of a facilatory effect in the Rieber et al. study, however, may
have been due to the lack of dùection towards pertinent information during the
animations. Subjects may not have known what the important elements were to
look for in the animations. Baek and Layne (1988) suggest that the use of
animation must draw focus to the important features of the material k ing presented
if leamhg is to be facilitated
Baek and Layne (1988) found that animation facilitated leanllng when
attention was guided to the most pertinent details. They presented different groups
of subjects one of three CBI tutonals that contained eirher non-animation graphics,
animation graphics , or text-alone information. S ubjects were adrninis tered a pre-
test one day prior to the tutorial and a pst-test immediately following the tutorial
session. The pre-test and post-test contained the same questions.
The leaming objective was to teach the mathemafical rule of average speed which
was defined as the distance traveled divided by the time spent The mathematical
mle was defined in the tutonals as a way to show students the important
information on which to focus. Subjects then knew what elements on which to
focus in the animation examples that followed Subjects in the animation p u p did
better than subjects in the non-animation group, who in hm, did better than the
text-alone group. The results showed a significant but very small leaming effecr

Animation Effeccs 3
with a difference of 1 question correct out of 20 in the animation group (12 correct)
versus subjects in the non-animation group (10.9 correct). To conclude that this 5
percent difference was significant, number of questions correct on the pre-test was
used as a covariate in the analysis of the post-test data Thus the enor terni used in
the significance test on the pst-test scores was reduced by removing the subjecr
ciifferences in the pre-test. The importance of a smaii, but statistically significant
effect is questionable. In practical tems, resource cost (effort, time, and money)
associated with creating animations fa . exceeds those used to aeate non-
animations. The relative rnerits of using animation as opposed to non-animation
graphics is questionable for a 5 percent irnprovement that brought performance up
to 55 percent.
A third snidy relevant to the present research is Wong (1994). Wong
pruposed that subjects exposed to well-designed animations would do better than
subjects exposed to well-designed, non-animation graphics, but that subjects
exposed to poorly designed animations might actually do worse than subjects
exposed to weU-designed non-animatod graphics. Wong developed three cornputer
mtorials that presented infornation describing concepts of the analysis of
covariance (ANCOVA) statistical technique. There were two animation tutorials
with one designed using animation guidelines developed by Wong (1994). The
second animation tutonal used animations that did not follow the guidelines but
reflected common techniques used in commercial animation software. The third
rutonal used non-animation graphics. A typical screen for any of the three tutorials
included text information at the top and a non-animation graphic on the lower half
of the s m n . For an animation tutorid, an animation was set in motion by clicking

Animation Effects 4
the mouse on a button with an icon that resembled a movie projector. A typical
screen is shown in Figure 1.

Animation Effects 5
S o f 47
Ta dis tinguish between reading scores for the two groups, we will plat a sapamte frequency distribution for each gmup. Three things am noteworthy regarding the two distributions. 1. Them Is a clifferance between means on reading performance.
{Use Animate button.)
Figure 1. Animation page.

Animation Effects 6
Retention was measured by a quiz foUowing the preseniation of a tutonal.
Retention was worse with poorly designed animations than with welldesigned
static graphics (Wong, 1994, experiment 1). It is clear nom this resulr thar using
poorly designeci animations is worse than uskig well designed non-animation
graphics. Most important, Wong (1994) found that there was no retention
difference between a tutorid with well-designed animations and a tutorid with
equally well-designed non-animation graphics. There may be a number of reasons
why Wong failed to fhd retention fadiration with well-designed animations.
First, some questions on the quiz may not have appropnately probed the
i n f o d o n covered in the animations. Some quiz questions were not formulated
in a fom that was consistent with the spatial-relationai information in the
animations. To understand ANCOVA, subjects must understand the spatial relation
of data points and regression lines before and after the ANCOVA technique is
applied In the animation tutorial, spatial-relational infoxmation is conveyed in
graphical forrn through animations that show data and regression lines rotating.
The questions could berter target that h d of infmtion by asking subjec ts in an
analogous graphical form. It is helpfd if the cue at the time of testing be a cue
encoded at the time of acquiring that lmowledge (e.g., Flexsa and Tulving, 197 8;
Tulving and Osler, 1968; Tdving and Thompson 1973; Tulvhg and Wiseman,
1975; Tuiving, 1978). Multiple choice text questions may not accurately assess the
complex concepts taught using animations in the Wong (1994) study. Also, nor
every question used by Wong (1994) targeted content conveyed by the animations.
For example, a question that asked which event came first when performing an
ANCOVA was purely concemed with the sequence of events in the tutonal and not

with the information directly conveyed in any single animation. This question was
asked in a text multiple choice f m so it is incongruent with both spatial relation
information and animation content Resumably, as a resulk portions of the quiz
may have been successfuily answered from the textual infomiation alone without
the aid of animations.
Sccondly, in addition to the shortcomings in the quiz used by Wong, there
were problerns with the animations themselves. Subjects were not able to
simultaneously watch the animation and read the text information that complimenteci
the graphies, although they could conml when the animation would occur by
clicking a button. Subjects typically read the text orm mat ion and then watched the
animations, or vice versa Text information did rexnain available on the top half of
the screen during the animation. But this would draw their attention away from the
animation and they would m i s s part of it whiie attending to the text T'us, subjects
did not have access to important text information when it was most appropriate,
during the animations.
Pwpose of the Presenr Research
The current study was designed to extend the Wong (1994) study in two
ways.
Fmt, voice narration was added to the animation tutonal developed by
Wong (1994) in experiment 1. The narration was used as a guide or cue to
infoxmation unfolding in the animation and not as a replacement for the text
information that was provided with the tuional. Consistent with the
recommendation by Baek and Lape (1988), the voice nanation focuses the
subject's attention on important i n f o d o n and actions as the animation unfolds.

Animation Effects 8
The narration was a very brief phrase of several words timed to point out imponanr
or key aspects of the animation at the most appropriate time.
In addition, presentarion of narration with the animation is compatible with
Baddeley's working memory modeL Baddeley and Hitch (1974) proposed a
mulacomponent working memory model that consisa of an attenüonal connolier
component and two slave subsysterns: an adculatory loop and a visuo-spatial
sketchpad The dcuiatory loop is involved in the comprehension and
manipulation of speech-based information and the visuo-spatial sketc hpad is
assumed to set up and manipulate visual images. Baddeley's approach emphasizes
the role of working memory in such cognitive tasks as learning, comprehending,
and reasonkig (Baddeley, 1990). The relevame to the current study is that the
visuo-spatial sketc hpad is assumed to process and manipulate visual-spatial
information in the animations, and the articulatory loop is assumed to process and
nianipulate the verbal information of the voice narration. The gain with namation is
that leamen can presumably exploit the compatibility of the ovo subsystems to
synthesize the congruent information more effecàvely. The current smdy does not
aim to test the model but is consistent with the theoretical position.
As a second change to the Wong study, the quiz in the current study
included new questions presented in a visual form as weli as questions presented in
text f o m The quiz is presented in Appendix A. Although Wong (1994) included
some questions in a visual fom, the questions did not target specific animations
and, thexfore. may not have probed concepts that the animations directiy
illusaated Each question, except the first, in the present smdy asked information
about a specific animation. The new visual questions were expected to better test

Animation Effects 9
the spatial-relational information that animations provided because they were
presented in a graphical form that asked information about the relation of the means
and legression lines before and after covaxiate adjustments. The spatial-relational
information was considered key in understanding the concepts about ANCOVA in
the tutorid,
To summarize, the present smdy extends Wong's (1994) study and attempts
to address the conflicring and weak findings in the fiteranire (e-g., Baek and Layne,
1988; Eüeber et al., 1990; Wong, 1994). The narration emphasizes important or
devant information to leamers (Baek and Layne, 1988). In the cment snidy, the
relevant infomation was emphasized by voice narration as the animation was taking
place. If emphasizing pertinent infomiation to be leamed is a key to animation
success in leaming, then the animation group in the curent study should
outperform the non-animation group. The animation and voice infomation should
synthesize the infoxmation more easily since, in the Baddeley and Hitch (1974)
model, they access different idonnation processing subsystems. The questions on
the quiz each targeted information that the animations providecl and presented them
in a spatial f o m that was congruent with the fom of the animation presentation.

Animation Effects 10
Method
Subjecrs
The study included a total of 40 snidents recniited fkom a graduate
univariate statistics course (10 subjects) and an undergraduate statistics course (30
subjects) at Carleton University. The graduare students had not taken the portion of
the course that dealt with analysis of covariance (ANCOVA) by the time they were
tested in this study, and the undergraduate course stopped short of the ANCOVA
technique. Voluntea students in the graduate course were motivated to participate
in the study because they would cover the material in class following the
experiment The undergraduates were paid 10 dollars for their participation in the
study .
&par-
Two Apple cornputers (a Macintosh IIsi and a Power Macintosh 6 1 OO/66
AV) were used to present the tutorial material. Clicking with a mouse allowed
subjects to move through the tutonal. The Macintoshes recorded time spent on each
screen page of the tutonal and tirne to complete the tutorial.
Mare*
Tutorîals. Subjects received one of two possible computer tutorial
presentations. There was one animation tutorial and one non-animation tutorid
developed using the software computer package Director (Macromedia, 1992).
Both tutorials included text as well as graphics and covered statistical concepts in
analysis of covariance (ANCOVA). The animation tutorial included non-animation
graphics as weU as animations. The non-animation condition contained only the
non-animation p i c m s and text without animations. Both conditions had a "next"
Animation Effects 1 1
and a "previous" bunon icon on each page that aliowed them to move fonvard or
backwards through the tutorial when clicked on by the mouse. There was also a
"done" button on every page of both tutorids that ailowed subjects to quit the
mtorial at any rime.
The animations were w o dimensional dynamic graphics that showed spatial
and or temporal changes to depict m e m e n t . Each animation was a series of
dismete still graphics that were presented to the screen one at a time and quickly
replaced by successive graphics until the animation was completeà The rapid
presenration of discrete graphics gave the impression of perceived movement.
Figraes 1 and 2 show that each animation had a corresponding non-animation
graphic in the non-animation tutonal. Motion or change in the corresponding non-
animation graphics were depicted by arrows.

5 o f 47
To distinguish between reading scores f o r the two groups, we wiIl plot a separate frequency distribution for eech gmup. Three things are noteworthy regarûing the two distributions. 1. Them is a dif f erence betwaen means on reeding performance.
Figure 2. Non-animation page.

Animation Effects 13
The animation tut& included voice narration that accompanied the
animations and guided the learner to important information by cueing important
grapbxcal events as they unfolded. The voice narration was the male voice of the
experimenter caxefully timed to coincide with the important animation events.
Reproduction of the voice narrations in text form is shown in Appendix B. Voice
narration was recorded using the Director software package. An animation screen
consisted of a non-animation picture (e-g., a data graph) in the middle of the saeen
with text information on the upper portion of the screen. There was a s d 1
projector icon at the bottom of the screen that klltiated the animation when clicked
with the mouse. Subjects were unable to pruceed until the animation was viewed at
least once. Subjects viewed the animations as many times as they wanted
Quiz. The quiz was developed to probe statistical information that the
animations and corresponding non-animations provided There was a total of 24
questions su bdivided in to spatial, textual, and animation-spatial questions.
Procedue
Subjects were randomly assignai to conditions (animation tutorial or non-
animation tutorid), and type of computer (Powermac 6 100 AV or Macintosh IIsi)
as they h v e d at the laboratory. They then filled out a consent fom. The
experimenter described what the subject would see on the screen, and do. Subjects
in both conditions were directed to read al1 of the text information on aU screens.
Subjects were seated approximately 60 cm from the computer screen and initiated
the computer tutorial by c l i chg the mouse. Subjects proceeded page-by-page
through the tutorid by clicking with their mouse on a "next" button, shown in

h i m a tion Effects 14
Figure 1, on the bottom nght hand corner of the cornputer screen. Following the
tutonal the subjects moved to a separate room to answer the quiz in paper f o m

Animation Effects 15
Results
The dependent measmes consisted of accuracy on the quiz, time to complete
the tutorial, time to complete the quiz, time spent on each page type, and number of
page accesses by subjects. Quiz accuracy was subdivided into four measures.
Quiz Question Types
Each of the questions shown in Appendix A, except question 1, addressed
specific infarmation provided by the animation and corresponding non-animation
graphics. Question 1 deterinined whether subjects had a basic grasp of the terms
dependent variable, independent variable, and covariate, that were used throughou t
the tutorials. AU24 questions were subdivided into three types a) text questions,
which were straight-forward multiple choice questions presented in text format with
no graphics, b) spatial questions and, c) animation-spatial quesBons which both
used graphics as part of the question. The animation-spatial questions may facilitate
mental manipulation of a spatial representation similar to an animation to amve at
the correct answers. The questions do not necessarily require mental spatial
manipulation, but answers rnay be facilitated for the animation group. Spatial
question answers could be determined by choosing among the provided choices
without mental manipulation of the graphical elements necessarily as aid to arriving
at the answer. For example, Figure 3 is considered to be a spatial question. It
presumably cm be answered quite easily by cornparkg the four graphs and noting
that the fmt one has a steeper slope than the other choices. It is considered spatial
because it is presented with graphics. The animation may have facilitated
understanding of the issue, but a direct reconsmction and mental manipulation of
visuo-spatial information may not facilitate leaming further.

Animation Effects 16
9) With ANCOVA, which of the following relations between the dependent variable and the covariate wilI yield the most redxtion in variability of dependent variable scores?
Covariate
Covariate
Covariate
Figure 3. Question 9: A spatial question.

Animation Effects 17
The animation-spatial ques rions, b y cornparison, mapped the question and
answers to a mental unfolding of the animation itself. The question was more
congruent with the way that the animation material was presented. For example,
the question graph in Figure 4 conesponds to the beginnkig of an animation. The
answer corresponds to a final state of the animation for the regression lines
presented. Researchers have demonsmted the potential importance of visualinng
and mentally rotating objects in leaming and memory performance (Cooper and
Shepard, 1973; Kosslyn, 1976; Shepard and Meeler, 1971) Thus, answering the
question using some kind of wual-spatial manipulation of the information such as
spatial rotation may be faciiitated for the animation group. It is assumed that
recalling the animation would make it easier to answer the question although it is
not required to answer the question.

Animation Effects 18
20) The diagram below shows the mean differences for the dependent variable before the ANCOVA adjutment for the two groups. Chle the graph that best replesents the mean differences on the dependeni variable afier adjument.
D.V.
D.V.
mean a
mean a
D.V.
Covariate
D.V.
----------------- Covari aie
Covariate
Figure 4. Question 20: An animation-spatial question.

Animation Effects 1 9
A nalyses
Factorial between groups ANOVAS for the two conditions were perfoxmed
on dl of the quiz accuracy rneasures, time to cornplete the nitorhi, and time to
complete the quiz. Mixed factoriais were used to analyze the page time and page
access data for the animation and non-animation groups.
The tutorial crashed during the experiment for the first subject h m the
animation group. The tutorial was resrarted and the subject started the session from
the point where it crashed. Dining the &ta analysis it became apparent that there
were areifacts in the data for this subject regarding times to complete the tutorial,
time spent on each page, and the numkr of times each page was accessed There
was no reason to believe that this subject's leaming performance scores on the quiz
were affecteci by the computer crash. Therefore, the subject is included for the quiz
accuracy analysis and excluded for the measures that were affected by the computer
crash. For the quiz accuracy analysis, there was no difference in the outcorne with
the subject included or excluded even though this subject had a quiz score of 100
percent.
Preliminary factorial analyses for the dependent measures also included
machine type (Macintosh Powennac AV6100 vs. Macintosh IIsi) and student type
(graduate vs. undergraduate). For these analyses, all F's showed p values greater
than -05 except one. The analysis of nurnber of page accesses with factors
condition (animation, non-animation) by machine type showed a main effect for
machine, F(1,35) = 5.5, p<-05 but no interaction with condition. There is no
reason to assume this result, shown in Appendix C, is other than spurious. Thus.

Animation Effects 20
it is assumed that the fewer mean page accesses for subjects on the IIsi compared
with the Powemc were due to chance aione,
Quiz accwacy. Subjects answered the quiz and were measured on number
of correct answers. The quiz which comprised 24 questions was divided into four
dependent measures includhg total quiz accuracy and three subset measuns. The
first measure consisted of number of questions conect on ail 24 questions. The
second mesure consisted of acclnacy on 10 questions that fomulated the questions
in a spatial f o m The third measure was accuracy on 5 questions expressed
entirely in text form, and the fouah measure comprised accuracy on nine questions
in animation-spatial foxm. The three subset measures were mutually exclusive and
added up to the total number correct
A between p u p s analysis of variance for the two groups (animation group
vs. non-animation group) was performed for overall accuracy on the quiz. The
three subset measures (text questions, spatial questions, and animation-spatid
questions) for the quiz were analyzed in the same manner. There were no
s tatis hcally significan t differences for accmcy on the quiz for any of the dependen t
measures (see Table 1). The animation tutonal did not significantly contribute to
quiz accuracy compared with the non-animation tutorid. Al1 F's are show in
Appendk D. Propomon of variance accounted for (r squared) by knowing which
group subjects were in, was .O4 Power, the probabiIicy to reject the nul1
hypothesis when it is fdse, with the effect obtained was only .19 at the .O5 alpha
level. The number of subjects required to detect an effect of this a~e with power of
approxirnately -8, would be 100 subjects per condition (Cohen, 1988).

Animation Effects 2 1
As shown in Table 1, subjects achieved an average of 71 percent overail on
the quiz and 53 percent on the animation-spatial questions where animation was
expected to have greatest effect Subjects in both groups answered the spatial
questions well, with an average of 87 percent.
Table 1
Percent Correct on the Ouiz witb Standard Emrs of the Mean
Condition
Question Type
Overall Anim- Spatial Text
Animation 74 55 89 78
S.E. .O3 .O6 .O3 .O4
Non-anima tion 69 50 85 70
S.E. .O2 .O4 .O3 .O4
Both Conditions 71 53 87 74
S.E. .O2 .O4 .O2 .O3
Figure 5 shows the percent correct for each question by conditions. The
venical axis shows the 24 questions, and the horizontal axis shows the percent of
subjects who answered each question correctly. Accuracy for subjects in the
animation group is shown in hatched bars and for the non-animation group in black
bars. The questions are grouped into text, spatial, and animation-spatial categones.
The p p h shows that the questions did not disairninate weii between the two
groups. S ubjects performed worse on the animation spatial questions relative to
other question types. For example, only 25 percent of people for both groups

Animation Effects 22
comctly answered Question 24, an animation-spatial question. wth four
alternative multiple choice questions, 25 percent represents chance level of
responding if subjects were just guessing. In contrat to poor performance on the
animation-spatial questions, with one exception, subjects in both conditions
answered the textual questions well. Subjects fkom both groups answered text
question 16 poorly. The graph shows that subjects did not perfom weU on the
fundamentai ANCOVA concepts questions (questions 16, and 18 through 24). For
these questions subjecrs needed to know about the effects of the removal of the
mean diffexnces in the independent variable due to the covariate and the rernoval of
e m r on the dependent variable amibutable to the covariate. In addition, for
question 16, they needed to h o w how these adjusmienu wouid affect the obtained
F value.

Animation Effects 23
condition 1 I non-animation
condition
Percaitage of people who m a e d question a>rrectly
Figure 5. Percentage of people by condition who answered the question correctly
for each question type.

Animation Effects 24
Tutorid Nne ond quk tirne. Time to complete the tutorial for each condition
(animation vs. non-animation) was assessed by ANOVA which revealed that the
non-animation tutaial group completed the tutorial significantly faster (21 min.)
than the animation group (25 min.), E(1, 38) = 4.75, g < .os, m e = 33.67. There
was no difference in how long it took to complete the quïz. Mean &es to complete
the quiz are s h o w in Table 2 for the two gmups.
Table 2
Mean Time in Minutes to Com~lete the Ouiz with Standard Errors of the Mean
Condition Mean S.E.
Animation 16 1 .O5
Non-animation 15 .84
Page time and nwnber of page accesses. Analyses were performed on
average tirne spent on pages and average number of accesses to pages. For these
analyses "animation pages" are dehed as pages with animations h m the
anbation nitorid and the corresponding static pph ics pages from the non-
animation tutorial. Similarly, the static graphics pages h m the animation tutorial
and the same static graphics pages £rom the non-animation nitOnal are defined as
"non-animation pages."
Wong (1994) found that subjects spent more time on animation pages
relative to non-animation pages. To detexmine whether there were similar
clifferences in the present study a two (animation page vs. non-animation page) x

Animation Effects 25
two (animation tutorid vs. non-animation nitorid) mixed design analysis with
repeared measurcs on the f m t factor was performed on time spent to complete the
page. There was a signincant main effect of page type, E(1, 37) = 70.6 1, p <
.ml, and a significant interaction between page type and condition, E(1,37) =
78.16, p < .ûû1. This interaction is s h o w in Figure 6.

Animation Effects 26
--b-- animation g r o v
-4-- non-animation P U P
animation/corresponding non-animation non-animation pages
page type
Figure 6. Mean thme spent on page type by condition

Animation Effects 27
Foliow up multiple cornparisons using the Sheffé procedure showed that subjects in
the animaiion group spent more tirne on average for animation pages (38 sec) than
they did on non-animation pages (26 sec), E(1,37) = 147.97, g < .01. The
animation tutorial group also spent more time on average per animation page than
the non-animation tutorid group on correspondhg pages (27 sec), E(1,37) =
22.38, p < .01. There was no statistically sigmficant difference for time spent on
the two page types for the non-animation group, and also no signiticant difference
for time spent on non-animation pages between the two conditions.
A simila. two (animation vs. non-animation) x two (animation tutorid vs.
non-animation tutorial) mixed design analysis with repeated measures on the fint
factor was perforrned on number of times the pages were accessed by subjects.
There was a significant main effect of page me, E(1, 37) = 7 . 4 6 , ~ = .O 1, and a
significant interaction between page type and condition, E(1, 37) = 5.78, p c -05.
The interaction is shown in Figure 7.

Animation Effects 28
--tF-- animation P " P
+ non-animation grouP
anirnarion/corresponding non-animation non-animation pages
page type
Figure 7. Number of accesses by page type by condition.

Animation Effects 29
Foiiow up multiple cornparisons showed that subjects in the animation tutorial
group accessed the animation pages significantly less ofien (1.03 mean number of
page accesses) than they accessed the non-animation pages within their tutorial
(1.22 mean number of page accesses), E(1,37) = 11.65, p c .01. The animation
group also visited animation pages on average less ofien (1.03 mean number of
page accesses) than did their non-animation group counterparts on comesponding
pages (1 -25 mean number of animation page accesses), E(1,37) = 5 . 2 4 , ~ < .OS.
The non-animation group showed no difference in number of accesses to the two
page types. The number of non-animation page accesses did not differ between the
two groups. Both groups accessed the non-animation pages equally ofien.
In summary, analyses of accuracy on the quiz revealed no leaniing
differences between the animation and non-animation groups overall and for the
spatial, text, and animation-spatial components of the q u i t The t h e to complete
the mtorial was greater for the animation tutonal group than the non-animation
nitorid group. The animation group spent more time on animation pages than the
non-animation group on corresponding pages but accessed those pages less ofien
rhan the non-animation tutorid group. There was no difference between the two
groups for mean tirne on number of accesses for non-animation pages.

Animation Effects 30
Discussion
The primary goal of this study was to assess whether aduit learning was
better with animation compared with non-animation grap hics. The smdy replicated
Wong (1994) in that students learned how an abstract statistical procedure
(ANCOVA) worlcs using either an animation tutorial or a non-animation tutorial.
To evaluate the effectiveness of animations as thoroughly as possible, the smdy
made two subsmtial modifications to the materials used by Wong. As suggested
by Baek and Layne (1988), emphasis was placed on key issues and important
points in the animations. Voice nanations called subjects attention to important
concepts and actions as diey o c c m d The quiz was also modified to explicitly
probe concepts which the animations illusaated, and questions were presented in a
spanal fom that were congruent with the spatial information presented by the
animations. With these modifications, it was felt that, if animations help leaming,
this study would demonstrate it.
Conmy to predictions, the study failed to fïnd any facilitation to learning
from the use of animations in computer-based instruction as compared to well
designed non-animation graphics with adults. Reten tion was approximately 7 1
percent for both groups. Seven important questions of the 24 addressed the
combined main processes of ANCOVA where differences in the covariate are
removed h m the independent variable by sliding group means dong the regression
lines, and error in the dependent variable attributable to the covariate is removed by
flattening the regression lines. Questions 18 through 24, shown in Appendix A,
addressed these concepmal processes directly. Performance on these and the two
rernaining questions of the spatial-animation questions was poor, relative to overall

Animation Effects 3 1
retention. at 53 percent It was not surprising that perfommce was poor relative to
the overall retention on these very important, but difficult concepts, for subjects
who received the non-animation tutarials. It is t e k g that subjects who received the
animation tutorials, which were specificaliy designeci to address these concepts, did
no better.
What cm we conclude about the effectiveness of animations for learning?
The current study resulted in another fadure to fhd an advantage to using
animations. There are two possibilities, 1) animations do not facilitate leming or,
2) a l the studies that show no improvements when animations are used are deficient
in some way.
The Possibility thut Animrions do not Help
Some people are reluctant to accept the possibility that animations do noi
faciiitate leamhg (Wong, 1994). In spite of much experimental evidence, some
cannot, or do not want to, accept that weii-designed animations, which are
in teres~g and impressive to watch, do not help. The only study that showed
facilitated conceptual leaming using animation with adults found a small effect
(Baek and Layne, 1988). The current study incorporatecl Baek and Layne's
suggestion of pointing out relevant animation matenal to learners by the use of
voice narration. The narration did not help. As well, subjects in the Baek and
Lape study achieved approximately 55 percent overall accuracy on a pst-test, 5
percent higher than a conml group with non-animation graphies. But even for this
single positive result, the practical implications of animations with such a small
effect are ques tionable considering the resources that must be spent on animations
for such a smali return. There is also the practical considerations of detecting a

Animation Effects 32
signincant effect with the current obtained effect size. Approximately 100 subjects
per group wodd be required to detect an e f f ~ t with power of -8. If it is this
dinicult m develop animations that help su Me, why put resources into making
them?
Even if animations do not improve learning, they might be of value if they
provide quivalent leaming in less Mie than non-animations. Unfortunately,
subjects who took the animation tutorial spent more t h e on the tutorial than
subjects who twk the non-animation nitorid. In fact, the extra time it rakes to
complete the animation nitorid is entirely attributable to the additional tirne to play
the animations, approxhately 5 minutes.
Wong (1994) suggested that mention was not better with the animations
because subjects used a poor learning sh-ategy. The present study addressed and
rejects this suggestion. In the Wong snidy, subjects in the animation tutorial group
spent less tirne on non-animation pages than they spent on animation pages, and
also less time than subjects in the nomanimation nitorid group spent on non-
animation pages. Wong speculated that animations might facilitate learning, but that
essential non-animation matenal was ignored by subjects with the availability of
compelling animations. Instructions in the present study, shown in Appendix E,
emphasized the necessicy to attend to d l pages. Subjects in the animation tutorial
group and in the non-animation tutorial group spent the same amount of time on the
non-animation pages. Thus, Wong's (1994) failure to show an affect of the
animations cannot be attributed to neglect of essential non-animation materials by
subjects. Perhaps there is enough evidtnce to accept that well-designed static
graphics are as effective in learning as animations.

Animation Effects 33
The Possibiliry fhat Animnnons have not been AdequateIy Evoluated
It is always Nky to accept the nuil hypothesis that something, in this case
animation, does not have an effect It is possible that the studies conducted so far
had shortcornings that result in the failtue to demonstrate real advantages of
animations. A nurnber of issues should be resolved before leaming advantages of
animation are dismissed.
Fin& in the present study, animations did not adequately convey the
fundamental concepts. Mean retention on seven fundamental concept questions
was poor as shown in Figure 5, with the pwrest at 25 percent of subjects in both
groups answering question 24 correctly. Subjects did the worst on questions 22
and 24, those questions that were more difficult because they applied the
fundamental concepts of ANCOVA without k ing directly ülustrated in the tutorial.
Subjects did just as poorly on question 16, which is also a fundamental ANCOVA
concept question, but in a text form.
Wong (1994) did not report retention scores separately for individual
questions. Based on her analyses, she a s s d that subjects did just as well with
animations and equally well designed non-animation graphies. The picture that
emerges from the current study is that subjects are doing equdy bad on important
fundamental concept questions. It is prernature to conclude that animations are
ineffective when particular animations on these essential concepts were ineffective.
It is possible that improved animations might help.
The animations could possibly be improved in a number of ways. Wong
(1994) designed the nitorials for an audience with a fairly low level of statistical
sophistication. For example, the ANCOVA animations are not related to previously

Animation Effects 31
le& statistical concepts and formulas that might help with understanding.
Residualizing, residuals and partialing are nor mentioned. People who understand
partialing out the effect of nuisance variables probably wili not in tepte what is
animated with previous howledge about the nature of residuals unless the relation
is made explicit
Second, subjects viewing the animations used in the present study were
passive, radier than active, Leamers. It is possible that animations which engage
subjects in problem solving might be more effective than passive demonstrations (J.
Gregory Tmfton, personal communication, October, 1996). Subjects could be
asked to predict what would happen before it happens in the animation.
Immediately afier an animation, subjects could be required to show that they
undentand what was taught, perhaps by rnanipulating regression lines. A greater
variety of data sets could be presented to help subjects generalize the concept.
Animations rnay not be as effective as k e play or exploratory simulations.
The smngest recommendation to show successful facilitated learning with
animations is to convey the fundamental concepts through clear and concise use of
an appropriate number of animations and background information. Resumably,
the best way to achieve this goal would be to add animations or elaborate on the
existing animations to convey the fundamental concepts in tandem with some kind
of problem solving technique. There may not be a single key aspect for animations
to facilitate leaming, but a combination of key elements such as problem solving,
pointhg out important unfolding events, and s-cient leaming of the fundamental
concepts. The quiz might be improved Perhaps the questions on fundamental
concepts are inadequate, and the problem is not that subjects in the animation

Animation Effects 35
condition dont understand the concepts, but that the questions do not allow them to
demonstrate this howledge. Until these possibilities are ruled out, it is premame
to conclude that animations provide no help in learning.

Animation Effects 36
References
Alesandrini, K. (1987). Cornputer graphics in leaming and
instruction. In H. Houghton & D. Willows (Eds.) The Psychology of IZZustranon:
Vol. 2. Instructional Issues. New York: Springer-Verlag.
Baddeley , A., D. (1 990). The role of memory in cognition:
WorIüng memory. Hwnan Memory: Theory and Practice. @p. 67-95) London:
M y - and Bacon.
Baddeley, A., D., & Hitch, G. (1974). Working memory. In G A .
Bower (Eb), Recent Advances in Learning and Motivahon, Vol. 8 . New York:
Academic Press.
Baek, Y., & Layne, B. (1988). Colour, graphics, and animation in
a cornputer-assisted leaming tutonal lesson. Journol of Compwer-Based
Instruction, 15, (4), 131-135.
Bork, A. (1 98 1). Learning with Compurers. Billerica, MA: Digital
Press.
Caldwell, R. (1980). Guidelines for developing basic skills
instructional materials for use with microcornputer technology. Educatioml
Techrwlogy, 20 ,(IO), 7-12.
Carabdo, A. (1985). An experimental snidy to investigate the
effects of computer animation on the understanding and retention of selected levels
of l e a h g outcornes. Unpublished Doctoral Dissertation, Pennsylvania State
University.

Animation Effects 37
Carabaiio, J. (1985). The effecr of various visual display modes of
selected educational objectives. Unpublis hed Doctoral Dissertation, Pems ylvania
State University.
Cohen, J. (1988). Stahsricd Power Amlyses for the Behavioral
Sciences; Second Edirion. Wilsd.de, N.J.: Lawrence Erlbaum Associates.
Cooper, L. A., & Shepard, R. N*, (1973). Chronomemc studies of
the rotation of mental images. In W. G. Chase (Ed), Visunl Irzfonnarion
Processing. New York: Acadernic Press.
Flexser, A. J., & Tulving, E. (1978). Retrieval independence in
recognition and recdl. Psychological Review, 85,153- 17 1.
King, W. A. (1975). A cornparison of three combinations of text
and graphics for concept learning. (Report No. NPRDC-TR-76- 16). San Diego,
CA: Navy Personnel Research and Development Center. (ERIC Document
Reproduction Service No. ED 1 12 936).
Kosslyn, S. M. (1976). Can imagery be disfinguished from odier
f o m of intemal representation? Evidence fkom studies of information retrieval
time. Memory and Cognition, 4,291-297.
Macromind (1 992). Mammind Direc tor. San Francisco,
California.
Moore, M. V., Nawrocki, L., & Simutis, 2. (1979). The
instructional effectiveness of three levels of graphics displays for cornputer-assisted
insmiction. (Report No. ARI-TP-359). Arlingon, VA: A m y Research Institute for
the Behavioral and Social Sciences. (ERIC Document Service No. ED 178 057).

Animation Effects 38
Paivio, A., & Csapo, K. (1973). Picture superiority in net-recall:
Imagery or dual-coding? Cognitive Psychology, 5,176206.
Pressley, M. (1976). Mental imagery helps eight-year-olds
remember what they read Journal af Educatio~~Z Psychology, 68,355-359.
Rieber, L (1989). A review of animation research in computer-
based instruction. Proceedings of the 1989 Convention of the Association
for Educational Communications and Technology, 1 1,369-390.
Rieber, L. (1990). Animation in computer-based insmction.
Educational Technology, Research and Datelopment, 38, 1,77-86.
Rieber, Lloyd, P., Boyce, Mary, J., & Assad, Chahria. (1990).
The effects of computer animation on adult learning and retrieval tasks. Journal of
Cornputer-Based Instruction, 17, NO. 2,46-52.
Shepard, R. N., & Metzler, J. (197 1). Mental rotation of three-
dimensional objects. Science, 171, 70 1-103.
Tulving, E. (1978). Relation between encoding specificity and
levels of processing. In L.S. Cemak and F. 1. M. Craik (Eds.) Levels of
Processing and Hwnan Memory. Hilsdale, N. J. : Lawrence Erlbaum Associates.
Tulving, E., & Osler, S. (1968). Effectiveness of reirieval cues in
memory for words. Jownal of Erperimental Psychology, 77,593-60 1.
Tulving, E., & Thompson, D.M. (1973). Encoding specificity and
renieval processes in episodic memory. Psychological Review, 80,352-373.

Tulving, E., & Wiseman, S. (1975). Relation between recognition
and recognition failure of recallable wads. BulIenn of the Psychowmic Society.
6, 78-82.
Wong, A (1994). The use of animation in cornputer assisted
instruction. Unpublis hed Doctoral Dissertation, Carleton University.

Animation Effects 40
Performance Quiz
The text questions as presented to subjects in the quiz are: lY7,15,l6,l7. The
questions that were presented in a spatial form were: 2,3,4,679,10y 1 1,12,13,14.
The questions that were presented in animation-spatial form were:
5,8,18,20,21,22,23,24.
1. Match the following items used in the tutorial.
c reading perfbmance scores - a teachingmethod -
a. independen t variable b. covariate c . dependent variable

Animation Effects 4 1
2) Circle Vie gra~h h m the 4 choices below lhat best represent Ihe mesn lines for group 1 2r.d group 2.
so'x x x x 45 f x
35
Group
freqcency -
freqcency frequency
83 85 Group 1 meen
=coup 4 mezn 70 -. 6: f ~ l o v p ~ n i a n
Qraup 2 me2n 55 -j- 50 ( 45 - 40 t 35 /-'
30 ,/'
frequency

Animation Effects 42
3) In the freqcency grsph tbove shtde the area oi overkp beiween the hvo grcuos.

Animation Effects 43
4) Assuming that there is a positive linear relation between rezding performmce znd the cov~rizte, place the points that are cirded into the appropriate cell(s) in the grid belovr.
reading pecorm snce
frequency
reading pe6orm ance
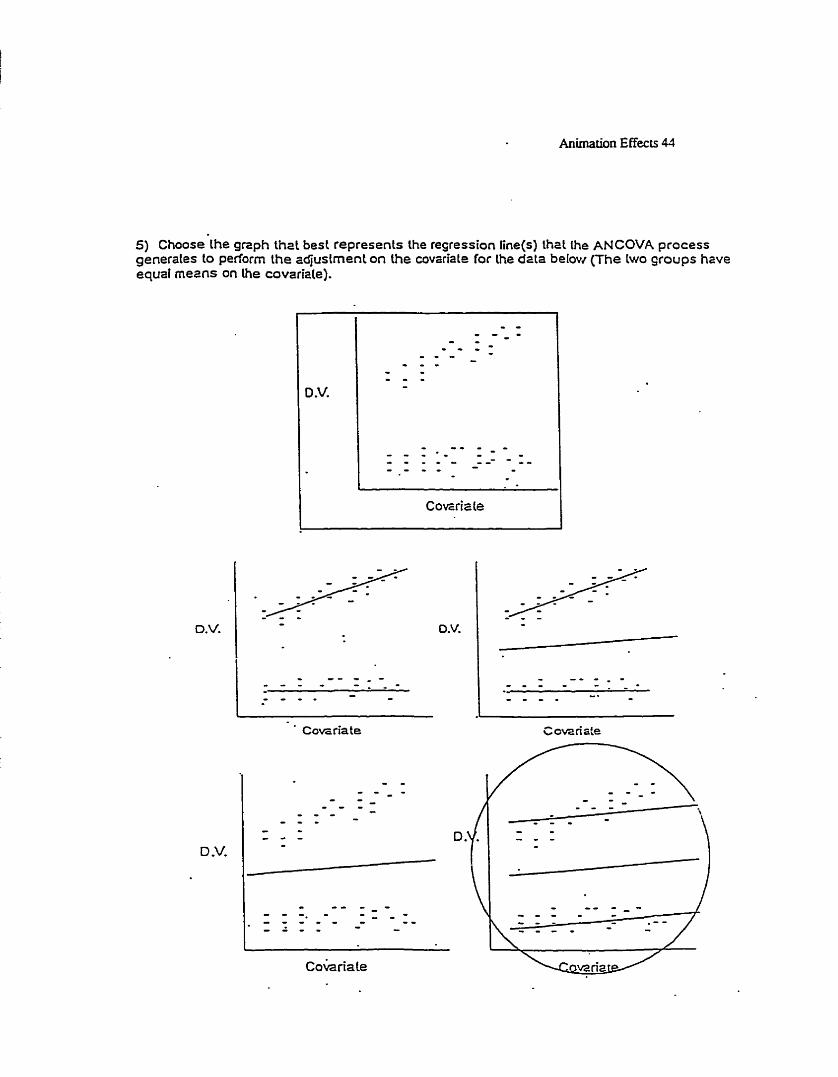
Animation E ffec ts 44
5 ) Choose the graph th2t best represents the reçression line(s) Ihzt the ANCOVA process generales 10 perlorrn the adjustrnent on the covarisle for the data beiovr (The two çroups have equal mems on Ihe covarizte).
U.V. D.V.

Animation Effects 45
Animation Effects 36
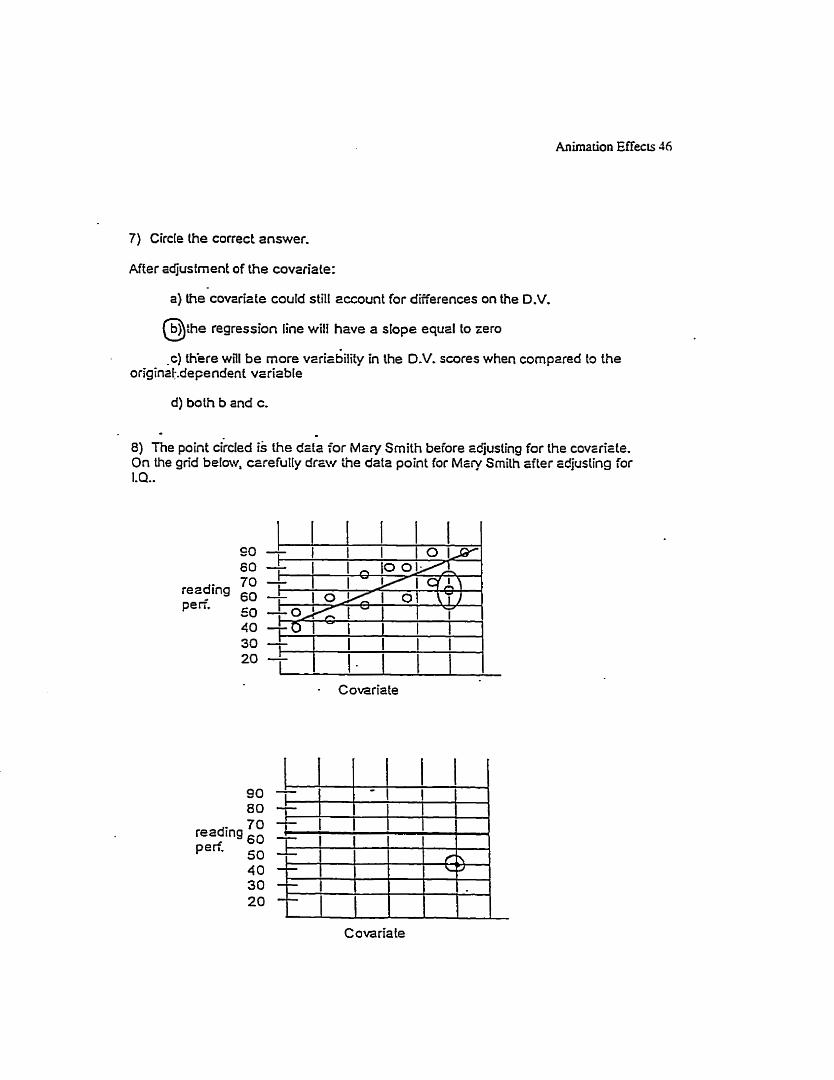
7) Circle the correct answer.
After adjusfment of the covxiate:
a) the covariate could stilf account for differences on the D.V.
@the regresoion line will have a dope equal lo zero
c) H e r e wiil be more vtritbility in the D.V. scores when cornp~red Ir> the origin&dependent vsr i~ble
d) both b and c.
8) The point cikled i s the dzk for Mcry Smith beiora ~djusting fcr the covarizle. On the grid below. czrefully d r w the data point for M ~ r y Smith tfter adjusling for I.Q..
70 rezding pert
50

Animation Effects 37
9) wUi ANCOVA, which of Ihe follov~ing relations be~ween'lhe dependent vzriable and the c~vtria:e will yield the most reduciion in vari2bilily of dependent voriable scores?
tO) Wnich of the covariates listed in the question cbove will yield the lessi ~djustment?
a. b. d.

Animation E ffects 48
For e r ~ \ O € the following cases, indicate whether ui rdjusûnent of the means on the covzriate is needed?
wiii reguire ccijusmerit of &uia:e me- -. wilt not re:uire tdjustrnent of covt-irte meas
wiii require idjusfment of cov2rir:e nerv - .wiU not require.zdjustment of covzsiate ,mens
wïii r e q ~ e aajusmient of covuirte me- - will-no t require zdjus tmeni of covuizte meas
15) EOW does the result OP rn XNCOVA differ fmrn the resul t of ordiriuy PArOVA when the hvo groups a-e eaual on the covariate mem?
@ F-valce iricreases, error decreases. 'o. F-due decre~ses, error decreases. c- F-vdue increases, erïot inaeases. 15. Fytfue deaeases, erïor inaeues. . e. F-value increzses o u decrezses, ezïoli decreues, i. F-vzlue inceases ou deaerses; error inaerses or decierses. g. F- due increzses or decreéses; error increases . -
14 Eow does the result oi' in ANCOVA- diffeqfrom the resultof LI o;dinuy ANOVA when the hvo groups 2x2 not eaual on the covahte me=?
' 2. F-vdue incz-ezses, error decreases. b. F-valile deaeases, errot decreases. c. F-vaiue increases, error increases. d, F-udue deaezses, error inereases. @ F-vaIue increases or decreases, error decreases. F. F-value increases or deaeases, error increzses or decrerses. 'go F-value increaes or decceases, e k inaeases.
Animation Effecls 49
17) A gcod covzrtte is one whick 2. has r me.? e ~ p l 0- b- hts ii'ltfe varitbility. c. hrs high correictiosl with the independent variable.
@hts hidh corre!atIon with the dependent vuia%le:

Animation Effects 50
(8) The ditgram b e l w shows the me+n differences for the depenbenl v+ri+ble before the ANCOVA adjustnent for the Iwo groups. Circle the grzph Ih2l besl represenls the mean differences on the dependent vzrizble zfter adjuslrnent,
mezn b
mezn a

Animation Effects 5 I
meanb
Covzrkte

Animation Effects 52

Animation Effects 53

Animation Effects 54
. - - - - - - - - I rn ean b' I

Animation Effects 55
t
Covariate

mezn a
Animation Effects 56
Cova ria te

Animation Effects 57
Appendix B
Animation Narration
narration animation description rutorial paze
Group 1 mean, group two mean. The two illustrates two groups with different groups have difëxeG means on the dependent variable, reading performance.
The two groups overlap on the dependent variable, reading perfonnance
Reading perfonnance, only, is shown on the lefi, it is replotted as reading performance against IQ on the right.
h w score on the covariate, low score on the dependent variable. Hi score on the covariate, high score on the dependent variable
The separate regression lines generated for each group are parallel to the overall regression line.
We adjust the reading perfonnance scores so the slope is zero. Now there is no relation between IQ and adjusted reading performance scores.
Not adjusted, adjusted IQ related to performance, IQ rernoved.
Data for one subject, before adjustment, after adjustment, same distance h m the regression line. Another subject, before adj ustmenb after adj ustxnent, same distance from the regression line.
Group 2, same adjustment.
means on the dëpeendent variable
Uustrates the overlap of the two sets of scores
a set of scores is replotteà fiom a fiequency distribution to a scatterplot with IQ. The scores float one by one h m the first graph to the second. lines yiimated to show that subjecrs with lower IQ tend to have lower reading performance. Similarly wit h high IQ.
group regres sion lines are generated out of an overd regression line.
illustrate by rotating regression line so that it is Bat.
toggle regression line between adjusted and pre-adjusmien t positions. equality of the distance of a point £rom the regression line, before and after the adjusment, is illusaated.
same description as page 19

Animation Effects 58
narration animation description tutorid - -
page After removing; the effect of IQ fur both 24 groups separagly, the two e p s stül have different means on the dependent variable
the two group regression Lines are rotated so they are flat
Look at the mean square emor in ANOVA, it is smailer in ANCOVA. As a result, the F value in the ANOVA, is snaller than the observed F in ANCOVA-
We slide the data sets dong the regression lines C x a ~ g a common mean IQ.
Watch the mean reading perfomiance differences decrease as we remove the mean differences in IQ.
We now reduce within group error by removing the eEect of IQ.
Cornmon mean on IQ, reduce enor.
In the previous example, a higher IQ score has a corresponding higher reading performance score. In the new example, a lower IQ score has a corresponding higher reading performance score.
As before we first f i d a common mean on the covariate, IQ.
Watch reading performance means increase as we find a common mean IQ.
Remove within group emr variance due to IQ-
Common mean on IQ, reduce e m r
ANOVA and ANCOVA summary tables are shown with animation illustrating the error and F values.
sliding regression lines showing the removal of the differences in mean IQ sliding regression lines showing the changes in the dependent variable as the differences due to the rnean IQ are removed. fiatten regression lines for both groups by rotating regression lines
sliding regression lines followed by flanenhg of lines shows corresponding positions on both axes for a data point Shows this for previous and the new example.
See page 32 description
See page 33 description.
See page 34 description
See page 35 description

Animation Effects 59
narration animation description tutorial page
There is no relation between reading plots scores fiam a kequency graph 42 performance and height onto a scatterplot of reading
perf-ce and height demonstrating no relation.

Animation Effects 60
Appendix C
Mean Nurnber of Page Accesses by Machine Type for Animation Pages
machine
Condition Macintosh Hsi PowerMac - - -
Animation 1 .O9 1.13
Non-animatio n 1.11 1.46
across conditions 1.1 1-3
Machine bv condition ANOVA sumarv table
Source S S DF MS F Sig of F
Condition -5 4 1 .54
Machine .69 1 .69
Condition .42 1 -42
by machine

Animation Effects 6 1
Appendut D
ANOVA Summary Table for Percentage Correct on the Quiz for a l l Accuracy
Measures
All F tests perfomied wirh (1,38) df.
Source
Dependent S S S S MS MS F Sig of F
Variable Between Within Berween Within
O v e d .O2 .63 .O2 .O2 1.5 .23
Animation . 03 2.02 .O3 .O5 -47 .5
Spatial .O 1 .74 .O I .O2 .63 .43
Text .O6 1.15 .O6 .O3 2.11 .15

Animation Effects 62
Appendix E
Experimental Instructions
1) proceed through the tutorid a screen at a time until finished by clichg the
mouse on the "next" button.
2) pay attention to a l l fomis of information on each screen. Please make sure and
read ail of the text that is provided for every screen.
3) you must view each animation at least once before moving on to the next smen.