last news for ims performance and debugging tools - ibm news_cex_pi_… · outils de debugging et...
TRANSCRIPT
Outils de Debugging et d'analyse de performances
RePenser IMS - Février 2009 - Paris 1
IBM Software Group
Last news for IMS performanceand debugging tools
Hélène LyonSouth-Europe IMS Technical [email protected]
2
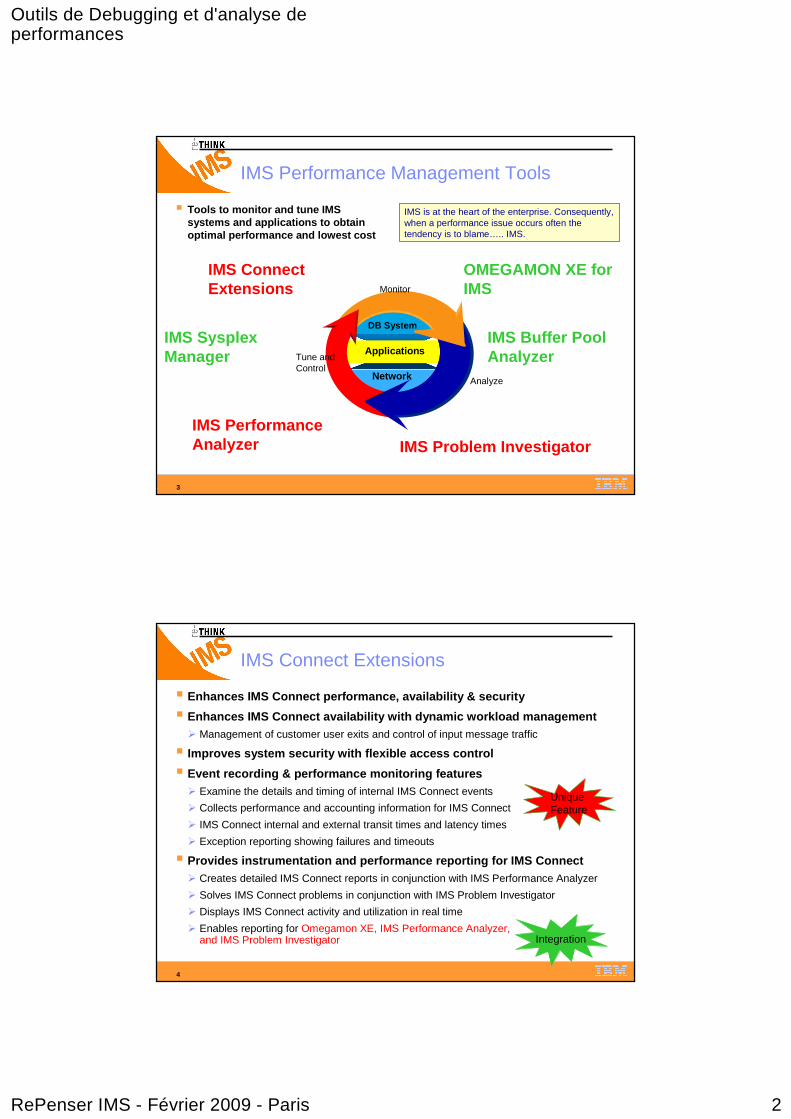
Database and System Administration� IMS Library Integrity Utilities� IMS HALDB Toolkit (renamed)� IMS Sequential Randomizer Generator� IMS HD Compression- Extended� IMS Database Repair Facility (now included in
HPPC)� IMS Tools Knowledge Base
Information Integration� IMS DataPropagator� Websphere Classic Replication Server for z/OS� Websphere Classic Federation Server for z/OS� Websphere Classic Data Event Publisher for
z/OS
Performance Management� IMS Buffer Pool Analyzer� IMS Performance Analyzer � IMS Problem Investigator�Tivoli OMEGAMON XE for IMS
for z/OS� IMS Network Compression
Facility
Application Management� IMS Connect Extension� IMS MFS Reversal Utilities
(now included in LIU)� IMS Batch Terminal Simulator� IMS Batch Backout Manager� IMS Program Restart Facility
TM/Online System Management
� IMS ETO Support � IMS Queue Control Facility� IMS Parameter Manager� IMS HP Sysgen Tool� IMS Command Control Facility� IMS Workload Router � IMS Sysplex Manager
Recovery Management� IMS DEDB Fast Recovery � IMS HP Image Copy� IMS HP Change Accumulation� IBM Application Recovery Tool for IMS and DB2
Databases� IMS Database Recovery Facility� IMS Recovery Expert
Utilities Management� Full Function Databases
�IMS HP Unload�IMS HP Load�IMS Index Builder�IMS HP Prefix Resolution�IMS Parallel Reorg�IMS HP Pointer Checker�IMS Online Reorg Facility
� Fast Path Databases�IMS HP Fast Path Utilities
� Administration�IMS Database Control Suite
IMS Tools Product Portfolio
Data Governance� IMS Audit Management Expert � IBM Data Encryption for IMS and DB2 Databases
Outils de Debugging et d'analyse de performances
RePenser IMS - Février 2009 - Paris 2
3
IMS SysplexManager
IMS Buffer Pool Analyzer
OMEGAMON XE for IMS
IMS Performance Analyzer
Analyze
Tune and Control
Monitor
DB System
Applications
Network
IMS Problem Investigator
IMS Connect Extensions
IMS Performance Management Tools
� Tools to monitor and tune IMS systems and applications to obtain optimal performance and lowest cost
IMS is at the heart of the enterprise. Consequently, when a performance issue occurs often the tendency is to blame….. IMS.
4
IMS Connect Extensions
� Enhances IMS Connect performance, availability & secu rity
� Enhances IMS Connect availability with dynamic worklo ad management� Management of customer user exits and control of input message traffic
� Improves system security with flexible access contr ol
� Event recording & performance monitoring features� Examine the details and timing of internal IMS Connect events
� Collects performance and accounting information for IMS Connect
� IMS Connect internal and external transit times and latency times
� Exception reporting showing failures and timeouts
� Provides instrumentation and performance reporting f or IMS Connect � Creates detailed IMS Connect reports in conjunction with IMS Performance Analyzer
� Solves IMS Connect problems in conjunction with IMS Problem Investigator
� Displays IMS Connect activity and utilization in real time
� Enables reporting for Omegamon XE, IMS Performance Analyzer, and IMS Problem Investigator Integration
Unique Feature
Outils de Debugging et d'analyse de performances
RePenser IMS - Février 2009 - Paris 3
5
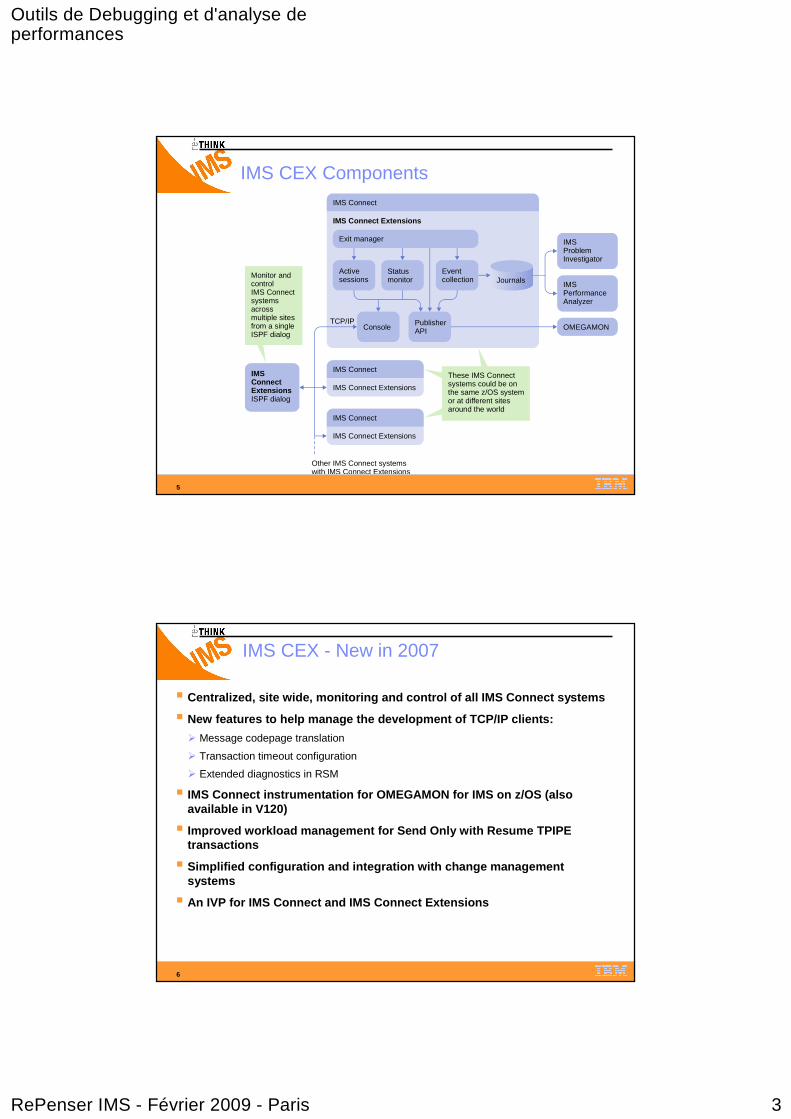
IMS Connect
IMS Connect
IMS Connect
IMS Connect Extensions
IMS Connect Extensions
IMS Connect Extensions
Other IMS Connect systemswith IMS Connect Extensions
Exit manager
Console
Activesessions
Statusmonitor
PublisherAPI OMEGAMON
IMSPerformanceAnalyzer
IMSProblemInvestigator
Eventcollection
IMSConnectExtensionsISPF dialog
Monitor andcontrolIMS Connectsystemsacrossmultiple sitesfrom a singleISPF dialog
These IMS Connectsystems could be onthe same z/OS systemor at different sitesaround the world
TCP/IP
Journals
IMS CEX Components
6
IMS CEX - New in 2007
� Centralized, site wide, monitoring and control of a ll IMS Connect systems
� New features to help manage the development of TCP/I P clients:
� Message codepage translation
� Transaction timeout configuration
� Extended diagnostics in RSM
� IMS Connect instrumentation for OMEGAMON for IMS on z/ OS (also available in V120)
� Improved workload management for Send Only with Resu me TPIPE transactions
� Simplified configuration and integration with change management systems
� An IVP for IMS Connect and IMS Connect Extensions
Outils de Debugging et d'analyse de performances
RePenser IMS - Février 2009 - Paris 4
7
IMS CEX - Functional PTFs in 2008
� The following new features were (or are about to be ) released as V210 PTFs:
� Rules-based routing
The simplest way to provide failover and distribute messages between datastores: converts the DESTID string to a datastore in a user configurable collection of datastores (routing groups)
� Persistent trace
Keep IMS Connect Extensions tracing active across restarts.
� Batch REFRESH
Refresh settings in batch.
� More information in the status monitor
8
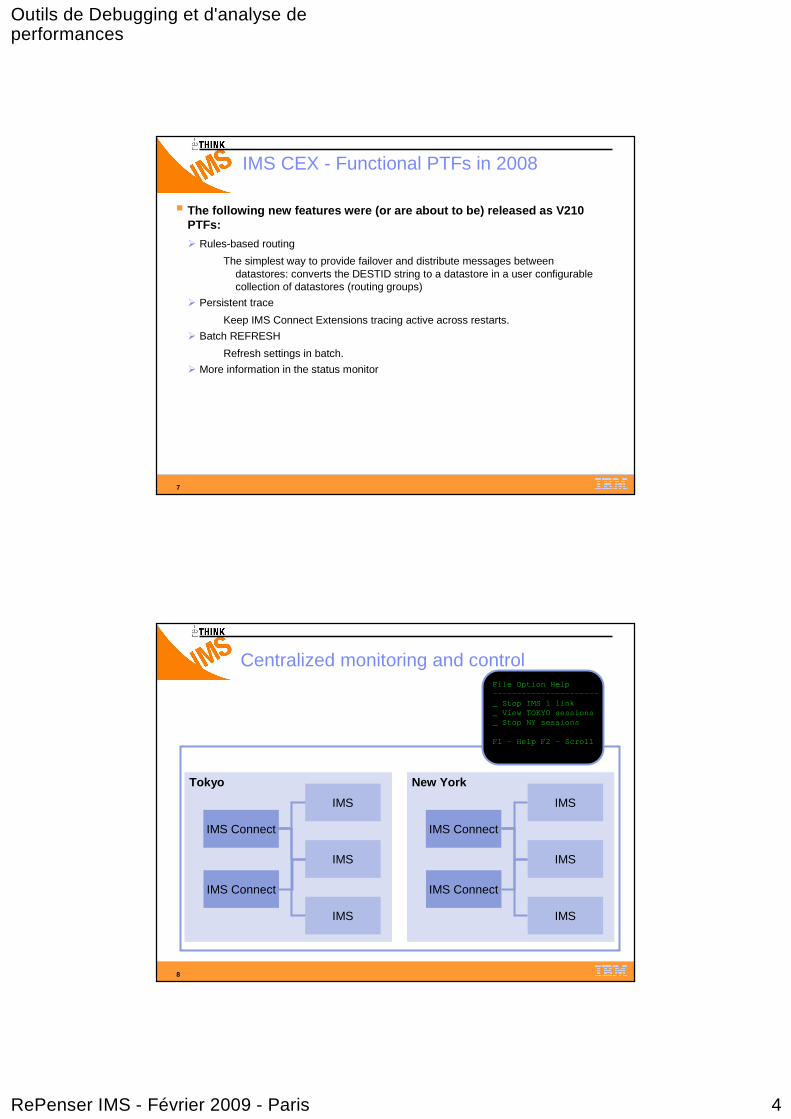
Tokyo
Centralized monitoring and control
IMS
IMS Connect
IMS
IMS
IMS Connect
New York
IMS
IMS Connect
IMS
IMS
IMS Connect
File Option Help----------------------_ Stop IMS 1 link_ View TOKYO sessions_ Stop NY sessions
F1 – Help F2 - Scroll
Outils de Debugging et d'analyse de performances
RePenser IMS - Février 2009 - Paris 5
9
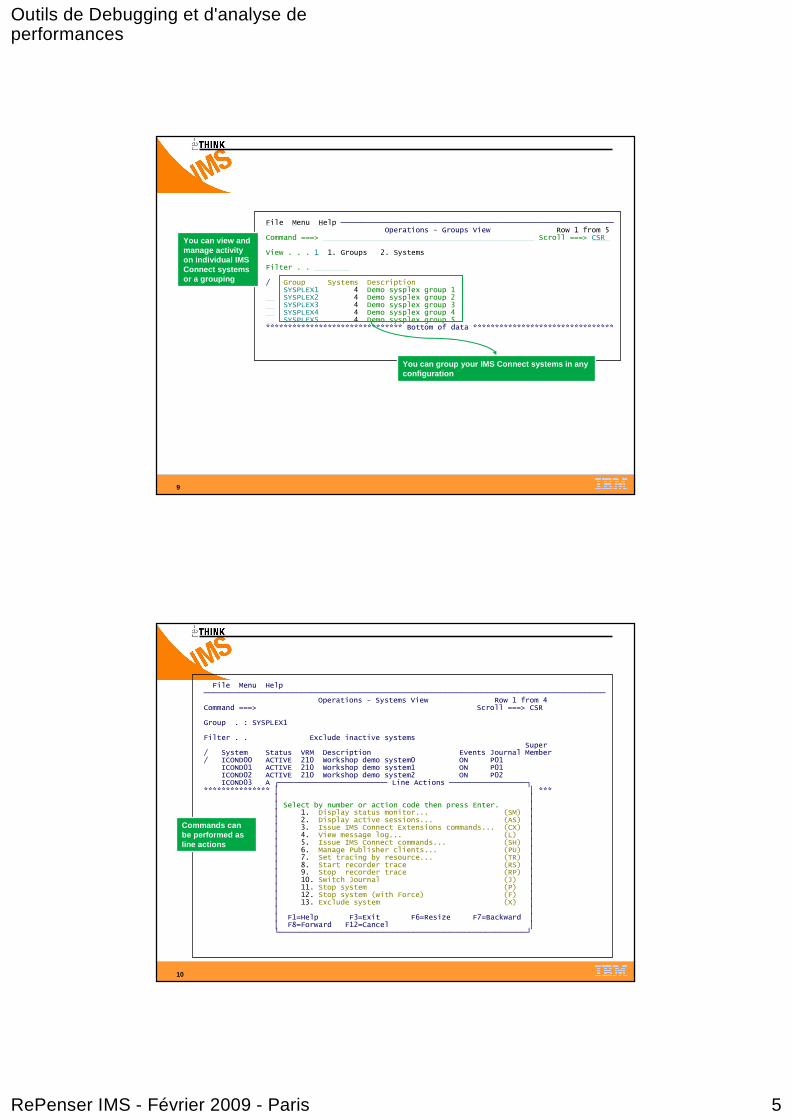
File Menu Help ─────────────────────────────────────────────────────Operations - Groups View Row 1 from 5
Command ===> Scroll ===> CSR
View . . . 1 1. Groups 2. Systems
Filter . .
/ Group Systems Description SYSPLEX1 4 Demo sysplex group 1SYSPLEX2 4 Demo sysplex group 2SYSPLEX3 4 Demo sysplex group 3SYSPLEX4 4 Demo sysplex group 4SYSPLEX5 4 Demo sysplex group 5
******************************* Bottom of data ********************************
You can group your IMS Connect systems in any configuration
You can view and manage activity on individual IMS Connect systems or a grouping
10
File Menu Help──────────────────────────────────────────────────────────────────────────────
Operations - Systems View Row 1 from 4Command ===> Scroll ===> CSR
Group . : SYSPLEX1
Filter . . Exclude inactive systemsSuper
/ System Status VRM Description Events Journal Member/ ICOND00 ACTIVE 210 Workshop demo system0 ON P01
ICOND01 ACTIVE 210 Workshop demo system1 ON P01ICOND02 ACTIVE 210 Workshop demo system2 ON P02ICOND03 A ┌───────────────────── Line Actions ───────────────┐
*************** │ │ ***│ ││ Select by number or action code then press Enter. ││ 1. Display status monitor... (SM) ││ 2. Display active sessions... (AS) ││ 3. Issue IMS Connect Extensions commands... (CX) ││ 4. View message log... (L) ││ 5. Issue IMS Connect commands... (SH) ││ 6. Manage Publisher clients... (PU) ││ 7. Set tracing by resource... (TR) ││ 8. Start recorder trace (RS) ││ 9. Stop recorder trace (RP) ││ 10. Switch Journal (J) ││ 11. Stop system (P) ││ 12. Stop system (with Force) (F) ││ 13. Exclude system (X) ││ ││ F1=Help F3=Exit F6=Resize F7=Backward ││ F8=Forward F12=Cancel │└────────────────────────────────────────────────┘
Commands can be performed as line actions
Outils de Debugging et d'analyse de performances
RePenser IMS - Février 2009 - Paris 6
11
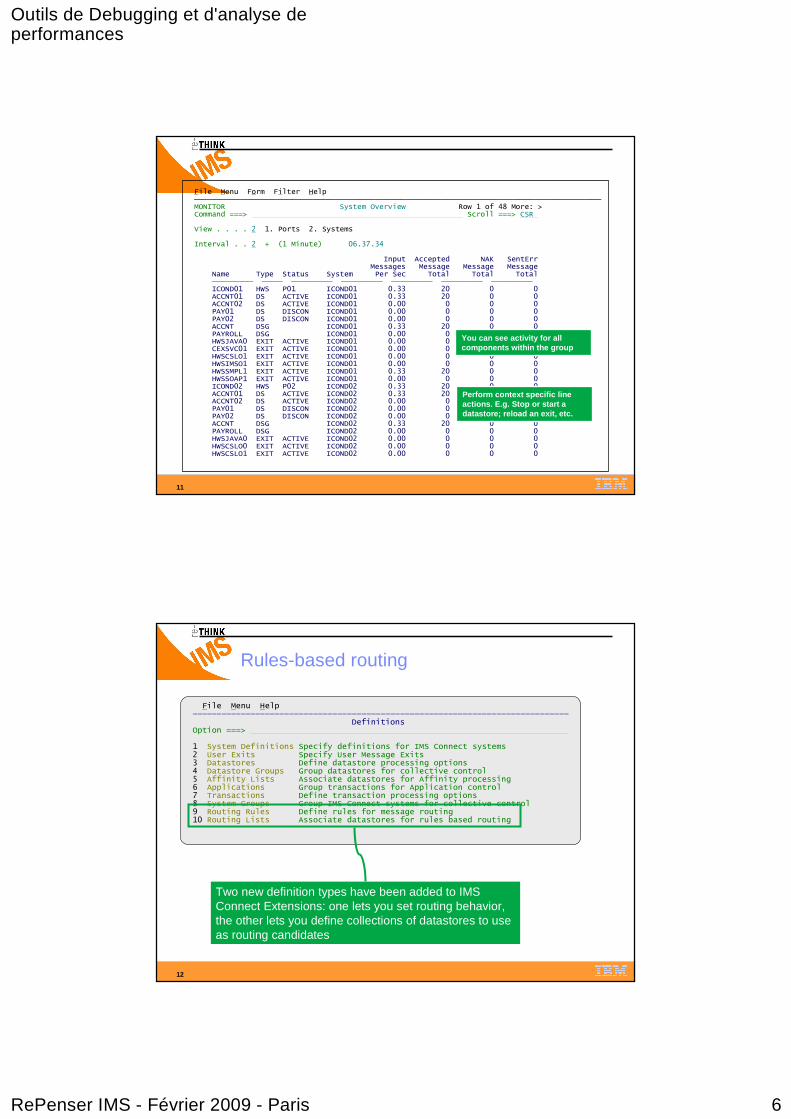
File Menu Form Filter Help ───────────────────────────────────────────────────────────────────────────────MONITOR System Overview Row 1 of 48 More: >Command ===> Scroll ===> CSR
View . . . . 2 1. Ports 2. Systems
Interval . . 2 + (1 Minute) 06.37.34
Input Accepted NAK SentErrMessages Message Message Message
Name Type Status System Per Sec Total Total Total──────── ──── ──────── ──────── ──────── ──────── ────────ICOND01 HWS P01 ICOND01 0.33 20 0 0ACCNT01 DS ACTIVE ICOND01 0.33 20 0 0ACCNT02 DS ACTIVE ICOND01 0.00 0 0 0PAY01 DS DISCON ICOND01 0.00 0 0 0PAY02 DS DISCON ICOND01 0.00 0 0 0ACCNT DSG ICOND01 0.33 20 0 0PAYROLL DSG ICOND01 0.00 0 0 0HWSJAVA0 EXIT ACTIVE ICOND01 0.00 0 0 0CEXSVC01 EXIT ACTIVE ICOND01 0.00 0 0 0HWSCSLO1 EXIT ACTIVE ICOND01 0.00 0 0 0HWSIMSO1 EXIT ACTIVE ICOND01 0.00 0 0 0HWSSMPL1 EXIT ACTIVE ICOND01 0.33 20 0 0HWSSOAP1 EXIT ACTIVE ICOND01 0.00 0 0 0ICOND02 HWS P02 ICOND02 0.33 20 0 0ACCNT01 DS ACTIVE ICOND02 0.33 20 0 0ACCNT02 DS ACTIVE ICOND02 0.00 0 0 0PAY01 DS DISCON ICOND02 0.00 0 0 0PAY02 DS DISCON ICOND02 0.00 0 0 0ACCNT DSG ICOND02 0.33 20 0 0PAYROLL DSG ICOND02 0.00 0 0 0HWSJAVA0 EXIT ACTIVE ICOND02 0.00 0 0 0HWSCSLO0 EXIT ACTIVE ICOND02 0.00 0 0 0HWSCSLO1 EXIT ACTIVE ICOND02 0.00 0 0 0
You can see activity for all components within the group
Perform context specific line actions. E.g. Stop or start a datastore; reload an exit, etc.
12
File Menu Help——————————————————————————————————————————————————————————————————————————————
DefinitionsOption ===>
1 System Definitions Specify definitions for IMS Connect systems2 User Exits Specify User Message Exits3 Datastores Define datastore processing options4 Datastore Groups Group datastores for collective control5 Affinity Lists Associate datastores for Affinity processing6 Applications Group transactions for Application control7 Transactions Define transaction processing options8 System Groups Group IMS Connect systems for collective control9 Routing Rules Define rules for message routing10 Routing Lists Associate datastores for rules based routing
Two new definition types have been added to IMS Connect Extensions: one lets you set routing behavior, the other lets you define collections of datastores to use as routing candidates
Rules-based routing
Outils de Debugging et d'analyse de performances
RePenser IMS - Février 2009 - Paris 7
13
File Menu Settings Help——————————————————————————————————————————————————————————————————————————————
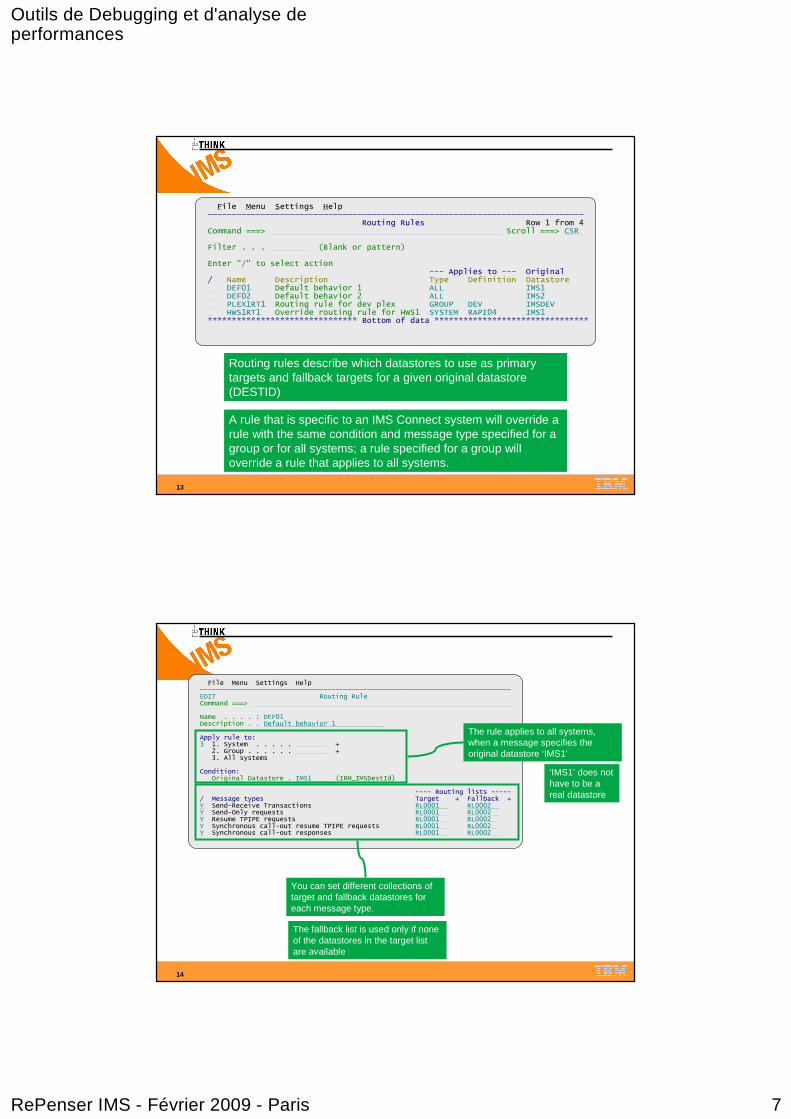
Routing Rules Row 1 from 4Command ===> Scroll ===> CSR
Filter . . . (Blank or pattern)
Enter "/" to select action--- Applies to --- Original
/ Name Description Type Definition DatastoreDEF01 Default behavior 1 ALL IMS1DEF02 Default behavior 2 ALL IMS2PLEX1RT1 Routing rule for dev plex GROUP DEV IMSDEVHWS1RT1 Override routing rule for HWS1 SYSTEM RAPI04 IMS1
******************************* Bottom of data ********************************
Routing rules describe which datastores to use as primary targets and fallback targets for a given original datastore(DESTID)
A rule that is specific to an IMS Connect system will override arule with the same condition and message type specified for a group or for all systems; a rule specified for a group will override a rule that applies to all systems.
14
File Menu Settings Help——————————————————————————————————————————————————————————————————————————————EDIT Routing RuleCommand ===>
Name . . . . : DEF01Description . . Default behavior 1
Apply rule to:3 1. System . . . . . +
2. Group . . . . . . +3. All systems
Condition:Original Datastore . IMS1 (IRM_IMSDestId)
---- Routing lists -----/ Message types Target + Fallback +Y Send-Receive Transactions RL0001 RL0002Y Send-Only requests RL0001 RL0002Y Resume TPIPE requests RL0001 RL0002Y Synchronous call-out resume TPIPE requests RL0001 RL0002Y Synchronous call-out responses RL0001 RL0002
The rule applies to all systems, when a message specifies the original datastore ‘IMS1’
You can set different collections of target and fallback datastores for each message type.
‘IMS1’ does not have to be a real datastore
The fallback list is used only if none of the datastores in the target list are available
Outils de Debugging et d'analyse de performances
RePenser IMS - Février 2009 - Paris 8
15
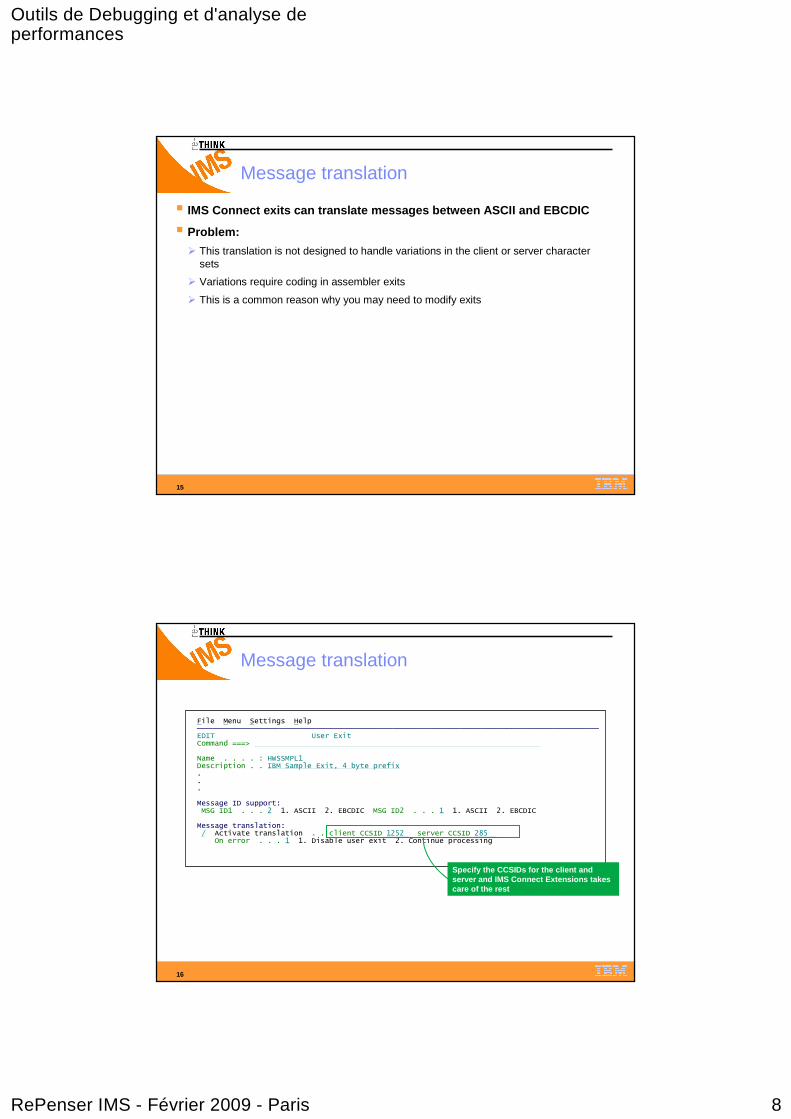
Message translation
� IMS Connect exits can translate messages between ASCI I and EBCDIC
� Problem:
� This translation is not designed to handle variations in the client or server character sets
� Variations require coding in assembler exits
� This is a common reason why you may need to modify exits
16
Message translation
File Menu Settings Help ──────────────────────────────────────────────────────────────────────────────EDIT User Exit Command ===>
Name . . . . : HWSSMPL1 Description . . IBM Sample Exit, 4 byte prefix...
Message ID support: MSG ID1 . . . 2 1. ASCII 2. EBCDIC MSG ID2 . . . 1 1. ASCII 2. EBCDIC
Message translation: / Activate translation . . client CCSID 1252 server CCSID 285
On error . . . 1 1. Disable user exit 2. Continue processing
Specify the CCSIDs for the client and server and IMS Connect Extensions takes care of the rest
Outils de Debugging et d'analyse de performances
RePenser IMS - Février 2009 - Paris 9
17
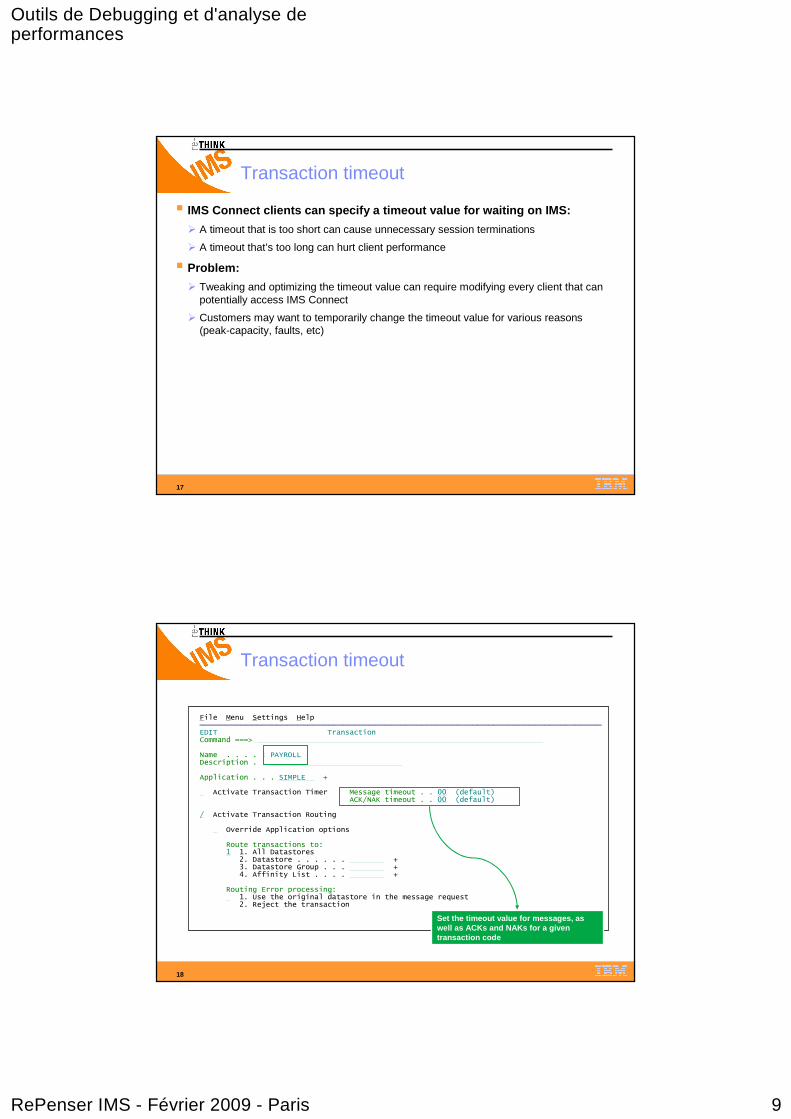
Transaction timeout
� IMS Connect clients can specify a timeout value for waiting on IMS:
� A timeout that is too short can cause unnecessary session terminations
� A timeout that’s too long can hurt client performance
� Problem:
� Tweaking and optimizing the timeout value can require modifying every client that can potentially access IMS Connect
� Customers may want to temporarily change the timeout value for various reasons (peak-capacity, faults, etc)
18
Transaction timeout
File Menu Settings Help ──────────────────────────────────────────────────────────────────────────────EDIT Transaction Command ===>
Name . . . . : PAYROLL Description . .
Application . . . SIMPLE +
Activate Transaction Timer Message timeout . . 00 (default)ACK/NAK timeout . . 00 (default)
/ Activate Transaction Routing
Override Application options
Route transactions to:1 1. All Datastores
2. Datastore . . . . . . +3. Datastore Group . . . +4. Affinity List . . . . +
Routing Error processing:1. Use the original datastore in the message request 2. Reject the transaction
Set the timeout value for messages, as well as ACKs and NAKs for a given transaction code

Outils de Debugging et d'analyse de performances
RePenser IMS - Février 2009 - Paris 10
19
Batch configuration
� You can easily perform any IMS Connect Extensions conf iguration change in batch
� Tools are available to let you deploy the same conf iguration across multiple sites with the option to transform certain settings: for example, keep all settings the same but change the suffix fo r datastore names
� You can apply the changes, in batch, to running syst ems using the new batch refresh command.
20
IMS CEX - Why upgrade?
� IMS Connect Extensions Versions 210 is functionally st able
� Already in use in many production sites around the world
� Provides significant enhancements over previous vers ions
� Easier to manage than previous versions
� Simple migration path: no need for any configuration changes from V120
� Generally, FIT requests will only be performed in V 210

Outils de Debugging et d'analyse de performances
RePenser IMS - Février 2009 - Paris 11
21
IMS Problem Investigator
� IMS Problem Investigator is an IMS TM and DB log analy sis tool …
� And also analyze the events collected by IMS Connect Extensions in conjunction with records in IMS OLDS and SLDS log data sets
� And also process related DB2 logs and related WebSphere MQ log
� And process OMEGAMON TRF records on the IMS log the same way as IMS system log records
� Future:
SMF log support
Intelligent log analysis with IMS PA accounting index
� It helps you solves complex, time-consuming problem s easily and inexpensively
� Analysis of IMS event data can help identify problematic applications and identify system performance issues
� Combined graphic analysis gives an end-to-end pictu re of transactions
� Extract and visualize the message flow of the transa ction
New
Integration
22
IMS Performance Analyzer
� A comprehensive batch performance monitor to analyz e, report on, and thereby improve your IMS Performance
� The premier tool for
� Service Levels and capacity planning
� Response time analysis
� Monitoring enterprise-wide indicators that can adversely affect IMS performance
� Information on IMS system performance for
� Tuning
� Capacity Planning
� Management Reporting
� Reporting on IMS through ISPF dialog or batch commands
� Last Goodies
� Combined TCP/IP + IMS reporting with IMS Connect Extensions
� IMS PA V4.1 reports from TRF Extractor output records
� Accounting index records for IMS PI
� Improved fast-path reporting New
Integration
Outils de Debugging et d'analyse de performances
RePenser IMS - Février 2009 - Paris 12
23
What is a performance black-spot?
� The IMS logs are a rich source of information about the activity within IMS
� IMS Performance Analyzer and IMS Problem Investigator h ave traditionally been the de-facto tools for interroga ting the logs for troubleshooting and performance information
� But what if a problem in IMS is actually caused by DB2? Websphere MQ?
� Or what if the most valuable data about the transac tion is in SMF, not the IMS log?
� Without tools that connect data from various subsys tems and sources performance black-spots appear
24
IMS Performance Analyser and IMS Problem Investigator
� IMS PA and PI are rapidly evolving products
� The roadmap for IMS PA and PI is to:
� Connect transaction data from different subsystems and sources
� Identify performance and tuning black spots and providing analytics that can illuminate them
� They are moving from being focused primarily on eva luating system performance (“tree killers”) to being at the heart of system problem determination methodologies
Outils de Debugging et d'analyse de performances
RePenser IMS - Février 2009 - Paris 13
25
IMS Performance Analyser and IMS Problem Investigator
26
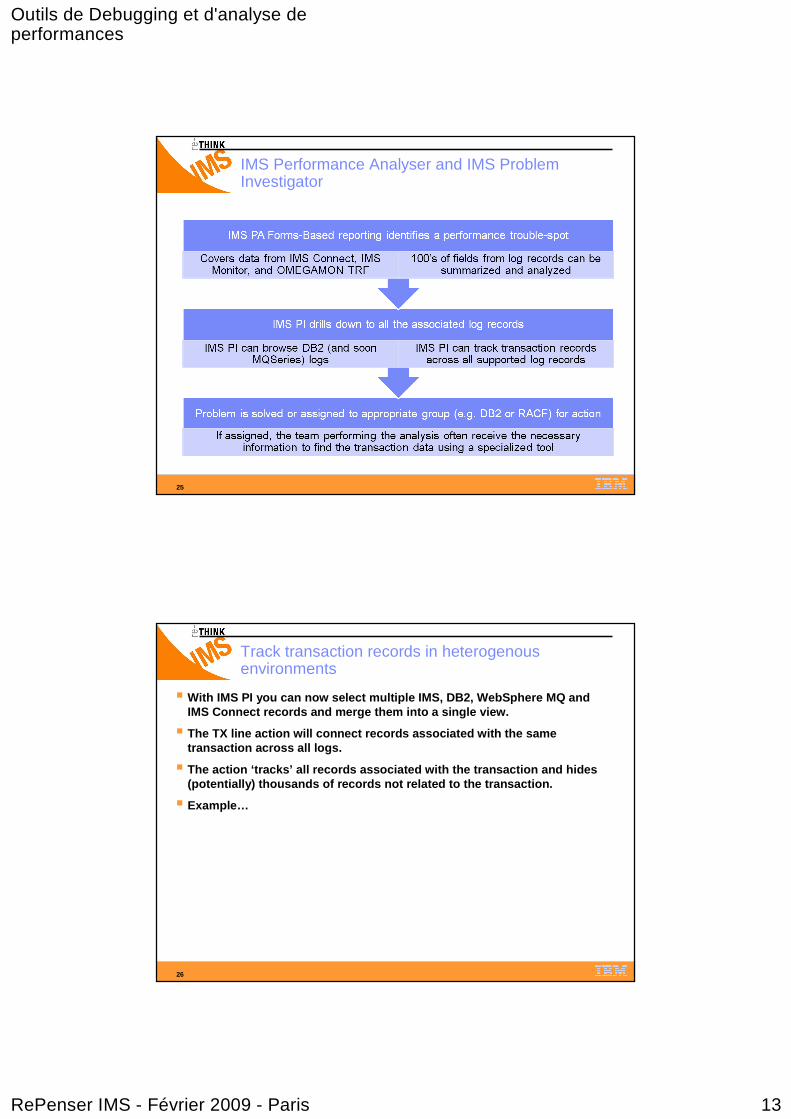
Track transaction records in heterogenous environments
� With IMS PI you can now select multiple IMS, DB2, Web Sphere MQ and IMS Connect records and merge them into a single vie w.
� The TX line action will connect records associated w ith the sametransaction across all logs.
� The action ‘tracks’ all records associated with the transaction and hides (potentially) thousands of records not related to t he transaction.
� Example…
Outils de Debugging et d'analyse de performances
RePenser IMS - Février 2009 - Paris 14
27
28
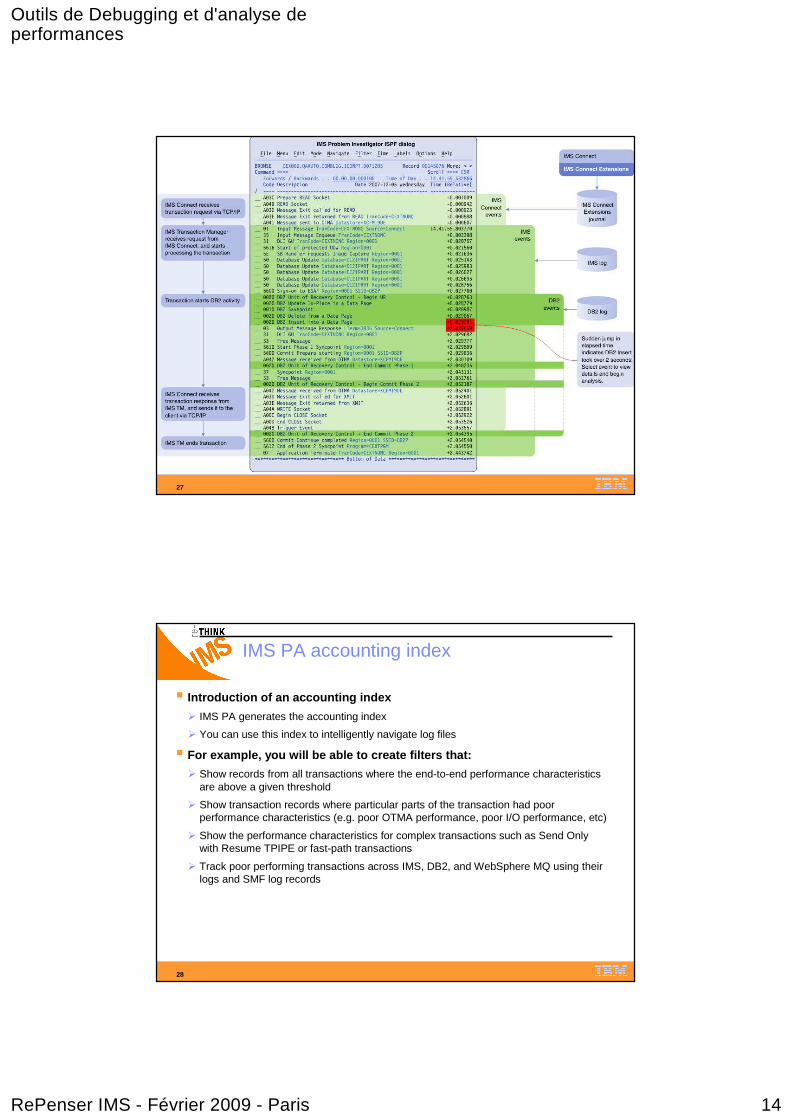
IMS PA accounting index
� Introduction of an accounting index
� IMS PA generates the accounting index
� You can use this index to intelligently navigate log files
� For example, you will be able to create filters tha t:
� Show records from all transactions where the end-to-end performance characteristics are above a given threshold
� Show transaction records where particular parts of the transaction had poor performance characteristics (e.g. poor OTMA performance, poor I/O performance, etc)
� Show the performance characteristics for complex transactions such as Send Only with Resume TPIPE or fast-path transactions
� Track poor performing transactions across IMS, DB2, and WebSphere MQ using their logs and SMF log records

Outils de Debugging et d'analyse de performances
RePenser IMS - Février 2009 - Paris 15
29
Select records with the accounting index
File Menu Edit Help ──────────────────────────────────────────────────────────────────
Process Log Files More: < > Command ===> Scroll ===> CSR
Select a Log File to browse. IMS Release 910 + Zone
/ Log File Rel + Filter + Zones ‘USER.CA01.INDEX' SLOW_TX +8s 'IPI000.QADATA.SLDSP.I9DE.D06311.T0548030.V00's 'IPI000.QADATA.SLDSP.I9DF.D06311.T0548280.V00's 'IPI000.QADATA.TCN000N.DB2P.ARCHLOG1.A0000826's 'IPI000.QADATA.TCN000N.I9DE.IMSMON's 'IPI000.QADATA.TCN000N.I9DF.IMSMON's 'IPI000.QADATA.TCN000N.SMFDUMP.VBS'
Generated index
IMS logs
DB2 log
Monitor files
SMF file
One index file can refer to multiple logs on different subsystems
30
Create a record filter
File Menu Edit Object Lists Help ───────────────────────────────────────────────────────────────────
Conditions Row 1 to 1 of 1 Command ===> Scroll ===> CSR
Code: CA01 IMS transaction accounting index
/ Field Name + Oper Value +TRANSACTION_PROCESSING_TIME GT 0.3
******************************* Bottom of data ********************************
“Show accounting records with processing time greater than 0.3
seconds”

Outils de Debugging et d'analyse de performances
RePenser IMS - Février 2009 - Paris 16
31
Transaction accounting records matching filter
File Menu Edit Mode Navigate Filter Time Labels Options Help ───────────────────────────────────────────────────────────────────BROWSE JCH.CA01.INDEX Record 00002488 More: < >Command ===> Scroll ===> CSR
Forwards / Backwards . . 00.00.00.000100 Time of Day . . 14.41.55.532866Code Description Date 2006-11-07 Tuesday Time (+8)
/ ---- ------------------------------------------------------ ----------------TX CA01 IMS transaction accounting index TranCode=DSN8PP 05.33.51.461511
CA01 IMS transaction accounting index TranCode=DSN8PP 05.34.12.744752CA01 IMS transaction accounting index TranCode=DSN8PP 05.34.32.058505CA01 IMS transaction accounting index TranCode=DSN8PP 05.34.51.741893CA01 IMS transaction accounting index TranCode=DSN8PP 05.35.09.250895CA01 IMS transaction accounting index TranCode=DSN8PS 05.36.21.228573CA01 IMS transaction accounting index TranCode=DSN8PS 05.36.50.751332CA01 IMS transaction accounting index TranCode=DSN8PS 05.37.49.038430CA01 IMS transaction accounting index TranCode=DSN8PS 05.37.55.082883CA01 IMS transaction accounting index TranCode=DSN8PS 05.38.03.562376CA01 IMS transaction accounting index TranCode=DSN8PS 05.38.08.273151CA01 IMS transaction accounting index TranCode=DSN8PS 05.38.11.009607CA01 IMS transaction accounting index TranCode=DSN8PT 05.38.55.350488CA01 IMS transaction accounting index TranCode=DSN8PT 05.39.02.144529CA01 IMS transaction accounting index TranCode=DSN8PT 05.39.11.703720CA01 IMS transaction accounting index TranCode=DSN8CS 05.42.59.634801CA01 IMS transaction accounting index TranCode=DSN8CS 05.44.52.678102CA01 IMS transaction accounting index TranCode=DSN8CS 05.44.58.104215CA01 IMS transaction accounting index TranCode=DSN8PS 05.45.13.821636CA01 IMS transaction accounting index TranCode=DSN8PS 05.45.16.253392CA01 IMS transaction accounting index TranCode=DSN8PS 05.45.18.786698
******************************** Bottom of Data *******************************
Track all records from transaction
32
Code Description Date 2006-11-07 Tuesday Time (+8)/ ---- ------------------------------------------------------ ----------------
CA01 IMS transaction accounting index TranCode=DSN8CS 05.44.58.10421501 Input Message TranCode=DSN8CS 05.44.58.10421535 Input Message Enqueue TranCode=DSN8CS 05.44.58.10822108 Application Start TranCode=DSN8CS Region=0001 05.44.58.1089745607 Start of UOR Program=DSN8IC0 Region=0001 05.44.58.1089754E10 MPP Scheduling start Region=0001 05.44.54.7321934E14 Scheduling IWAIT start Region=0001 05.44.54.7321974E15 Scheduling IWAIT end Region=0001 05.44.58.1084124E64 DLA30 start Database=I/O PCB Region=0001 05.44.58.10897831 DLI GU TranCode=DSN8CS Region=0001 05.44.58.1127304E65 DLA30 end Region=0001 SC=' ' 05.44.58.1127744E42 Transaction Originator TranCode=DSN8CS Region=0001 05.44.58.1127754E11 MPP Scheduling end TranCode=DSN8CS Region=0001 05.44.58.1127825616 Start of protected UOW Region=0001 05.44.58.1129884E60 DLI Call start Region=0001 05.44.58.2036044E61 DLI Call end Region=0001 05.44.58.2036094E48 External Subsystem Call start Region=0001 05.44.58.2037044E49 External Subsystem Call end Region=0001 05.44.58.2104535600 Sign-on to ESAF Region=0001 SSID=DB2P 05.44.58.2104765600 Thread created for ESAF SSID=DB2P 05.44.58.210508
4E48 External Subsystem Call start Region=0001 05.44.58.2118524E49 External Subsystem Call end Region=0001 05.44.58.2122684E48 External Subsystem Call start Region=0001 05.44.58.2123330020 DB2 Unit of Recovery Control - Begin UR 05.44.58.2127680020 DB2 Exclusive Lock on Pageset Partition or DBD 05.44.58.2127680010 DB2 Savepoint 05.44.58.2127840020 DB2 Type 2 Index Update 05.44.58.2127840020 DB2 Delete from a Data Page 05.44.58.2128160020 DB2 Update Area Map/Spacemap Bit Changes or Whole Byte 05.44.58.2128324E49 External Subsystem Call end Region=0001 05.44.58.2129524E60 DLI Call start Region=0001 05.44.58.2130394E64 DLA30 start Database=I/O PCB Region=0001 Func=ISRT 05.44.58.2130504E65 DLA30 end Region=0001 SC=' ' 05.44.58.2131164E61 DLI Call end Region=0001 05.44.58.213117
Records for the problem transaction from across all selected subsystems now appear

Outils de Debugging et d'analyse de performances
RePenser IMS - Février 2009 - Paris 17
33
Some of the fields that could be used in filters
Field Name T_INQ Input Queue time T_PROC Processing time T_OUTQ Output Queue time T_OUTL SMQ Out Queue time Local component T_OUTG SMQ Out Queue time Global component T_TOTL Total elapsed time T_RESP Response time, Total Transit time T_SWIT Program Switch Time T_SCHED Program Schedule Time T_SYNPT Syncpoint time T_UOR Unit-of-Recovery elasped time T_CM1DL Commit Mode=1 Delay time T_SQ6 SUBQ6 Wait for Input time (10ths secs) T_RASEC Transaction Resource Accounting section T_DBCAL FF DB DLI call count T_DBGET FF DB DLI Get call count T_DBUPD FF DB DLI Update call count T_DCCAL FF DC DLI call count T_DBWT FF DB wait count T_CPU CPU time (micro-seconds) T_FPCAL FP DB DLI call count T_FPGET FP DB DLI Get call count T_FPUPD FP DB DLI Update call count T_FPWT FP DB (DEDB) wait count T_DBIO DB IO elapsed time (microseconds) T_DBPL DB Locking elapsed time (microsec) T_VSAMR VSAM IO count (Reads) T_VSAMW VSAM IO count (Writes) T_OSAMR OSAM IO count (Reads) T_OSAMW OSAM IO count (Writes) T_TOTIO Total DLI IO count (OSAM+VSAM) T_ESAF Total ESAF calls
InputQ time
Processing time
Switch time
DLI Call Count
CPU time
VSAM writes
34
Usage scenarios
� In an enterprise environment, when a performance pr oblem is identified, it could be caused by any of these subsystems:
� IMS Connect
� OTMA
� Shared queues
� IMS TM
� IMS DB
� DB2
� WebSphere MQ
� RACF
� Etc…
Outils de Debugging et d'analyse de performances
RePenser IMS - Février 2009 - Paris 18
35
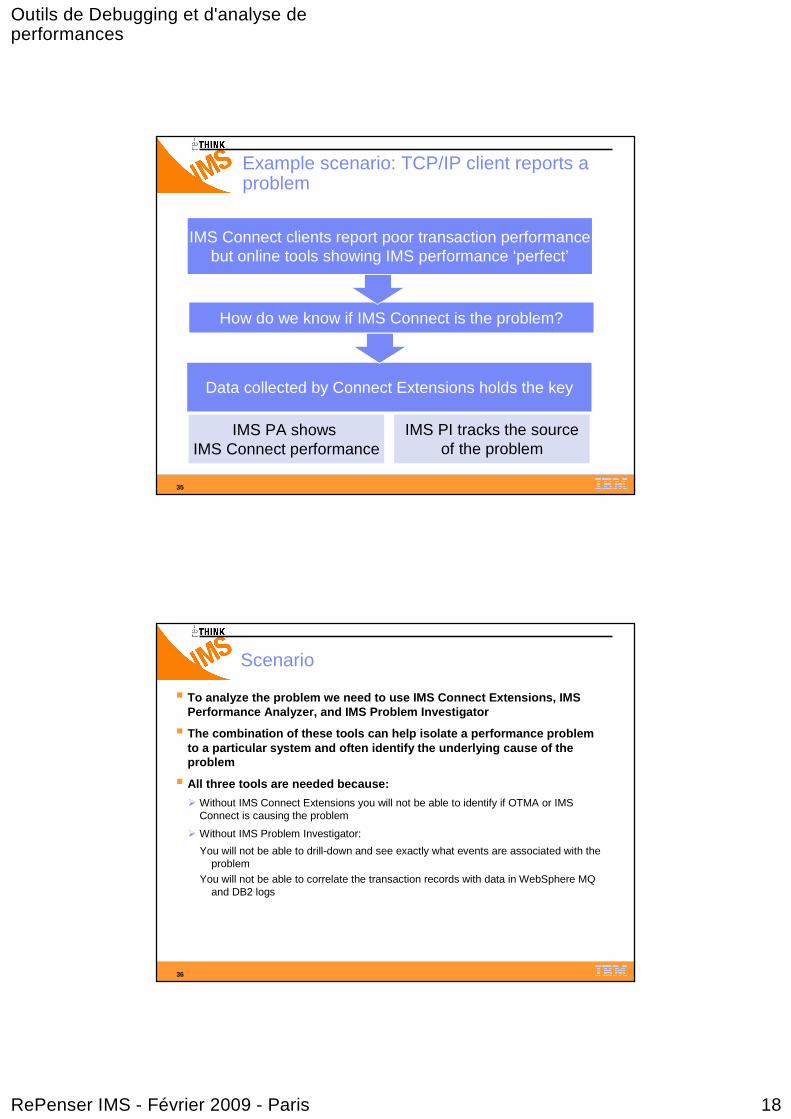
Example scenario: TCP/IP client reports a problem
IMS Connect clients report poor transaction performancebut online tools showing IMS performance ‘perfect’
How do we know if IMS Connect is the problem?
Data collected by Connect Extensions holds the key
IMS PI tracks the sourceof the problem
IMS PA shows IMS Connect performance
36
Scenario
� To analyze the problem we need to use IMS Connect Ex tensions, IMS Performance Analyzer, and IMS Problem Investigator
� The combination of these tools can help isolate a p erformance problem to a particular system and often identify the under lying cause of the problem
� All three tools are needed because:
� Without IMS Connect Extensions you will not be able to identify if OTMA or IMS Connect is causing the problem
� Without IMS Problem Investigator:
You will not be able to drill-down and see exactly what events are associated with the problem
You will not be able to correlate the transaction records with data in WebSphere MQ and DB2 logs
Outils de Debugging et d'analyse de performances
RePenser IMS - Février 2009 - Paris 19
37
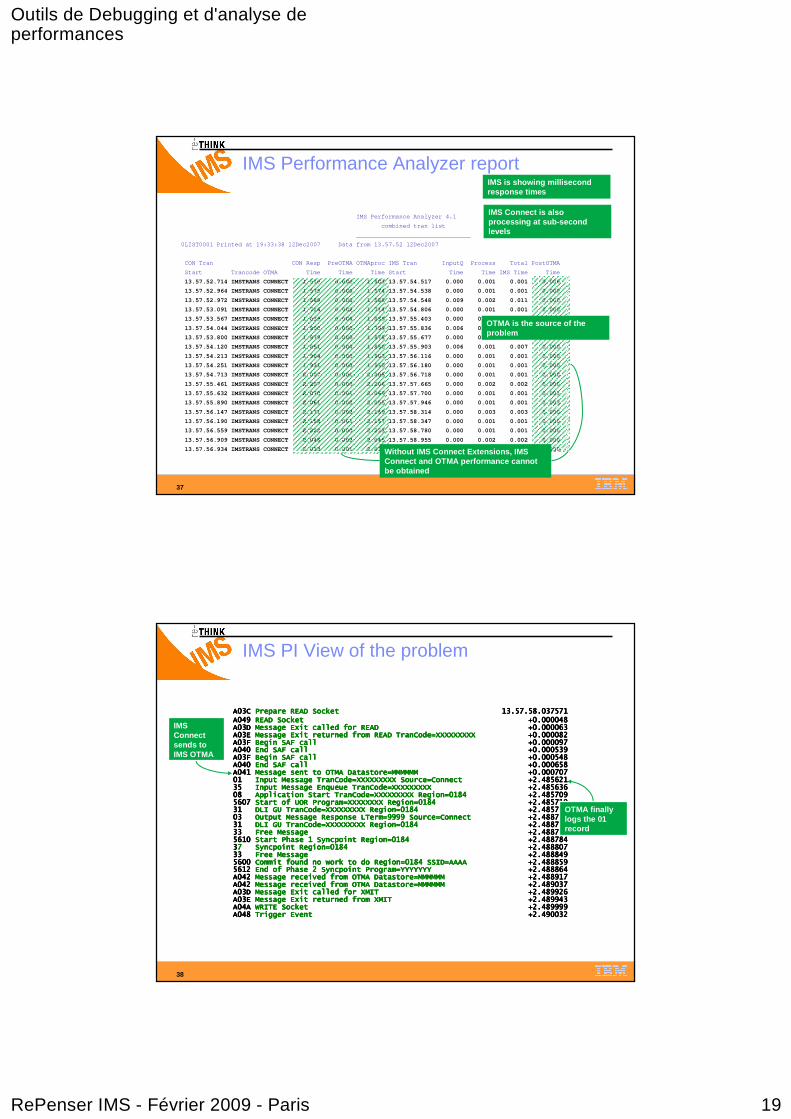
IMS Performance Analyzer report
IMS Performance Analyzer 4.1
combined tran list
________________________________
0LIST0001 Printed at 19:33:38 12Dec2007 Data fr om 13.57.52 12Dec2007
CON Tran CON Resp PreOTMA OTMApr oc IMS Tran InputQ Process Total PostOTMA
Start Trancode OTMA Time Time Time S tart Time Time IMS Time Time
13.57.52.714 IMSTRANS CONNECT 1.810 0.000 1.803 13.57.54.517 0.000 0.001 0.001 0.006
13.57.52.964 IMSTRANS CONNECT 1.575 0.000 1.574 13.57.54.538 0.000 0.001 0.001 0.000
13.57.52.972 IMSTRANS CONNECT 1.588 0.000 1.588 13.57.54.548 0.009 0.002 0.011 0.000
13.57.53.091 IMSTRANS CONNECT 1.716 0.002 1.714 13.57.54.806 0.000 0.001 0.001 0.000
13.57.53.567 IMSTRANS CONNECT 1.839 0.000 1.839 13.57.55.403 0.000 0.002 0.002 0.000
13.57.54.044 IMSTRANS CONNECT 1.800 0.000 1.799 13.57.55.836 0.006 0.001 0.007 0.001
13.57.53.800 IMSTRANS CONNECT 1.879 0.000 1.878 13.57.55.677 0.000 0.001 0.001 0.000
13.57.54.120 IMSTRANS CONNECT 1.851 0.000 1.850 13.57.55.903 0.006 0.001 0.007 0.000
13.57.54.213 IMSTRANS CONNECT 1.904 0.000 1.903 13.57.56.116 0.000 0.001 0.001 0.000
13.57.54.251 IMSTRANS CONNECT 1.931 0.000 1.930 13.57.56.180 0.000 0.001 0.001 0.000
13.57.54.713 IMSTRANS CONNECT 2.007 0.001 2.005 13.57.56.718 0.000 0.001 0.001 0.000
13.57.55.461 IMSTRANS CONNECT 2.207 0.000 2.206 13.57.57.665 0.000 0.002 0.002 0.000
13.57.55.632 IMSTRANS CONNECT 2.070 0.001 2.069 13.57.57.700 0.000 0.001 0.001 0.001
13.57.55.890 IMSTRANS CONNECT 2.061 0.002 2.055 13.57.57.946 0.000 0.001 0.001 0.003
13.57.56.147 IMSTRANS CONNECT 2.171 0.002 2.169 13.57.58.314 0.000 0.003 0.003 0.000
13.57.56.190 IMSTRANS CONNECT 2.158 0.001 2.157 13.57.58.347 0.000 0.001 0.001 0.000
13.57.56.559 IMSTRANS CONNECT 2.222 0.000 2.222 13.57.58.780 0.000 0.001 0.001 0.000
13.57.56.909 IMSTRANS CONNECT 2.048 0.002 2.045 13.57.58.955 0.000 0.002 0.002 0.000
13.57.56.934 IMSTRANS CONNECT 2.033 0.001 2.031 13.57.58.966 0.000 0.001 0.001 0.000
IMS is showing millisecond response times
Without IMS Connect Extensions, IMS Connect and OTMA performance cannot be obtained
IMS Connect is also processing at sub-second levels
OTMA is the source of the problem
38
IMS PI View of the problem
A03C A03C A03C A03C Prepare READ Socket Prepare READ Socket Prepare READ Socket Prepare READ Socket 13.57.58.03757113.57.58.03757113.57.58.03757113.57.58.037571A049 A049 A049 A049 READ SocketREAD SocketREAD SocketREAD Socket +0.000048+0.000048+0.000048+0.000048A03D A03D A03D A03D Message Exit called for READ Message Exit called for READ Message Exit called for READ Message Exit called for READ +0.000063+0.000063+0.000063+0.000063A03E A03E A03E A03E Message Exit returned from READ Message Exit returned from READ Message Exit returned from READ Message Exit returned from READ TranCodeTranCodeTranCodeTranCode=XXXXXXXXX =XXXXXXXXX =XXXXXXXXX =XXXXXXXXX +0.000082+0.000082+0.000082+0.000082A03F A03F A03F A03F Begin SAF call Begin SAF call Begin SAF call Begin SAF call +0.000097+0.000097+0.000097+0.000097A040 A040 A040 A040 End SAF call End SAF call End SAF call End SAF call +0.000539+0.000539+0.000539+0.000539A03F A03F A03F A03F Begin SAF call Begin SAF call Begin SAF call Begin SAF call +0.000548+0.000548+0.000548+0.000548A040 A040 A040 A040 End SAF call End SAF call End SAF call End SAF call +0.000658+0.000658+0.000658+0.000658A041 A041 A041 A041 Message sent to OTMA Message sent to OTMA Message sent to OTMA Message sent to OTMA DatastoreDatastoreDatastoreDatastore=MMMMMM =MMMMMM =MMMMMM =MMMMMM +0.000707+0.000707+0.000707+0.00070701 01 01 01 Input Message Input Message Input Message Input Message TranCodeTranCodeTranCodeTranCode=XXXXXXXXX Source=Connect =XXXXXXXXX Source=Connect =XXXXXXXXX Source=Connect =XXXXXXXXX Source=Connect +2.485621+2.485621+2.485621+2.48562135 35 35 35 Input Message Input Message Input Message Input Message EnqueueEnqueueEnqueueEnqueue TranCodeTranCodeTranCodeTranCode=XXXXXXXXX =XXXXXXXXX =XXXXXXXXX =XXXXXXXXX +2.485636+2.485636+2.485636+2.48563608 08 08 08 Application Start Application Start Application Start Application Start TranCodeTranCodeTranCodeTranCode=XXXXXXXXX Region=0184 =XXXXXXXXX Region=0184 =XXXXXXXXX Region=0184 =XXXXXXXXX Region=0184 +2.485709+2.485709+2.485709+2.4857095607 5607 5607 5607 Start of UOR Program=XXXXXXXX Region=0184 Start of UOR Program=XXXXXXXX Region=0184 Start of UOR Program=XXXXXXXX Region=0184 Start of UOR Program=XXXXXXXX Region=0184 +2.485710+2.485710+2.485710+2.48571031 31 31 31 DLI GU DLI GU DLI GU DLI GU TranCodeTranCodeTranCodeTranCode=XXXXXXXXX Region=0184 =XXXXXXXXX Region=0184 =XXXXXXXXX Region=0184 =XXXXXXXXX Region=0184 +2.485736+2.485736+2.485736+2.48573603 03 03 03 Output Message Response Output Message Response Output Message Response Output Message Response LTermLTermLTermLTerm=9999 Source=Connect =9999 Source=Connect =9999 Source=Connect =9999 Source=Connect +2.488716+2.488716+2.488716+2.48871631 31 31 31 DLI GU DLI GU DLI GU DLI GU TranCodeTranCodeTranCodeTranCode=XXXXXXXXX Region=0184 =XXXXXXXXX Region=0184 =XXXXXXXXX Region=0184 =XXXXXXXXX Region=0184 +2.488726+2.488726+2.488726+2.48872633 33 33 33 Free Message Free Message Free Message Free Message +2.488774+2.488774+2.488774+2.4887745610 5610 5610 5610 Start Phase 1 Start Phase 1 Start Phase 1 Start Phase 1 SyncpointSyncpointSyncpointSyncpoint Region=0184 Region=0184 Region=0184 Region=0184 +2.488784+2.488784+2.488784+2.48878433337 7 7 7 SyncpointSyncpointSyncpointSyncpoint Region=0184 Region=0184 Region=0184 Region=0184 +2.488807+2.488807+2.488807+2.48880733 33 33 33 Free Message Free Message Free Message Free Message +2.488849+2.488849+2.488849+2.4888495600 5600 5600 5600 Commit found no work to do Region=0184 SSID=AAAA Commit found no work to do Region=0184 SSID=AAAA Commit found no work to do Region=0184 SSID=AAAA Commit found no work to do Region=0184 SSID=AAAA +2.488859+2.488859+2.488859+2.4888595612 5612 5612 5612 End of Phase 2 End of Phase 2 End of Phase 2 End of Phase 2 SyncpointSyncpointSyncpointSyncpoint Program=YYYYYYY Program=YYYYYYY Program=YYYYYYY Program=YYYYYYY +2.488864+2.488864+2.488864+2.488864A042 A042 A042 A042 Message received from OTMA Message received from OTMA Message received from OTMA Message received from OTMA DatastoreDatastoreDatastoreDatastore=MMMMMM =MMMMMM =MMMMMM =MMMMMM +2.488917+2.488917+2.488917+2.488917A042 A042 A042 A042 Message received from OTMA Message received from OTMA Message received from OTMA Message received from OTMA DatastoreDatastoreDatastoreDatastore=MMMMMM =MMMMMM =MMMMMM =MMMMMM +2.489037+2.489037+2.489037+2.489037A03D A03D A03D A03D Message Exit called for XMIT Message Exit called for XMIT Message Exit called for XMIT Message Exit called for XMIT +2.489926+2.489926+2.489926+2.489926A03E A03E A03E A03E Message Exit returned from XMIT Message Exit returned from XMIT Message Exit returned from XMIT Message Exit returned from XMIT +2.489943+2.489943+2.489943+2.489943A04A A04A A04A A04A WRITE Socket WRITE Socket WRITE Socket WRITE Socket +2.489999+2.489999+2.489999+2.489999A048 A048 A048 A048 Trigger Event Trigger Event Trigger Event Trigger Event +2.490032+2.490032+2.490032+2.490032
IMS Connect sends to IMS OTMA
OTMA finally logs the 01 record

Outils de Debugging et d'analyse de performances
RePenser IMS - Février 2009 - Paris 20
39
Scenario 2: DB2 and MQ problems
40
IMS PA daily performance summary report
IMS Performance Analyzer
Transaction R esource Usage
Data from 05.30.49 07Nov2006 to 05.45.18 07Nov2006 Page 1
Avg Avg Avg Avg <=1.0 1.0-2.0 >2.0 Avg Avg
Tran InputQ Process OutputQ Total Total Total Tot al CPU DB Call
Trancode Count Time Time Time IMS Time IMS Tim e IMS Time IMS Time Time Count
DSN8CS 7 0.011024 0.930524 0.000000 0.941549 71.43% 0.00% 28.57% 0.024617 0
DSN8PP 7 0.009017 0.627191 0.000000 0.636208 85.71% 14.29% 0.00% 0.018776 0
DSN8PS 21 0.011219 0.427845 0.007012 0.446075 100.00% 0.00% 0.00% 0.017876 0
DSN8PT 6 0.010506 0.373590 0.035327 0.419423 100.00% 0.00% 0.00% 0.018377 0
Total 41 0.010705 0.539763 0.008761 0.559229 92.68% 2.44% 4.88% 0.019254 0
Daily report flags that 28% of DSN8CS transaction were above the 2 second SLA
Outils de Debugging et d'analyse de performances
RePenser IMS - Février 2009 - Paris 21
41
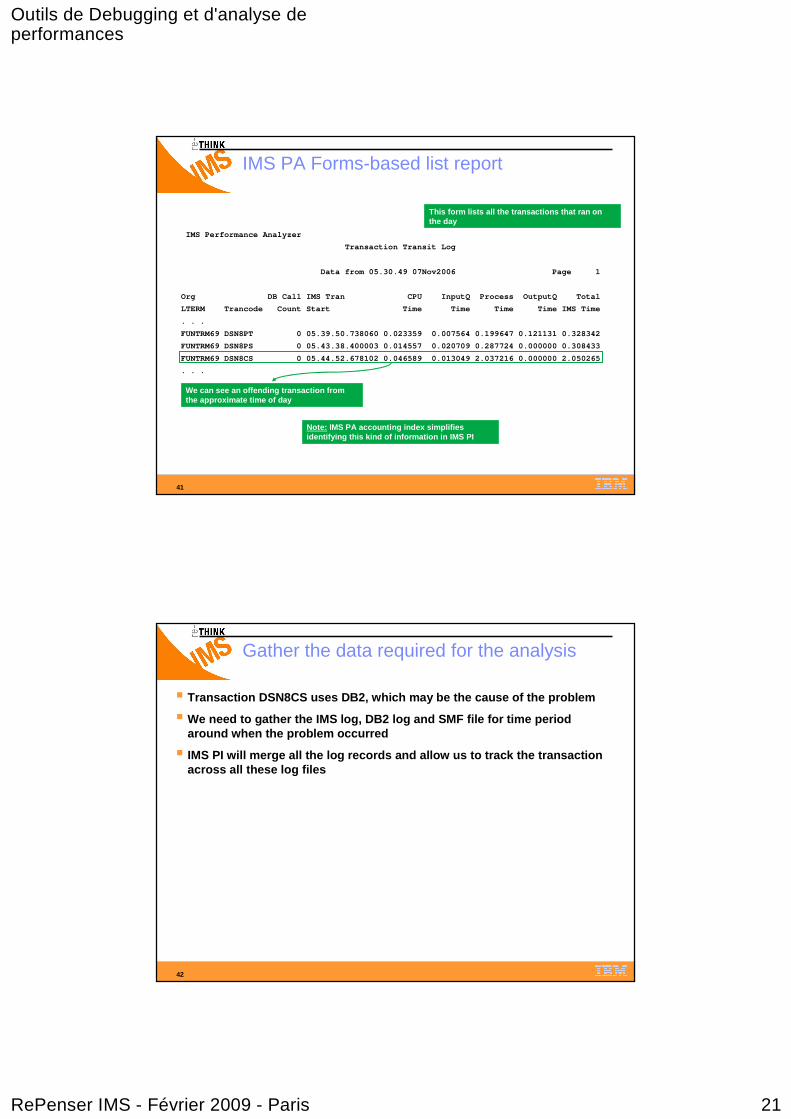
IMS PA Forms-based list report
IMS Performance Analyzer
Transaction Transit Log
Data from 05.30.49 07Nov2006 Page 1
Org DB Call IMS Tran CPU InputQ Process OutputQ Total
LTERM Trancode Count Start Time Time Time Time IMS Time
. . .
FUNTRM69 DSN8PT 0 05.39.50.738060 0.023359 0.007564 0.199647 0.121131 0.328342
FUNTRM69 DSN8PS 0 05.43.38.400003 0.014557 0.020709 0.287724 0.000000 0.308433
FUNTRM69 DSN8CS 0 05.44.52.678102 0.046589 0.013049 2.037216 0.000000 2.050265
. . .
We can see an offending transaction from the approximate time of day
This form lists all the transactions that ran on the day
Note: IMS PA accounting index simplifies identifying this kind of information in IMS PI
42
Gather the data required for the analysis
� Transaction DSN8CS uses DB2, which may be the cause o f the problem
� We need to gather the IMS log, DB2 log and SMF file for time period around when the problem occurred
� IMS PI will merge all the log records and allow us to track the transaction across all these log files
Outils de Debugging et d'analyse de performances
RePenser IMS - Février 2009 - Paris 22
43
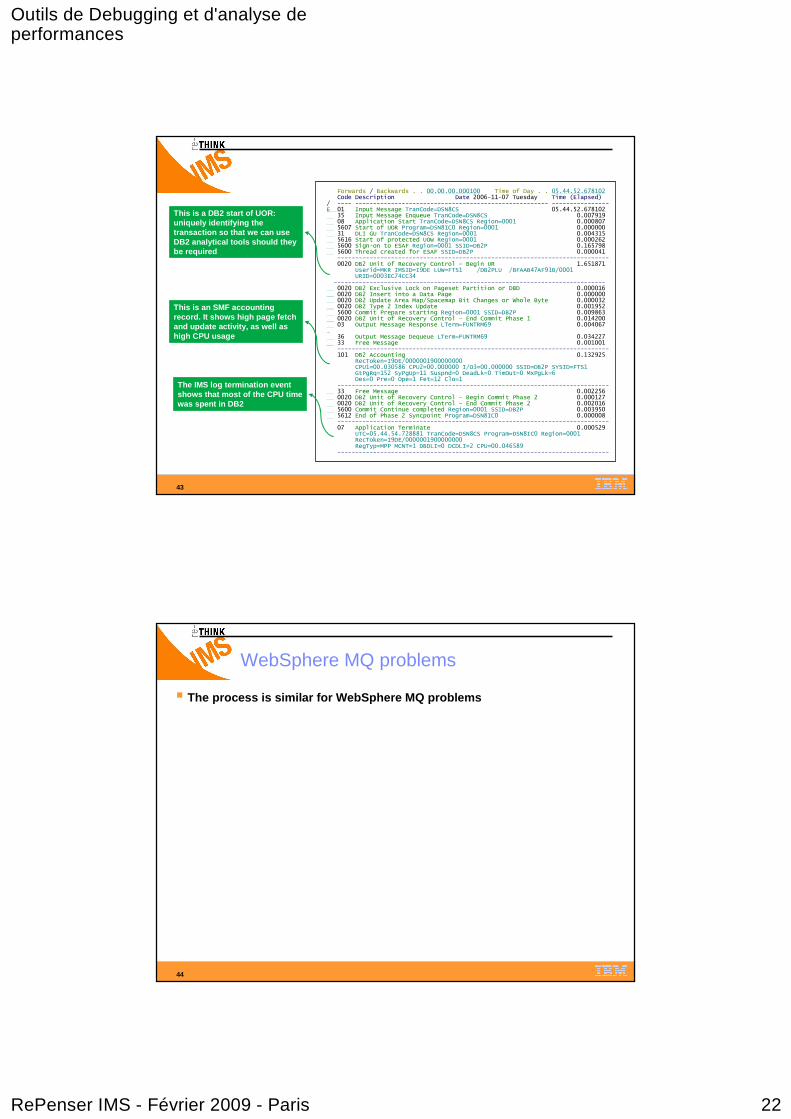
Forwards / Backwards . . 00.00.00.000100 Time of Day . . 05.44.52.678102Code Description Date 2006-11-07 Tuesday Time (Elapsed)
/ ---- ------------------------------------------------------ ----------------E 01 Input Message TranCode=DSN8CS 05.44.52.678102
35 Input Message Enqueue TranCode=DSN8CS 0.00791908 Application Start TranCode=DSN8CS Region=0001 0.0008075607 Start of UOR Program=DSN8IC0 Region=0001 0.00000031 DLI GU TranCode=DSN8CS Region=0001 0.0043155616 Start of protected UOW Region=0001 0.0002625600 Sign-on to ESAF Region=0001 SSID=DB2P 0.1657985600 Thread created for ESAF SSID=DB2P 0.000041----------------------------------------------------------------------------0020 DB2 Unit of Recovery Control - Begin UR 1.651871
Userid=MKR IMSID=I9DE LUW=FTS1 /DB2PLU /BFAAB47AF91B/0001URID=0003EC74CC34
----------------------------------------------------------------------------0020 DB2 Exclusive Lock on Pageset Partition or DBD 0.0000160020 DB2 Insert into a Data Page 0.0000000020 DB2 Update Area Map/Spacemap Bit Changes or Whole Byte 0.0000320020 DB2 Type 2 Index Update 0.0019525600 Commit Prepare starting Region=0001 SSID=DB2P 0.0098630020 DB2 Unit of Recovery Control - End Commit Phase 1 0.01420003 Output Message Response LTerm=FUNTRM69 0.004067
…36 Output Message Dequeue LTerm=FUNTRM69 0.03422733 Free Message 0.001001----------------------------------------------------------------------------101 DB2 Accounting 0.132925
RecToken=I9DE/0000001900000000CPU1=00.030586 CPU2=00.000000 I/O3=00.000000 SSID=DB2P SYSID=FTS1GtPgRq=152 SyPgUp=11 Suspnd=0 DeadLk=0 TimOut=0 MxPgLk=6Des=0 Pre=0 Ope=1 Fet=12 Clo=1
----------------------------------------------------------------------------33 Free Message 0.0022560020 DB2 Unit of Recovery Control - Begin Commit Phase 2 0.0001270020 DB2 Unit of Recovery Control - End Commit Phase 2 0.0020165600 Commit Continue completed Region=0001 SSID=DB2P 0.0039505612 End of Phase 2 Syncpoint Program=DSN8IC0 0.000008----------------------------------------------------------------------------07 Application Terminate 0.000529
UTC=05.44.54.728881 TranCode=DSN8CS Program=DSN8IC0 Region=0001RecToken=I9DE/0000001900000000RegTyp=MPP MCNT=1 DBDLI=0 DCDLI=2 CPU=00.046589
----------------------------------------------------------------------------
This is a DB2 start of UOR: uniquely identifying the transaction so that we can use DB2 analytical tools should they be required
This is an SMF accounting record. It shows high page fetch and update activity, as well as high CPU usage
The IMS log termination event shows that most of the CPU time was spent in DB2
44
WebSphere MQ problems
� The process is similar for WebSphere MQ problems
Outils de Debugging et d'analyse de performances
RePenser IMS - Février 2009 - Paris 23
45
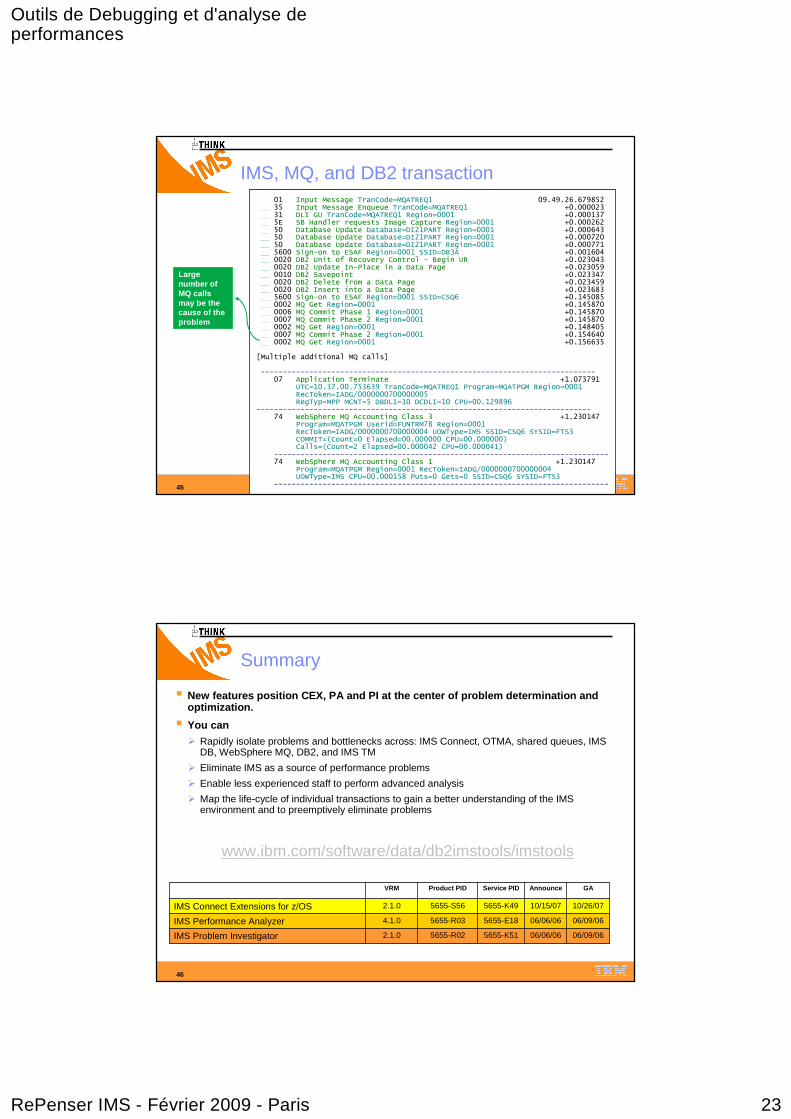
IMS, MQ, and DB2 transaction01 Input Message TranCode=MQATREQ1 09.49.26.67985235 Input Message Enqueue TranCode=MQATREQ1 +0.00002331 DLI GU TranCode=MQATREQ1 Region=0001 +0.0001375E SB Handler requests Image Capture Region=0001 +0.00026250 Database Update Database=DI21PART Region=0001 +0.00064350 Database Update Database=DI21PART Region=0001 +0.00072050 Database Update Database=DI21PART Region=0001 +0.0007715600 Sign-on to ESAF Region=0001 SSID=DB3A +0.0016040020 DB2 Unit of Recovery Control - Begin UR +0.0230430020 DB2 Update In-Place in a Data Page +0.0230590010 DB2 Savepoint +0.0233470020 DB2 Delete from a Data Page +0.0234590020 DB2 Insert into a Data Page +0.0236835600 Sign-on to ESAF Region=0001 SSID=CSQ6 +0.1450850002 MQ Get Region=0001 +0.1458700006 MQ Commit Phase 1 Region=0001 +0.1458700007 MQ Commit Phase 2 Region=0001 +0.1458700002 MQ Get Region=0001 +0.1484050007 MQ Commit Phase 2 Region=0001 +0.1546400002 MQ Get Region=0001 +0.156635
[Multiple additional MQ calls]
----------------------------------------------------------------------------07 Application Terminate +1.073791
UTC=10.37.00.753639 TranCode=MQATREQ1 Program=MQATPGM Region=0001RecToken=IADG/0000000700000005RegTyp=MPP MCNT=5 DBDLI=10 DCDLI=10 CPU=00.129896
----------------------------------------------------------------------------74 WebSphere MQ Accounting Class 3 +1.230147
Program=MQATPGM Userid=FUNTRM78 Region=0001RecToken=IADG/0000000700000004 UOWType=IMS SSID=CSQ6 SYSID=FTS3COMMIT=(Count=0 Elapsed=00.000000 CPU=00.000000)Calls=(Count=2 Elapsed=00.000042 CPU=00.000041)
----------------------------------------------------------------------------74 WebSphere MQ Accounting Class 1 +1.230147
Program=MQATPGM Region=0001 RecToken=IADG/0000000700000004UOWType=IMS CPU=00.000158 Puts=0 Gets=0 SSID=CSQ6 SYSID=FTS3
----------------------------------------------------------------------------
Large number of MQ calls may be the cause of the problem
46
Summary
� New features position CEX, PA and PI at the center o f problem determination and optimization.
� You can
� Rapidly isolate problems and bottlenecks across: IMS Connect, OTMA, shared queues, IMS DB, WebSphere MQ, DB2, and IMS TM
� Eliminate IMS as a source of performance problems
� Enable less experienced staff to perform advanced analysis
� Map the life-cycle of individual transactions to gain a better understanding of the IMS environment and to preemptively eliminate problems
06/09/0606/06/065655-K515655-R022.1.0IMS Problem Investigator
06/09/0606/06/065655-E185655-R034.1.0IMS Performance Analyzer
10/26/0710/15/075655-K495655-S562.1.0IMS Connect Extensions for z/OS
GAAnnounceService PIDProduct PIDVRM
www.ibm.com/software/data/db2imstools/imstools