last class we discussed: ways of knowing reality (science is chief means for psychology)...
TRANSCRIPT

Last class we discussed:
• Ways of knowing reality (science is chief means for psychology)
• Classification of Research Studies– (1) Design (experiment /
correlational / descriptive)– (2) Setting (field / lab)– (3) Data-collection method (self-
report / observation)

By the end of today’s class, you will be able to:
• Define statistics and its two branches• Understand the four scales of measurement• Deal with measures of central tendancy• Calculate standard deviation• Discuss the properties of a distribution curve

Statistics
•is the branch of mathematics that deals with the collection, organization, and analysis of numerical data.
•Even if your data doesn’t begin as a set of numbers, you can quantify it (turn it into numbers) and use statistical analysis.

What are statistics?• Numerical representations of large amounts of data
• Two Branches– Descriptive – tell us about the numbers– Inferential – tell us what the numbers mean
The work of the statistician is no longer confined to gathering and tabulating data (descriptive statistics), but is chiefly a process of interpreting the information (inferential statistics).

How do we obtain statistics?
• Through Quantification (#)
• All behaviour needs to be quantified to be analysed statistically
• How do we quantify behaviour?– Though scales of measurement

What are Scales of Measurement?
Four levels of measurement are commonly distinguished:
• Nominal• Ordinal• Interval• Ratio
• “NOIR”
Measurement is the assignment of numbers to objects or events in a systematic fashion.

Nominal
• Based on Categories
• No quantitative information is conveyed and no ordering of the items is implied.
– Gender
– Religion
– Ethnicity

Nominal scale
• Classifies data according to a category only.
• Measurement: Frequency distributions. How often do certain items or responses occur?
Ordinal
• Ordered in the sense that higher numbers represent higher values.
• However, the intervals between the numbers are not necessarily equal.
• e.g., “Strongly Disagree, Disagree, Neither Agree nor Disagree, Agree, Strongly Agree”

Ordinal scale
• Classifies data according to rank.• The difference between mild and average hotness may not
represent the same difference as the difference between a rating of hot and very hot.
• There is no "true" zero point for ordinal scales since the zero point is chosen arbitrarily.

Interval• One unit on the scale represents the
same magnitude on the trait or characteristic being measured across the whole range of the scale.
• For example, if anxiety were measured on an interval scale, then a difference between a score of 10 and a score of 11 would represent the same difference in anxiety as would a difference between a score of 50 and a score of 51.
Interval scale
• Does not have true zero point (it is arbitrary).
• On the anxiety scale: score of 30 NOT twice as anxious as score of 15. We know they are MORE anxious, but that’s about where it ends.
• Similarly, a score of zero does not mean that they have zero anxiety.
• True interval measurement is rare to nonexistent in the behavioral sciences. Most measurement scales in psychology are ordinal.

Ratio• All of the previous + absolute zero
- e.g. weight and height
– This scale has an absolute zero.
• Temperature of 300 Kelvin is twice as high as a temperature of 150 Kelvin.
• Time can have an absolute zero (no time).

Ratio scale
• Similar to interval scales, but has a true zero point.
• Racer C’s speed (below) was twice as fast as Racer A’s speed.

Levels of MeasurementMutually Exclusive
Rank Order
Equal Intervals
Absolute Zero
Nominal
Ordinal
Interval
Ratio
Note. Mutually Exclusive: Every point on every measurement scale is separate from every other point. You can’t be red and blue at the same time.

Concept Review
• Which rating scale is based on categories?– Nominal
• Which rating scale has an absolute zero?– Ratio
• Most psychological scales, such as the CES-D, which measures depression, use which rating scale?– Ordinal
• How do we interpret data? – Inferential Statistics

2 main branches of these statistics:
Inferential / Descriptive

Inferential Statistics
• Draw a sample from larger population– The sample is smaller than the
population and should be representative of the population.
– Use inferential statistics to draw inferences about the population based on the sample.
Statistics prescribes ways to take measurements of smaller groups of people and infer the findings true for all people matching the defined criteria, such as every Canadian adult between ages 25 and 34. The smaller group is our sample, and we infer from the sample to the population.
Descriptive Statistics
• Aims to describe sets of data values– Ex: a group of individual test scores.
• Each data value is a single measurement of some attribute being observed.
• The term data set refers to all data values considered in a set of statistical calculations.
• Descriptive statistics summarize sets of information.

Descriptive Stats cont’d
• Examples
– Central Tendency (mean, median, mode)
– Variability
– Shape of Distributions
– Relations (Correlation)• We’ll discuss each of these in turn

What are measures of central tendency?
• Each is a score that represents the typical performance of the sample
• Mode
• Mean
• Median

Mode
•Answers the question, "Which number or object appears the most often in our data set?“
•Can have more than one mode.•Example: Array of test scores 2,3,4,5,6,6,7,8,9,9 Mode is 6 & 9. We say it’s bimodal.

• Looking ahead: median and mean are a little more slippery (but not much more).
• It’s from the median and mean that we get the term “central tendency,” measures of the "center" (average) of the scores in a given data set.

Mean
sum of the individual scores divided by the total number of scores.
i.e. the average

Median…is the score that’s right in the middle of your data
set.
1/2 of the data set’s values less than or equal to the median; 1/2 of the numbers in the data set will have
values equal to or greater than the median.
To find the median of a finite list of numbers:Arrange all observations from lowest value to highest
value and pick the middle one. If there are an even number of observations, you can take the mean of the
two middle values.

Central Tendency Example• Hours watching The Bachelor per day for 10 people
Subject Hours– 1. 2– 2. 3– 3. 2– 4. 7– 5. 3– 6. 5– 7. 2– 8. 2– 9. 1– 10. 3
• Take a minute to calculate mean, median, and mode

Central Tendency Example• Hours watching The Bachelor per day for 10 people:
• Subject Hours– 1. 2– 2. 3– 3. 2– 4. 7– 5. 3– 6. 5– 7. 2– 8. 2– 9. 1– 10. 3
Mean = 3 (add all scores and divide by 10)
Median = 2.5
Mode = 2

Something important to keep in mind when writing papers:
A conclusion is simply the place where you got tired of thinking.

Variability

Consider Two Streets
• Conservative Street
• 45, 46, 47, 44, 43
• Mean = ?
• Wild Alley
• 25, 35, 45, 55, 65
• Mean = ?
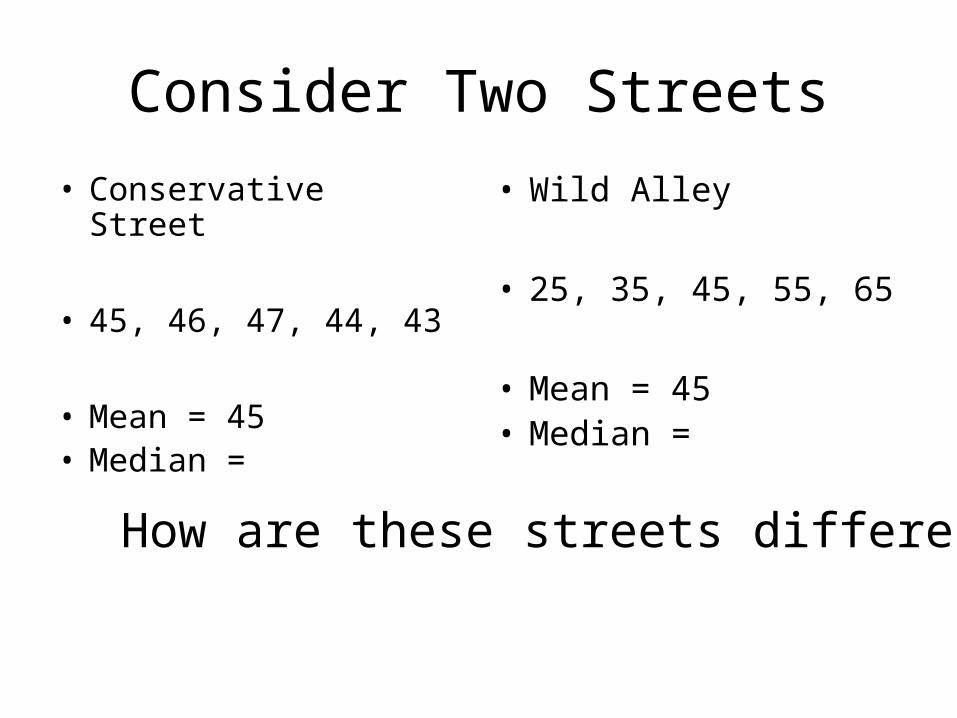
Consider Two Streets
• Conservative Street
• 45, 46, 47, 44, 43
• Mean = 45• Median =
• Wild Alley
• 25, 35, 45, 55, 65
• Mean = 45• Median =
How are these streets different?

Consider Two Streets
• Conservative Street
• 45, 46, 47, 44, 43
• Mean = 45• Median = 45
• Wild Alley
• 25, 35, 45, 55, 65
• Mean = 45• Median = 45
The means are the same. The medians are the same. How are these streets different?
Variability

What is Variability?
• Extent of dispersion around the mean.
• Are the scores all pretty close together or more spread out?

Variance• An index of variability (i.e. one
way to express variability).

Variance Formula
s2
(X X)2N
- 1
(Take the difference between each score and the mean, squaring each of these deviations, and then calculating the mean of the squared deviations. Finally, you divide by the number of scores minus one.)

The problem with varianceHas an ATTITUDE
It is an index in the wrong units! Everything was SQUARED to get the variance.
We need something else…

Hmmm
(ideas?)

Standard Deviation
• Square root of the squared deviations about the mean.
• i.e. square root of variance
(Wasn’t that disturbingly simple?)

Standard Deviation Formula
• Definitional Formula
• The standard deviation is equal to the square root of the sum of the squared deviations divided by the total number of scores
s
(X X)2N - 1

Practice Run: Calculate SD and Variance• Hours watching tv per day for 10 people
• Subject Hours (Hours – mean) squared• 1. 2• 2. 3• 3. 2• 4. 7• 5. 3• 6. 5• 7. 2• 8. 2• 9. 1• 10. 3
• Calculate SD and variance for the data.

• First step: –raw score minus mean. –then square the deviations. –Sum these together.
• Next:–Divide by n-1 to get variance.
• Then:–Take the square root of this for SD.

Calculate SD and Variance
• Hours watching tv per day for 10 people
Subject Hours (Hours – mean) squared1. 2 2 – 3 12. 3 3 – 3 03. 2 2 – 3 14. 7 7 - 3 16 5. 3 3 - 3 06. 5 5 - 3 47. 2 2 - 3 18. 2 2 - 3 19. 1 1 - 3 410. 3 3 - 3 0

• Sum = 28
• N – 1 = 9
• 28/9 = 3.11
Square Root of 3.11 = 1.76

When you collect data…
• Assumption – normality. We assume that many things in life take the form of a “normal curve” when graphed, with most scores occurring close to the mean, and some scores more spread out.
• Assumption sometimes violated
• Example: Give a middle school-level math test to 6-year-olds and to 18-year-olds. Result will not be a normal curve; rather, you will see two clumps: high scores (18-yr-olds) and low scores (6-yr-olds).

Properties of a distribution curve
• Skewness– Happens when the mean, median, and mode
aren’t the same.- symmetry of a curve- determined by the tail in the curve

Positively skewed
• Tail on the right side of the distribution
• Most scores cluster on the left side of the distribution
• If this was a math test, most people had a low score and just a few performed very well.

Negatively skewed
• Tail on the left side of the distribution• Most scores cluster on the right side of the
distribution• How did people perform on the math test this time?

Why is Skew a Problem?
• Can’t use certain formula (t-tests, correlation)– Assumption of normality is important
• Mathematically, we can manipulate the data to try to normalize distribution
• Or, use different formula

Kurtosis
• Peakedness of the curve compared to the normal curve.
• Are the scores grouped more toward the middle (the mean) or more toward the tails of the distribution

Leptokurtic
• Pointed shape• Kurtosis >3• Most scores cluster at the middle of the
distribution• Simultaneously “peaked” centre and
“fat” tails

Platykurtic
• Flat shape• Kurtosis <3• Many scores spread toward the tails of
the distribution• Simultaneously less peaked and thinner
tails

Mesokurtic
• Normal curve distribution• Kurtosis = 0 (no skew)
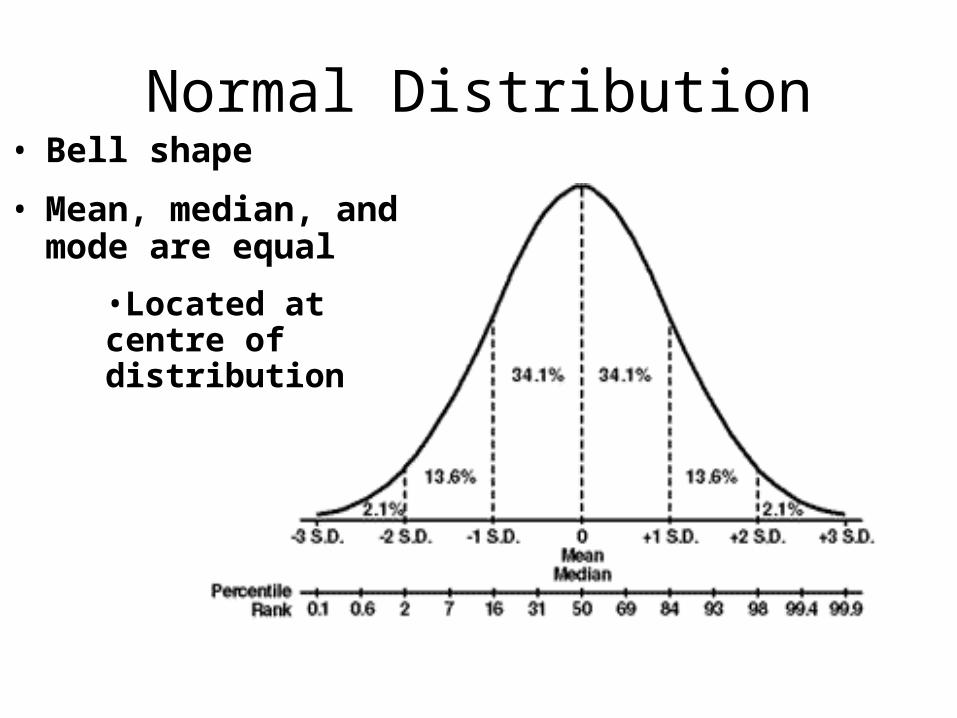
Normal Distribution• Bell shape
• Mean, median, and mode are equal
•Located at centre of distribution

Area of the Normal Curve
• 47.5% of scores is between 0 and 2 SD• 95% within two SD above and below
• 34% is one SD above or below the mean
• 68% within one SD above and below