laser spectroscopic analysis of liquid water samples … · laser spectroscopic analysis of liquid...
TRANSCRIPT

T R A I N I N G C O U R S E S E R I E SI S S N 1 0 1 8 – 5 5 1 8 35
Laser Spectroscopic Analysisof Liquid Water Samples for
Stable Hydrogen and Oxygen Isotopes
V I E N N A , 2 0 0 9
Laser Spectroscopic A
nalysis of Liquid Water S
amples for S
table Hydrogen and O
xygen IsotopesT
RA
IN
IN
G
CO
UR
SE
S
ER
IE
S
35
TCS-35_cover_A4.qxd 2009-09-30 11:35 Page 1

TRAINING COURSE SERIES No. 35
Laser Spectroscopic Analysis of Liquid Water Samples
for Stable Hydrogen and Oxygen Isotopes
Performance Testing and Procedures for Installing and Operating the LGR DT-100 Liquid Water Stable Isotope Analyzer
INTERNATIONAL ATOMIC ENERGY AGENCY, VIENNA, 2009

The originating Section of this publication in the IAEA was:
Isotope Hydrology Section
International Atomic Energy Agency Wagramer Strasse 5
A-1400 Vienna, Austria
LASER SPECTROSCOPIC ANALYSIS OF LIQUID WATER SAMPLES FOR STABLE HYDROGEN AND OXYGEN ISOTOPES
IAEA, VIENNA, 2009
IAEA-TCS-35 ISSN 1018–5518
© IAEA, 2009
Printed by the IAEA in Austria
October 2009
PO Box 100

FOREWORD
Stable isotope ratios of hydrogen and oxygen are tracers of choice for water cycle processes in hydrological, atmospheric and ecological studies. The use of isotopes has been limited to some extent because of the relatively high cost of isotope ratio mass spectrometers and the need for specialized operational skills. Here, the results of performance testing of a recently developed laser spectroscopic instrument for measuring stable hydrogen and oxygen isotope ratios of water samples are described, along with a procedure for instrument installation and operation. Over the last four years, the IAEA Water Resources Programme conducted prototype and production model testing of these instruments and this publication is the outcome of those efforts. One of the main missions of the IAEA is to promote the use of peaceful applications of isotope and nuclear methods in Member States and this publication is intended to facilitate the use of laser absorption based instruments for hydrogen and oxygen stable isotope analyses of liquid water samples for hydrological and other studies.
The instrument uses off-axis integrated cavity output spectroscopy to measure absolute abundances of 2HHO, HH18O, and HHO via laser absorption. Test results using a number of natural and synthetic water standards and samples with a large range of isotope values demonstrate adequate precision and accuracy (e.g. precisions of 1‰ for δ2H and 0.2‰ for δ18O). The laser instrument has much lower initial and maintenance costs than mass spectrometers and is substantially easier to operate. Thus, these instruments have the potential to bring about a paradigm shift in isotope applications by enabling researchers in all fields to measure isotope ratios by themselves.
The appendix contains a detailed procedure for the installation and operation of the instrument. Using the procedure, new users should be able to install the instrument in less than two hours. It also provides step-wise information on data post-processing, maintenance and troubleshooting.
The IAEA wishes to acknowledge the assistance provided by the contributors and reviewers listed at the end of the report. The IAEA officer responsible for this publication was P.K. Aggarwal of the Division of Physical and Chemical Sciences.

EDITORIAL NOTE
The use of particular designations of countries or territories does not imply any judgement by the publisher, the IAEA, as to the legal status of such countries or territories, of their authorities and institutions or of the delimitation of their boundaries.
The mention of names of specific companies or products (whether or not indicated as registered) does not imply any intention to infringe proprietary rights, nor should it be construed as an endorsement or recommendation on the part of the IAEA.

CONTENTS
1. INTRODUCTION .......................................................................................................................... 1
2. PERFORMANCE TESTING ......................................................................................................... 3
3. FINDINGS AND CONCLUSIONS ............................................................................................... 8
APPENDIX 1 IAEA STANDARD OPERATING PROCEDURE FOR THE LGR DT-100 LIQUID WATER STABLE ISOTOPE ANALYZER .................................................... 9
A. SAMPLE PREPARATION........................................................................................ 9
B. CONFIGURING THE RUN AND STARTING THE ANALYSIS......................... 12
C. DATA TRANSFER.................................................................................................. 14
D. DATA POST-PROCESSING................................................................................... 15
E. CHANGING THE AUTOSAMPLER SEPTUM ..................................................... 21
F. CHANGING THE AUTOSAMPLER SYRINGE AND RECOVERING FROM
G. EQUIPMENT AND CONSUMABLES LIST ......................................................... 25
H. INITIAL SET UP OF THE PAL AUTOSAMPLER AND THE LASER ISOTOPE INSTRUMENT...................................................................................... 26
I. MAINTENANCE, TROUBLESHOOTING, AND NOTES ON RUNNING DIRTY AND HIGH SALINITY SAMPLES.......................................................... 31
REFERENCES...................................................................................................................................... 35
CONTRIBUTORS TO DRAFTING AND REVIEW........................................................................... 37
AN ABORTED RUN BECAUSE OF A BENT NEEDLE..................................... 23

1
1. INTRODUCTION
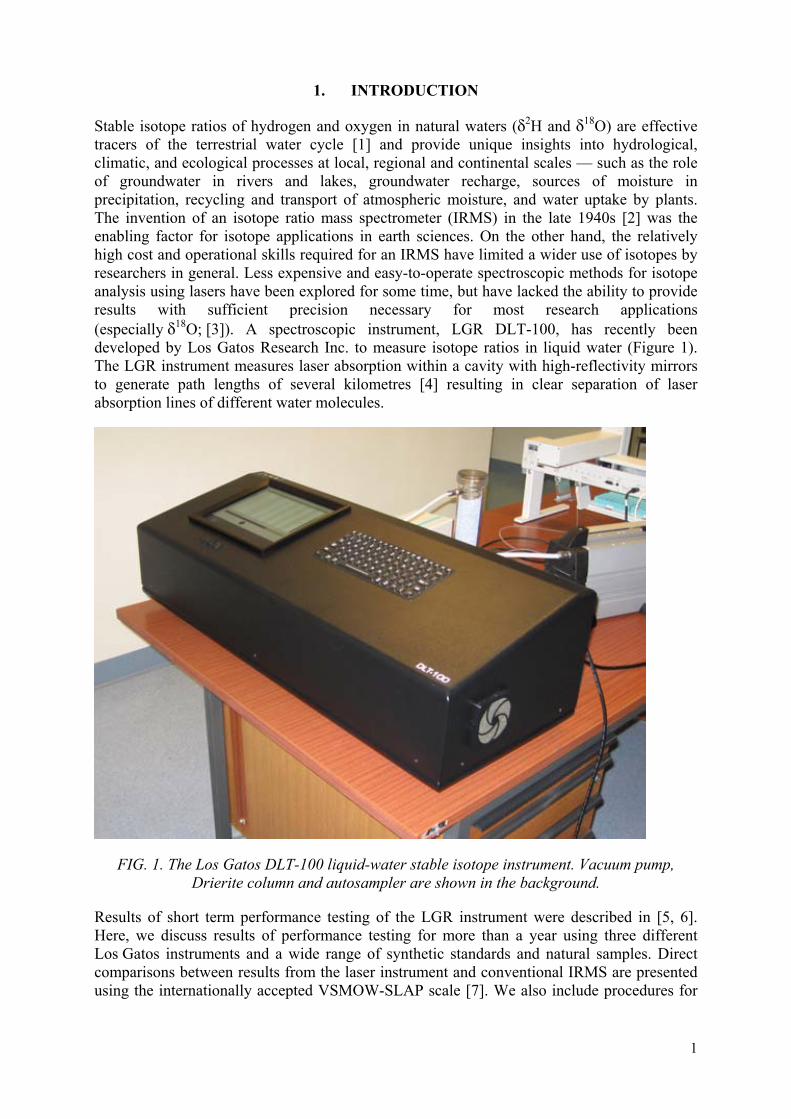
Stable isotope ratios of hydrogen and oxygen in natural waters (δ2H and δ18O) are effective tracers of the terrestrial water cycle [1] and provide unique insights into hydrological, climatic, and ecological processes at local, regional and continental scales — such as the role of groundwater in rivers and lakes, groundwater recharge, sources of moisture in precipitation, recycling and transport of atmospheric moisture, and water uptake by plants. The invention of an isotope ratio mass spectrometer (IRMS) in the late 1940s [2] was the enabling factor for isotope applications in earth sciences. On the other hand, the relatively high cost and operational skills required for an IRMS have limited a wider use of isotopes by researchers in general. Less expensive and easy-to-operate spectroscopic methods for isotope analysis using lasers have been explored for some time, but have lacked the ability to provide results with sufficient precision necessary for most research applications (especially δ18O; [3]). A spectroscopic instrument, LGR DLT-100, has recently been developed by Los Gatos Research Inc. to measure isotope ratios in liquid water (Figure 1). The LGR instrument measures laser absorption within a cavity with high-reflectivity mirrors to generate path lengths of several kilometres [4] resulting in clear separation of laser absorption lines of different water molecules.
FIG. 1. The Los Gatos DLT-100 liquid-water stable isotope instrument. Vacuum pump, Drierite column and autosampler are shown in the background.
Results of short term performance testing of the LGR instrument were described in [5, 6]. Here, we discuss results of performance testing for more than a year using three different Los Gatos instruments and a wide range of synthetic standards and natural samples. Direct comparisons between results from the laser instrument and conventional IRMS are presented using the internationally accepted VSMOW-SLAP scale [7]. We also include procedures for

2
instrument installation, operation, and data reduction in Appendix 1. Other resources such as an instrument training video are available through the IAEA Water Resources Programme web site at http://www.iaea.org/water/.
Analytical background
The following describes the basic theory of the analytical approach. Additional details including references are available in [3, 4]. When a laser beam is directed through water vapour, the mixing ratio (or mole fraction) χ of a gas is related to measured absorption according to Beer's Law [4]:
vPSL
oI
vI e φχ−= (1)
where Iv is the transmitted laser intensity through the sample at frequency v; Io is the intensity before entering the cell; P is gas pressure; S is absorption line strength; φv is the transition lineshape function (with ∫ ≡1)( dvvφ ), and L is the optical path length. Rearranging and integrating (1), the mixing ratio is given as:
dvII
SLP v
o
v⎟⎟⎠
⎞⎜⎜⎝
⎛= ∫ ln1χ (2)
Thus, the absolute abundance of individual molecules can be quantified through the amount of absorbance at a specific wavelength. Although the laser absorption approach has been known for many years, the problem has been in quantifying absorbance to reach adequate precision in measured isotope ratios. The Los Gatos instrument utilizes an Off-Axis Integrated Cavity Output Spectroscopy (off axis ICOS) approach which can generate optical path lengths of about 2 500 meters in a 25 cm cell. As the path length depends only on optical losses in the cavity, and not on a unique beam trajectory (as in conventional multi-pass cells or cavity ringdown systems; [3, 4]), the optical alignment is very robust. These features significantly increase measured absorption and result in a high signal-to-noise ratio for precise isotope measurements.
The LGR instrument measures absorption around a wavelength of 1 390 nm to calculate molecular concentrations of 2HHO, HH18O, and HHO. Molecular concentrations are converted into atomic ratios, 2H/1H and 18O/16O and a post-processing procedure is used to calculate delta-scale (δ) values with respect to Vienna Standard Mean Ocean Water (VSMOW; [7]):
VSMOW
VSMOWmeasured
RRR −=δ (3)
where R is 2H/1H or 18O/16O.

3
2. PERFORMANCE TESTING
Methods
The instrument configuration (Figure 1) used in this study includes the LGR DLT-100 (model # 908-0008, which contains the laser analysis system and an internal computer), a CTC LC-PAL liquid autosampler, a small membrane vacuum pump, and a room air intake line that passes air through a Drierite column for moisture removal. The autosampler and the DLT-100 are connected by a ~1 m long PTFE transfer line. A Hamilton microliter syringe (model 7701.2N) is used to inject 0.75 μL of sample through a PTFE septum in the autosampler. The injection port of the autosampler is heated to 80°C to help vaporize the sample under vacuum immediately upon injection. The vapor then travels down the transfer line into the pre-evacuated mirrored chamber for analysis. Unlike the version of the instrument described by [6], newer LGR instruments do not require wrapping the transfer line with heating tape. Input of sample lists and instrument configurations are made through the internal computer system.
A number of secondary standards (spanning a range of over 185‰ in δ2H and 24‰ in δ18O) and natural water samples were used to test the performance of a prototype version of the LGR instrument [5]. Results of that study indicated that inconsistencies in the amount of water introduced into the laser cell strongly influenced the absorption peaks and produced measurements of isotope ratios with large uncertainties. Consequently, a number of modifications were implemented with respect to sample input procedure, data collection electronics, and signal processing algorithms. These modifications were expected to remove water amount and temperature effects to the extent possible. Currently, instruments produced by LGR have the same design improvements as the instruments used in this study.
Through experience, a procedure for analysis was developed that is relatively simple though specific to the Los Gatos instrument (provided in Appendix 1). Briefly, a 1-mL aliquot of a sample (filtered if it is cloudy or contains sediment) or standard is pipetted into a 1.5-mL autosampler glass vial and closed with PTFE septum caps. It is important to leave some amount of head-space in the vials. Sample and standard vials in the autosampler tray are arranged in a certain order that is important to follow for best results. In this scheme, a dummy sample (de-ionized water or tap water) is placed in the first position to prime the flow line. The instrument is prone to give erratic results during the start of a run and the dummy sample allows the system to stabilize before the first standards are run. The dummy vial is followed by three secondary standards (two calibration standards and a control standard, similar to the typical IRMS approach), five unknowns, and then another set of standards. This array of standards and unknowns is repeated up to a maximum of six times (30 unknowns) for a single run. Each standard or unknown is individually measured with six injections lasting about twenty five minutes, and a daily run with 30 unknowns takes about 20 hours.
The array of vials was designed to overcome the effects of instrumental drift which can be significant during a daily run, but appears to be unpredictable. In this approach, the results for the last four of the six injections from each vial are averaged. The first two injections are disregarded because they tend at times to be less stable and are also the injections with the most potential for carrying a memory effect from the previous sample. Measurements and known δ values (with respect to VSMOW) of calibration standards before and after each batch of five unknowns are used for a linear regression to convert absolute isotope ratios to δ values. This batch calibration approach yields excellent results without the need for a drift

4
correction. There is some loss of productivity by having to include additional standards, but this minor loss is more than made up by the consistency and acceptability of results.
Results
As part of the performance testing, more than one thousand measurements of secondary standards and natural waters were made to examine reproducibility and for comparison to conventional IRMS results. Additional analyses were made to examine instrument performance over a wider range of isotope values using a set of labeled waters with very positive isotope values.
Long term performance
Comparisons were made between laser instrument results for two secondary standards and a well characterized groundwater sample with their accepted (known) values based on repeated IRMS measurements. Nearly 200 laser analyses of each water type were made on 29 different days for the two secondary standards (std7 and std9) and a natural water from the Great Artesian Basin, Australia (GAB, with a salinity of approximately 1 100 mg/L). Each run consisted of different combinations of secondary standards and GAB water. Measured molecular ratios (2HHO/H2O and H2
18O/H2O) of std7, std9 and the GAB water varied in a narrow range of less than 0.3% from the mean value. The long term averages of calculated δ values for these runs are shown in Table 1. The laser based results are in close agreement with the accepted values for both δ2H and δ18O for all three water types.
TABLE 1. COMPARISON OF δ18O AND δ2H VALUES OF SECONDARY STANDARDS (STD7, STD9) AND GREAT ARTESIAN BASIN WATER FROM LASER ISOTOPE ANALYSIS (AVERAGE OF 196 MEASUREMENTS) WITH PREVIOUSLY DETERMINED VALUES. ALL Δ VALUES ARE ‰ WITH RESPECT TO VSMOW
Sample Accepted δ2H Laser δ2H Accepted δ18O Laser δ18O
Std7 -4.1±1.2 -4.1±1 -0.07±0.03 -0.1±0.2
Std9 -189.1±0.9 -188.8±1 -24.8±0.03 -24.7±0.2
GAB -38.6±1.4 -38.9±1 -5.8±0.1 -5.8±0.2
In another test, samples from 33 natural waters with a wide range of isotope values from various parts of the world were analyzed in our laboratory using laser and mass-spectrometric techniques. The results plot on the 1:1 line indicating excellent agreement between the laser based analyses and IRMS (Figure 2). Differences between laser- and IRMS-based values are typically within the method uncertainties.

5
Laser Based δ2H (‰)
-250 -200 -150 -100 -50 0 50
IRM
S B
ased
δ2 H
(‰)
-250
-200
-150
-100
-50
0
50
A
Laser Based δ18O (‰)
-30 -25 -20 -15 -10 -5 0 5
IRM
S B
ased
δ18
O (‰
)
-30
-25
-20
-15
-10
-5
0
5
B
FIG. 2. Comparison of measured δ values of 33 natural water samples from various parts of the world using IRMS and laser spectroscopy. The δ2H values are shown in plot A, and the δ18O values in plot B (all data in ‰ relative to VSMOW). The analytical uncertainties
are less than the symbol size.
Another way of evaluating the laser instrument performance is to examine results for a control standard that is analyzed with each sub-batch. This control standard is not used to determine the calibration equation, so it provides an unbiased indicator of the accuracy of each sub-batch of unknowns. Such data also indicate the stability of the instrument during a run and over multiple runs. Results for control standard analyses from a typical run are shown in Table 2. The Δ values for individual analyses (differences between known and measured values of the

6
control standard) demonstrate good accuracy and stability, and the runs had an average Δ values of only 0.4 ‰ for δ2H and 0.09 ‰ for δ18O (Table 2).
TABLE 2. EXAMPLE DIFFERENCES BETWEEN MEASURED AND ACCEPTED δ2H AND δ18O VALUES OF A CONTROL STANDARD (STANDARD 6) USING THE LOS GATOS INSTRUMENT. THE LONG TERM UNCERTAINTY IS GIVEN FOR THE ACCEPTED VALUES, LASER ± VALUES ARE INSTRUMENT UNCERTAINTIES
Standard δ2H laser
based value
δ2H accepted
value Δ δ2Ha δ18O laser
based value
δ18O known value
Δ δ18Oa
Std6 -61.4±0.3 -61.1±0.3 0.5 -8.56±0.06 -8.7±0.06 0.18
Std6 -61.5±0.3 -61.1±0.3 0.4 -8.65±0.09 -8.7±0.06 0.09
Std6 -61.5±0.4 -61.1±0.3 0.4 -8.81±0.12 -8.7±0.06 0.07
Std6 -61.4±0.5 -61.1±0.3 0.5 -8.59±0.08 -8.7±0.06 0.15
Std6 -61.5±0.4 -61.1±0.3 0.4 -8.77±0.05 -8.7±0.06 0.03
Std6 -62.2±0.6 -61.1±0.3 0.3 -8.77±0.08 -8.7±0.06 0.03
Std6 -61.3±0.3 -61.1±0.3 0.6 -8.68±0.13 -8.7±0.06 0.06
Average -61.5±0.5 -61.1±0.3 0.4b -8.7±0.1 -8.7±0.06 0.09b aabsolute values; baverage Δ
Performance over a wide range of delta values
The performance of the laser instrument using a set of artificial heavy water samples was also examined. The goal of this test was to see how well the instrument performed over a broader range of isotope compositions than is typically observed in natural systems, and to evaluate the instrument’s usefulness for analysis of samples from labeled isotope tracer tests (e.g. in ecological and human health studies). In this test, results from three heavy water samples were compared to measurements of the same samples made using IRMS (Table 3). For water 1, the average δ2H from the IRMS and laser analyses are indistinguishable considering the analytical errors (Table 3).
For waters two and three, the laser- and IRMS-based results are also quite comparable (Table 3). These heavy water tests demonstrate the broad linearity of the laser instrument, and the fact that no dilutions are required is an advantage for analyses of heavy stable isotope samples. Memory effects can be substantial when analyzing waters with extreme isotope compositions (especially for waters over 1000‰). However, testing indicates that running twelve injections (two sample vials) of de-ionized tap water immediately after a heavy water sample is typically adequate to remove the memory effect. Operationally, running eighteen injections (three sample vials) is recommended to be sure that memory effects are eliminated before the next standard or unknown is run.

7
TABLE 3. COMPARISON OF LASER- AND IRMS-BASED ANALYSES FOR HEAVY WATER SAMPLES
Method/Sample δ2H (‰) δ18O (‰)
IRMS Water 1 1674±4.6a NA
Laser Water 1 1677±6.9b NA
IRMS Water 2 26.4±1.4c 13.8±0.1
Laser Water 2 27.8±0.5d 13.9±0.1
IRMS Water 3 28.7±1.4c 14.1±0.1
Laser Water 3 29.3±0.6d 14.2±0.1 aaverage of 3 analyses; baverage of 11 analyses; csingle analysis
(standard deviation is instrument value); daverage of 10 analyses; NA not analyzed
Stability of laser-based isotope measurements
The reproducibility of measurements for five natural water samples run on three consecutive days is shown in Figure 3. Each water type was analyzed once every day. For all samples, the standard deviations ranged from 0.2-0.7 for δ2H and 0.1 to 0.2 for δ18O over the three day period. These results indicate the technique has good repeatability over consecutive days since the standard deviations would be considered acceptable even for a single run within a given day.
Water Sample
64981 64982 64983 64984 64985
δ18O
(‰)
-6
-4
-2
0
δ2 H (‰
)
-16
-14
-12
-10
-8
-6
-4
-2
0
2
4
Day 1Day 2Day 3
δ18O
δ2H
FIG. 3. Repeatability of δ2H (dotted line) and δ18O (solid line) values over a three day period using five natural waters.

8
3. FINDINGS AND CONCLUSIONS
There are several advantages of the laser spectroscopic technique for isotope analysis over conventional mass spectrometers that make it an attractive option. First, the initial cost of the laser instrument is substantially lower than a mass spectrometer (about US $55 000 versus US $250 000) and running costs are minimal with no requirements for compressed gasses or other special consumables. A second major advantage is that other than pipetting samples into autosampler vials, there are no sample preparation steps. This means that little effort is required for preparing an analytical run and errors resulting from steps such as CO2 equilibration or water oxidation with zinc or manganese are eliminated. Another key advantage is that both δ2H and δ18O results are obtained in a single run. The instrument and autosampler have a much smaller footprint than a conventional mass spectrometer and can easily sit on a laboratory benchtop (Figure 1). Based on the cost, ease of use, and few consumables, the off-axis ICOS laser spectrometer is a good option for laboratories or countries which lack the resources and expertise to run and maintain a dual-inlet mass spectroscopy system.
Results of performance testing presented here show that the laser instrument is capable of providing accurate results with a precision of approximately 1 ‰ for δ2H and 0.2 ‰ for δ18O in liquid water samples of up to at least 1000 mg/L dissolved salt concentration. In addition, it has good linearity for running analyses of artificial isotope tracers which have values much heavier than natural samples.
A step by step procedure (included in Appendix 1) and a video have been developed for using this laser spectroscopic instrument that includes sections on installation, operation and maintenance, as well as post-processing template for conversion of raw results to δ values. To facilitate a wider use of this instrument, the video and data reduction spreadsheet can be downloaded from www.iaea.org/water.
ACKNOWLEDGEMENTS
We would like to thank Leopold Mayr for supplying two of the heavy water samples, and Liliana Pöltenstein and Michael van Duren for their assistance in the laboratory.

9
APPENDIX 1 IAEA STANDARD OPERATING PROCEDURE FOR THE
LGR DT-100 LIQUID WATER STABLE ISOTOPE ANALYZER
IAEA standard operating procedure for the liquid water stable isotope analyzer
This procedure is comprised of eight sub-procedures and an equipment list for the Los Gatos Research DLT-100 analyzer for 2H and 18O:
(A) sample preparation; (B) configuring the run and starting the analysis; (C) data transfer; (D) data post-processing; (E) changing the autosampler septum; (F) changing the autosampler syringe and recovering from an aborted run because of
a bent needle; (G) equipment and consumables list; (H) initial set up of the PAL autosampler and the laser isotope instrument; (I) maintenance, troubleshooting and notes on running dirty and high salinity samples.
Please also be familiar with, and refer to, the LGR Liquid Water Isotope Analyzer manual and the LC PAL Auto sampler user manual.
A. SAMPLE PREPARATION
What you will need (see also Figure 1):
• table with sufficient working space; • fine point permanent marking pen; • autosampler vials; • autosampler caps with PTFE septa; • 1mL (1000 μL) automatic pipette; • disposable pipette tips (for 1 mL); • box of tissue papers; • your samples.
FIG. 1. Photo of sample preparation table.

10
Three bottles of in-house standards, two for calibration, and one for a control (their δ18O and δ2H values should be well determined using an independent set of analyses, such as from another couple of laboratories or a dual inlet instrument). The calibration standards should preferably bracket the expected range of isotope values. The control standard should have an intermediate isotope composition compared to the two calibration standards (it is also good if it is similar to the expected values of the samples). These in house standards are not typically IAEA standards, but should be calibrated to them. Also, remember to store the standards properly and protect them from evaporation.
Procedure
(1) Select the group of samples for analysis. Using a permanent marker, label empty vials with the name of the standard or the sample ID, and place them in proper position on the autosampler tray (positioning is described below and shown in Figure 2). Record this information in the instrument logbook. Sample and standard positions (for three standards) should be determined as follows:
• 1st position on the tray (top left corner) should be a dummy sample because this analysis is usually not a good one and the results will be discarded. The dummy can be any clean water (e.g. tap water), it doesn’t have to be a standard or even a sample with a known isotope value.
• 2nd position should be for the heavy isotope calibration standard. • 3rd position should be for the light isotope calibration standard. • 4th position should be for the third standard (the control standard).
Note that putting the dummy sample and calibration and control standards in this order is important if you want to use the IAEA spreadsheet for post-processing of the instrument data.
• The next five positions (5–9) are for the first five samples. • Positions 10 through 12 should be for the same three in-house standards. • And so on… Just remember to put three standards after every five samples,
including a last set of standards at the end of the tray (run).
Suggested maximum number of samples is 52 including standards (even though the autosampler will hold many more). A de-ionized (DI) water sample can also be placed in position 53 to clean the syringe after the run.
(2) Place a disposable pipette tip on the pipette. Shake the standards to equilibrate, and dispense 1 mL into the appropriate vials on the autosampler tray (you only have to change the pipette tip when you change standards or between samples, e.g. fill all the standard 1 vials with one pipette tip, then put a new tip on and fill all the standard 2 the vials.
(3) Shake the samples to equilibrate, and put on a fresh pipette tip. Using the pipette and a fresh tip for every sample, fill the remaining autosampler vials with the appropriate sample. It is best to only fill five vials at a time, and then cap the filled vials finger tight (and the open sample bottles). This will help you keep track of what needs to be filled next and prevents evaporation of the samples. Be careful to pipette the samples and standards into the correct vials (use the logbook to help verify this). The vial at position 53 should be filled with de-ionized water and is used to help clean the syringe after the run.

11
(4) When all the vials are filled and capped, double check that the logbook matches what is in the tray by spot checking a few different locations.
(5) Place the tray on the autosampler (Figure 3) and configure the run on the laser instrument.
FIG. 2. Sample positions in the autosampler tray for a three-standard arrangement. D is the dummy sample (position 1), the yellow, purple, and green spots are for standards.
DI is for post-run cleaning of the syringe.
Notes: Warning!
Do the sample preparation very carefully! Mixing samples up can create many problems. It may take around two hours (or more) to prepare a tray with 25 to 50 samples.
If you want to do a rerun of the same sample, just replace the cap with septa (you don’t need to re-pipette it). You can do this once. If you need to rerun a third time, it is best to prepare a new vial. After 12 injections (2 runs from the same sample vial with 6 injections) the sample precision will start to decrease.
Do not reuse the autosampler vial caps/septa. Sample vials are also disposable, so use new ones. If it is necessary to reuse vials, make sure they are well cleaned, rinsed, and oven dried before using. Again, never reuse caps/septa!

12
FIG. 3. Autosampler with vials ready for analysis.
B. CONFIGURING THE RUN AND STARTING THE ANALYSIS
(1) Examine the logbook and determine if it is time to replace the autosampler septum (at 325 injections or sooner). Analysis of a tray with 53 vials requires 318 injections. If a new septum is required, follow the replacing the septum procedure later in this document (warning-improper changing of the septum can severely damage the instrument-follow the procedure!).
(2) Examine that there is sufficient active Drierite in the column (at least 2.5 cm of blue is left), if not refill or replace the column. Drierite can also be regenerated following the manufacturers directions.
(3) Check the spectrum on the laser (see example in Figure 4) by selecting spectrum. This spectrum is from the last analysis that is stored in the system’s memory (note there will be no spectrum the first time you turn on the machine). Examine the absorption peak and make sure it is within the shaded area on the plot. If the peak is out of alignment (to the right) by at least ½ division (0.25 GHz) and the curve extends outside the right side of the shaded area, follow the laser offset adjustment procedure in the LGR manual. The adjustment should only be required every three to five days, but always check it before starting a run.

13
FIG. 4. Spectrum check.
(4) Check, and set if necessary, the number of injections to 6 (this means 6 per vial).
(5) Go to the sample list and hit delete to remove the old listings. It will also not allow you to remove the last one.
(6) Enter the new information into the sample list by first putting the mouse arrow on the left column and then click OK with the left mouse button. Then click the arrow on Row 1 Column 1 (name) and type in the sample or standard name using the keyboard on the instrument. The first sample will be the dummy sample. Then click insert on the screen or hit enter using the keyboard. To add more samples to the list, hit insert, then move the arrow over the null cell and type in the new sample ID. Enter samples in the same order as they are on the autosampler tray. Repeat until all the samples and standards have been entered. Delete any extra null rows that may be at the bottom of the list. Be careful when entering the sample information. It is easy to make a mistake, so you should double check that the information is entered properly.
(7) Highlight a sample on the sample list and click select all.
(8) Then move the sample list to the run list side by clicking on the [>] key only once (otherwise you will get duplicate sample lists in the run list and it will run everything twice).
(9) Get rid of the remaining old sample file on the run list at this point by clicking it with the mouse arrow and then click on the [<-] key to delete it. Check that the first sample is listed as tray 1, position 1.

14
(10) Click on run (the syringe icon), and you should see the run screen with all 6 injections labeled. Then hit the right pointing arrow key on the screen. The system will ask if it is OK to start acquisition and if so, click on OK (the check mark on the screen). The system should say that it is flushing the cavity on the lower right of the screen.
(11) Watch the autosampler for the first sample to make sure it is operating properly (takes about 4-5 minutes). The syringe will move up and down three or four times before it actually injects the sample. Also check the amount of water data and spectrum on the laser after the first injection has been measured. Amount of water should be in the e+16 range and the spectrum should be a smooth curve. If you see individual large markers on the spectrum or low water amounts (anything less than +16), the syringe likely needs replacement. Abort the run and follow the syringe change procedure (sub-procedure F). This approach is a good way of detecting problems early before an entire run is wasted.
(12) Once the run is completed the screen will say run complete. You can then transfer the run results to a memory stick for archiving and post-processing (see the data transfer procedure below).
Notes:
You do not need to use the standard scripts part of the software.
C. DATA TRANSFER
(1) Choose file transfer with the mouse arrow.
(2) When prompted, insert a memory stick into the USB port on the back left corner of the instrument and then click ok.
(3) At the “please wait until prompted to remove the memory device” message, left click the mouse to say ok.
(4) See the directory of file listings and click on date modified (at the top right hand) to make sure the files are sorted. There will be four files for each run (*.txt, *.txt.igr, *.text.spectrum.bz2, and _LIMS.csv).
(5) Highlight the desired file (e.g. *.txt) with the mouse arrow by clicking on the filename, then click on the right pointing arrow on the screen and the file will be transferred to the memory stick. Repeat this for the next file (*.txt.lgr). You do not need to transfer the *.text. spectrum.bz2 unless you need to send it to Los Gatos for troubleshooting. If you are using the Laboratory Information Management System for light stable isotopes (LIMS, see http://isotopes.usgs.gov/Research%20Highlights%20Pages/LIMS.htm) you will need to transfer the _LIMS.csv file.
(6) Click on exit, then when you get the safe to remove message click the green check mark then click ok. You can then pull out the memory stick.
(7) Proceed to a computer and backup the files in your laboratory data base or archive system so that you have at least two copies of the data files. Always have two copies on separate computers or storage devices so that you do not loose data.

15
D. DATA POST-PROCESSING
Currently the instrument does not output results as δ values on the V-SMOW scale (it provides absolute abundance data). This conversion must be done as a post-processing step on a personal computer using MS Excel. Note that in order for the IAEA laser spreadsheet template to function properly, you should verify that the Windows control panel regional and language properties are set to English (US) mode and that the Excel calculation mode is set to automatic (go to tools/options/calculations).
(1) Copy the results files from your memory stick to the appropriate directory (folder) on the computer.
(2) Open Excel, and then from Excel, open the *.txt data file (note you may need to select show all to see the file to load it), then select delimited and click next.
(3) Click comma delimited, then click finish.
(4) Choose save as and save the file as an Excel (.xls) file to the appropriate directory. This is basically the raw data file, but in Excel format.
(5) Open the Laser Isotope Excel template and choose Save As and provide a new file name to store the results. Do not use the same filename as the template because you do not want to over-write it (note that you can also create your own template or program for processing).
(6) Go back to the first Excel data file you created from the laser .txt file and highlight all the data starting in Row 2 (not the column headings) through the last row of data (e.g. Row 313 for a full tray of 52 vials), then select copy. Don’t copy the diagnostic information below the data (i.e. the information that that starts in Column A with //ADVANCED SETTINGS). Then go to the second excel file you created (from the laser isotope template) and use paste special values to paste it into Row 2 (Column A) of the raw worksheet. The raw worksheet should look like Figure 5 below except with your data in it. Then save the file. Other worksheets (tabs) in the file will be automatically updated with your new data and you will look at these next.
(7) Go to the worksheet named checkplots (Figure 6). Here you will do the first evaluation of the overall quality of the run. Be aware that you may need to rescale the Y-axes. The plots should be scaled to show fine scale variations in temperature and amount of water injected into the cavity in order to see potential problems.

16
FIG. 5. Raw worksheet example from the laser isotope Excel template.
Examine these three plots. There shouldn’t be any large changes in temperature (this is the internal gas temperature in the cavity), and the curve should look pretty smooth. The internal gas temperature variation should be less than 0.3°C per hour (upper plot). The standard deviation of individual injections should be less than 0.01°C, and typically around 0.002°C or less (middle plot). If the temperature variations are too large, then better control of the laboratory temperature may need to be implemented. It is recommended that the ambient laboratory room temperature should not vary by more than 3°C per hour.
The amount of water injected plot (bottom plot) shows molecules of water/cm3 (N/cm3). It is an important one and should typically be about 2 to 4 × 10¹⁶ and should not vary by more than 3% (rms fluctuation) over the run. Note that the dummy injections may be outliers, and this is ok. You can often identify a bad injection with this plot by a spike or large dip. It may be helpful to list the injection numbers of any bad injections which can speed up the data clean up process that you will do later. A consistent amount of water is critical and if it is not in the acceptable range, higher uncertainties will result. If many of the values are not acceptable, you may need to replace the septum, remove and retighten the syringe nut, and reinsert the syringe. You will likely examine the checkplots again when you are checking specific sample or standard results (this is discussed later).

17
FIG. 6. Examples of the three checkplots.
(8) Next go to the standards checks worksheet. Enter the previously determined values for the in-house standards (permil relative to V-SMOW) in the Standards, Known Value cells (Rows 36–38, Columns B and C). Then go to the calculations worksheet. The known values for the standards that you entered into the standards checks worksheet should have been copied to Columns J and K in the calculations worksheet automatically (see Figure 7). If they were not, just copy and paste the appropriate known values downward in Columns J and K so that all rows of data for the in-house standards (red section of the worksheet labeled calibration data) are associated with a known value. Note that only data from the two calibration standards will appear in the red section (not the control standard). It is very important to have accurately determined the isotope values for the in-house standards.

18
FIG. 7. Example of the calculations worksheet in the laser isotope Excel template. Individual
injection permil results are not shown in this figure, but can be found to the right of Column M in the worksheet.
(9) For the linear regression calibration equations (Column M), intercepts, slopes and R2 values will be calculated automatically for both 18O and 2H. Calibrations are calculated for each set of five unknown samples using the standards immediately before and after the set of five unknowns. You will need to clear the contents of any rows in Columns F–K if no real data are shown to get the regressions to calculate properly (this occurs if you only ran part of a tray). If you have deviated from the standard sample/vial layout (i.e. Figure 2), you may need to make sure that the cell references in the intercept, slope and R2 equations match the range of standard values you have in the worksheet. To do this, click on the δ2H intercept value in Column M, Row 6. Edit the equation cell references so that the references for Columns H and I match the rows where you have in-house standard data. Do this for all of the intercept, slope, and R2 equations in Column M.
(10) Look at the R2 values, they should be higher than 0.99. Otherwise the wrong data were used in the regression (i.e. your cell references in the equations are wrong) or there was a problem with the run. If the values are lower than 0.99 then go back and check the intercept, slope and R2equations and make sure they reference the proper cells for the in-house standards.
(11) The values in Column M are the slope (x variable) and intercept that describe an equation of a line (y=(slope)x+(intercept)) that is used for the calibration equations.

19
(12) Delta values (permil, V-SMOW) for each injection, and reportable values (permil, V-SMOW) and standard deviations for each sample are calculated automatically in Columns Q, R, S and V, W, X. The reportable value is based on the average of the last four injections of a particular sample (the first two are prone to be bad so they are not used). The results worksheet (Figure 8) has a simple formatted version of the sample reportable values and their standard deviations, and is set up for easy printing. Columns T and Y in the calculations worksheet contains the range (maximum–minimum) for the last four injections of each sample. This value is useful for fixing problems and evaluating the quality of a particular sample value or the run as a whole (use of the range values is discussed later in this sub-procedure).
FIG. 8. Example of the results worksheet.
(13) It is important to evaluate the quality of the run and the individual sample values, and this can be done starting with the standards checks worksheet (Figure 9). Here you can assess the accuracy of analyses/calibration by examining the big delta values for the two calibration standards and the control standard. The red columns (E and H) contain the big delta values, which should automatically calculate for you. They represent the difference between the measured sample value and its real (known) value. Big delta values should be less than 2 permil for δ2H and 0.3 permil for δ18O. Note that the big delta values are only a guide about the accuracy of the analyses and are not equivalent to the analytical precision. The mean and standard deviation of each standard are summarized in Columns C and F (e.g. in Rows 9 and 10 for the first standard). If the standard deviation is too high, the spreadsheet will flag the analysis with check in
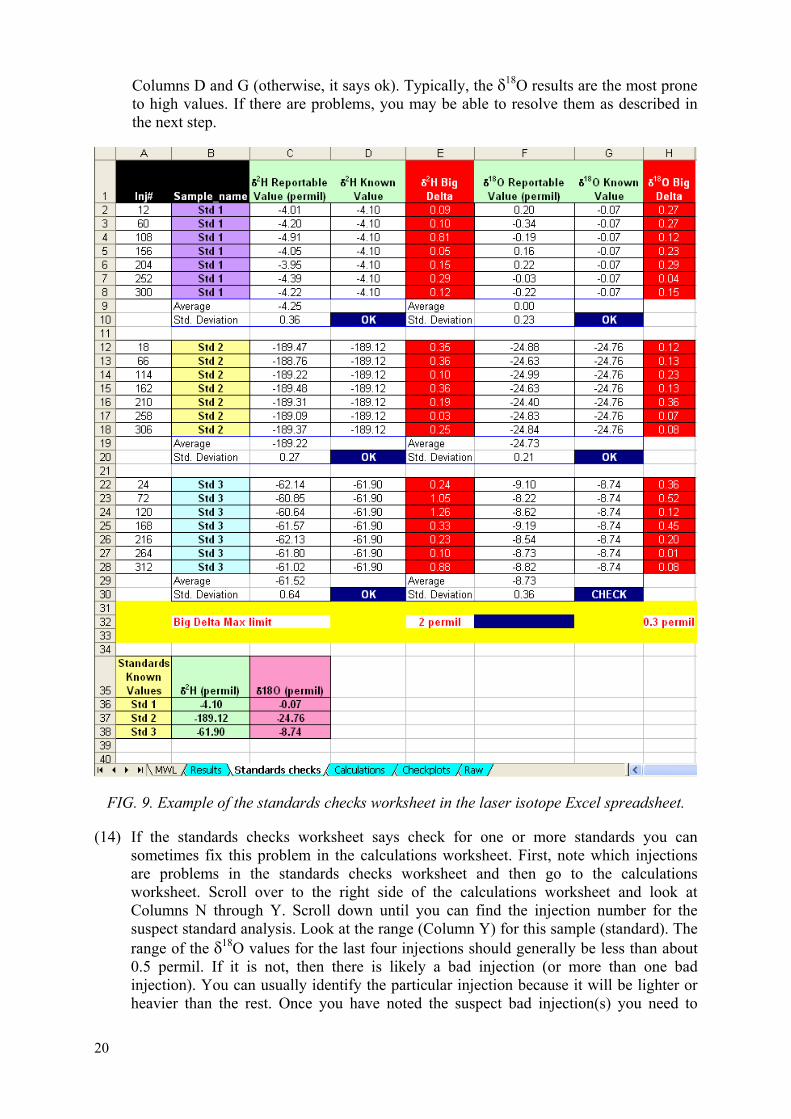
20
Columns D and G (otherwise, it says ok). Typically, the δ18O results are the most prone to high values. If there are problems, you may be able to resolve them as described in the next step.
FIG. 9. Example of the standards checks worksheet in the laser isotope Excel spreadsheet.
(14) If the standards checks worksheet says check for one or more standards you can sometimes fix this problem in the calculations worksheet. First, note which injections are problems in the standards checks worksheet and then go to the calculations worksheet. Scroll over to the right side of the calculations worksheet and look at Columns N through Y. Scroll down until you can find the injection number for the suspect standard analysis. Look at the range (Column Y) for this sample (standard). The range of the δ18O values for the last four injections should generally be less than about 0.5 permil. If it is not, then there is likely a bad injection (or more than one bad injection). You can usually identify the particular injection because it will be lighter or heavier than the rest. Once you have noted the suspect bad injection(s) you need to
21
verify there was a problem by examining the checkplots worksheet. Check the injection by clicking on the data point for the particular injection in amount of water plot (third plot). Excel will pop up the information on each data point and tell you which injection you have clicked on. If the injection is on a spike (higher water amount) or a large dip, then you have a bad injection. Alternatively, you can consult your previously prepared list of potential bad injections so you don’t have to go back and forth to the checkplot so much. If the amount of water is ok, then check the temperature data (upper and middle plots). Occasionally, there will be a temperature shift that may cause a poor number. However, over 90% of the time the problem will be an inconsistent amount of water.
If you find a bad point, go back to calculations and cut out the bad injection (individual injection values in Columns Q and V) and paste it to the side. The reportable value, standard deviation, and range will automatically recalculate. For analysis of a standard, it should now be closer to the known value. If there is a problem with an injection of one of the two calibration standards, then you must also go to the calibration data (Columns H and/or I) and clear the bad injection data from the appropriate cell. This will improve your calibration and all the reportable values in the spreadsheet will update including those in the results worksheet. Repeat this procedure for any suspect standards in the standards checks worksheet for both δ18O and δ2H (you will find many more problems with the δ18O results, so start with it). You will occasionally find a bad injection that produces an unacceptable value for δ18O, but not δ2H. In this case, you can just remove the bad δ18O information and leave the δ2H alone. Remember that for the calibration standards, if you cut out an injection value you must also delete it from the calibration data!
(15) Once the standards and calibrations are cleaned up you should go to the calculations worksheet (Columns N through Y) and review the δ18O and δ2H data for the individual samples (unknowns). Pay close attention to the δ18O range values in Column Y. If as above, the values are over about 0.5, then you may have at least one bad injection. Repeat the clean up procedure that you did for the standards by verifying bad injections and then deleting the bad ones. If you have more than one bad injection out of four, then you should flag the sample (e.g. make a note next to the sample in the results worksheet) and rerun it.
E. CHANGING THE AUTOSAMPLER SEPTUM
The autosampler septum should be changed after every 325 injections. Note that running a full tray of 53 vials results in 318 injections, so you should change the septum before the next run. When in doubt, change the septum. It only takes a few minutes and a leaky septum will ruin the run. Warning: Failure to properly follow this procedure could severely damage the instrument by letting air into the system.
(1) Before removing the old septum from the autosampler, you must first prepare the instrument for a septum change. To prepare the instrument, choose set-up with the mouse and click on change septum. The screen will say initiate septum change. Click on the green check with the arrow, and then click OK using the mouse. The screen will first say venting cavity. Wait until the system says ready for new septum before proceeding.
(2) Once the instrument has indicated it is ready, unscrew the knurled nut from the autosampler. It may be hot from the heater, so use a tissue or glove. Also, be careful you

22
do not loose the dark colored ferrule that sits below the septum because it sometimes comes off with the nut.
(3) Use the supplied small metal hook or a tweezer (pincette) to pull out the septum. The hook works best if you slide it around the side of the septum instead of trying to grab it from the hole in the center of the septum. Gently clean the cavity of the housing with a lint free tissue.
(4) Slide the septum nut and new septum onto a blunt 22-gauge needle (e.g. Hamilton AS tip style or similar). The Teflon-coated side of the septum should be facing away from the bottom of the septum nut (see Figure 10).
FIG. 10. Arrangement for septum predrilling.
(5) Place the entire assembly over the injection tube and screw it down tightly (see Figure 11). Then move the needle in and out of the septum about six times to make sure the septum is predrilled. Take care not to push the needle in too deep because it could damage the plastic sample transfer line. Remove the needle from the septum.

23
FIG. 11. Septum, septum housing, and needle in place for predrilling. The needle should be moved in and out six times and then removed. The needle only needs to pierce the septum,
make sure you do not puncture the transfer line at the bottom of the septum housing.
(6) Click the septum changed check mark on the instrument screen, and the instrument will begin evacuating the instrument cavity. After evacuation is finished, you should see septum change complete on the screen. Click on OK and then click the green check to complete the procedure. Click on the green check again to return to the normal screen.
(7) Allow the system to warm up for at least 5 minutes. This will soften the septum and prevent bent needles.
(8) Always watch the first injection after replacing the septum to assure that needle does not bend. If it bends, select abort (black square) on the instrument and wait for the instrument to complete the abort cycle (it may take a few minutes) and for the autosampler arm to return to its normal spot. You should see run aborted on the lower right side of the instrument screen.
(9) Proceed to the next sub-procedure (F) to change the syringe and recover from the aborted run.
F. CHANGING THE AUTOSAMPLER SYRINGE AND RECOVERING FROM AN ABORTED RUN BECAUSE OF A BENT NEEDLE
Warning: Syringes are expensive, do this step carefully to prevent damage to the needle or syringe.
(1) On the autosampler control select F1-change syringe, hit the enter button (press the button in the center of the round knob). You should see replace syringe on the screen.
(2) Slide door over the syringe upward and loosen the red nut immediately above the syringe plunger.

24
(3) Grasp the near the top of the blue metal plate that holds the syringe and carefully pull the entire plate out. The blue plate is held in place by a magnet.
(4) Flip the black plastic lock to the left and remove the old syringe from the blue plate.
(5) Insert a new syringe into the blue plate by inserting the flange (finger grip) of the syringe into the upper slot. Make sure that one of the flat sides of the syringe flange faces the back of the blue plate and close the black lock over the new syringe.
(6) Carefully put the blue plate back into the injection head and do not bend the needle on the lower black needle guide rings! It helps greatly if you lift the black needle guide carriage (the part that has the round rings) upward with your left hand (the carriage will move up to the injection head housing). With your right hand you can take the blue plate near the top and gently tilt it to insert the needle through the rings at an angle. Then, keep moving the blue plate into the housing until the two small pins on the bottom-back of the plate line up with the lower holes in the injection head housing and the blue plate clicks into place. It helps if you look over the top of the blue plate and move it so that the bottom two pins line up with the bottom two holes on the injection head. The magnets will then pull the top of the plate into position. When it is right, it often makes a click noise when the magnets pull the blue plate in place.
(7) Double check that the needle is properly centered in the lower black ring. If not, the syringe or blue plate is not installed properly.
(8) Retighten the red nut immediately above the plunger by rotating it to the left. It only needs to be finger tight.
(9) Press the enter button on the control panel (continue) to complete installation.
(10) Verify that the needle is centered on the septum hole by running the septum referencing check as follows (note that it is ok to have a needle in place for this, just do not run the tray referencing procedure!):
(1) On the control panel, press F1 to get into menu.
(2) Rotate the big silver knob until set-up is highlighted, then press enter (center button in the silver knob).
(3) Rotate the knob to highlight objects, then hit the enter button.
(4) Rotate the knob to highlight injectors then hit the enter button.
(5) LC V1v1 will appear, then press enter to select it.
(6) Press F1 to start check pos, the arm will start moving and then stop over the septum.
(7) Lift the needle guide up gently without moving the syringe/needle and check that the needle is centered over the septum hole (you may want to use a flashlight and a magnifier to assure it is well centered). If it is not, adjust x and y as necessary using the keypad. To make adjustments use the knob to highlight x or y and hit enter. You can then use the knob to change the values and the arm will move. You should only have to make very small adjustments or none at all because this position is set

25
at the factory. When it is correct hit enter and proceed to the next dimension if necessary. You shouldn’t need to adjust the needle depth (z).
(8) select F4 to go home when/if the position is correct.
Warning: do not turn off the power switch to the autosampler when a syringe is installed. The syringe will drop rapidly and this will likely bend the needle and will ruin the syringe. If you need to power off, follow the procedure as described in this subsection and remove the syringe. Then you can support the needle guide with one hand and turn off the power with the other. Gently lower the needle guide downward (do not let it drop rapidly!).
(11) To recover from the aborted run you need to start over on the instrument. Click Configure (keyboard symbol) then delete everything from the run list (except for the one file you can’t delete).
(12) Reload all the files back into the run list, delete the old file, and start the instrument run procedure.
G. EQUIPMENT AND CONSUMABLES LIST
This list includes consumables and items not typically supplied with the instrument or the autosampler.
Autosampler vials, screw thread, 1.5 mL, glass, 32 × 11.6 mm, disposable, VWR catalogue # 548-0018, 1 000/pack. From Los Gatos Research use cat.# 908-0008-9005, 100/pack. You should have at least 1 000 vials to start with. Note that the VWR and Los Gatos vials are not interchangeable.
Caps and Teflon coated septa for autosampler vials, disposable. VWR catalogue # 548-0022, 1 000/pack. From Los Gatos Research use cat.# 908-0008-9006, 100/pack. You should have at least 1 500 caps and septa to start with. Note that the VWR and Los Gatos caps are not interchangeable.
Autosampler Septa, Los Gatos Catalogue number 908-0008-9004 (pkg of 50 is US $45), you should have at least 500 of these since you will replace them almost daily.
Septum Inlet Filter, 10 μm, Los Gatos Catalogue number 908-0008-9007 (US $25 ea.), you only need two or three of these because you can clean them (see procedure below). They are metal and last for years. You may need a few more if you run lots of brines.
Drierite, have one extra column or a jar of Drierite for refilling. Prefilled column cat# KH-07193 (Cole Parmer).
Microsyringe for autosampler. Hamilton 1.2 microliter syringe, PN203185/01 (Model 7701.2N). These can be purchased through VWR and most other chemical suppliers. Syringes last typically 2–3 weeks of daily running. You should initially have at least 30 of these (about US $120) and reorder when down to four.
Needles for predrilling autosampler septa, blunt 22 ga (e.g. Hamilton AS tip style or similar), three needles. You can recycle old needles from bad syringes for this.

26
Pipettor — An automatic pipettor (e.g. an Eppendorf type) with 1000 μL capacity for transferring samples and standards to the autosampler vials. Example, Cole Parmer Adjustible Volume Pippettor, Cat. #KH-21600-18.
Pipettor tips, disposable, 1000 μL to fit the above pipettor. Example, Cole Parmer Cat #KH-25711-50 (200-1 300 μL), packs of 1 000. Suggest at least 5 packs.
Multi-port electrical extension cable, 2 to 4 metres long, with surge suppression (e.g. a circuit breaker or fuse to protect the autosampler and laser instrument from high voltage spikes such as from lightning).
Two adjustable wrenches (preferable) or a set of open ended SAE wrenches. Note that metric 9, 13, 15, and 18 mm wrenches will also work.
Compressed, clean, dry air for cleaning sample transfer line and filter, e.g. Envi-Ro-Tech Duster Techspray, VWR catalogue #58542-430 (3 cans), (note: clean dry air from your laboratory in-house system can also be used).
A small pair of wire cutters for cutting cable ties
A set of elastic bands for the LC PAL autosampler injection head, CTC PAL part numbers MZ 30-21 (tension Cord 280 mm) and MZ 30-23 (tension Cord 90–95 mm). Nearest supplier can be found at http://www.ctc.ch/f_contacts.htm or order directly through CTC PAL in Switzerland. Note it is possible to make your own if you can find a similar type of elastic band (bungie cord) locally. Bands usually last at least a few years.
A set of IAEA Stable Isotope (δ2H and δ18O) V-SMOW2 and SLAP2 Standards.
You will also need to acquire, or prepare and characterize, a few litres (at least) of three or more different in-house standards (see the IAEA Water Resources Programme guidance on standard preparation and storage).
H. INITIAL SET UP OF THE PAL AUTOSAMPLER AND THE LASER ISOTOPE INSTRUMENT
What you will need (in addition to what is supplied in the boxes from instrument):
• two adjustable wrenches (keys), or one each, 9, 13, 15, and 18 mm open end wrenches; • a stable table or bench top (180 cm × 80 cm works well) to set up the instrument and
autosampler; • a few hours time.
Note that the instrument should be installed in a room that has good temperature stability and away from areas where harsh chemicals such as acids or bases are used. It should not be placed next to a window or in direct sunlight because temperature stability is important for getting good precision from the instrument. The instrument should also not be installed in areas where strong vibrations from for example, trains or automobile traffic occur.
PAL autosampler set-up
The major components of the autosampler are labeled in Figure 12 below. You should be familiar with the names before assembling the autosampler.

27
FIG. 12. Key components of the PAL autosampler.
(1) Carefully remove the autosampler parts from the box and place it in position on the table and remove the packing material from the parts.
(2) Taking the main body of the autosampler move it to the edge of the table so that the front part of the arm overhangs from the edge. You can also gently push the autosampler arm toward the edge so that the feet stay on the table. This is necessary because the needle guide/syringe carriage will need to be lowered below the top of the table for installation.
(3) Remove the three mounting screws on the front of the arm using the supplied screw driver.
(4) Take the injection head and hold it vertically and let the needle guide carriage (the part with the small black rings) gently drop out of the bottom of the injection head. It will not fall all the way out, but you need to let it lower to its full extent. Hook the ribbon cable up between the arm and the top rear of the injection head.
(5) Place the injection head over the two mounting pins on the front of the arm, and then replace the three mounting screws so that the injection head is attached to the arm. It is easier if you put the screw on the supplied screwdriver and then insert the screw into the hole. This is tricky because you have to stick the screws through the door in the injection head. You can carefully pull the ribbon cable aside for better access.

28
(6) Once the injection head is screwed on, check that the ribbon cable is not bound or pinched by checking it through the injection head door and by reaching beneath the rear bottom of the arm and seeing that there is some slack there. You can now move the sampler back fully onto the table by lifting the needle guide up and letting it rest gently on the table top or leg of the autosampler.
(7) Take the safety guard and install it around the front of the autosampler along with the keypad controller. The notches in the guard should face up. Use the small supplied thumb screw for the side without the keypad controller bar. Use the long thumbscrew to install the side of the guard with the controller bar. The controller bar should be screwed on at the same time as the guard. Warning, the safety guard is fragile, do not lean your arms on the safety guard when working on the autosampler.
(8) Place the keypad on the bar by sliding the tab on the rectangular metal support into the back of the keypad. The top of the keypad will be held in place by a magnet.
(9) Take the white coiled cord and plug it into SER3 and the back of the keypad.
(10) Take the black cable with the round ends and plug one end into the back of the PAL transformer box (this is a separate rectangular box) marked PAL and the other end into the connection marked Power on the back of the autosampler.
(11) Plug the power cord to the back of the PAL transformer box and plug the other end into the electrical extension cord (surge suppressor). Do not turn the autosampler on yet.
You will finish making the rest of the autosampler connections later, now it is time to set up the laser isotope instrument.
Isotope instrument set-up
(1) Open the laser box, and with one or two helpers, carefully remove the instrument and place it on the table next to the autosampler. Remove any packing material from the instrument and other parts. Warning: check that the red voltage indicator on the back of the laser machine (near the on-off switch) is set to the power system that you will be using (e.g. 110 or 220 volts). If it is not, change it to the proper setting.
(2) Take the beige computer cable from SER1 on the autosampler, and plug it into the place labeled to LC PAL on the back of the instrument.
(3) Take the green and black braided wire from the septum heater and connect it to the septum heater connection on the back of the instrument. Be careful when cutting the wires loose from the cable ties. Use a pair of wire cutters, not a knife, so that you don’t damage the wires.
(4) Take the small clear tubing (with the Swagelock fitting on the end) from the bottom of the septum area on the autosampler and connect the swagelock to the to septum connection on the instrument using a wrench. Do not overtighten the nut. Be careful when cutting the tubing loose from the cable ties. Use a pair of wire cutters, not a knife, so that you don’t damage the tubing.

29
The autosampler should now be fully connected to the instrument. However, do not turn on the power. The autosampler still needs to be configured and this step is covered later. Next, you will finish the pump and drierite column connections to the instrument.
(5) Take the vacuum pump and connect it to the To Ext. Pump connection of the instrument using the short stiff white tubing. Tighten the nuts with a wrench. Hook the power cable to the pump and to the back of the instrument to the connection marked Ext. Pump Power.
(6) Now you will hook up the Drierite column. Warning-be careful not to loosen the large nut (which is inside the column), if it falls off, you will have a big problem. First, unscrew the blue plastic plug from the lower nipple on the column using a wrench (remember, make sure the big nut inside doesn’t fall off). The lower nipple will be left open. You only need to close it if you are not going to be using the instrument for a long time. If you do put the plug back in, make sure that a sign or visible note is posted on the instrument so that users are aware that the plug must be removed before the instrument is run.
(7) Unscrew the top cap from the upper port on the Drierite column using a wrench (remember, make sure the nut inside doesn’t fall off or loosen).
(8) Screw on the small white hose onto the upper port of the column using two wrenches. Connect the other end of the hose to the dry gas inlet connection on the back of the instrument using the 15 mm wrench.
(9) Hook the instrument power cable to the back of the instrument and plug it into the electrical extension cable/surge suppressor (main power). However, leave the power switch on the back of the laser instrument off at this point.
(10) Double check that all the instrument, autosampler, pump, and Drierite connections have been made and are in the right spots. The system should now be fully connected (except for syringe installation) and the power cord for the instrument can be plugged in.
(11) Unscrew the housing of the autosampler septum and verify that a septum is in place. It is a small red rubber septum with light colored Teflon on one side. If it is still in the housing, you should see the light colored (white) Teflon side when you look into the housing. If it is still on the tube the light side will face downward and you will see the red side facing up. There is also a dark colored, cone shaped ferrule that sometimes comes out with the housing. If this is the case, put the ferrule back into the injection tube and you should be able to see the light colored side of the septum in the housing. If there is no septum, please put one in. There is almost always a septum already in place. Once you have verified that there is a septum, screw the housing back on snugly and proceed to the next step.
(12) Prior to running the instrument and installing the syringe, you must configure and test the autosampler. Be aware that the directions that come with the instrument have some errors for this step. Please follow the instructions below.
(12a) Configuring and testing the autosampler.
Do these steps without a syringe installed.

30
Turn on the autosampler power using the switch on the front of the transformer box. It will take a minute to for the sampler to warm up (you should see the intro screen on the keypad controller when it is ready). If the injection head moves all the way to the back rail and makes an unpleasant grinding noise turn the power off and follow the troubleshooting procedure in section I (#5). If everything is ok then check the septum reference position using the keypad by:
(1) Press F1 to get into the menu.
(2) Rotate the big silver knob until set-up is highlighted, then press enter (center button in the silver knob).
(3) Rotate the knob to highlight objects, then hit the enter button.
(4) Rotate the knob to highlight injectors then hit the enter button.
(5) LC V1v1 will appear, and then press enter to select it.
(6) Press F1 to start check pos, the arm will start moving and then stop over the septum.
(7) The needle guide rings should be centered (x, y) on the septum port and about 0.1 mm above the port (z). Adjust x, y, z as necessary using the keypad. To make adjustments use the knob to highlight x, y, or z and hit enter. You can then use the knob to change the values and the arm will move. You should only have to make very small adjustments or none at all because this position is set at the factory.
(8) Select F4 to go home if the position is correct.
(12b) Check the tray holder reference position using the keypad by:
Note: no syringe should be installed, and all the sample vial trays should be removed from the autosampler before starting.
(1) Select F1 to enter the menu.
(2) Rotate the knob to highlight set-up and press enter.
(3) Rotate the knob to highlight objects and press enter.
(4) Rotate the knob to highlight tray holders and press enter.
(5) THldr1 will appear, then press enter to select it.
(6) Press F1 to run check position. The needle guide ring should be centered over the hole in the tray holder. In addition, the lower needle guide ring should extend down into the hole.
(7) Adjust (x, y, z) using the keypad as necessary. Usually no or very little adjustment is necessary. See step 7 above which describes how to make adjustments.
(8) Select F4 to go home when the position is correct.

31
(13) Now the only thing left is to install a syringe in the autosampler. See sub-procedure F (changing the autosampler syringe) for directions on how to install a syringe. Once the syringe is installed, you can turn the laser and pump power switches on and begin making analyses.
I. MAINTENANCE, TROUBLESHOOTING, AND NOTES ON RUNNING DIRTY AND HIGH SALINITY SAMPLES
(1) Regular maintenance
(1) Adjust the Laser Offset, if necessary (as described in the Adjusting Laser Offset section in the LGR manual).
(2) Remove the syringe from the autoinjector and manually rinse with de-ionized water to remove any salt build-up or septum residue that has collected in the syringe. Confirm that the syringe has some resistance when manually actuated. If there is little to no resistance, tighten the syringe nut slightly. When inserting the syringe holder into the Autoinjector, extra caution is required to assure that the syringe needle does not bend (see section F for syringe change information).
(3) Clean the sample transfer line and filter assembly as described in subsection 2 below (weekly, unless high salinity samples are being run).
(2) Cleaning the transfer line and filter. After 1–2 weeks of continuous use (e.g. 2 000-4 000 injections), the sample line and the attached 10 μm filter should be cleaned to remove small pieces of septum and sample impurities that have been carried into the line.
(1) First run the laser shutdown procedure by depressing the Exit button. Once the instrument has completed the shutdown routine, turn off the power.
(2) Remove the line and filter assembly by unscrewing the Swagelock nut that is immediately adjacent to the instrument. DO NOT unscrew the nut that connects the line to the filter. Then, immediately screw on the Swagelock cap that was supplied with the instrument to prevent dust from entering through the back of the instrument. You can also unscrew the sample line from the autosampler (at the bottom of the septum holder) if this makes it easier for cleaning (however, removal of the line from the autosampler is not typically necessary).
(3) Unscrew the septum nut, remove and dispose of the old septum. Also remove the small black ferrule that sits underneath the septum in the threaded tube. You can give a short puff of air through the filter and line (see Figure 13) if the ferrule does not come out with the septum. A can of air or your in-house air system can be used to remove the ferrule and for the next steps as long as the air source is clean and dry.
(4) Next, repeatedly pulse air through the filter assembly and transfer line (as shown in Figure 13) to remove all visible septa pieces (they will exit out of the septum tube). This action will also back-flush the filter.
(5) Blow any pieces that have collected in the well of the septum tube out (the area where the black ferrule normally sits), then replace the black ferrule in the septum

32
tube and install a new septum (remember the white side of the septum is down when the septum nut is screwed onto the tube).
(6) Remove the cap from the port on the back of the instrument and immediately reconnect the filter assembly and line to the instrument. Tighten the nut firmly.
(7) Install a new septum according to the procedure, and then turn on the instrument and let it warm up for analyses.
FIG. 13. Photo of compressed air set-up for cleaning the filter and line. The line is open at the septum end (not shown). Remember to blow out any septum pieces from the septum tube
well area as well.
(3) Bent needle on syringe (see sub-procedure F for replacing a syringe).
(4) Laser locks up r freezes during a run. The laser quits at some point in the run list and abort if it does not work.
(1) Turn off the laser power switch, wait a few seconds, and then turn it back on. Once the laser has fully come back up, immediately shut it down by selecting Exit to assure that the cavity has been vented.
(2) Turn off the laser power switch.
(3) Perform any necessary actions including changing the septum, cleaning the transfer line, and/or cleaning the syringe.
(4) Turn on the instrument power.
(5) Reconfigure the run and start over.
(5) Autosampler arm moves to the back rail and makes grinding or strange noise. The control panel reads limit switch not found, motor y reference fault (or something similar). This can especially happen during installation of the autosampler injection head. Turn off the autosampler and reach around underneath the back of the arm and

33
make sure the ribbon cable is free and has some slack. Try turning on the autosampler again. If it still has the problem, turn the autosampler off, remove the injection head, unhook the ribbon cable and reinstall the injection head as described in sub-proceedure H. If the ribbon cable binds inside the arm it can cause the limit switch error, make sure it is free to move.
(6) Autosampler lifts sample vials out of the sample tray or the needle guide lacks tension. In other words, a sample vial is still stuck on the needle after injection or the needle guide no longer has the tension to operate properly. This may occur after many uses of the autosampler (e.g. often a year or more or use). The dark colored elastic bands inside the injection head need replacement or one may have come loose. There are two bands in the injection head. The long one is on the left side of the injection head and you can see part of it through the syringe window. The short band is in the rear of the injection head and is difficult to see without removing the head. For replacement, perform the syringe change procedure (sub-procedure F), but just remove the syringe. After the syringe is removed you need to get access to the bands. It may be easier to remove the injection head for this task (just reverse the injection head installation steps in sub-procedure H for the PAL autosampler set-up). Remember you will need to move the autosampler to the edge of the table and gently let the needle guide drop down fully over the edge to access the three screws.
To access the long band, remove the top plate from the injection head (there is one screw in the top-rear of the injection head). The top of the long band is attached to a hook that is built into the top plate. Unhook the old band and then lower the needle guide and you can unhook the lower part of the band. Take a new band (it should be about 29 cm long) and attach it to the top hook (it is held in place by a knot in the band). Slide the band into the injection head and place the top plate back on. Then using a long wire, hook the bottom of the band and pull it out of the bottom of the injection head and hook the knotted end into the clip/notch. Replace the retaining screw that holds the top plate. If you need to replace the rear (short) band you will need to remove the black plate on the rear of the injection head. There are screws on each side of this plate that need to be removed. Once the plate is off, install the new band by hooking the knotted ends into the appropriate spots. Replace the plate and reinstall the injection head. Note that it is possible to make your own bands if you can find a similar elastic band material as the original.
(7) Running dirty, muddy, or cloudy samples. You should not run samples with lots of particulates (mud, sediment, etc.) on the instrument without filtering (e.g. with a 0.45 μm filter). If particles clog the needle, the syringe will be ruined. You also want to avoid introducing particles into the transfer line. Typical clean looking groundwater and surface water samples do not need to be filtered. Activated charcoal can be used to remove organics (e.g. from soil distillation samples). The sample is then filtered and measured on the instrument. The basic recommendation is: when in doubt FILTER!
(8) Running high salinity samples. One concern with these kinds of samples is that because the entire injected volume is evaporated, all the salts in the water are introduced directly into the sample line. However, by following the suggestions below, high salinity samples can be run. They do require a bit more work and good maintenance is essential. Samples such as sea water should not be too much problem. However, brines can be more difficult and you may need to develop a procedure to get good results for your samples. There is enough salt in brines that the transfer line can become clogged after only a few samples. Do some testing before running brines. The following is based

34
on suggestions from Los Gatos and our experience here at the IAEA for running saline samples.
(1) Manually rinse the syringe daily with distilled water to remove any salt buildup in the syringe.
(2) Place at least one vial of DI water after every saline sample to help rinse the syringe. Don’t be afraid to run lots of DI water in between samples, especially brines.
(3) Remove salt deposits from the transfer line every 1–2 days. This can be readily done by using compressed air as described in the maintenance discussion above. Some users rinse the entire assembly (filter and transfer line) with DI water and then thoroughly dry it before reattaching it to the instrument. Alternatively, the transfer line can be replaced. We have found that with brines, rinsing is required. The black ferrule underneath the septum should also be cleaned with air and or rinsed because salts will precipitate there as well.
(4) Thoroughly clean/replace the transfer line every 20–30 days (or when excessive salt build up can no longer be blown out).
(5) Use a larger syringe. The instrument uses a 1.2 microliter syringe; however, a 5 microliter syringe can also be placed in the syringe holder. A few software settings can then be altered (e.g. smaller injected volume, 1 sec syringe hold, 69 sec post-withdrawal delay) to allow for the larger bore syringe to be used. This helps to prevent syringe breakage despite the build-up of salt deposits.
(6) Typically, sample impurities will precipitate out at the point of injection and remain in the transfer line (or filter assembly). Thus, the instrument is usually safe from contamination. However, to prevent precipitation problems beyond the filter assembly, the line should be cleaned on a regular basis especially when running saline samples.

35
REFERENCES
[1] AGGARWAL, P.K., GAT, J., FROEHLICH, K. (Eds.), Isotopes in the Water Cycle. Springer, Dordrecht, the Netherlands (2005).
[2] NIER, A.O., A mass spectrometer for isotope and gas analysis, Rev. Sci. Instrum. 18 (1947) 398–411.
[3] KERSTEL, E.R.T., MEIJER, H.A.J., Optical isotope ratio measurements in hydrology, p. 109-123, in Aggarwal, P.K., et al. (Eds.) Isotopes in the Water Cycle: Past, Present, and Future of a Developing Science. IAEA/Springer, Dordrecht, the Netherlands (2005).
[4] Los Gatos Research, DLT-100 Theory of Operation (2008), http://lgrinc.com/Index.asp?subid=pth&ProductCategoryID=16
[5] AGGARWAL, P.K., TANWEER, A., GROENING, GUPTA, M. OWANO, T., BAER, D., Laser spectroscopic analysis of stable isotopes in natural waters: A low-cost, robust technique for the use of environmental isotopes in hydrological and climate studies. Eos, Trans. AGU 82: Fall Meet. Suppl., Abstract H51D-0504.[6], (2006).
[6] LIS, G., WASSENAAR, L.I., HENDRY, M.J., High-precision laser spectroscopy D/H and 18O/16O measurements of microliter natural water samples. Anal. Chem. 80 (2008) 287–293.
[7] COPLEN, T.B., New reporting of stable hydrogen, carbon, and oxygen isotopic abundances. Geochimica at Cosmochimica Acta 60 (1996) 3359–3360.


CONTRIBUTORS TO DRAFTING AND REVIEW
Aggarwal, P.K. International Atomic Energy Agency
Aráguas-Aráguas, L. International Atomic Energy Agency
International Atomic Energy Agency
Kulkarni, K.M. International Atomic Energy Agency
Kurttas, T. International Atomic Energy Agency
Newman, B.D. International Atomic Energy Agency
Tanweer, A. International Atomic Energy Agency
Gröning, M.


In the following countries IAEA publications may be purchased from the sources listed below, or frommajor local booksellers. Payment may be made in local currency or with UNESCO coupons.
AustraliaDA Information Services, 648 Whitehorse Road, Mitcham Victoria 3132Telephone: +61 3 9210 7777 • Fax: +61 3 9210 7788Email: [email protected] • Web site: http://www.dadirect.com.au
BelgiumJean de Lannoy, avenue du Roi 202, B-1190 BrusselsTelephone: +32 2 538 43 08 • Fax: +32 2 538 08 41Email: [email protected] • Web site: http://www.jean-de-lannoy.be
CanadaBernan Associates, 4611-F Assembly Drive, Lanham, MD 20706-4391, USATelephone: 1-800-865-3457 • Fax: 1-800-865-3450Email: [email protected] • Web site: http://www.bernan.com
Renouf Publishing Company Ltd., 1-5369 Canotek Rd., Ottawa, Ontario, K1J 9J3Telephone: +613 745 2665 • Fax: +613 745 7660Email: [email protected] • Web site: http://www.renoufbooks.com
ChinaIAEA Publications in Chinese: China Nuclear Energy Industry Corporation, Translation Section, P.O. Box 2103, Beijing
Czech RepublicSuweco CZ, S.R.O. Klecakova 347, 180 21 Praha 9Telephone: +420 26603 5364 • Fax: +420 28482 1646Email: [email protected] • Web site: http://www.suweco.cz
FinlandAkateeminen Kirjakauppa, PL 128 (Keskuskatu 1), FIN-00101 HelsinkiTelephone: +358 9 121 41 • Fax: +358 9 121 4450Email: [email protected] • Web site: http://www.akateeminen.com
FranceForm-Edit, 5, rue Janssen, P.O. Box 25, F-75921 Paris Cedex 19Telephone: +33 1 42 01 49 49 • Fax: +33 1 42 01 90 90 • Email: [email protected]
Lavoisier SAS, 14 rue de Provigny, 94236 Cachan Cedex Telephone: + 33 1 47 40 67 00 • Fax +33 1 47 40 67 02 Email: [email protected] • Web site: http://www.lavoisier.fr
GermanyUNO-Verlag, Vertriebs- und Verlags GmbH, August-Bebel-Allee 6, D-53175 BonnTelephone: +49 02 28 949 02-0 • Fax: +49 02 28 949 02-22Email: [email protected] • Web site: http://www.uno-verlag.de
HungaryLibrotrade Ltd., Book Import, P.O. Box 126, H-1656 BudapestTelephone: +36 1 257 7777 • Fax: +36 1 257 7472 • Email: [email protected]
IndiaAllied Publishers Group, 1st Floor, Dubash House, 15, J. N. Heredia Marg, Ballard Estate, Mumbai 400 001,Telephone: +91 22 22617926/27 • Fax: +91 22 22617928Email: [email protected] • Web site: http://www.alliedpublishers.com
Bookwell, 24/4800, Ansari Road, Darya Ganj, New Delhi 110002Telephone: +91 11 23268786, +91 11 23257264 • Fax: +91 11 23281315Email: [email protected] • Web site: http://www.bookwellindia.com
ItalyLibreria Scientifica Dott. Lucio di Biasio “AEIOU”, Via Coronelli 6, I-20146 MilanTelephone: +39 02 48 95 45 52 or 48 95 45 62 • Fax: +39 02 48 95 45 48
JapanMaruzen Company, Ltd., 13-6 Nihonbashi, 3 chome, Chuo-ku, Tokyo 103-0027Telephone: +81 3 3275 8582 • Fax: +81 3 3275 9072Email: [email protected] • Web site: http://www.maruzen.co.jp
Where to order IAEA publications
No. 21, July 2006

Korea, Republic ofKINS Inc., Information Business Dept. Samho Bldg. 2nd Floor, 275-1 Yang Jae-dong SeoCho-G, Seoul 137-130Telephone: +02 589 1740 • Fax: +02 589 1746Email: [email protected] • Web site: http://www.kins.co.kr
NetherlandsMartinus Nijhoff International, Koraalrood 50, P.O. Box 1853, 2700 CZ ZoetermeerTelephone: +31 793 684 400 • Fax: +31 793 615 698 • Email: [email protected] • Web site: http://www.nijhoff.nl
Swets and Zeitlinger b.v., P.O. Box 830, 2160 SZ LisseTelephone: +31 252 435 111 • Fax: +31 252 415 888 • Email: [email protected] • Web site: http://www.swets.nl
New ZealandDA Information Services, 648 Whitehorse Road, MITCHAM 3132, AustraliaTelephone: +61 3 9210 7777 • Fax: +61 3 9210 7788Email: [email protected] • Web site: http://www.dadirect.com.au
SloveniaCankarjeva Zalozba d.d., Kopitarjeva 2, SI-1512 LjubljanaTelephone: +386 1 432 31 44 • Fax: +386 1 230 14 35Email: [email protected] • Web site: http://www.cankarjeva-z.si/uvoz
SpainDíaz de Santos, S.A., c/ Juan Bravo, 3A, E-28006 MadridTelephone: +34 91 781 94 80 • Fax: +34 91 575 55 63 • Email: [email protected]@diazdesantos.es • [email protected] • [email protected] Web site: http://www.diazdesantos.es
United KingdomThe Stationery Office Ltd, International Sales Agency, PO Box 29, Norwich, NR3 1 GNTelephone (orders): +44 870 600 5552 • (enquiries): +44 207 873 8372 • Fax: +44 207 873 8203Email (orders): [email protected] • (enquiries): [email protected] • Web site: http://www.tso.co.uk
On-line orders:DELTA Int. Book Wholesalers Ltd., 39 Alexandra Road, Addlestone, Surrey, KT15 2PQEmail: [email protected] • Web site: http://www.profbooks.com
Books on the Environment:Earthprint Ltd., P.O. Box 119, Stevenage SG1 4TPTelephone: +44 1438748111 • Fax: +44 1438748844Email: [email protected] • Web site: http://www.earthprint.com
United Nations (UN)Dept. I004, Room DC2-0853, First Avenue at 46th Street, New York, N.Y. 10017, USATelephone: +800 253-9646 or +212 963-8302 • Fax: +212 963-3489Email: [email protected] • Web site: http://www.un.org
United States of AmericaBernan Associates, 4611-F Assembly Drive, Lanham, MD 20706-4391Telephone: 1-800-865-3457 • Fax: 1-800-865-3450Email: [email protected] • Web site: http://www.bernan.com
Renouf Publishing Company Ltd., 812 Proctor Ave., Ogdensburg, NY, 13669Telephone: +888 551 7470 (toll-free) • Fax: +888 568 8546 (toll-free)Email: [email protected] • Web site: http://www.renoufbooks.com
Orders and requests for information may also be addressed directly to:
Sales and Promotion Unit, International Atomic Energy AgencyVienna International Centre, PO Box 100, 1400 Vienna, AustriaTelephone: +43 1 2600 22529 (or 22530) • Fax: +43 1 2600 29302Email: [email protected] • Web site: http://www.iaea.org/books
09-2
6721