laser-induced autofluorescence for medical diagnosis
TRANSCRIPT

Journal of Fluorescence, Vol. 4, No. L 1994
Laser-Induced Autofluorescence for Medical Diagnosis
K. Koenig 1,2 and H. Schneckenburger 1,3
Received October 18, 1993
The naturally occurring autofluorescence of cells and tissues is based on biomolecules containing intrinsic fluorophores, such as porphyrins, the amino acids tryptophan and tyrosine, and the coen- zymes NADH, NADPH, and flavins. Coenzymes fluoresce in the blue/green spectral region (flu- orescence lifetimes: 0.5--6 ns) and are highly sensitive indicators of metabolic function. Steady- state and time-resolved blue-green autofluorescence is, therefore, an appropriate measure of the function of the respiratory chain as well as of cellular and tissue damage. Autofluorescence in the yellow/red spectral region is based mainly on endogenous porphyrins and metalloporphyrins, such as coproporphyrin, protoporphyrin (fluorescence lifetime of porphyrin monomers: > 10 ns), and Zn-protoporphyrin (2 ns). Various pathological microorganisms such as Propionibacterium aches, Pseudomonas aeruginosa, Actinomyces odontolyticus, Bacteroides intermedius, and Saccharo- myces cerevisiae are able to synthesize large amounts of these fluorophores and can therefore be located. This permits fluorescence-based detection of a variety of diseases, including early-stage dental caries, dental plaque, acne vulgaris, otitis extema, and squamous cell carcinoma. The sensitivity of noninvasive autofluorescence diagnostics can be enhanced by time-gated fluorescence measurements using an appropriate time delay between ultrashort laser excitation and detection. For example, videocameras with ultrafast shutters, in the nanosecond region, can be used to create "caries images" of the teeth. Alternatively, autofluorescence can be enhanced by stimulating protoporphyrin biosynthesis with the exogenously administered porphyrin precursor 5-aminole- vulinic acid (ALA). The fluorophore protoporphyrin IX (PP IX) is photolabile and photodynami- cally active. Irradiation of PP IX-containing tissue results in cytotoxic reactions which correlate with modifications in fluorescence due to photobleaching and singlet oxygen-dependent photo- product formation. Therefore, on-line autofluorescence measurements during the phototreatment can yield information on the efficiency of ALA-based photodynamic therapy.
KEY WORDS: Autofluorescence; medical diagnosis; fluorophores; NADH; flavins; porphyrins; ALA.
INTRODUCTION
Ultraviolet (UV) and visible light exposure to cells and tissues results in the excitation of naturally occurring chromophores. Deactivation occurs in part via fluores- cence emission. Intrinsic fluorophores with relatively high fluorescence quantum efficiencies are listed in Table I.
Institute of Lasertechnology in Medicine, Ulm, Germany. 2 Beckman Laser Institute and Medical Clinic, Irvine, California. 3 Fachhochschule Aalen, Department of Optoelectronics, Aalen, Ger-
many.
17
The amino acid trytophan is responsible for the UV fluorescence of most proteins [5]. The proteins collagen and elastin emit in the visible spectral region. Autoflu- orescence of the human skin is based partly on the ex- citation of these fluorophores. The reduced pyridine coenzymes nicotinamide adenine dinucleotide (NADH) and nicot inamide adenine dinucleot ide phosphate (NADPH) fluoresce in the blue, while flavins emit in the green. The pyridine coenzymes as well as the flavin coenzymes act as sensitive indicators of metabolic func- tion. The skin pigments melanin and bilirubin also ex-
1053-0509/94/0600-0017507.00/0 C, 1994 Plenum Publishing Corporation

18 Koenig and Schneckenburger
Table I. Absorption and Fluorescence Maxima of Endogenous Fluorophores
Chromophore Solvent Absorption ( n m ) Fluorescence (nm)
Tryptophan H20 220,280,288 320-350 [1] Thyrosin H20 220,275 305 [2] Collagen 300-340 420-.-460 Elastin 300-340 420--460 NADH H20 260,340 470 NADPH H20 260,340 470 Flavins H20 260,370,450 530 Zn-coproporphyrin D M S O 411,539,575 580 Zn-protoporphyrin D M S O 421,548,585 592 Uroporphyrin DMSO 404,501,533,568,622 624 Coproporphyrin DMSO 398,497,531,565,620 622 Protoporphyrin DMSO 406,505,540,575,630 633 Chlorophyll a Ether 425,670 685 [3] Chlorophyll b Ether 455,642 660 [3,4]
hibit a fluorescence in the green with a maxima at 540 nm [6] and 520-540 nm [7], respectively, however their fluorescence quantum yields are very low (bilirubin, <0.001 [7]). Keratin, which can be found in the nails, emits at 525 nm [8]. Zn-porphyrins and metal-free por- phyrins emit in the yellow/red spectral region. Some of them are precursors in heme biosynthesis. Chlorophyll can be found in plants and various bacteria and in intes- tine organs due to food uptake. In plants, chlorophyll fluorescence is a competitive process to the energy-trans- fer reaction in photosynthesis. Modifications to chloro- phyll fluorescence may occur if reaction centers are dosed or if the energy transfer from the antenna molecules is obstructed [9,10].
The detection of endogenous fluorophores by sen- sitive laser-induced autofluorescence yields information on the metabolic state, in particular in metabolism de- fects, and on the existence of various microorganisms. In addition, autofluorescence can be used to differentiate between various tissues.
This paper summarizes our efforts to develop med- ical applications of visible autofluorescence.
AUTOFLUORESCENCE DUE TO FLUORESCENT COENZYMES
The coenzymes NAD(H) and NADP(H), located mainly in the mitochondria of cells, act as hydrogen- transferring molecules in the respiratory chain (Fig. 1). The hydrogen uptake at position 4 of the pyridine ring results in significant spectral changes. These include the appearance of a new absorption band at 340 nm. Exci-
tation of this electronic transition results in a fluores- cence emission with a maximum at about 470 nm in aqueous solution. The reduced coenzymes possess a folded and an unfolded configuration [11,12]. The unfolded form, which is typical for bound coenzymes, shows a blue- shifted maximum.
The oxidized forms NAD and NADP fluoresce at about 445 nm. However, the fluorescence yield of the oxidized forms is 1000-fold less than the reduced forms (for excitation > 300 nm). Therefore, in practice, UVA- excited in vivo fluorescence can be attributed to NADH/ NADPH.
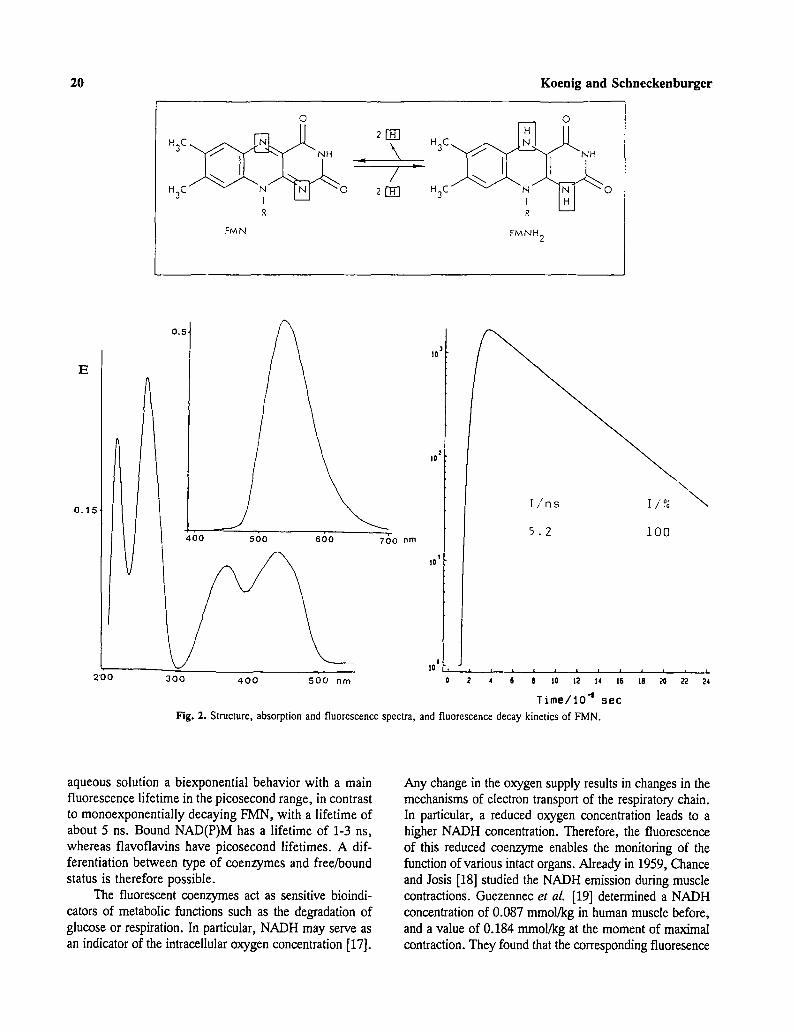
The spectra of oxidized flavomononucleotide (F1V[N), flavodinucleotide (FAD), and riboflavin are similar. They have main electronic transitions (So --> Sx,2,3) at 260, 370, and 450 nm [13] and a fluorescence peak at 530 nm (Fig. 2). The FAD fluorescence quantum yield is a factor of 10 less than that of FMN and riboflavin [13]. Flavins possess a high intersystem crossing (ISC) rate. Deactivation of the triplet state occurs in part via phosphorescence at 605 nm [14]. Bound flavins, e.g., covalently attached to proteins (flavoproteins), show a bathochromic shift of the absorp- tion bands to 280, 380, and 460 nm [13] and modifications to the emission spectrum.
Reduction of the isoalloxazine ring results in changes in the molecular configuration (planar into "butterfly" configuration), reduced absorption [13] and, conse- quently, decreased fluorescence. Most flavoproteins are only weak fluorophores.
The reduced pyridine coenzymes and the flavin/ flavoprotein molecules have an emission bandwidth of about 80 nm and, therefore, overlap each other. Figure 3 demonstrates the emission spectrum of a coenzyme

Autofluorescence for Medical Diagnosis 19
H O
I
R
N A D
O II C - - NH 2 /
N I R
N A D H
E 1.0
0 . 5 ,
/ 400 500 600 nm
to
tO t
�9 / \ tO ~
2 5 0 3 5 0 4 5 0 nm
l / n s r/,"~
0.5-0.6 90 1.4-2.0 10
i t ; i I i ~ ,
~ 6 e to t~ t4 :s
T i m e / 1 0 -~ s e c
Fig. 1. Molecular structure, absorption and fluorescence spectra, and fluorescence decay kinetics of the pyridine coenzyme nicotinamide adenine dinucleotide. NADH, the reduced form of NAD, is formed by the hydrogen uptake at position 4 of the pyridine ring. NADH is re, oxidized by transfer of electrons to a second acceptor. The 260-nm absorption band is due to adenine; the 340-nm band, due to the reduced pyridine ring. NAD possesses no 340-nm band.
mixture at different excitation wavelengths. Excitation at higher wavelengths results in a pronounced flavin emission. However, a clear differentiation of these coenzymes in cells and tissue is difficult. Another ap- proach to separate these compounds is by time-re- solved measurements. We determined the fluorescence
decay kinetics of the coenzymes in aqueous solution by ultrashort laser excitation with a novel.frequency- doubled laser diode at 390 nm (pulse duration, 40 ps) and the method of time-correlated single-photon counting (TCSPC) [16] (see Table III).
The free reduced pyridine coenzymes show in
0
H 3 C ~
H3C 0 I R
FMN
E
O 2r~ H3C~ .,/~.~ ~.[~ ~,, .
FMNH 2
0.15
700 nm
0.5. /
400 560 ebo
2'00 300 400 500 nm
f / n s I/,%
5.2 100
10 3
io 2
10 t
20 Koenig and Schneckenburger
10 ~
\ - \
r i i r 1 t i t I i i I
2 ~ 6 s 1o t2 14 ts t8 ~ za 24 Time/lO -~
Fig. 2. Structure, absorption and fluorescence spectra, and fluorescence decay kinetics of FMN.
aqueous solution a biexponential behavior with a main fluorescence lifetime in the picosecond range, in contrast to monoexponentially decaying FMN, with a lifetime of about 5 ns. Bound NAD(P)M has a lifetime of 1-3 ns, whereas flavoflavins have picosecond lifetimes. A dif- ferentiation between type of coenzymes and free/bound status is therefore possible.
The fluorescent coenzymes act as sensitive bioindi- cators of metabolic functions such as the degradation of glucose or respiration. In particular, NADH may serve as an indicator of the intracellular oxygen concentration [17].
Any change in the oxygen supply results in changes in the mechanisms of electron transport of the respiratory chain. In particular, a reduced oxygen concentration leads to a higher NADH concentration. Therefore, the fluorescence of this reduced coenzyme enables the monitoring of the function of various intact organs. Already in 1959, Chance and Josis [18] studied the NADH emission during muscle contractions. Guezennec et al. [19] determined a NADH concentration of 0.087 mmol/kg in human muscle before, and a value of 0.184 mmol/kg at the moment of maximal contraction. They found that the corresponding fluoresence

Autofluorescence for Medical Diagnosis 21
"U.
E
u
G
400 500 600
~ ~ , ~ - " . ~ 360 nm
400 500 600
. ~ " ~ 3 6 5 nm
400 500 600 nm Fig. 3. Emission spectra of a mixture of NADH (10 }xM) and FMN
(0.5 ~ in aqueous solution [15].
increase occurred within 3 s. The increase in NADH con- centration can be explained by local hypoxia and also by enhanced NADH synthesis due to higher activation of mi- tochondrial enzymes as a result of the calcium increase during muscle contraction [19].
The increase in NADH-induced fluorescence during ischemia, hypoxia, and anoxia was demonstrated by Mayevski [20] by in vivo fiber fluorometry on brain. These experiments show that it is possible to get on-line information on the oxygen status of organs by means of non- or low-invasive fluorescence detection.
Autofluorescence in the blue/green can also be used to differentiate between various tissues. Lohmann et al. [21,22] used the 365 nm-induced autofluorescence at 475 nm for tumor detection. They measured the autoflu- orescence of unstained cryosections of tumor- and sur- rounding tissue as well as the in vivo fluorescence of melanomas and found increased fluorescence intensity in the peritumoral regions. However, skin fluorescence in the blue/green spectral region is based on various fluo- rophores, such as collagen, elastin, and the coenzymes mentioned above. As a result, an exact determination of NADH emission is difficult. In the case of cryosections, the redox state of the coenzymes will be different from in vivo conditions.
We measured mitochondrial deficiencies in living cells by coenzyme-induced autofluorescence using video-en- hanced/intensified microscopy and TCSPC. Different yeast strains (Saccharomyces cerevisiae) with genetic deficien- cies of cytochromes a, a3, and b in the respiratory chain and control strains [23,34] were used. Substructures of the cells with a diameter of about 5 Ixm were visualized by video-enhanced DIC (differential interference contrast) mi- croscopy and combined with video-intensified fluorescence microscopy [16]. Excitation wavelengths at 365 and 436 nm were used for the pyridine coenzymes and the flavins, respectively. The corresponding cutoff wavelengths of the long-pass filters were 410 and 470 nm. It was found that the NADH-based autofluorescence of respiratory-deficient strains was a factor of 4 higher than that of intact strains (Fig. 4). Differences in flavin autofluorescence were less pronounced.
Cells showed a triexponential fluorescence decay pattern at 450 ___ 20 and 500 ___ 20 nm (excitation; 390 nm) (see Table II). The additional decay time and the differences compared to the measured values of free coenzymes can be explained by the existence of bound coenzymes (decay time of flavoproteins is mainly in the picosecond region [25]) and, in each case, by a small contribution of the other coenzyme. Differences between intact and defective strains occurred mainly in the life- time and the relative intensity of the short-lived corn-

22 Koenig and S c h n e c k e n b u r g e r
Fig. 4. DIC (a) and fluorescence images of respiratory-deficient (b) and intact (c) cells of Saccharomyces cerevisiae.

Autofluorescence for Medical Diagnosis 23
Fig. 4. Continued.
Table II. Fluorescence Lifetimes (Tj) and Relative Intensities (ll) of Intact and Respiratory- Deficient Yeast Cells
Strain X (nm) 7"1 (ns) ll (%) 7"2 (ns) 12 (%) T3 (ns) 13 (%)
Intact and defective 450 0.20-0.30 30 1.4--2.4 40 6.0--8.0 30 Intact 500 0.20-0.35 45 2.0-3.0 25 6.0.--8.0 30 Defective 500 0.30-0.50 35 2.0-3.0 30 6.0--8.0 35
ponent detected at about 500 nm and are probably based on a different ratio of free-to-bound flavins. These re- sults indicate that both, steady-state and time-resolved fluorescence can be used to probe the functioning of the respiratory chain.
In another study we investigated the modifications of autofluorescence during cell and tissue damage. The intracellular autofluorescence pattern of epithelial cells
(RR 1022, Schmidt-Ruppin sarcoma), grown as mono- layers on a slit, was measured using video-intensified microscopy. The cells were flooded with formalin. Si- multaneously, the fluorescence was recorded (video fre- quency). A strong increase in intracellular fluorescence for 365-nm excitation (NADH/NADPH) and 405/436- nm excitation (flavins) was observed, indicating func- tional cell damage (Fig. 5). We measured a similar, but

24 Koenig and Schneckenburger
less pronounced autofluorescence increase in the blue/ green spectral region in the case of photodynamically induced cell damage [15]. Cell destruction was induced after incubation with the photosensitizer hematopor- phyrin derivative (HPD), 5-aminolevulinic acid (ALA), or 8-methoxypsoralen (8-MOP) and light exposure [15,26]. Light activation of these agents results in pho- totoxic oxidation processes [27-29].
Similar autofluorescence measurements were car- ried out on live mice with subcutaneously transplanted G3 colon tumors. Six hours after intravenous ALA administration (280 mg/kg), the skin above the tumor was carefully removed. Then the tumor area was irra- diated with 630-nm light (100 J/cm 2) from a dye laser. Autofluorescence was excited with the 351- or 407-nm line of a krypton ion laser. A shutter blocked the 630- nm radiation during fluorescence measurements. No sig- nificant fluorescence increase in the tumor or surround- ing skin (fluorescence maxima, 460--475 nm for 351-nm excitation and 480-490 nm for 407-nm excitation) was measured during this photodynamic treatment; however, a strong increase occurred in the following 2 weeks [15]. This increased fluorescence was found to be located in limited areas of the irradiated tumor, probably indicating hypoxic or necrotic regions (Fig. 6).
Therefore, autofluorescence in the short-wave- length part of the visible spectrum can yield information on metabolic state, oxygen concentration, mitochondrial deficiencies, and tissue vitality.
PORPHYRIN-INDUCED AUTOFLUORESCENCE
Porphyrins are derivatives of the tetrapyrrole mol- ecule porphin. They are the intermediate products in the synthesis of the metalloporphyrin heme [ferropro- toporphyrin (Fe2+)], hemin [ferriprotoporphyrin (Fe3+)], or chlorophyll, the latter containing magnesium as the central atom. All aerobic cells are able to synthesize hemeproteins [3]. The most important porphyrins in biological systems are the fluorophores protoporphyrin IX (PP IX), coproporphyrin III (CP III), uroporphyrin Ill (UP III), and hematoporphyrin IX (HP IX). In ad- dition, UP I and CP I occur as by-products of the heme synthesis and are excreted in the urine and feces [3].
Normally, the concentration of porphyrins in bio- logical tissue is extremely low. However, abnormalities in heine synthesis due to enzyme defects can cause a high accumulation of these metal-free fluorescent por- phyrins. This results in strong red autofluorescence sig- nals emanating from inner organs, erythrocytes, skin,
urine, and feces. Corresponding diseases are termed por- phyrias.
Two classes of hereditary porphyrias exist: (a) erythropoietic porphyria, where excessive amounts of UP, CP, or PP are accumulated in normoblasts and erythrocytes, and (b) hepatitic porphyrias [e.g., inherited porphyria cutanea tarda (PCT)], where an abnormal for- mation of heme precursors and Zn-porphyrins occurs in the liver [3]. Porphyrias are normally detected by deter- mination of the porphyrin concentration in blood, urine, and feces by means of absorption or fluorescence mea- surements.
An abnormal accumulation of fluorescent porphyr- ins, mainly UP, CP, and PP, occurs also in some he- molytic diseases, anemia, and alcoholism. It can be induced by toxic chemicals such as chlorinated hydro- carbons or lead [3,30]. In the case of a decreased con- centration of the enzyme uroporphyrinogen (UROD), the disease is termed chemical-induced or sporadic PCT. In particular, lead and ethanol activate the enzyme ALA- synthase and inhibit the enzyme ferrochelatase (respon- sible for the insertion of iron into PP) and, therefore, stimulate the porphyrin synthesis. Also, cases of estro- gen-induced PCT [30] and PCT of patients with HIV-1 infection [31] have been reported.
In addition to enzyme defects, various microorgan- isms can provide endogenous porphyrins. For example, certain species of the genus Bacteroides produce PP. These anaerobic bacteria belong to the normal flora of the oral cavity and intestine [32]. Also, the skin bacter- ium Propinibacterium acnes emits in the red spectral region [33-35], as do some strains of Clostridium, Bi- fidobacterium, Actinomyces [36], Bacillus thuringiensis [37], and Staphylococcus aureus [38].
Some microorganisms contain chlorophyll. These photosynthetic microbiological cells fluoresce in the far- red spectral region. Interestingly, fluorescence in this region can sometimes be found in the skin, urine, feces, stomach, and intesine [39-41]. This emission is typically caused by food. For example, cereal corns emit at about 677 nm [41]. The responsible fluorophores are chloro- phyll or photodegradation products of chlorophyll, such as pheophytin or pheophorbide [40]. These reduced por- phyrins can be formed by a photoinduced demetallation process and by phytol chain removal [42].
The absorption spectrum of metal-free porphyrins consists of a major band at about 400 nm, the so-called Soret band, and four smaller Q-bands in the longer- wavelength part of the visible spectrum (Fig. 7). With the exception of UP, porphyrins aggregate in aqueous solution and deaggregate in ethanol or in the presence of serum albumin. Dimers and higher aggregates show

Autofluorescence for Medical Diagnosis 25
Fig. 5. Micrographs of the intracellular autofluorescence in the blue/green spectral region of epithelial cells before and during incubation with formalin.
a blue shift of the Soret band and have a lower fluo- rescence quantum efficiency than monomers. There- fore, the optimal fluorescence excitation wavelength should be about 400 rim. Appropriate excitation sources are the mercury lamp, with a strong emission at 405 nm, and the krypton ion laser, at 407 nm. However, this excitation radiation is also absorbed by the non- fluorescent hemoglobin. This competitive absorber limits the penetration depth of the excitation radiation to be in the micrometer range. To get information on
deep-lying porphyrins, longer excitation wavelengths corresponding to the Q-absorption bands can be cho- sen [41].
TUMOR DIAGNOSIS DUE TO FLUORESCENT ENDOGENOUS PORPHYRINS
There is a great probability that mutagenic cells show enzyme defects which can result in a preferential

26 Koenig and Schneckenburger
Fig. 6. Micrographs (2.5 x ) of in vivo tumor and skin autofluorescence 7 days after ALA phototreatment (~.~,c = 436 rim, hr = 470-570 rim). Fluorescent sites on the right: skin emission; in the middle: tumor emission.
porphyrin accumulation. Indeed, as early as 1924 Poli- card [43] observed a red autofluorescence in tumors dur- ing excitation with a Wood's lamp and suggested HP as the responsible fluorophore. This UV lamp is named after Wood, who developed short-pass liquid (nitrodi- methylanilin) and glass filters for absorbing visible light, thus leading to the construction of "pure" UV sources [44]. Gougerot and Patte [45], in 1939, Rochese [46], in 1954, and Sharvill [47], in 1955, noted similar fluo- rescence using this UV lamp. In 1960, Ghadially [48,49] reported that endogenous PP IX is the main fluorophore responsible for red autofluorescence in chemically in- duced animal tumors. Three years later, he and his co- workers [50] suggested that microbial synthesis is the origin of the porphyrin accumulation in tumors. Harris and Werkhaven [51] visualized the red emission of oral cancers by means of a fluorescence lamp as an excitation source and viewing through laser-guard argon goggles. Alfano et al. [8] excited tissue samples with the 488-nm line of an argon ion laser and found peaks between 590 and 600 nm in tumor tissue. Yuanlong et al. [52] mea- sured biopsies of squamous cell carcinoma 4 h after re- moval and found 89% agreement between red autofluorescence and the traditional biopsy method. The 365-nm line of a pulsed xenon ion laser served as the
excitation radiation. They suggested that autofluores- cence is based on the accumulation of certain degrada- tion products of hemoglobin in cancer tissue.
We measured autofluorescence in vivo using the 364-nm line of an argon ion laser and a fiber-optical sensor and found strong signals at 673 nm in the skin, at 638 and 680 nm in subcutaneously transplanted solid Ehrlich carcinoma of mice [39], and at 635 nm in patients with squamous cell carcinoma [40]. The sen- sitivity of the measurements could be enhanced by using the 407-nm radiation of a krypton ion laser and a sen- sitive detection system consisting of a fiber-optic sen- sor, polychromator, and multichannel analyzer (Fig. 8).
Biopsies of 30 oral human squamous cell carcino- mas were measured 1 h after removal [53]. The biopsies were stored in 0.9% NaCI. Only 20% of the biopsies showed a weak autofluorescence in the red spectral re- gion. These samples showed necrotic regions. No fluo- rescence was found in biopsies from surrounding sound tissue. The autofluorescence spectrum of the carcinoma consisted of a major peak at 636 nm, typical of PP. Five biopsies showed an additional peak in the 580- to 600- nm region (Fig. 9a) where Zn-PP emits. All fluorescent biopsies were stored in glass vials at room temperature

Autofluorescence for Medical Diagnosis 27
2. 0~' CH 2
H3C CH
"H3C CN 3
HOOC H2C H2C CH CHz_
~ H 2 CH 3 CH 2 ~OOH
380 4f~ 540 ~0
100 Laser Puls ," , , , Ual. Y,~ .-,,. N~. u~,.
% ' t l = 12 n s "r2= 2 ns ~3 = 120 ps
0 0.00 2.90 4.80 6.00 8.0~)
t i~e/ns
Fig. 7. Top: Structure and absorption spectrum of PP IX in D M S O .
Bottom: Typical fluorescence decay curve of metal-free porphyrins in
aqueous solution with decay times at 12 ns (monomers), 2 ns (directs), and 100 ps (higher aggregates).
and showed a significant increase in fluorescence over the following 2 weeks (Fig. 9b). The band at 580 nm became the new spectral maximum, probably due to the insertion of zinc into endogenous PP. Metallation was also observed for free porphyrins stored in glass vials (glassware contains zinc) [54-56].
In another study we divided a freshly removed weak- fluorescent biopsy into three parts. One was stored in NaCI solution, the second in formalin, and the third in NaCI solution incubated with antibiotics (Polymexin E). Only the first developed strong autofluorescence in the red spectral range. The increase in fluorescence in NaCI- stored biopsies can be explained by microbial synthesis of PP. When samples were assayed for bacteria, the fluorescent Pseudomonas aeruginosa was isolated (Fig. 10). Our results confirm that the red autofluorescence which can be found in some oral squamous cell carci-
Kr +- laser
filter
I 10|
sensor
Fig. 8. In rive fluorescence spectrometer.
prisms
.
f lbre~L
i Klee
la0
I.
wAwug~Tm / m
a
1300
1200-
10O0
8O0
~00
ZOO-
b Fig. 9. (a) Autofluorescence spectrum of an oral squamous cell car- cinoma, 1 h after removal. Peritumoral tissue showed no porphyrin fluorescence. (b) Autofluorescence 2 weeks later.
nomas originates from fluorescent bacteria, and not from enzymatic defects in heme synthesis. High concentra- tions of these bacteria can be found in necrotic and ul-. cerated tumor tissues. Thus, red autofluorescence does not seem to be an appropriate method for the detection of early-stage squamous cell carcinoma.

28 Koenig and Schneckenburger
\ 63 ,
k , ~ 703
i F 600 700 ~,vavelenglh/nm
Fig. 10. Autofluoresccnce spectrum of the Gram-negative bacterium Pseudomonas aeruginosa.
Many efforts have been made to employ autoflu- orescence for tumor detection. Some studies have con- centrated on emission in the short-wavelength part of the visible spectrum [21,22,57-60]. As mentioned before, Lohmann et al. [21,22] measured UV-excited emission at 475 nm. Montan and Stroemblad [57] found tumor- specific emission bands at 390 and 435 nm. Alfano et
aL [8] measured a tumor-specific peak at 521 nm when excited with 488-nm radiation. Hung et al. [58] found differences in fluorescence intensity only between tumor and peritumoral tissue. Tang and Alfano [59] explained the spectral differences between normal and cancerous tissues by the influence of different hemoglobin absorp- tion.
Despite promising preliminary results, further in- vestigations are necessary before laser-induced autoflu- orescence can be used clinically for the diagnosis of early-stage cancer.
I N VIVO DETECTION OF BACTERIA IN HUMAN SKIN
The Gram-positive bacterium Propionibacterium
aches belongs to the normal flora of human skin. It is involved in the pathogenesis of the widespread skin dis- ease acne vulgaris. This bacterium synthesizes CP and PP [33-35,61--64]. The significance and the optimal conditions for the porphyrin synthesis are not well stud- ied. These endogenous porphyrins are responsible for the yellow/red autofluorescence of human skin. As early as 1927, Bommer [44] reported orange skin fluorescence when irradiated with the Wood lamp.
We carried out fluorescence imaging and spectral analysis of different skin areas (face, back) of 30 test patients with and without acne vulgaris [65]. For that
purpose we used the in vivo fluorescence spectrometer depicted in Fig. 8 and a color CCD camera combined with a long-pass filter (cutoff wavelength, 550 nm). All persons excited with the 407-nm radiation of the krypton ion laser showed strong fluorescent spots in the skin, mainly in the nasal region and in pimples of acne patients (Fig. 11). These spots localize sebaceous follicles which contain large amounts of P. acnes. The spots differ in color; most fluoresce in the yellow or red. Their spec- trum consists of three main peaks, at about 580-600, 620, and -640 nm, as shown by the spectral analysis of single fluorescent spots (diameter of the excitation fiber, 0.2 or 0.6 mm) (Fig. 12). The primary peak was at 600 nm, indicating the existence of metalloporphyr- ins, probably Zn-PP.
Extracted sebaceous follicles showed spectra simi- lar to the in vivo skin spectrum. We isolated P. acnes
from these follicles. The spectral behavior of the bacteria grown on agar (blood agar base No. 2; OXOID) under dark conditions at 37~ in anaerobic jars (Gas Pack Sys- tem; OXOID) was different. We found bacterial colonies with either a 635-nm fluorescence band (PP) or a 620- nm band (CP) or colonies which emit both bands. No metalloporphyrin peak was found. The incorporation of zinc may therefore occur in the skin by the uptake of dermal zinc. We varied the pH value of the agar medium to study the pH influence on the spectral behavior but found no dependence of the ratio of the fluorescence intensities at 635 to 620 nm.
In situ autofluorescence imaging of the human skin is a rapid detection method which can be used to localize fluorescent bacteria. It is of special interest for the di- agnosis of acne and seborrhoic diseases and allows the rapid noninvasive control of treatments, especially in the case of antibiotic therapy and UV phototreatment [66,67].
DIAGNOSIS OF CARIES AND DENTAL PLAQUE
In 1927 Bommer investigated his patients with the Wood lamp and found an orange and red fluorescence of the tooth film [44]. Benedict [68] and Hartles and Leaver [69] reported on tooth fluorescence under UV irradiation. Armstrong [70], in 1963, studied the fluo- rescence of healthy and carious human dentine prepa- rations. Since the eighties, different groups [71-76] have tried to localize carious regions by means of laser-in- duced autofluorescence. Alfano et al. [74] measured a fluorescence maximum at 550 nm in carious lesions when excited with 488-nm radiation. Albin et al. [75] found an emission peak at 590 nm in dental caries.

Autofluorescence for Medical Diagnosis 29
Fig. 11. Autofluorescence spectrum of the author's nose (kk). The fluorescent spots localize scbaceous follicles which contain large amounts of porphyrin-producing Propionibacterium acnes.
We investigated the autofluorescence of about 100 freshly extracted human teeth using violet excitation, the optimal excitation source for porphyrins [77,78]. It was found that healthy dental tissue (enamel, dentin) showed a broad emission band in the short-wavelength part of the visible spectrum. In contrast, the fluorescence spec- trum of all carious lesions consisted of maxima in the red spectral region, with a main band at 635 nm. A clear differentiation between healthy and carious tissue was possible. Less than 10% of the teeth showed an addi- tional band at about 590 nm and shoulders at 620 nm (Fig. 13). In vivo measurements on patients, using a single detection fiber, showed similar spectra in regions of dental caries.
As mentioned, the maxima at 635, 620, and 590 nm correspond to the emission peaks of PP, CP, and
Zn-PP in hydrophobic environments. HPLC measure- ments confirm the existence of these chromophores in a concentration range of several picomoles per milligram dry weight in the carious lesion [78]. The question arises regarding the origin of these endogenous porphyrins in dental caries. We investigated various cell cultures which can be found in caries and dental plaque. Hardie and Bowden [79] found that the bacteria Streptococcus, Ac- tinornyces, and Bacteroides are the microorganisms mainly responsible for the plaque flora.
No porphyrin fluorescence in the red spectral region was measured for the bacterial strains Streptococcus rnu- tans and various Lactobacteria grown on agar plates. However, a strong fluorescence with maxima at 635 and 700 nm was detected in the bacterial strainsActinomyces odontolyticus, Bacteroides intermedius (strongest fluo-

30 Koenig and Schneckenburger
5 0 f l 0 _ ,~
,,t
~0_ z
3 5 U 0 _
>. J . . u _
2 5 0 0 _
2DOB _ _
t 5 0 0 _ _
1000 _ _
56g _ _
0 ~
I I I I I I 500 550 500 t-'50 700 750
~VAVEI,FN~,TII / nm
Fig. 12. In vivo autofluorescence spectrum of a fluorescent spot in the human skin. The spectrum is a superposition of the fluorescence of PP, CP, and probably Zn-PP.
rescence) (Fig. 14), and Pseudomonas aeruginosa. The microorganism Candida albicans and Corynebacterium emitted at about 620 nm (CP).
Our results demonstrate that the red autofluores- cence characteristic of caries and dental plaque is based on porphyrin-synthesizing oral bacteria present in dental lesions. One problem of early-stage caries diagnosis by autofluorescence is the emission of the surrounding healthy tissue. As shown, this fluorescence shows no structured spectrum in the red spectral region. However, the fluo- rescence intensity at 635 nm of the healthy tissue can be higher than the caries peak in the case of very small lesions or early-stage caries. One solution to this prob- lem is the use of time-gated fluorescence technology as demonstrated below.
ENHANCEMENT OF AUTOFLUORESCENCE
The autofluorescence of cells and tissues can be enhanced by stimulated biosynthesis of endogenous fluo- rophores. For example, the production of endogenous porphyrins can be stimulated by the modification of en- zyme activity, the application of iron scavengers, or the external administration of porphyrin precursors. Figure 15 demonstrates the schematic pathway of heme synthe- sis. Each nucleated mammalian cell is able to synthesize heme-containing enzymes. Catalytic reactions lead to the formation of the precursor ALA due to the ALA syn- thase-catalyzed condensation of glycine with succinyl-
CoA (C4 pathway, mammalian cells) or due to a Cs pathway from L-glutamate (some bacteria, algae, plants) [80]. In the next step, the enzyme ALA dehydratase catalyzes the formation of porphobilinogen from two ALA molecules. Further reactions lead to the synthesis of PP IX, followed by the ferrochelatase-catalyzed iron inser- tion process that results in heme. Heme provides nega- tive feedback on the activity of the enzyme ALA synthase (located in the mitochondrial matrix) and therefore limits the synthesis intracellular ALA [81].
However, external administration of ALA bypasses normal heme regulation. This results in increased syn- thesis of PP and heine and an increase in autofluores- cence. The efficiency of the PP IX synthesis depends on the kind of cell. For example, less synthesis occurs in the dermis compared with the epidermis. Endometrium produces a higher amount of PP than myometrium [82]. Rapidly dividing tumor cells accumulate more PP than normal cells as shown, e.g., by Malik and Djaldetti [83] in the case of leukemia cells or by Baumgaertner et al. [84] after ALA instillation in the bladder.
Kennedy and Pottier [28] have used ALA-induced formation of PP in cancer research. They applied topical ALA to various skin tumors and obtained selective ac- cumulation in tumor tissues. Selectivity can be explained by the absence of penetration through the intact stratum corneum of the surrounding healthy skin, in contrast to the defective keratin layer common to skin abnormalities such as tumors and psoriasis.
PP synthesis in well-defined skin areas can be ob-

Autofluorescence for Medical Diagnosis 31
I~O-
I2CO -
I000
e ~
400
2C0
\
\\ ~ . noncaFlous
II00
~0
~ 0
kRO.
t~O
1tO0
IOCO-
~'.*.'/IP.,I~,~I / m
Fig. 13. Autofluorescence spectra of various regions of freshly extracted human teeth with carious lesions.
tained after removal of the stratum corneum and topical ALA administration. We removed this layer by ablation using an Er:YAG laser and found the PP IX fluorescence only in the region of tissue ablation [85]. The maximum of the fluorescence occurred 4-6 h after ALA adminis- tration and dropped to 37% (l/e) within 12 h.
The PP content in cells and tissues cart also be en- hanced by the administration of agents with a high af- finity for iron, such as desferrioxamine. This results in a reduced rate of iron insertion in PP molecules and therefore in a reduced rate of heme synthesis. In addi- tion, more intracellular ALA is produced due to dimin- ished feedback regulation (see Fig. 15).
Figure 16 shows our results of tumor fluorescence after ALA and desferrioxamine administration. The flu-
635
/ l " !t ' /t
600 700 wavelength/nm
Fig. 14. Autofluorescence of the Gram-negative bacterium Bacteroides intermedius on agar plates containing blood. These bacteria are able to remove iron from blood (demetallation process).
external administration
uroporphydnogen I
coproporplwdnogen I
glycine + succlnyl CoA
ALA syn thase
AMINOLEVLJLINIC ACID
porphobllinogen
polypyrryl methane
.d~.~ / ~ - . . . ~
uroporphyrlnogen III
copcoporphyfl~n III
protoporphyrlnooen
PROTOPORPHYRIN
Iron
IX
ferroche/atase
desferrloxamlne --I e x t e r n a l a d m k , , ~ u ~ I
I ferdoxamlne heine
Fig. 15. Schematic pathway of heme biosynthesis. External adminis- tration of AI..A bypasses the heine regulation (negative feedback) and leads to enhanced PP IX production. A further increase in PP IX concentration can be achieved by the additional application of desfer- rioxamine. One mole of this agent binds 1 mole of iron, forming the stable iron complex ferrioxamine.
orescence signals at 635 nm of two groups of xenotran- splanted G2 bladder tumors were compared: One group. was incubated with ALA alone (280 mg/kg, i.v.), the other, with ALA and desferrioxamine (0.75 mg, intra- tumoral). A faster fluorescence rise and higher intensity

32 Koenig and Schneckenburger
were found in the case of simultaneous ALA and des- ferrioxamine administration [86].
As mentioned before, another way to increase por- phyrin accumulation is the modification of the enzyme activity. It has been shown by several groups that ex- posure of cells to chemical substances, such as DDC, EDDC, and griseofulvin, results in inhibition of ferro- chelatase [87--89]. Malik et al. [90] found that when melanoma cells were exposed to ALA in the presence of DMSO and allylisopropylacetamide, PP IX levels in- creased from 8 to 22,000 pmol/mg cell protein. Javor and Febre [91] stimulated porphyrin synthesis in Esch- erichia coli by application of 1-thioglycerol. The auto- fluorescence in microorganisms can also be enhanced by the external administration of ALA [92,93]. However, bacteria from the genus Bacteroides show another path- way of PP accumulation. They are able to remove iron from heme or blood and fluoresce due to this demetal- lation process [32].
In conclusion, the stimulation of the biosynthesis of metal-free porphyrins in microorganisms and tissues enhances autofluorescence and can be used for detection of microorganisms and diseases, in particular for cancer diagnosis.
ENHANCEMENT OF THE SENSITIVITY OF AUTOFLUORESCENCE DIAGNOSTICS BY TIME-GATED FLUORESCENCE MEASUREMENTS
The sensitivity of noninvasive autofluorescence di- agnostics can be enhanced by time-gated fluorescence measurements using an appropriate ultrashort time in- terval of detection. The idea is to consider the different
te l Iluoreeoenoe Intensity
2000 1 " "
0 10 20 30 40 60
time poet Injectlonem/min
m tumor ALA ~ tumor ALA*Desferr
Fig. 16. In vivo autofluorescence of a xenotransplanted G2 bladder tumor after administration of ALA alone and in combination with desferrioxamine (Desferr).
fluorescence decay kinetics of the various endogenous fluorophores and to choose an appropriate time window which isolates the compound of interest. In addition, scattered excitation light can be excluded with sufficient time delay between ultrashort laser excitation and detec- tion. A preferential application of this method is the detection of metal-free porphyrin monomers. These fluo- rophores have fluorescence decay times greater than 10 ns. Other endogenous chromophores possess shorter flu- orescence lifetimes (see Table III). PP, CP, and HP ag- gregate in aqueous solution, resulting in a blue shift of the Sorer band and an additional fluorescence peak at about 650-670 nm. Dimers have a fluorescence lifetime of about 2 ns; higher aggregates of about 100 ps [94- 96].
We found that ALA-induced PP in cells showed a nearly monoexponential fluorescence decay [97] and conclude, therefore, that intracellular formed PP exists mainly in its monomeric form (Fig. 17). The fluores- cence decay curves in tissue are more complicated. Be- cause of multiple scattering, fluorescent photons can be distributed along various paths, leading to an additional time delay for photons arriving at the detector. Although this effect may artificially extend decay curves, we ex- pect that for 390-nm excitation, only superficial fluo- rophores will be excited and lifetime errors will occur in the picosecond range only. Figure 18 demonstrates the decay pattern of normal and ALA-stimulated auto- fluorescence of human skin. It is obvious that skin in- cubated with ALA contains a long-lived fluorophore which can be attributed to PP monomers. It should therefore be possible to detect porphyrin monomers very sensi- tively by choosing a time delay of more than 10 ns be- tween excitation and detection.
Figure 19 shows the experimental setup for time- gated imaging and time-gated spectroscopy in the nano- second region. It consists of a fluorescence microscope with a highly sensitive videocamera (Proxitronic, NCA)
Table III. Fluorescence Decay Times of Fluorophores
Fluorophore Solvent T~ (ns) 11 (%) T2 (ns) 12 (%)
NAD(P)H H20 0.45---0.60 75-90 1.4-2.2 10-25 FMN H20 5.2 100 Flavoproteins H20 < 1 Collagen powder 2.7 25 8.9 35 Elastin powder 2.0 75 6.7 65 Zn-PP DMSO 2 100 PP IX DMSO 17 89 3 11 CP IX DMSO 20 100 PP photoproducts DMSO 0.7 38 4.5 62

Autof luorescence for Medica l Diagnosis 33
, = :
I0 ~
D e c a y kinet ics and t ime w indows I I - l ~ - - ] T - - - | - - i - r - q - - - i . . . . . . 1.
E
I I I I I i I I I
4 6 6 10 12 14 15 18 20 22
Time/IO -g sec
Fig. 17. Fluorescence decay kinetics of an ALA-incubated chorioallontoic membrane (CAM) of a chicken embryo.
and a monochromator combined with an optical multi- channel analyzer (Hamamatsu, IMD, C4562). The im- age intensifiers of both detectors are time-gated by the exciting laser pulses and adjustable synchronization elec- tronics. The minimal time gate was 5 ns. A frequency- doubled Q-switched Nd:YAG laser (pulse duration, 2 ns, repetition frequency, 10 Hz) or a tunable dye laser pumped by the third harmonic of the Nd:YAG laser was used as the excitation source. Fluorescence spectra and images were integrated over 10 s. Additional time-in- tegrated (cw) measurements were carried out by using the 546-nm band of a high-pressure mercury lamp.
We measured the in vivo fluorescence of human skin including a small area of Er:YAG- and ALA-treated skin [85]. A time gate of 5 ns was chosen and the time delay was varied. The autofluorescence spectrum in the detection range 0-5 ns consists of a superposition of the strong emission (with a maximum in the green) due to endogenous fluorophores, such as coenzymes, collagen, and elastin, and the ALA-induced porphyrin fluores- cence. The PP IX peak at 635 nm becomes prominent for increasing time delays (Fig. 20). Figure 21 shows the time-integrated image (Fig. 21a) and the time-gated
10 2
c =
,:= tO t
A L A - i n c u b a t e d sk in
~ " \ ' ~ - - . . . - . .
t00 I I , i i i i
0 5 tO 15 20
T i m e / I O -9 s e c
Fig. 18. Fluorescence decay pattern of skin after laser removal of stratum comeum and topical ALA administration. The detection area was greater than the ALA-treated area. Therefore, superimposition of normal autofluorescence and PP IX fluorescence occurs.
image in the range of 20--45 ns (Fig. 21b). The first one shows a strong autofluorescence from the whole illu- minated skin area, whereas the time-gated one indicates the smaller spot of PP IX emission.
In situ time-gated images were also obtained from the teeth of people, with the aim of detecting caries and dental plaque. For that purpose the ultrafast-shutter cam- era was equipped with a zoom camera objective. The teeth were irradiated by means of a single fiber trans- mitting the pulsed laser light. The time-integrated image (detection range, 590-800 nm) shows a nearly homo- geneously distributed fluorescence over the whole tooth. This image is determined mainly by the autofluoresc- ence, which has its maximum in the short-wavelength spectral region (Fig. 22a). However, with a n appropriate time delay of more than 10 ns (here: detection time, 30-. 55 ns), only caries and plaque regions become obvious (Fig. 22b). As mentioned before, these regions contain bacteria which produce mainly PP IX.

34 Koenig and Schneckenburger
I Nd:YAG Laser ( 532nm. 2ns . I@Hz
Delay [ Pulse Gen. Trigger Signals
Coupler
>I I m.
0
/
H A
Intens
/
ns Camera
Im Intens
/
l F1 l te r •q
Input Coupler
Beam Splitter
Output
F l b e r
I F// / / . / / / / / / / / / / / /~A
Fig. 19. Experimental setup for time-gated measurements.
Dlchroic Mirror
Fluorescence Microscope
Sample
' -~- I l ,
,, ~ e'N,, ," I , "
f f 5 .10 n~
i �9 ,yl ip. . .'-.
1 5 - 2 0 ns
Fig. 20. Time-gated fluorescence spectra of ALA-treated skin.
AUTOFLUORESCENCE MODIFICATIONS DURING PHOTOTHERAPY
The porphyrin fluorophores, in particular PP IX, act as highly efficient photosensitizers. Irradiation results in
the population of the first singlet state 1p. This electronic state serves as the initial state for fluorescence emission and also for the transition into the triplet state by intersys- tern crossing (ISC). Metal-free porphyrins possess an ISC rate of up to 0.9 [99]. Porphyrins in the long-lived triplet state 3p can transfer energy to molecular oxygen, which results in the formation of singlet oxygen. The process is called type II photooxidation [27].
hf op __, ip
ISC 1p __. 3p
energy transfer 3p + O2 ~ op + 102
In addition, type 1 photooxidation occurs when ap par- ticipates in charge transfer reactions which lead to the formation of highly reactive radicals. Singlet oxygen and oxygen radicals cause cytotoxic reactions which can be used for photodynamic therapy (PDT), espe- cially for the treatment of cancer [27]. A substantial portion of clinical PDT is currently based on the use of the photosensitizer HPD, a mixture of different por-

A u t o f l u o r e s c e n c e fo r M e d i c a l D iagnos i s 35
Fig. 21. Time-gated in vivo fluorescence images of human skin. The stratum corneum was removed by an Er:YAG laser, allowing penetration of ALA in the epidermis. (a) The time-integrated (cw-excitation) image (image size, 2.5 x 3 mm 2) of the treated and surrounding unaffected skin. The whole illuminated skin area fluoresces. (b) In contrast, the time-gated image (detection range: 390-800 nm, 20--45 ns) shows a smaller fluorescent area due to PP IX fluorescence.

36 K o e n i g a n d S c h n e c k e n b u r g e r
Fig. 22. In vivo fluorescence video images of the teeth of a proband using time-integrated (a) and time-gated (b) (30- to 55-ns) detection. Carious regions and dental plaque become obvious in the time-gated video images.

Autofluorescence for Medical Diagnosis 37
3000
>. 2500
c
s 200o
% i qon
$ D
- 1 f~f~o ~; "6
b00
.1-
t p r o t o p o r p h y r m IX I)MSO/It20
'! ! }\
500 600 700 w , l v e l e r l g t h / n m
:500
3000
2500
c
c 2000 .ll
u I b O O
1 ooo
"6 ~' 500
0 50(
/
I -oLot~Orld~yl ln IX DMRO/D,jO
~ - ( .
600 700 800 wovelength/nm
3000
2500
c
i ,
,5 D
~6
2000
150{]
1 0 0 0
500
0 500
proLoporphyrm IX
NaN 3
600 700
wovelength/nm
3000
2500 m c
c 2000
c
~ t 5oo
o
IOOO
2 w
5OO
800 0 1 2 3 4 5 6 7 8 9 I0
i t i i i i i i r i
~ -'------<Y-- --v--.-....-..--~__..._____~
�9 ~ i - V I i ~ 7 . - - ~ V i ---I V i -Wi
f l u e n c e J / c m 2
D HzO Lx DzO
NaN 3
- - 631 nm 676 nm
Fig. 23. Singlet oxygen-dependent photoproduct formation. The lifetime of singlet oxygen is 10-fold higher in DzO compared with HaO. NaN3 is a well-known singlet oxygen quencher.
phyrins. A novel, successful approach to PDT using ALA-induced PP IX as photosensitizer has also been described [28].
The above photophysical scheme suggests that the porphyrin molecule should revert to the ground-state op after the final energy transfer step. However, destruction processes occur which result in sensitizer photobleaching and in the formation of fluorescent photoproducts [97,100- 103]. The chlorin-type photoproducts of PP IX fluoresce at 670 nm. They have fluorescence decay times of about 1 and 5 ns. We found that sing!et oxygen is involved in the conversion of PP IX into photoproducts (Fig. 23). Therefore, on-line measurements of ALA-stimulated au-
tofluorescence during PDT can give information on the formation of singlet oxygen and, thus, on the efficiency of a treatment.
Figure 24 demonstrates the photoinduced modifi- cations to the ALA-induced PP IX autofluorescence dur- ing PDT of tumor-bearing nude mice [103]. Note the decrease in fluorescence at 635 and 710 nm due to pho- tobleaching and the increase at 670 nm due to photo- product formation. Further irradiation resulted in a slow decrease in the 670-nm emission at a lower bleaching. rate than the original 635-nm fluorescence. Similar re- suits were found during the PDT of patients with pso- riasis and topical ALA administration (Fig. 25) or during

38 Koenig and Schneckenburger.
>-
L f]
Z L,J
Z
L~d
Z
LJ
(.D Uq
LJ Cd
L~
_] Ld
250
150
I(6?D}- 1630] tO
670 :~m
ftuence d / c m 2
I I I I I 550 600 650 700 750
WAVELENGTH Fig.24.Ph~t~inducedm~di~ti~ns~ftheALA-inducedtum~raut~u~rescenceduringPDT.N~tethe~u~rescenceincreaseat67~nnm.
6~u
~b ~
I 7t i l l I ss a v e l e n ~ : t h / n m
Fig. 25. Modifications of the ALA-stimulated autofluorescence of psoriasis during PDT.
the irradiation of nonincubated bacterial cultures of P. aches [65].
Fluorescence decay curves of the in vivo tumor flu- orescence before and after irradiation are depicted in Fig. 26. The nonirradiated tumor shows a slow decay, with a main fluorescence lifetime of about 17 ns. Irradiation results in a decrease in the integrated fluorescence and a shortening of the decay times to values typical for photoproducts.
These results indicate that spectral analysis and time- resolved/time-gated fluorescence measurements are ap- propriate tools for the detection of photoinduced destruc- tion of photodynamically active endogenous porphyrins. Further investigations are necessary to correlate fluores- cence modifications with PDT efficiency.
CONCLUSION
Autofluorescence of cells and tissues yields infor- mation on a broad variety of processes, including the metabolic function of the respiratory chain, the status of redox systems, the existence of various microorganisms, the involvement of bacteria in disease, and the existence of malignant cells.
Autofluorescence in the blue/green spectral region seems to be an appropriate tool for the determination of oxygen consumption and cell and tissue vitality and the detection of diseases associated with mitochondrial de- ficiencies or rapid cell growth. Fluorescence in the red is based mainly on endogenous porphyrins and can arise from defects in heme synthesis or microorganism activ- ity. Bacteria-involved diseases, such as acne vulgaris, otitis externa, dental caries, and plaque, can therefore

Autofluorescence for Medical Diagnosis
2 10
�9 i = 2 3 0 p s (17~) zz= 17.1 n s (83%)
z~= 2 7 0 p s (55Y.) z2 = S.O n s (45%)
OLJ
0 5 I0 t5 20 25
Tt. me 10 9
Fig. 26. Fluorescence decay kinetics of the ALA-induced tumor flu- orescence before and after irradiation. The shortening of the decay times can be explained by the formation of short-lived photoproducts.
be detected. In addition, phototreatment based on the photodynamic activity of porphyrin fluorophores seems to be possible, particularly when the biosynthesis of the photodynamically active fluorophore PP IX is stimu- lated.
Time-gated measurements allow the detection of in- dividual intrinsic fluorophores on the basis of their decay times. In particular, high-contrast fluorescence images of monomeric PP IX offers new detection possibilities. For example, we have shown that "caries images" and "dental plaque images" can be obtained and stored on normal videotape.
Interestingly, endogenous porphyrins undergo me- tallation processes (insertion of zinc or iron) and pho- toinduced destruction processes (transition into reduced porphyrins) resulting in modifications of their autoflu- orescence. Detection of photoinduced fluorescence changes can be used to yield information on photody- namically generated singlet oxygen and on the efficiency of porphyrin-based PDT. Therefore, in situ autofluores- cence measurements may assist clinicians during an ALA- based photodynamic therapy.
39
t ACKNOWLEDGMENTS
This work was performed with support from the Deutsche Forschungsgemeinschaft (DFG grant) and NIG Project 5P41 RR01192. The authors thank Bruce Trom- berg and Sol Kimel for their outstanding contribution.
REFERENCES 1. D. Creed (1984) Photochem. PhotobioL 39, 537-562. 2. D. Creed (1984) Photochem. Photobiol. 39, 563-575. 3. A. White et al. (1978) Principles of Biochemistry, McGraw-
Hill, New York. 4. National Academy of Sciences (1984) Specifications and Criteria
of Biochemical Compounds, 3rd ed., Sigma Chemical Company, St. Louis, MO.
5. J. Lakowicz (1986) Principles of Fluorescence Spectroscopy, Plenum Press, New York.
6. S. D. Kozikowski, L. J. Wolfram, and R. R. Alfano (1984) IEEE-QE 12, 1379-1382.
7. J. H. Aiken and C. W. Hui (1991)AnaL Lett. 24, 167-180. 8. R. R. Alfano et aL (1984) IEEE-QE 20, 1507-1511. 9. A. R. Holzwarth and T. A. Roelofs (1992) J. Photochem. Pho-
tobiol. B 15, 45--62. 10. H. Schneckenburger and W. Schmidt (1992)./. Photochem. Pho-
tobiol. B 13, 190-193. 11. C. Lee (1974) Biochem. Biophys. Res. Commun. 60, 838--843. 12. J. M. Salmon et at. (1982) Photochem. Photobiol. 36, 585-593. 13. P. Galland and H. Senger (1988) J. Photochem. Photobiol. B
1, 277-294. 14. M. Sun, T. A. Moore, and P. S. Song (1972)J. Am. Chem.
Soc. 94, 1730-1740. 15. K. Koenig et aL (1994) In W. Waidelich (Ed.), Laser. Opto-
electronics in Medicine (in press). 16. H. Schneckenburger and K. Koenig (1992) Opt. Eng. 31, 1447-
1451. 17. B. Chance et aL (1962) Science 137, 499--508. 18. B. Chance and F. F. Josis (1959) Nature 184, 195-196. 19. C. Y. Guezennec et aL (1991) Eur. J. AppL Physiol. 63, 36. 20. A. Mayevski (1984) Brain Res. Rev. 7, 49-68. 21. W. Lohmann and E. Paul (1988) Naturwissenschaften 75, 201-
202. 22. W. Lohmann et aL (1990) Z. Naturforsch. 45c, 1063-1066. 23. H. Schneckenburger, A. Rueck, and O. Haferkamp (1989)Ana/.
Chim. Acta 227, 227-233. 24. H. Schneckenburger, P. Gessler, and I. Pavenstaedt-Grupp (1992)
J. Histchem. Cytochem. 40, 1573-1578. 25. P. S. Song (1980) in H. Senger (Ed.), The Blue Light Syndrome,
Springer, Berlin, pp. 157-171. 26. K. Koenig et at. (1994) SPIE Budapest 2086 (in press). 27. D. R. Doiron and O. J. Gomer (1983) Porphyrin Localization
and Treatment of Tumours, Alan R Liss, New York. 28. J. C. Kennedy and R. H. Pottier (1992) 3". Photochem. Photo-
biol. B 14, 275-292. 29. A. K. Gupta and T. F. Anderson (1987) J. Am. Acad. Dermatol.
17, 703-734. 30. J. W. Young and E. T. Conte (1991) Int. J. Dermatol. 30, 399-
404. 31. D. Fuchs et at. (1990) AIDS 4, 341-344. 32. H. N. Shah et al. (1979) Biochem. J. 180, 45-50. 33. C. E. Cornelius and G. D. Ludwig (1967) J. Invest. Derm. 't9,
368-370. 34. B. Kjeldstad, A. Johnsson, and S. Sandberg (1984) Arch. Der-
matol. Res. 276, 396--400.

40 Koenig and Schneckenburger
35. A. Johnsson, B. Kjeldstad, and T. B. Melo (1987)Arch. Der- matol. Res. 279, 190-193.
36. J. S. Brazier (1986) 3.. Appl. Bacteriol. 60, 121-126. 37. R. L. Harms, D. R. Martinez, and V. M. Griego (1986)Appl.
Environ. Microbiol. 51, 481-486. 38. R. de la Fuente et al. (1986) FEMS Microbiol Lett. 35, 183-
188. 39. K. Koenig, W. Dietel, and H. Schubert (1989) Neoplasma 36,
135-138. 40. G. Weagle et aL (1988) J. Photochem. Photobiol. B 2, 313-
320. 41. K. Koenig et al. (1994) SPIE Budapest 2078 (in press). 42. B. A. Tapper et al. (1975)J. Sci. FoodAgr. 26, 277-284. 43. A. Policard (1924) C.R. Soc. Biol. 91, 1423--1424. 44. S. Bommer (1927)Klin. Wochenschr. 24, 1142-1144. 45. H. Gougerot and A. Patte (1939) Bull. Soc. Franc. Derm. Syph.
46, 288.--295. 46. F. Rochese (1954) Oral Surg. Oral Med. Oral Pathol. 7, 353-
362. 47. D. Sharvill (1955) Trans. St. John's Hosp. Derm. Soc. (London)
34, 32-36. 48. F. N. Ghadially (1960) J. Pathol. Bact. 80, 345-361. 49. F. N. Ghadially and W. J. P. Neish (1960) Nature 188, 1124. 50. F. N. Ghadially, W. J. P. Neish, and H. C. Dawkins (1963) J.
PathoL Bact. 85, 77-92. 51. D. M. Harris and J. Werkhaven (1987) Lasers Surg. Med. 7,
467-472. 52. Y. Yuanlong et al. (1987) Lasers Surg. Med. 7, 528-532. 53. W. Dietel, K. Koenig, and P. Dorn (1988) Laser-Induced Au-
tofluorescence of Tumors, PDT School, Berlin. 54. K. Koenig, J. Hemmer, and H. Schneckenburger (1992) in P.
Spinelli, M. DalFante, and R. Marchesini (Eds.), Photodynamic Therapy and Biomedical Lasers, Elsevier, Amsterdam, pp. 903- 906.
55. R. Margalit and S. Cohnes (1985) J. lnorg. Biochem. 25, 187- 195.
56. S. Sommer, C. Rimington, and J. Moan (1984) FEBS 172, 267- 271.
57. S. Montan and L. G. Stroemblad (1987) Lasers Life Sci. 1,275- 285.
58. J. Hung et aL (1991) Lasers Surg. Med. 11, 99-105. 59. G. C. Tang and R. R. Alfano (1989) Lasers Surg. Med. 9, 290-
295. 60. S. Svanberg et aL (1994) SPIE Budapest 2081 (in press). 61. I. Formanek et al. (1977)Arch. Dermatol. Res. 259, 169-176. 62. D. Fanta et al. (1981) Arch. Dermatol. Res. 271, 127-133. 63. D. Fanta et aL (1978)Arch. DermatoL Res. 261, 175-179. 64. W. S. Lee, A. R. Shalita, and M. B. Poh-Fitzpatrick (1978)J.
Bacteriol. 133, 811-815. 65. K. Koenig, A. Rueck, and H. Schneckenburger (1992) Opt. Eng.
31, 1470-1474. 66. H. Mcffcrt. Personal communication. 67. A. V. Lassus et al. (1983) Dermatol. Monatsschr. 169, 376-
379. 68. H. C. Benedict (1928) Science 67, 442.
69. R. L. Hartles and A. G. Leaver (1953) Biochem. J. 54, 632- 638.
70. W. G. Armstrong (1963)Arch. Oral Biol. 8, 79-90. 71. R. R. Alfano and S. S. Yao (1981)J. Dent. Res. 80, 120-122. 72. H. Bjelkhagen (1981) IEEE-QE 17, 226--228. 73. H. Bjelkhagen et al. (1982) Swed. Dent. Z 6, 1-7. 74. R. R. Alfano et al. (1984) IEEE-QE 20, 1512-1515. 75. S. Albin, C. E. Byvik, and A. M. Buonchristini (1988) SPIE
907, 96-98. 76. U. Hafstoem-Bjoerkman et al. (1991) Acta Odontol. Scand. 49,
27. 77. K. Koenig et al. (1993) SPIE 907, 125-131. 78. K. Koenig et al. (1994) SPIE Budapest 2080 (in press). 79. J. M. Hardie and G. H. Bowden (1974) in F. A. Skinner and J.
G. Cart (Eds.), Microbial Flora of Man, Academic Press, New York, p. 58.
80. J. M. Li et al. (1989) J. Bacteriol. 171, 2547-2552. 81. I. Z. Ades (1990) Int. J. Biochem. 22, 565-578. 82. J. Z. Yang et al. (1993) Photochem. PhotobioL 57, 803-807. 83. Z. Malik and M. Djaldetti (1979) Cell. Different. 8, 223-233. 84. R. Baumgaertncr et al. (1994) SPIE Budapest (in press). 85. H. Schneckenburger et al. (1994) Opt. Eng. (in press). 86. K. Koenig, F. Genze, and K. Miller (1993) Dermatol. Mon-
atsschr. 179, 132-134. 87. F. DeMatteis and B. E. Prior (1962) Biochem. J. 83, 1-8. 88. F. DeMatteis and C. Remmington (1963) Br. J. Dermatol. 75,
91-104. 89. A. M. Brady and E. A. Lock (1992) Arch. ToxicoL 66, 175-
181. 90. Z. Malik et al. (1994) SPIE Budapest 2078 (in press). 91. G. T. Javor and E. F. Fcbre (1992) J. Bacteriol. 174, 1072-
1075. 92. M. Doss and W. K. P. Dormston (1971)Hoppe-SeylerPhysiol.
Chem. 352, 725-733. 93. W. K. Philipp-Dormston and M. Doss (1975) Overproduction
of porphyrins and heme in heterotrophic bacteria. Z. Natur- forsch, 30, 425---426.
94. A. Andreoni et aL (1982) Chem. Phys. Lett. 88, 33-36. 95. M. Yamashita et al. (1984) IEEE-QE 20, 1363-1369. 96. H. Schneckenburger, H. K. Seidlitz, and J. Eberz (1988) J.
Photochem. Photobiol. B 2, 1-19. 97. K. Koenig, H. Wabnitz, and W. Dietel (1990) J. Photochem.
Photobiol. B 8, 103-111. 98. H. Schneckenburgcr et al. (1994) in W. Waidelich (Ed.), Laser
'93--Optoelectronics in Medicine, Springer, Berlin-Heidelberg (in press).
99. R. Pottier and T. G. Truscott (1986) Int. J. Radiat. BioL 50, 421-452.
100. P. Valat, G. D. Reinhardt, and D. M. Jameson (1988) Photo- chem. PhotobioL 47, 787-790.
101. W. Dietel, K. Koenig, and E. Zenkevich (1990) Lasers Life Sci. 3, 197-203.
102. H. K. Seidlitz et aL (1992) Opt. Eng. 31, 1482-1486. 103. K. Koenig et al. (1993) J. Photochem. Photobiol. B 18, 287-
290.