large scale outdoor flammable & toxic gas dispersion

1
A. Hallgarth *1 , A. Zayer 1 , A. Gatward 2 and J. Davies 2 1 Hazard Research & Risk Consultants Ltd (HazRes), 2 Independent Consultant *Corresponding Author: The Cambria, Marine Terrace, Aberystwyth, Wales, SY23 2AZ, UK. Email: [email protected] / Web: www.HazRes.com Large Scale Outdoor Flammable & Toxic Gas Dispersion Modelling in Industrial Environments Case 2: Onshore CH 4 Release HazRes has modelled a methane (CH 4 ) release in a hypothetical in- dustrial onshore facility, using its CFD Gas Dispersion Model in COMSOL as shown in Figure 2. The aim of this particular exercise is to demonstrate how the model can be used to locate fixed stationary gas detection sensors at a facility. The source of the release is a 10m high vessel. The computational volume has a footprint of 400m by 400m and the wind profile is logarithmic with height set at an angle of 30° from the X-axis anti-clockwise. In total, six (6) fixed gas detection sensors were located both upstream and downstream of the point of release as shown in Figure 3. In this particular example, the issue of concern is the concentration of methane in air that could provoke an explosion, if ignited. Therefore HazRes is interested in both the Lower Explosive Limit percentage for methane in air (LEL%) which is 5% (i.e. 50,000ppm) and 50% LEL which is 2.5% (i.e. 25,000ppm), purely as a safety factor. Figure 4 shows the predicted methane concentration levels as a function of time for each of the six (6) fixed gas detector sensors. Case 1: Exhaust Stacks near a Hill HazRes has used its CFD Gas Dispersion model in COMSOL to model a Carbon Dioxide (CO 2 ) rich exhaust plume from three (3) different height and diameter exhaust stacks at the base of a hypothetical hill. The three (3) exhaust stacks measure 25m, 50m and 100m in height. The computational volume has a footprint of 2km by 2km and the wind profile was logarithmic with height in a direction prevalent to the inclination of the hill. HazRes conducted a transient time-dependent analysis on the exhaust gas release in order to determine the cloud spread, extent and possible touchdown (cloud touches the ground) as a function of time. The time-dependent results are shown in Figure 1 of iso-concentration plots from the three (3) exhaust stack gas cloud dispersions. Introduction The prediction of an accidental gas release, whether toxic or flammable, in terms of people, assets and production is vitally important in terms of reducing the impact from such a Major Accidental Hazard (MAH). When conducting consequence analysis of gas releases, integral models are widely used. Geometrically complex scenarios (e.g. buildings, structures, process units, towers etc) and non-flat terrain (e.g. hills, inclines, descents etc) make integral models inaccurate and require more rigorous calculation Methods, such as Computational Fluid Dynamic (CFD) simulations, in order to obtain more accurate estimates of the dispersed cloud extent and its effect. Model Description & Validations HazRes’ CFD Gas Dispersion Model, using COMSOL, is a three-dimensional (3D) model adapted to simulate atmospheric airflow and dispersion simulation. The model and solver provide simulations based on the Eulerian approach, utilizing an un-structured grid, finite element method to model atmospheric air flow and dispersion at full scale and fine resolution. It also has the ability to model the interaction with complex terrain and obstacles using the k-epsilon turbulence closure model. HazRes’ Model has been validated against both experimental results as well as an industry standard integral model for which it is in good agreement. Discussion & Conclusions It is believed that the results presented demonstrate the capability of HazRes’ CFD Gas Dispersion model, solved using COMSOL Multi-Physics, and its capability to perform both stationary and transient time-dependent analyses of flammable and toxic gas releases over large geographic areas, complex terrains and structures. 1 2 3 4 5 6 Numbers show locations of different sensors Wind Direction 30° X-Axis 1 2 3 4 5 6 Numbers show locations of different sensors Wind Direction 30° X-Axis Wind Direction 30° X-Axis Figure 3. Plan View of Onshore Facility showing Locations of the Six Fixed Gas Detector Sensors. 0 5,000 10,000 15,000 20,000 25,000 30,000 35,000 40,000 45,000 50,000 0 100 200 300 400 500 Time [s] Concentration [ppm] LEL 50% LEL Sensor Target 1 Sensor Target 2 Sensor Target 3 Sensor Target 4 Sensor Target 5 Source Target 6 Approximate Calculated Time to 50% LEL Sensor Target 1 = Does Not Reach 50% LEL Sensor Target 2 = < 20 seconds Sensor Target 3 = 50 seconds Sensor Target 4 = 40 seconds Sensor Target 5 = 100 seconds Sensor Target 6 = 200 seconds Figure 4. Predicted Methane Concentration Levels as a Func- tion of Time for each of the Six Fixed Gas Detector Sensors. Source of Release Source of Release Figure 2. Computation Volume Model in COMSOL of Industrial Site and Source of Release Case 3: Onshore CO Release Using the same computational model, wind direction & wind profile as Case 2, HazRes has simulated a single release of Carbon Monoxide (CO) rich gas from the top of the same gas holder location. Figure 5: 2D Slice Plot at 3m Height Showing CO Dispersion as a Function of Time. HazRes used its CFD Gas Dispersion model to conduct a transient time-dependent analysis on the CO release relative to a target CO concentration which corresponds to significant Carboxyhemoglobin (COHb) level. Some results of the transient CO gas discharge and dispersion analysis can be seen in Figure 5 for 10 to 100 seconds from the start of release. Figure 1. Iso-Concentration Plots showing Exhaust Stack Gas Dispersion with Time including Cloud Touchdown. Presented at the COMSOL Conference 2009 Milan

Upload: others

Post on 03-Feb-2022

1 views

Category:

Documents


0 download

TRANSCRIPT

A. Hallgarth*1, A. Zayer1, A. Gatward2 and J. Davies2 1Hazard Research & Risk Consultants Ltd (HazRes), 2Independent Consultant

*Corresponding Author: The Cambria, Marine Terrace, Aberystwyth, Wales, SY23 2AZ, UK. Email: [email protected] / Web: www.HazRes.com

Large Scale Outdoor Flammable & Toxic Gas Dispersion Modelling in Industrial Environments

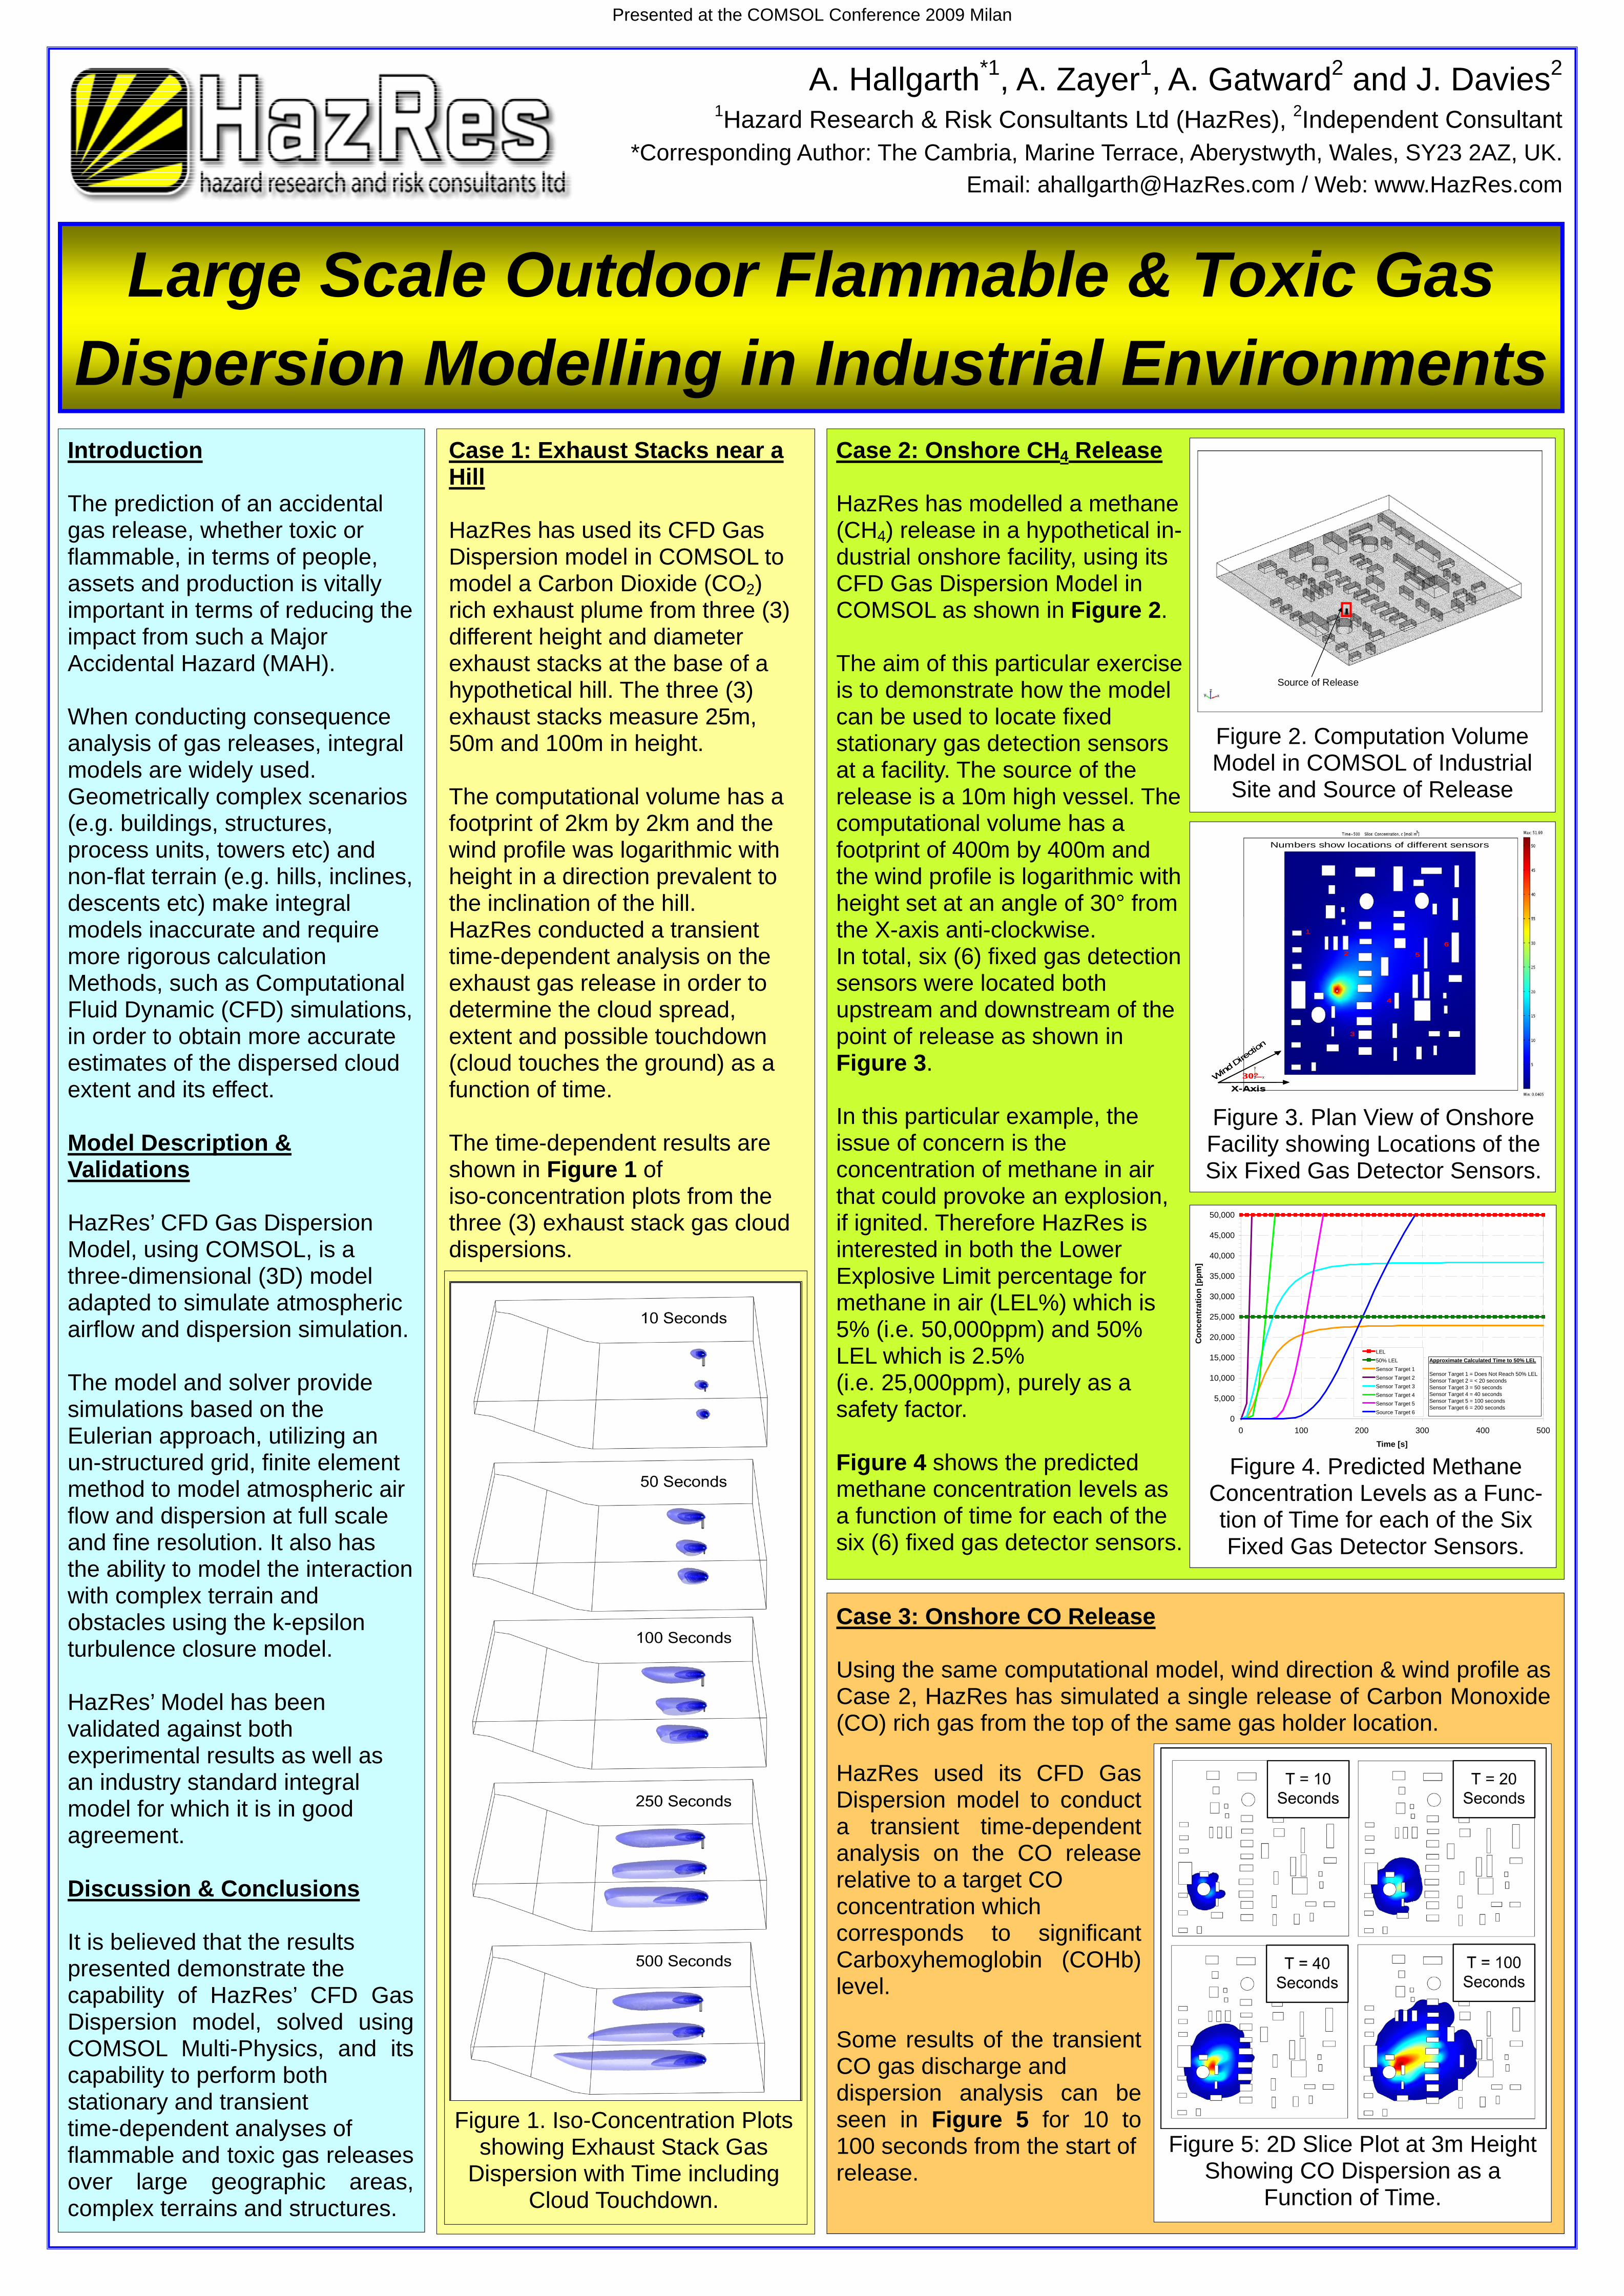
Case 2: Onshore CH4 Release HazRes has modelled a methane (CH4) release in a hypothetical in-dustrial onshore facility, using its CFD Gas Dispersion Model in COMSOL as shown in Figure 2. The aim of this particular exercise is to demonstrate how the model can be used to locate fixed stationary gas detection sensors at a facility. The source of the release is a 10m high vessel. The computational volume has a footprint of 400m by 400m and the wind profile is logarithmic with height set at an angle of 30° from the X-axis anti-clockwise. In total, six (6) fixed gas detection sensors were located both upstream and downstream of the point of release as shown in Figure 3. In this particular example, the issue of concern is the concentration of methane in air that could provoke an explosion, if ignited. Therefore HazRes is interested in both the Lower Explosive Limit percentage for methane in air (LEL%) which is 5% (i.e. 50,000ppm) and 50% LEL which is 2.5% (i.e. 25,000ppm), purely as a safety factor. Figure 4 shows the predicted methane concentration levels as a function of time for each of the six (6) fixed gas detector sensors.

Case 1: Exhaust Stacks near a Hill HazRes has used its CFD Gas Dispersion model in COMSOL to model a Carbon Dioxide (CO2) rich exhaust plume from three (3) different height and diameter exhaust stacks at the base of a hypothetical hill. The three (3) exhaust stacks measure 25m, 50m and 100m in height. The computational volume has a footprint of 2km by 2km and the wind profile was logarithmic with height in a direction prevalent to the inclination of the hill. HazRes conducted a transient time-dependent analysis on the exhaust gas release in order to determine the cloud spread, extent and possible touchdown (cloud touches the ground) as a function of time. The time-dependent results are shown in Figure 1 of iso-concentration plots from the three (3) exhaust stack gas cloud dispersions.

Introduction The prediction of an accidental gas release, whether toxic or flammable, in terms of people, assets and production is vitally important in terms of reducing the impact from such a Major Accidental Hazard (MAH). When conducting consequence analysis of gas releases, integral models are widely used. Geometrically complex scenarios (e.g. buildings, structures, process units, towers etc) and non-flat terrain (e.g. hills, inclines, descents etc) make integral models inaccurate and require more rigorous calculation Methods, such as Computational Fluid Dynamic (CFD) simulations, in order to obtain more accurate estimates of the dispersed cloud extent and its effect. Model Description & Validations HazRes’ CFD Gas Dispersion Model, using COMSOL, is a three-dimensional (3D) model adapted to simulate atmospheric airflow and dispersion simulation. The model and solver provide simulations based on the Eulerian approach, utilizing an un-structured grid, finite element method to model atmospheric air flow and dispersion at full scale and fine resolution. It also has the ability to model the interaction with complex terrain and obstacles using the k-epsilon turbulence closure model. HazRes’ Model has been validated against both experimental results as well as an industry standard integral model for which it is in good agreement. Discussion & Conclusions It is believed that the results presented demonstrate the capability of HazRes’ CFD Gas Dispersion model, solved using COMSOL Multi-Physics, and its capability to perform both stationary and transient time-dependent analyses of flammable and toxic gas releases over large geographic areas, complex terrains and structures.

1

2

3

4

5

6

Numbers show locations of different sensors

Wind

Dire

ction

30°

X-Axis

1

2

3

4

5

6

Numbers show locations of different sensors

Wind

Dire

ction

30°

X-Axis

Wind

Dire

ction

30°

X-Axis

Figure 3. Plan View of Onshore Facility showing Locations of the Six Fixed Gas Detector Sensors.

0

5,000

10,000

15,000

20,000

25,000

30,000

35,000

40,000

45,000

50,000

0 100 200 300 400 500

Time [s]

Co

nc

en

tra

tio

n [

pp

m]

LEL

50% LEL

Sensor Target 1

Sensor Target 2

Sensor Target 3

Sensor Target 4

Sensor Target 5

Source Target 6

Approximate Calculated Time to 50% LEL

Sensor Target 1 = Does Not Reach 50% LELSensor Target 2 = < 20 secondsSensor Target 3 = 50 secondsSensor Target 4 = 40 secondsSensor Target 5 = 100 secondsSensor Target 6 = 200 seconds

Figure 4. Predicted Methane Concentration Levels as a Func-tion of Time for each of the Six Fixed Gas Detector Sensors.

Source of ReleaseSource of Release

Figure 2. Computation Volume Model in COMSOL of Industrial

Site and Source of Release

Case 3: Onshore CO Release Using the same computational model, wind direction & wind profile as Case 2, HazRes has simulated a single release of Carbon Monoxide (CO) rich gas from the top of the same gas holder location.

Figure 5: 2D Slice Plot at 3m Height Showing CO Dispersion as a

Function of Time.

HazRes used its CFD Gas Dispersion model to conduct a transient time-dependent analysis on the CO release relative to a target CO concentration which corresponds to significant Carboxyhemoglobin (COHb) level. Some results of the transient CO gas discharge and dispersion analysis can be seen in Figure 5 for 10 to 100 seconds from the start of release.

Figure 1. Iso-Concentration Plots showing Exhaust Stack Gas

Dispersion with Time including Cloud Touchdown.

Presented at the COMSOL Conference 2009 Milan