large-scale movements and high-use areas of western … movements and high-use areas of western...
TRANSCRIPT

Large-scale movements and high-use areas ofwestern Pacific leatherback turtles, Dermochelys coriacea
SCOTT R. BENSON,1,� TOMOHARU EGUCHI,2 DAVE G. FOLEY,3 KARIN A. FORNEY,4 HELEN BAILEY,5
CREUSA HITIPEUW,6 BETUEL P. SAMBER,7 RICARDO F. TAPILATU,8 VAGI REI,9 PETER RAMOHIA,10
JOHN PITA,10 AND PETER H. DUTTON2
1Protected Resources Division, Southwest Fisheries Science Center, National Marine Fisheries Service, National Oceanic andAtmospheric Administration, Moss Landing, California 95039 USA
2Protected Resources Division, Southwest Fisheries Science Center, National Marine Fisheries Service, National Oceanic andAtmospheric Administration, La Jolla, California 92037 USA
3Environmental Research Division, Southwest Fisheries Science Center, National Marine Fisheries Service, National Oceanic andAtmospheric Administration, Pacific Grove, California 93950 USA
4Protected Resources Division, Southwest Fisheries Science Center, National Marine Fisheries Service, National Oceanic andAtmospheric Administration, Santa Cruz, California 95060 USA
5Chesapeake Biological Laboratory, University of Maryland Center for Environmental Science, Solomons, Maryland 20688 USA6World Wide Fund for Nature-Indonesia, Kawasan Mega Kuningan Jakarta 12950 Indonesia
7Natural Resources Conservation Office Papua Barat, Forestry Department, Sorong, Papua Barat Province, Indonesia8Marine Laboratory, The State University of Papua, Manokwari, 98314 Papua Barat Province, Indonesia
9Office of Environment and Conservation, Boroko, National Capital District, Papua New Guinea10The Nature Conservancy, Honiara, Solomon Islands
Citation: Benson, S. R., T. Eguchi, D. G. Foley, K. A. Forney, H. Bailey, C. Hitipeuw, B. P. Samber, R. F. Tapilatu, V. Rei, P.
Ramohia, J. Pita, and P. H. Dutton. 2011. Large-scale movements and high-use areas of western Pacific leatherback
turtles, Dermochelys coriacea. Ecosphere 2(7):art84. doi:10.1890/ES11-00053.1
Abstract. The western Pacific leatherback turtle (Dermochelys coriacea), one of three genetically distinct
stocks in the Indo-Pacific region, has declined markedly during past decades. This metapopulation nests
year-round at beaches of several western Pacific island nations and has been documented through genetic
analysis and telemetry studies to occur in multiple regions of the Pacific Ocean. To provide a large-scale
perspective of their movements, high-use areas, and habitat associations, we report and synthesize results
of 126 satellite telemetry deployments conducted on leatherbacks at western Pacific nesting beaches and at
one eastern Pacific foraging ground during 2000–2007. A Bayesian switching state-space model was
applied to raw Argos-acquired surface locations to estimate daily positions and behavioral mode (either
transiting or area-restricted search) for each turtle. Monthly areas of high use were identified for post-
nesting periods using kernel density estimation. There was a clear separation of migratory destinations for
boreal summer vs. boreal winter nesters. Leatherbacks that nested during boreal summer moved into
Large Marine Ecosystems (LMEs) of the temperate North Pacific Ocean or into tropical waters of the South
China Sea. Turtles that nested during boreal winter moved into temperate and tropical LMEs of the
southern hemisphere. Area-restricted search occurred in temperate and tropical waters at diverse pelagic
and coastal regions exhibiting a wide range of oceanographic features, including mesoscale eddies, coastal
retention areas, current boundaries, or stationary fronts, all of which are known mechanisms for
aggregating leatherback prey. Use of the most distant and temperate foraging ground, the California
Current LME, required a 10–12 month trans-Pacific migration and commonly involved multiple years of
migrating between high-latitude summer foraging grounds and low-latitude eastern tropical Pacific
wintering areas without returning to western Pacific nesting beaches. In contrast, tropical foraging
destinations were reached within 5–7 months and appeared to support year-round foraging, potentially
allowing a more rapid return to nesting beaches. Based on these observations, we hypothesize that
demographic differences are likely among nesting females using different LMEs of the Indo-Pacific. The
differences in movements and foraging strategies underscore the importance of and the need for
ecosystem-based management and coordinated Pacific-wide conservation efforts.
//Xinet/production/e/ecsp/live_jobs/ecsp-02-07/ecsp-02-07-09/layouts/ecsp-02-07-09.3d � Tuesday, 26 July 2011 � 12:08 pm � Allen Press, Inc. � Page 1 ECSP ES11-00053R2 Benson
v www.esajournals.org 1 July 2011 v Volume 2(7) v Article 84
Key words: California, USA; Dermochelys coriacea; foraging habitat; Indo-Pacific; movements; Papua Barat Indonesia;
Papua New Guinea; satellite telemetry; seasonality; Solomon Islands; state-space model; western Pacific leatherback.
Received 1 March 2011; revised 21 June 2011; accepted 23 June 2011; published 27 July 2011. Corresponding Editor: S.
Rands.
Copyright: � 2011 Benson et al. This is an open-access article distributed under the terms of the Creative Commons
Attribution License, which permits restricted use, distribution, and reproduction in any medium, provided the original
author and sources are credited.
� E-mail: [email protected]
INTRODUCTION
The conservation of wide-ranging marinespecies has recently received increasing attentionas awareness has grown that anthropogenicactivities are affecting species far away fromcoastal areas (Hyrenbach et al. 2000, Ferraroli etal. 2004, Lewison et al. 2004, Halpern et al. 2008).Telemetry studies have provided insight into themovements of diverse marine predators includ-ing sharks, tunas, pinnipeds, whales, seabirds,and turtles (Shaffer et al. 2006, Bailey et al. 2009,Walli et al. 2009, Jorgensen et al. 2010, Simmonset al. 2010, Witt et al. 2011). In some cases, theresults of such studies have contributed to thedevelopment of conservation strategies (e.g.,Howell et al. 2008).
Leatherback turtles (Dermochelys coriacea) arefound worldwide in pelagic and neritic waters oftemperate and tropical regions. Their large rangeand extensive movements spanning entire oceanbasins and national waters of many countries hascomplicated conservation and management ef-forts that are largely local or national in nature(Dutton and Squires 2008). Primary threats haveincluded intentional harvest and habitat degra-dation at nesting beaches and incidental catch incoastal and pelagic fisheries (Suarez and Starbird1996, Spotila et al. 2000, Dutton et al. 2007,Hitipeuw et al. 2007). Effective conservationefforts require a combination of protection ofleatherback turtles at nesting beaches and knowl-edge of at-sea movement patterns and areas ofhigh use (Benson et al. 2007b, Shillinger et al.2008). This is particularly important for Pacificleatherback turtles, which are Critically Endan-gered (Sarti Martinez 2000) and have experiencedsevere declines at several nesting beaches duringthe past two decades (Crowder 2000, Spotila etal. 2000). Genetic studies (Dutton et al. 1999,2007) have identified three distinct stocks of
leatherback turtles in the Pacific: (1) an easternPacific stock that nests primarily in Mexico andCosta Rica, (2) a western Pacific stock that isknown to nest in Papua Barat, Indonesia (PBI),Papua New Guinea (PNG), Solomon Islands (SI),and Vanuatu, and (3) a Malaysian stock. Themost dramatic declines have been well-docu-mented in the eastern Pacific (Spotila et al. 1996,2000) and in Malaysia, where the population isnow considered functionally extinct (Chan andLiew 1996). Less severe declines at westernPacific beaches have been inferred from recentnesting counts and anecdotal reports by nearbyvillagers (Hitipeuw et al. 2007).
Eastern Pacific leatherback turtles nest duringthe boreal winter (December–March), and post-nesting movements have been documented frombeaches in Mexico and Costa Rica to pelagicwaters of the eastern South Pacific (Eckert andSarti 1997, Shillinger et al. 2008). In contrast,western Pacific leatherback turtles form a diversemetapopulation that nests year-round at beachesscattered across several western Pacific islandnations and has been documented throughgenetic analysis and telemetry studies to occurin multiple regions of the Pacific, includingwaters of the eastern and central North Pacific,the western South Pacific, the South China Sea,and the Sea of Japan (Dutton et al. 2000, 2007,Benson et al. 2007a, c). Linkages have not yetbeen established between other areas of the Indo-Pacific region where leatherback turtles areknown to occur (e.g., Kei Island, Indonesia;Suarez and Starbird 1996) or waters off bothcoasts of Australia (Robins et al. 2002, Limpus2009). The objective of this study is to synthesizeresults of telemetry deployments conductedduring 2000–2007 on leatherback turtles atmultiple western Pacific nesting beaches andone northeastern Pacific foraging ground, toprovide a large-scale perspective of movements,
//Xinet/production/e/ecsp/live_jobs/ecsp-02-07/ecsp-02-07-09/layouts/ecsp-02-07-09.3d � Tuesday, 26 July 2011 � 12:08 pm � Allen Press, Inc. � Page 2 ECSP ES11-00053R2 Benson
v www.esajournals.org 2 July 2011 v Volume 2(7) v Article 84
BENSON ET AL.

high-use areas, and habitat associations of thewestern Pacific metapopulation. Nesting beachdeployments were conducted during both theboreal winter (December–February, henceforth‘Winter’) and the boreal summer (July–August;‘Summer’) to provide information on year-roundmovement patterns of this leatherback turtlemetapopulation. The comprehensive nature ofthis study is intended to provide a broadecological context in support of conservationand management of this species.
MATERIALS AND METHODS
Field methodsWe selected tagging locations and dates based
on knowledge of reliable occurrence of nesting orforaging leatherback turtles. Telemetry deploy-ments at nesting beaches included two beachesalong the northern Bird’s Head coast in PBI(Jamursba-Medi, 08210 S, 1328330 E; Wermon;08260 S, 1328500 E), two beaches in the Huon Gulfof PNG (Kamiali Wildlife Management Area,78160 S, 147880 E; and Maus Buang, 68540 S,1468570 E), and three beaches in SI (Sasakolo,Santa Isabel Island, 78480 S, 1588410 E; Litogha-hira, Santa Isabel Island, 78540 S, 1588480 E;Baniata, Rendova Island, 88380 S, 1578150 E).Deployments were concentrated after the peak ofeach nesting season to maximize the amount ofpost-nesting movement data. We also conductedat-sea captures and telemetry deployments inneritic waters of Monterey Bay and San MateoCounty, California, USA (approximately 378 N,1228 W). Between 2000 and 2007, we deployed atotal of 89 tags at nesting beaches and 37 at theforaging grounds (Table 1).
We deployed a variety of satellite-linkedtransmitters on leatherback turtles during thestudy period, including the following platformtransmitter terminals (PTT) models: WildlifeComputers (Washington, USA) SDR-SSC3 (n ¼21), MK10 (n¼11), SDR-T16 (n¼9), SPLASH (n¼7), SPOT2 (n¼ 1), SPOT3 (n¼ 3), and SPOT5 (n¼3); Telonics (Arizona, USA) ST14 (n¼ 2), ST18 (n¼ 3) and ST20 (n ¼ 14); Sirtrack (New Zealand)Kiwisat 101 (n¼ 23); and Sea Mammal ResearchUnit (SMRU, U.K.) Satellite Relay Data Logger(SRDL) (n ¼ 29). All PTTs featured a salt-waterswitch that suppressed transmission while sub-merged and were duty-cycled to optimize
battery life, reporting positions via the Argossystem every 1–3 d.
We attached PTTs to leatherback turtles withthe aid of a flexible harness (Eckert and Eckert1986) that consisted of soft nylon webbing withflexible polyvinyl tubing over the shoulder strapsand a corrodible pin designed to release theharness within 18–24 months. Before attachingtransmitters we visually assessed each turtle forsigns of injury or compromised health and onlyselected turtles that appeared to be in normalcondition. To minimize impacts on nestingfemales, we waited until turtles began layingeggs, well into the nesting process when femalesenter a trance-like state, before sampling andattaching the transmitters. At the Californiaforaging grounds, we located male and femaleleatherback turtles with the aid of a spotteraircraft and captured them from a boat using aspecially designed break-away hoop. Our prima-ry capture boat was a 9-m aluminum Munson,which featured a custom made bowsprit thatprovided a platform for deploying the hoopnetas well as a retractable bow that when lowered tothe waterline provided access to the capturedturtles and a slide for pulling them on board.Once the turtle was on board, we measuredcurved carapace length (CCL) and width (CCW),applied PIT and flipper tags (Dutton andMcDonald 1994, Bolten 1999), and attached theharness.
Analytical methodsState-space model.—We applied a Bayesian
switching state-space model (SSSM) to all of theraw Argos-acquired surface locations for each ofthe leatherback turtle tracks to obtain dailyposition estimates. The SSSM is a time-seriesmodel that accounts for Argos errors andestimates at regular time intervals the most likelytrue location and the animal’s behavior (Jonsen etal. 2005, Bailey et al. 2008, Patterson et al. 2008).This method couples two models, the measure-ment and transition equations. The measurementequation accounts for the errors in the observedsatellite locations, indicated by the Argos loca-tion quality classes and based on publishedestimates (Vincent et al. 2002). The transitionequation is based on a correlated random walkmodel and includes a process model for each oftwo behavioral modes (Jonsen et al. 2005). The
//Xinet/production/e/ecsp/live_jobs/ecsp-02-07/ecsp-02-07-09/layouts/ecsp-02-07-09.3d � Tuesday, 26 July 2011 � 12:08 pm � Allen Press, Inc. � Page 3 ECSP ES11-00053R2 Benson
v www.esajournals.org 3 July 2011 v Volume 2(7) v Article 84
BENSON ET AL.

transition equation was specified as (Jonsen et al.2007):
dt ; N2½cbtTðhbt
Þdt�1;R� ð1Þ
where dt-1 is the distance between the locationsxt-1 and xt-2 and dt is the difference between xtand xt�1. N2 is a bivariate Gaussian distributionwith covariance matrix R that represents therandomness in the animal’s behavior (Breed et al.2009). The parameter c is the autocorrelation inspeed and direction, ranging from 0 to 1. T(h) is atransition matrix that provides the rotation
required to move from dt�1 to dt, where h is themean turning angle. The index bt denotes thebehavioral mode, where mode 1 is considered torepresent transiting or migration, and mode 2 isindicative of inter-nesting, foraging or area-restricted search behavior (Bailey et al. 2008,2009). Area-restricted search (ARS) is based onthe hypothesis that once an animal encountersprey, it will remain within the area by increasingits turning angle and/or decreasing its speed(Kareiva and Odell 1987). We specified priordistributions on the parameters in the model
Table 1. Summary of telemetry deployments by location and deployment group, 2000–2007.
Metric 2000 2001 2002 2003 2004 2005 2006 2007 Total
Foraging (n ¼ 37)CCANo. deployments 2 2 8 6 7 5 . . . 7 37Durations (days)Mean 252 72 288 245 318 98 . . . 327 255SD 286 55 219 124 212 75 . . . 46 172Min 49 33 65 96 46 47 . . . 268 33Max 454 111 769 463 648 225 . . . 416 769
Summer nesting (n ¼ 44)PBI-JNo. deployments . . . . . . . . . 9 2 11 3 14 39Durations (days)Mean . . . . . . . . . 241 84 293 304 266 261SD . . . . . . . . . 167 103 222 36 165 175Min . . . . . . . . . 79 11 9 272 10 9Max . . . . . . . . . 639 157 531 343 520 639
PBI-WNo. deployments . . . . . . . . . . . . . . . . . . 5 . . . 5Durations (days)Mean . . . . . . . . . . . . . . . . . . 327 . . . 327SD . . . . . . . . . . . . . . . . . . 207 . . . 207Min . . . . . . . . . . . . . . . . . . 69 . . . 69Max . . . . . . . . . . . . . . . . . . 645 . . . 645
Winter nesting (n ¼ 45)PBI-WNo. deployments . . . . . . . . . . . . . . . 13 . . . 5 18Durations (days)Mean . . . . . . . . . . . . . . . 210 . . . 323 241SD . . . . . . . . . . . . . . . 103 . . . 28 102Min . . . . . . . . . . . . . . . 62 . . . 294 62Max . . . . . . . . . . . . . . . 346 . . . 360 360
PNGNo. deployments . . . 7 . . . 9 . . . 1 . . . . . . 17Durations (days)Mean . . . 62 . . . 71 . . . 10 . . . . . . 64SD . . . 43 . . . 72 . . . n/a . . . . . . 59Min . . . 9 . . . 5 . . . n/a . . . . . . 5Max . . . 110 . . . 241 . . . n/a . . . . . . 241
SINo. deployments . . . . . . . . . . . . . . . . . . 10 . . . 10Durations (days)Mean . . . . . . . . . . . . . . . . . . 271 . . . 271SD . . . . . . . . . . . . . . . . . . 155 . . . 155Min . . . . . . . . . . . . . . . . . . 28 . . . 28Max . . . . . . . . . . . . . . . . . . 503 . . . 503
Notes: CCA ¼ Central California, USA; PBI-J ¼ Papua Barat, Indonesia (Jamursba-Medi); PBI-W ¼ Papua Barat, Indonesia(Wermon); PNG¼ Papua New Guinea; SI ¼ Solomon Islands. See text and Fig. 1 for location details. Mean durations are thenumber of days with positions derived from the state-space model. ‘‘. . .’’ indicates no data.
//Xinet/production/e/ecsp/live_jobs/ecsp-02-07/ecsp-02-07-09/layouts/ecsp-02-07-09.3d � Tuesday, 26 July 2011 � 12:08 pm � Allen Press, Inc. � Page 4 ECSP ES11-00053R2 Benson
v www.esajournals.org 4 July 2011 v Volume 2(7) v Article 84
BENSON ET AL.

assuming that during migration turn anglesshould be closer to 0 and autocorrelation inspeed and direction should be higher than whenforaging (Jonsen et al. 2007).
We ran the model using the R softwarepackage (R Development Core Team 2008) andWinBUGS software (Lunn et al. 2000). We rantwo chains in parallel, each for a total of 20,000Markov Chain Monte Carlo samples, with thefirst 15,000 discarded as a burn-in and theremaining samples thinned, retaining every tenthsample to reduce autocorrelation. Thus, posteriordistributions for each parameter were based on500 samples from each chain, giving a total of1000 independent samples. When there were 20or more days of missing satellite positions, weremoved the corresponding SSSM positions anddivided the track into sections, as the error in theSSSM mean positions increases rapidly whenthere are such large data gaps (Bailey et al. 2008).‘Effective transmission durations’ for each trackwere defined as the total number of dailypositions estimated from the SSSM. From themodel output we obtained the mean positionestimates, their 95% credible limits (a measure ofuncertainty), and posterior distributions of be-havioral mode at daily intervals.
In a previous study of leatherback turtlebehavior derived from satellite telemetry data,Jonsen et al. (2007) classified mean behavioralmodes below 1.25 as transiting and valuesgreater than 1.75 as foraging or inter-nestingbehavior. Values between 1.25 and 1.75 wereclassified as uncertain. In this study, rather thandiscarding locations with intermediate values,we used the posterior distribution of behavioralmode for each daily location to compute a dailyprobability of transit (Ptran). This is similar to theapproach of Jonsen et al. (2005) and Bailey et al.(2008), but provides a probability of transit toinfer transiting or foraging/inter-nesting behav-ior. Locations with a probability of transit lessthan or equal to 0.5 (Ptran � 0.5) were consideredto represent ARS behavior, whereas locationswith Ptran . 0.5 were considered to indicatetransiting behavior.
Kernel density estimation.—We used kerneldensity estimation (KDE) to identify areas ofhigh use and examined temporal patterns basedon further stratification of the data. We initiallyscrutinized the locations determined by the state-
space models to separate inter-nesting and non-nesting periods for those transmitters deployedat nesting beaches. We determined high-useareas near nesting beaches by computing a kerneldensity for periods representing inter-nestingdata, whereas for ARS and transit behavior weexcluded inter-nesting periods. For all KDEanalyses, resolutions and bandwidths were se-lected by trial and error, starting from the valuesgiven by the Normal Reference Rule (Scott 1992).Because of the sparse data points in some areas, itwas not possible to estimate these parameters foreach location. We used the same value for allareas, which allowed us to compare the spatialspread of the estimated density among locationswithout the influence of different parametervalues. The selected combinations providedsmooth contours at the spatial scales of interestwithout locally manipulating the parameters. Forthe inter-nesting periods, we separated locationsinto summer and winter nesting according to thedeployment records (Table 1), and we used aresolution of 0.05 degrees in latitude andlongitude and a bandwidth of 0.3 degrees. Forperiods of transit or ARS behavior, whichspanned a much broader geographic area, weused a resolution of 0.5 degrees in latitude andlongitude and a bandwidth of 1.5 degrees inlatitude and longitude. To determine temporalchanges in the distributions of leatherback turtlesthroughout the Pacific, we divided locationsoutside of inter-nesting periods into 12 temporalstrata of 30 or 31 d, roughly corresponding tocalendar months. Within each temporal stratum,we categorized data and KDE results as ARS ortransit behavior according to the probability oftransit described previously.
Characterization of habitat use.—We obtained asuite of habitat variables that have previouslybeen linked to the distribution of marine turtles(e.g., Polovina et al. 2000, 2001, 2004, Shillinger etal. 2008), including bathymetric depth, seasurface temperature (SST), Chlorophyll-a con-centration (CHL), sea surface height (SSH)variation (as measured by SSH root-mean-square, SSHrms), eddy kinetic energy (EKE),and Ekman pumping (EKP). We averagedPathfinder version 5 SST (Kilpatrick et al. 2001)and CHL from the Moderate Resolution ImagingSpectrometer (MODIS) (O’Reilly et al. 2000)within the 95% credible limits for each daily
//Xinet/production/e/ecsp/live_jobs/ecsp-02-07/ecsp-02-07-09/layouts/ecsp-02-07-09.3d � Tuesday, 26 July 2011 � 12:08 pm � Allen Press, Inc. � Page 5 ECSP ES11-00053R2 Benson
v www.esajournals.org 5 July 2011 v Volume 2(7) v Article 84
BENSON ET AL.
position from the SSSM using an 8-d temporalcomposite centered on the position’s date. De-rived variables included SSHrms, calculatedfrom the Archiving, Validation and Interpreta-tion of Satellite Oceanographic Data (AVISO)SSH data located within a 2 3 2 degree boxaround the estimated daily position, and EKE,calculated as 1/2(U2þV2), where U and V aremeridional and zonal geostrophic current com-ponents, respectively (Ducet et al. 2000). We alsoestimated EKP, a measure of wind-driven up-welling, from wind stress following the methodof Xie and Hsieh (1995).
To identify habitat variables that are associatedwith ARS behavior within each region of interest
(see Results and Fig. 1), we examined whethermean values of each variable differed forlocations with transit behavior vs. ARS behaviorusing a two-sample permutation test (Efron andTibshirani 1993). This type of test is free of manyof assumptions associated with parametric tests,and provides a simple method for evaluating thesignificance of patterns within the data. Wecreated permutation samples of all locationswithin each region (n ¼ 10,000) by randomlyshuffling the values of Ptran among all availablelocations. We then computed the mean value foreach habitat variable for the permuted ARSlocations to provide a distribution of the expect-ed means if ARS behavior occurred randomly
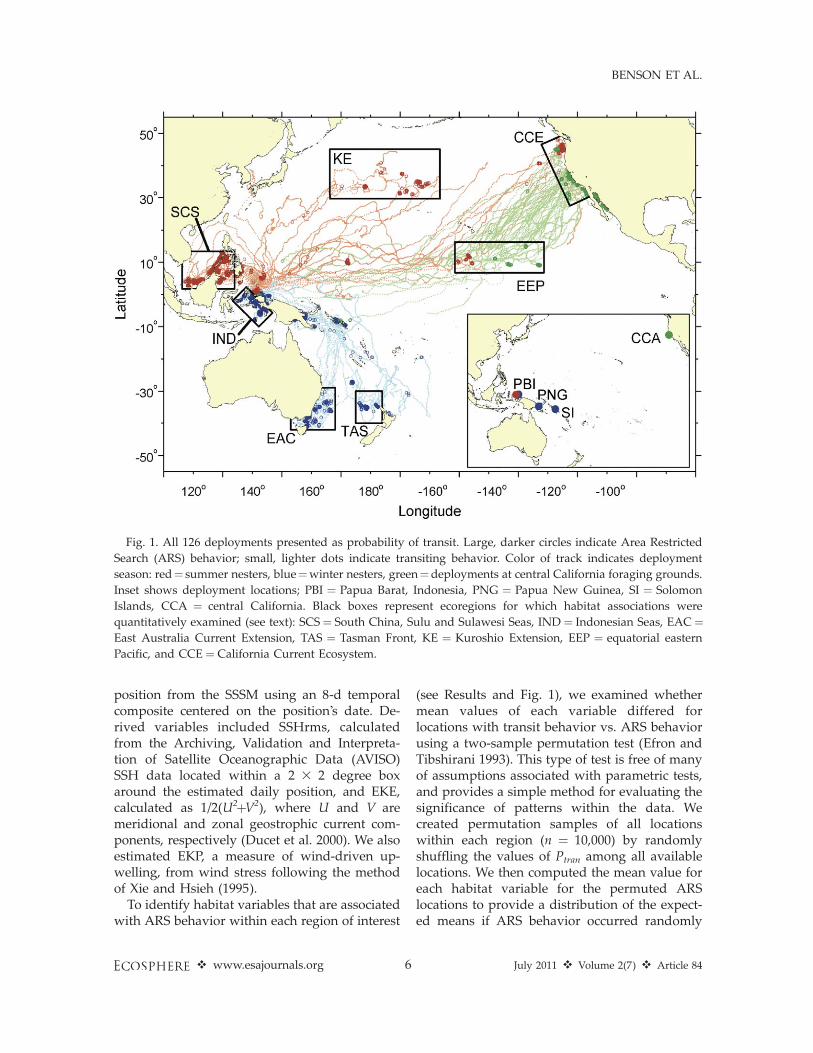
Fig. 1. All 126 deployments presented as probability of transit. Large, darker circles indicate Area Restricted
Search (ARS) behavior; small, lighter dots indicate transiting behavior. Color of track indicates deployment
season: red¼ summer nesters, blue¼winter nesters, green¼deployments at central California foraging grounds.
Inset shows deployment locations; PBI ¼ Papua Barat, Indonesia, PNG ¼ Papua New Guinea, SI ¼ Solomon
Islands, CCA ¼ central California. Black boxes represent ecoregions for which habitat associations were
quantitatively examined (see text): SCS¼ South China, Sulu and Sulawesi Seas, IND¼ Indonesian Seas, EAC¼East Australia Current Extension, TAS ¼ Tasman Front, KE ¼ Kuroshio Extension, EEP ¼ equatorial eastern
Pacific, and CCE ¼ California Current Ecosystem.
//Xinet/production/e/ecsp/live_jobs/ecsp-02-07/ecsp-02-07-09/layouts/ecsp-02-07-09.3d � Tuesday, 26 July 2011 � 12:08 pm � Allen Press, Inc. � Page 6 ECSP ES11-00053R2 Benson
v www.esajournals.org 6 July 2011 v Volume 2(7) v Article 84
BENSON ET AL.

among all available locations. The achievedsignificance level (ASL), defined as the probabil-ity of obtaining an outcome at least as extreme asthe actual value, was estimated from the percen-tiles of the distribution of permuted means. AnASL of P ¼ 0.05 provides reasonably strongevidence of a significantly non-random associa-tion of ARS behavior with respect to each habitatvariable, while an ASL of P¼ 0.01 provides verystrong evidence and P ¼ 0.10 provides weakevidence (Efron and Tibshirani 1993). We plottedthe permuted distributions, mean values for ARSlocations in the actual tracks, and ASL valuestogether by region and variable to show whetherARS behavior was associated with high or lowvalues of each variable of interest.
RESULTS
Telemetry resultsWe tagged similar numbers of leatherbacks
during boreal winter nesting (n ¼ 45), borealsummer nesting (n ¼ 44), and boreal summerforaging periods (n ¼ 37). Our summer deploy-ments of PBI post-nesters occurred during July2003, 2005–2007, and August 2004 at Jamursba-Medi (n¼ 39) and during July 2006 at Wermon (n¼ 5). Our winter post-nesting deployments wereconducted during December 2001, February2003, and January 2005 in PNG (n ¼ 17), duringFebruary 2005 and January 2007 at Wermon, PBI(n¼ 18), and during December 2006 at SI (n¼ 10).PTT deployments from foraging grounds offcentral California occurred during August–Sep-tember 2000–2005 and 2007 and included 27females and 10 males. The 126 PTT deploymentsyielded transmission durations of 4 to 946 d,although data gaps and intermittent reportingresulted in shorter effective transmission dura-tions. In some cases, including the longestdeployment, there were transmission gaps last-ing from several days to over one year, presum-ably because of biofouling on the PTT’s saltwaterswitch. The switching state-space model param-eters (Table 2) were similar to those previouslyreported for eastern Pacific and Atlantic leather-backs (Bailey et al. 2008), and effective transmis-sion durations ranged from 9 to 645 d with amean duration of 269 d for boreal summer post-nesters, 5 to 503 d with a mean duration of 181 dfor boreal winter post-nesters, and 33 to 769 d
with a mean duration of 255 d for deploymentsat the California foraging grounds (Table 1).Combined, the tracks spanned large areasthroughout the Pacific Ocean basin (Fig. 1).
Leatherback movementsInter-nesting movements.—Although this study
focused on post-nesting movements and high-use areas, we were also able to obtain some dataon inter-nesting movements. Movements offemale turtles immediately following PTT de-ployment at the nesting beaches were concen-trated in waters adjacent to the beaches asindividuals returned to lay additional clutchesduring the inter-nesting period (Fig. 2). Summernesters at PBI primarily remained within 170–315km of the nesting beaches, in waters betweennorthwest Bird’s Head Peninsula and the RajaAmpat Islands, while PBI winter nesters spentinter-nesting intervals between the northeasterncoast of Bird’s Head Peninsula and CenderawasihBay, within about 120–300 km of the nestingbeach. Inter-nesting activity in PNG was mostlylimited to the Huon Gulf, and turtles remainedwithin 140–300 km of the nesting beach. Move-ments of SI leatherbacks were concentratedaround Santa Isabel and Malaita Islands, andturtles traveled slightly farther from the nestingbeaches (about 200–400 km). Upon completion ofnesting activity, movements away from thebeaches were diverse and differed notably bynesting season.
Post-nesting movements.—Among the PBI sum-mer nesters with tracks of sufficient duration to
Table 2. Mean (and standard error) posterior quantiles
for the switching state-space model parameters,
based on n ¼ 126 leatherback telemetry tracks.
Parameter
Posterior quantiles
0.025 0.500 0.975
h1 �0.198 (0.026) 0.014 (0.014) 0.223 (0.026)h2 2.222 (0.069) 3.241 (0.056) 4.268 (0.055)c1 0.711 (0.007) 0.784 (0.005) 0.850 (0.003)c2 0.291 (0.006) 0.477 (0.006) 0.669 (0.006)a1 0.770 (0.027) 0.909 (0.014) 0.987 (0.002)a2 0.055 (0.006) 0.338 (0.023) 0.671 (0.033)
Notes: h is the mean turning angle in radians, and c is theautocorrelation in speed and direction. The subscripts denotebehavioral mode 1 and mode 2. The parameter a estimates theprobability of switching between behavioral modes; a1 is theprobability of being in mode 1 at time t given it was also inthis mode at time t � 1, and a2 is the probability of being inmode 1 at time t given it was in mode 2 at t � 1.
//Xinet/production/e/ecsp/live_jobs/ecsp-02-07/ecsp-02-07-09/layouts/ecsp-02-07-09.3d � Tuesday, 26 July 2011 � 12:08 pm � Allen Press, Inc. � Page 7 ECSP ES11-00053R2 Benson
v www.esajournals.org 7 July 2011 v Volume 2(7) v Article 84
BENSON ET AL.

determine movement patterns (n¼ 37, Fig. 1), 23
(62%) initially moved east or northeastward
towards the North Pacific. Sixteen of these turtles
reached temperate North Pacific waters, ap-
proaching either the Kuroshio Extension region
(n ¼ 6) or the California Current Ecosystem (n ¼10), with 5 leatherbacks completing trans-Pacific
movements between the western Pacific and the
west coast of North America. Seven turtles had
tracks that were too short to identify specific
Fig. 2. High-use areas of western Pacific leatherbacks during inter-nesting periods, derived using kernel
density estimation (KDE) for 89 satellite telemetry tracks from nesting deployments. Warmer colors represent
greater KDE values. Locations are abbreviated as follows: PBI¼ Papua Barat, Indonesia (Bird’s Head Peninsula),
PNG ¼ Papua New Guinea, SI ¼ Solomon Islands, RA ¼ Raja Ampat Islands, CB ¼ Cenderawasih Bay, HG ¼Huon Gulf, IS ¼ Santa Isabel Island, RI ¼ Rendova Island, and MA ¼Malaita Island.
//Xinet/production/e/ecsp/live_jobs/ecsp-02-07/ecsp-02-07-09/layouts/ecsp-02-07-09.3d � Tuesday, 26 July 2011 � 12:08 pm � Allen Press, Inc. � Page 8 ECSP ES11-00053R2 Benson
v www.esajournals.org 8 July 2011 v Volume 2(7) v Article 84
BENSON ET AL.

destinations within the North Pacific region. Thesecond most frequent pattern (13 turtles, or 35%)involved westward movement to shelf regions ofthe South China Sea, adjacent to MalaysianBorneo and Palawan Island, Philippines. Accessto the South China Sea was primarily through theSulawesi and Sulu Seas (11 turtles), although twoindividuals entered the South China Sea from thenorth after passing through the Luzon Straitbetween Taiwan and the Philippines. One leath-erback (3%) traveled northward into the Sea ofJapan.
Among winter nesters, post-nesting move-ments (Fig. 1) of turtles tagged in PNG (n ¼ 17)and SI (n ¼ 10) were southward through theCoral Sea, into or approaching high-latitudewaters of the western South Pacific Ocean orTasman Sea. The only exception was one turtlefrom SI that moved westward through the CoralSea and remained in tropical waters of the Gulfof Papua until transmission ceased after 266 d.Winter nesters from PBI with sufficiently longtrack durations (n ¼ 17) exhibited two distinctmovement patterns. Eleven (65%) moved west-ward around Bird’s Head Peninsula and thensouth into the Halmahera, Ceram or Banda Seas,where they remained for weeks to months. Theremaining six animals (35%) moved along thenorth side of New Guinea and then southeastinto or approaching high latitude waters of thewestern South Pacific Ocean or Tasman Sea,similar to SI and PNG turtles.
Movements from California foraging grounds.—Movements of turtles captured and tagged atcentral California foraging areas were less di-verse (n¼ 37; Fig. 1). Following release, 33 turtles(89%) moved immediately southwest towardsthe equatorial eastern Pacific (EEP), althoughthree individuals (8%) initially moved northwardand spent time in other areas off California orOregon before moving towards the EEP. Inaddition, one male leatherback initially movedsouthwestward to about 268 N but then returnedto southern California before moving south alongBaja California, Mexico and into the Gulf ofCalifornia. Once turtles reached the EEP, therewere two dominant patterns of continued move-ment. Seven of the 25 turtles with tracks ofsufficient duration (28%) continued movingwestward, presumably towards western Pacificnesting beaches. Transmissions ceased prior to
arrival at nesting beaches for all except twoturtles, which nested at Santa Isabel Island (SI)the following May, and Jamursba-Medi (PBI) thefollowing July, respectively. The majority (17turtles, 72%), however, remained in the EEP forapproximately 2–3 months and then moved backtowards the California coast, typically arriving inthe southern California Bight during spring andtraveling nearshore as they approached thecentral California foraging areas from the south.
High-use post-nesting areasThe high-use post-nesting areas identified by
the KDE (Fig. 3) represent areas with greateroccurrence of ARS behavior by multiple taggedindividuals or by some individuals for prolongedperiods. The areas used represent diverse ecor-egions with varying oceanic processes, andleatherbacks associated with different suites ofhabitat features across all regions. To examine thehabitats and how leatherbacks use them, wedefined seven ecoregions of interest in whichARS was observed frequently (Fig. 1). Each willbe considered separately below to summarizeassociations between leatherbacks and regionalhabitat features, based on the permutation testresults (Fig. 4).
Two tropical ecoregions, the South China,Sulu, and Sulawesi Seas (SCS) and Indonesianseas (IND), were associated with year-round ARSbehavior that was highly concentrated in shallowwaters adjacent to islands (P , 0.001, Figs. 4–5).Within the SCS, ARS behavior occurred for 59%of the daily locations, associated with warmwater (P , 0.001), in lower EKP (downwelling, P, 0.001) and greater SSH variation (P ¼ 0.029).There was no significant association with respectto CHL or EKE. There were two primary ARSareas within the SCS, one along the northern andwestern coasts of Palawan Island and one on theshelf off northwestern Borneo (Fig. 5). Leather-backs engaged in ARS behavior off Palawanexhibited a seasonal shift (Fig. 3), arriving at thenorthern tip of Palawan Island (about 118 N and1198 E) in October–January, and then shiftingsouthward along the western coast from Junethrough September. In contrast, leatherbacksusing the shelf off Borneo remained in the samearea year-round. Some additional short-termARS behavior was identified during September–January in the western Sulawesi Sea off Borneo
//Xinet/production/e/ecsp/live_jobs/ecsp-02-07/ecsp-02-07-09/layouts/ecsp-02-07-09.3d � Tuesday, 26 July 2011 � 12:08 pm � Allen Press, Inc. � Page 9 ECSP ES11-00053R2 Benson
v www.esajournals.org 9 July 2011 v Volume 2(7) v Article 84
BENSON ET AL.
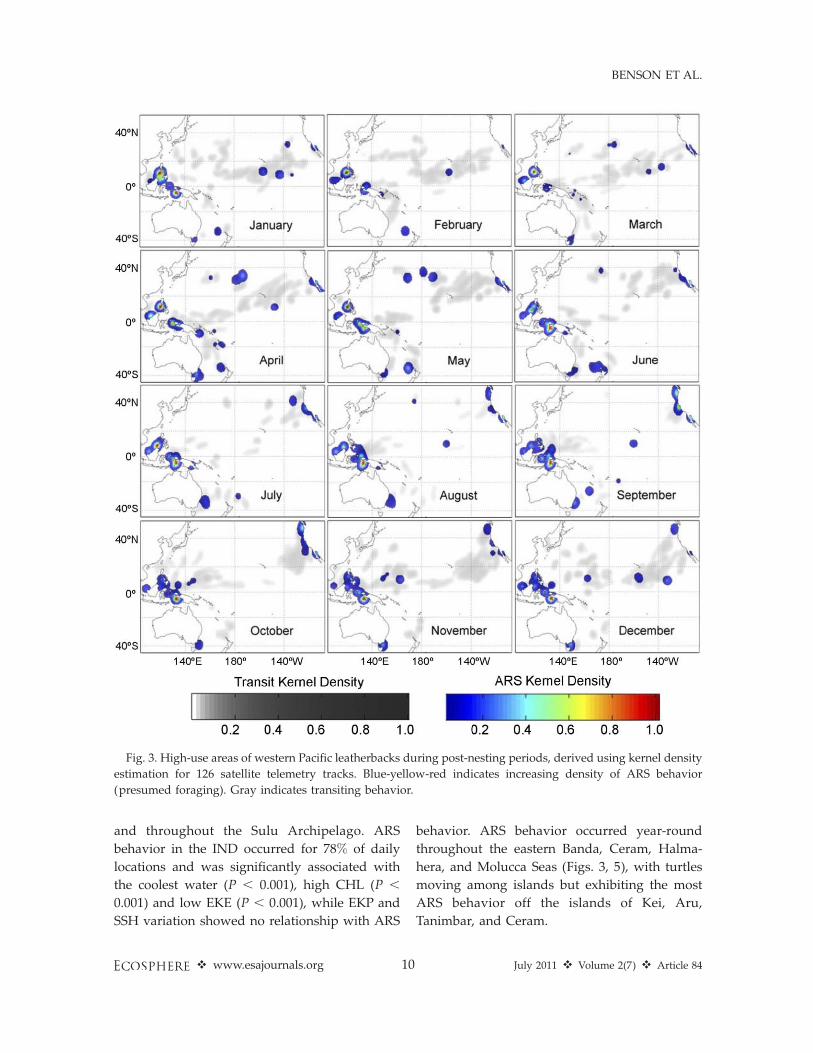
and throughout the Sulu Archipelago. ARS
behavior in the IND occurred for 78% of daily
locations and was significantly associated with
the coolest water (P , 0.001), high CHL (P ,
0.001) and low EKE (P , 0.001), while EKP and
SSH variation showed no relationship with ARS
behavior. ARS behavior occurred year-round
throughout the eastern Banda, Ceram, Halma-
hera, and Molucca Seas (Figs. 3, 5), with turtles
moving among islands but exhibiting the most
ARS behavior off the islands of Kei, Aru,
Tanimbar, and Ceram.
Fig. 3. High-use areas of western Pacific leatherbacks during post-nesting periods, derived using kernel density
estimation for 126 satellite telemetry tracks. Blue-yellow-red indicates increasing density of ARS behavior
(presumed foraging). Gray indicates transiting behavior.
//Xinet/production/e/ecsp/live_jobs/ecsp-02-07/ecsp-02-07-09/layouts/ecsp-02-07-09.3d � Tuesday, 26 July 2011 � 12:08 pm � Allen Press, Inc. � Page 10 ECSP ES11-00053R2 Benson
v www.esajournals.org 10 July 2011 v Volume 2(7) v Article 84
BENSON ET AL.

Four ecoregions were occupied seasonally byleatherbacks exhibiting ARS behavior, includingone tropical region (EEP) and three temperateregions: the California Current Ecosystem (CCE),the East Australian Current Extension (EAC),
and the Tasman Front (TAS). Within the CCE,ARS behavior occurred in habitats that were cool,shallow, and characterized by high CHL, highEKP, and low EKE (P , 0.001 for all habitatvariables, Fig. 4). SSH variation was only weakly
Fig. 4. Results of randomization tests for turtle locations within each ecoregion. Histograms represent means
for random ARS behavior; triangles indicate means for actual ARS locations. See text for abbreviations for
ecoregions and oceanographic variables.
//Xinet/production/e/ecsp/live_jobs/ecsp-02-07/ecsp-02-07-09/layouts/ecsp-02-07-09.3d � Tuesday, 26 July 2011 � 12:08 pm � Allen Press, Inc. � Page 11 ECSP ES11-00053R2 Benson
v www.esajournals.org 11 July 2011 v Volume 2(7) v Article 84
BENSON ET AL.

associated with ARS behavior (P¼ 0.059) (Fig. 4).Seasonality was pronounced, with leatherbacksarriving in April–July and engaging in ARSbehavior 21% of the time off California, Oregon,and Washington (USA) through late November.After departing these ARS areas, leatherbacksmoved directly southwestwards into waters ofthe EEP, which they occupied seasonally fromabout December through April, until they eitherreturned northeastward to the CCE or continuedwestwards towards nesting beaches. Within theEEP, less ARS behavior was identified (only 6%of daily locations), and it was associated withhabitats characterized by low EKE (P ¼ 0.003),low SSH variation (P¼ 0.004), and higher SST (P
¼ 0.001). Some ARS behavior was also identifiedin the EEP during August–September for twopost-nesting leatherback turtles as they crossedthe Pacific.
We obtained fewer telemetry tracks for animalsthat moved to temperate southern hemispherewaters, but some seasonal patterns were none-theless evident. Within the EAC, ARS behaviorwas identified for 23% of daily positions,primarily over cool (P¼0.004), shelf/slope waters(P , 0.001) with greater CHL (P , 0.001). EKEwas weakly associated with ARS behavior (P ¼0.057), while SSH variation and EKP were notsignificant (P¼ 0.113 and P¼ 0.442, respectively).ARS behavior was most frequent in high-latitude
Fig. 5. Leatherback telemetry locations with ARS behavior (red dots) and transit behavior (black dots) relative
to bathymetry in high-use areas (A) CCE (n¼ 40 turtles), (B) SCS (n¼ 13), and (C) IND (n¼ 18), with 200-m and
2000-m isobaths. Only locations within each defined ecoregion (Fig. 1) are included. PBI¼Papua Barat, Indonesia
(Bird’s Head Peninsula).
//Xinet/production/e/ecsp/live_jobs/ecsp-02-07/ecsp-02-07-09/layouts/ecsp-02-07-09.3d � Tuesday, 26 July 2011 � 12:08 pm � Allen Press, Inc. � Page 12 ECSP ES11-00053R2 Benson
v www.esajournals.org 12 July 2011 v Volume 2(7) v Article 84
BENSON ET AL.

shelf waters during March–June and September–January. Between these austral fall and springperiods, ARS occurred further north over deeperwaters. Transmission durations were not suffi-cient for inference during February. Only threeleatherbacks reached the TAS region, so inferencefor this region is limited. ARS behavior wasidentified between January and June for 21% oflocations within this region, and it was signifi-cantly associated with low EKE regions (P ,
0.001) and low CHL (P ¼ 0.013).
The final ecoregion in which leatherbacksexhibited substantial ARS behavior was theKuroshio Extension (KE), but only four turtlesengaged in ARS behavior in this region andtransmission durations were insufficient to pro-vide a complete year-round picture of ARSbehavior. Leatherbacks departing nesting beach-es in August arrived within the KE between
November and April, and ARS behavior wasidentified only during March–August. ARSoccurred for 17% of all locations and wassignificantly associated with lower values forSST, EKE, SSH variation, and depth (all P ,
0.001) as well as CHL (P ¼ 0.001). The longesttrack exhibited northward movement betweenJuly and September before transmissions ceased,but the turtle was no longer engaged in ARSbehavior during September.
Leatherback size patternsVariation in CCL and CCW among deploy-
ment locations and destination type was evidentin the morphometric data (Fig. 6). Mean CCLand CCW were similar among the three winternesting locations (overall mean CCL ¼ 161.6 cm,SE ¼ 1.3, CCW ¼ 116.9 cm, SE ¼ 1.0), and wecombined them for subsequent analyses. We
Fig. 6. Means, quartiles, and ranges of curved carapace length (CCL, left panels A and C) and curved carapace
width (CCW, right panels B and D) for leatherbacks tagged and measured in this study, by deployment (location,
season, gender; top panels A and B) and destination type (Trop¼ tropical; Temp¼ temperate; bottom panels C
and D). CA Temp includes male and female turtles tagged at California foraging grounds. Winter nesters had
significantly greater CCL (panel A, P ¼ 0.021) and CCW (panel B, P ¼ 0.037) than summer nesters. Temperate
foragers for both seasons had significantly greater CCW than tropical foragers (panel D, P ¼ 0.001).
//Xinet/production/e/ecsp/live_jobs/ecsp-02-07/ecsp-02-07-09/layouts/ecsp-02-07-09.3d � Tuesday, 26 July 2011 � 12:08 pm � Allen Press, Inc. � Page 13 ECSP ES11-00053R2 Benson
v www.esajournals.org 13 July 2011 v Volume 2(7) v Article 84
BENSON ET AL.
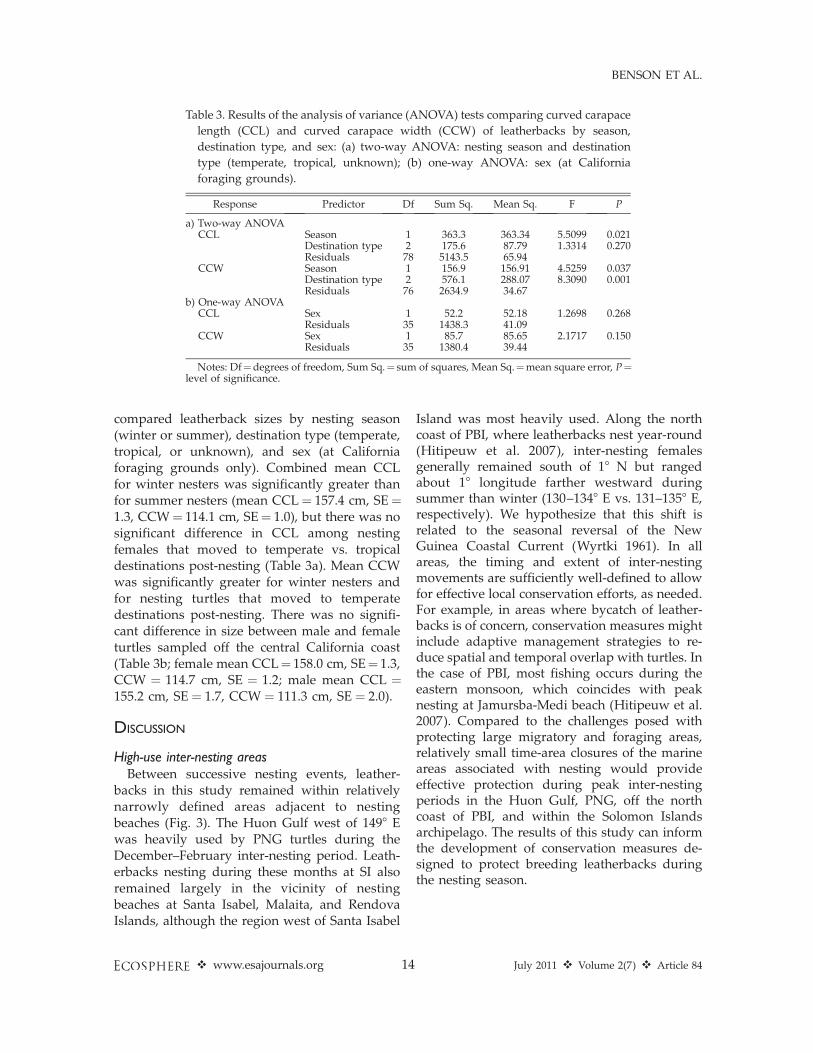
compared leatherback sizes by nesting season(winter or summer), destination type (temperate,tropical, or unknown), and sex (at Californiaforaging grounds only). Combined mean CCLfor winter nesters was significantly greater thanfor summer nesters (mean CCL¼ 157.4 cm, SE¼1.3, CCW¼ 114.1 cm, SE¼ 1.0), but there was nosignificant difference in CCL among nestingfemales that moved to temperate vs. tropicaldestinations post-nesting (Table 3a). Mean CCWwas significantly greater for winter nesters andfor nesting turtles that moved to temperatedestinations post-nesting. There was no signifi-cant difference in size between male and femaleturtles sampled off the central California coast(Table 3b; female mean CCL¼ 158.0 cm, SE¼ 1.3,CCW ¼ 114.7 cm, SE ¼ 1.2; male mean CCL ¼155.2 cm, SE ¼ 1.7, CCW ¼ 111.3 cm, SE ¼ 2.0).
DISCUSSION
High-use inter-nesting areasBetween successive nesting events, leather-
backs in this study remained within relativelynarrowly defined areas adjacent to nestingbeaches (Fig. 3). The Huon Gulf west of 1498 Ewas heavily used by PNG turtles during theDecember–February inter-nesting period. Leath-erbacks nesting during these months at SI alsoremained largely in the vicinity of nestingbeaches at Santa Isabel, Malaita, and RendovaIslands, although the region west of Santa Isabel
Island was most heavily used. Along the northcoast of PBI, where leatherbacks nest year-round(Hitipeuw et al. 2007), inter-nesting femalesgenerally remained south of 18 N but rangedabout 18 longitude farther westward duringsummer than winter (130–1348 E vs. 131–1358 E,respectively). We hypothesize that this shift isrelated to the seasonal reversal of the NewGuinea Coastal Current (Wyrtki 1961). In allareas, the timing and extent of inter-nestingmovements are sufficiently well-defined to allowfor effective local conservation efforts, as needed.For example, in areas where bycatch of leather-backs is of concern, conservation measures mightinclude adaptive management strategies to re-duce spatial and temporal overlap with turtles. Inthe case of PBI, most fishing occurs during theeastern monsoon, which coincides with peaknesting at Jamursba-Medi beach (Hitipeuw et al.2007). Compared to the challenges posed withprotecting large migratory and foraging areas,relatively small time-area closures of the marineareas associated with nesting would provideeffective protection during peak inter-nestingperiods in the Huon Gulf, PNG, off the northcoast of PBI, and within the Solomon Islandsarchipelago. The results of this study can informthe development of conservation measures de-signed to protect breeding leatherbacks duringthe nesting season.
Table 3. Results of the analysis of variance (ANOVA) tests comparing curved carapace
length (CCL) and curved carapace width (CCW) of leatherbacks by season,
destination type, and sex: (a) two-way ANOVA: nesting season and destination
type (temperate, tropical, unknown); (b) one-way ANOVA: sex (at California
foraging grounds).
Response Predictor Df Sum Sq. Mean Sq. F P
a) Two-way ANOVACCL Season 1 363.3 363.34 5.5099 0.021
Destination type 2 175.6 87.79 1.3314 0.270Residuals 78 5143.5 65.94
CCW Season 1 156.9 156.91 4.5259 0.037Destination type 2 576.1 288.07 8.3090 0.001Residuals 76 2634.9 34.67
b) One-way ANOVACCL Sex 1 52.2 52.18 1.2698 0.268
Residuals 35 1438.3 41.09CCW Sex 1 85.7 85.65 2.1717 0.150
Residuals 35 1380.4 39.44
Notes: Df¼degrees of freedom, Sum Sq.¼ sum of squares, Mean Sq.¼mean square error, P¼level of significance.
//Xinet/production/e/ecsp/live_jobs/ecsp-02-07/ecsp-02-07-09/layouts/ecsp-02-07-09.3d � Tuesday, 26 July 2011 � 12:08 pm � Allen Press, Inc. � Page 14 ECSP ES11-00053R2 Benson
v www.esajournals.org 14 July 2011 v Volume 2(7) v Article 84
BENSON ET AL.

High-use foraging destinationsWestern Pacific leatherbacks exhibited extraor-
dinarily diverse movement patterns spanningcoastal and pelagic habitats throughout the Indo-Pacific region. Areas of high use and inferredforaging, where turtles exhibited ARS move-ments (Ptran , 0.5), included several large marineecosystems (Longhurst 2007), each discussedseparately below. Summer nesters used tropicaland temperate northern hemisphere foragingregions, while destinations of winter nestersincluded tropical waters and temperate regionsof the southern hemisphere. A recent analysis ofseasonal currents in the western Pacific suggeststhat differential transport of hatchlings mayexplain this striking difference (P. Gaspar et al.,unpublished manuscript). The larger size of south-ern hemisphere winter nesters may be attribut-able to energetic differences associated with eachregion, i.e., summer nesters used more distanttemperate and tropical habitats (Fig. 1).
CA Current Ecosystem (CCE).—The CCE, ahighly productive eastern boundary currentdominated by seasonal wind-driven upwelling(Chelton et al. 1982, Lynn and Simpson 1987),was the most distant post-nesting destination fornesters from western Pacific nesting beaches.Upwelling favorable winds tend to be mostpersistent during boreal spring and early sum-mer months, transitioning to intermittent or‘relaxed’ conditions during the late summer andfall, when water temperatures are warmest.Leatherbacks forage in this area from earlysummer to late fall, when water temperaturesreach their warmest annual levels and large jellyaggregations develop (Graham et al. 2001).Turtles begin to depart the CCE when watertemperatures drop in October–November andproductivity decreases (Thomas and Strub 2001).
Three main areas of high use were identifiedwithin the CCE. Leatherbacks off California usedrelatively cool water (14–168C) over the coastalshelf (,200 m) characterized by elevated levels ofCHL and low EKE, particularly off centralCalifornia (Fig. 5). This is consistent with resultsof previous aerial surveys (Benson et al. 2007b).Off Oregon and Washington, we identified ARSbehavior in continental shelf and slope habitat(200–2000 m), particularly in waters adjacent tothe Columbia River Plume. Both of these CCEforaging areas support seasonal dense aggrega-
tions of gelatinous prey, e.g., Chrysaora fuscescensand Aurelia spp., in retention areas created bypoints, headlands, and frontal regions (Shenker1984, Graham et al. 2001). We identified someadditional ARS behavior in offshore waters ofcentral and northern California, where SST frontsare pronounced during the boreal spring andsummer in deeper offshore regions (Costelao etal. 2006). This area was used by several leather-backs during early summer prior to arriving inneritic waters and by two leatherbacks tagged inPBI that arrived off California during 2006 whendelayed upwelling reduced seasonal productivi-ty (Goericke et al. 2007) and jelly prey werescarce (S. R. Benson, unpublished data).
Leatherback turtles within the CCE indicatedstrong site fidelity to the central Californiaforaging area: all returning turtles with deploy-ments of sufficient duration (n¼ 11) came back towaters off central California in one or moresubsequent years. Nine returned the followingsummer (minimum 2-yr foraging period), andtwo turtles tagged during 2004 returned to theCalifornia coast during both 2005 and 2006(minimum 3-yr foraging period). Further, fourof the 37 turtles tagged off central Californiawere recaptured at or near their original capturelocation (two with harnesses one year later andtwo without harnesses 4 yr later), and twostranded dead along California beaches (withoutharness) 2–5 yr following tagging. The use of thisvery distant and limited seasonal foraging areaby western Pacific leatherbacks is unique andappears to be paired with the use of EEP watersbetween successive CCE foraging seasons. Al-though leatherbacks retain metabolic heat (Pala-dino et al. 1990) and are capable of withstandingcooler water temperatures (Mrosovsky 1980), wehypothesize that the cold waters and limitedprey availability of the CCE during winterrequire animals to ‘overwinter’ in warmer trop-ical waters between successive foraging seasons.A similar pattern has been documented throughtelemetry studies of Atlantic leatherback turtles(James et al. 2005) as well as eastern Pacificsharks (Weng et al. 2008, Jorgensen et al. 2010).
Equatorial Eastern Pacific (EEP).—The EEP wasnot a primary foraging destination for turtlesdeparting nesting beaches, but rather its use wasseasonal (December–February) and limited tonortheastern Pacific foragers. This region is the
//Xinet/production/e/ecsp/live_jobs/ecsp-02-07/ecsp-02-07-09/layouts/ecsp-02-07-09.3d � Tuesday, 26 July 2011 � 12:08 pm � Allen Press, Inc. � Page 15 ECSP ES11-00053R2 Benson
v www.esajournals.org 15 July 2011 v Volume 2(7) v Article 84
BENSON ET AL.

closest area to the CCE that has warmer waterand mesoscale features that might aggregatezooplankton prey. Productivity is markedlylower than in other open-ocean foraging regionsused by western Pacific leatherbacks, such as KE,TAS, and EAC (Polovina et al. 2001, Fiedler andTalley 2006, Longhurst 2007, Baird et al. 2008),but eastern Pacific leatherbacks have also beendocumented in waters of low productivity withinthe South Pacific gyre (Shillinger et al. 2008). Verylittle ARS behavior was identified (only 6% ofdaily locations), centered around 9–128 N lati-tude in areas with significantly lower SSHvariation, lower EKE, and higher SST (Fig. 4).This suggests either that foraging is only takingplace opportunistically and for short periods oftime in areas of convergence or low currentvelocities, or that the features in which leather-back turtles forage within the EEP are themselvesmobile and the state space model does notidentify these portions of the track as ARSbehavior. Further analysis of the tracks, divedata, and oceanography will be required toresolve this question.
Kuroshio Extension (KE).—The KE and NorthPacific Transition Zone are part of a highlydynamic marine region with eastward propagat-ing eddies and meanders (Polovina et al. 2001,2006). This region is known to be an importantpelagic longline fishing area and a foraging areafor many species, including loggerhead turtles(Caretta caretta), albatross (Phoebastria spp.), tunas(Thunnus spp.), swordfish (Xiphias gladius), andelephant seals (Mirounga angustirostris) (Polovinaet al. 2000, 2004, Hyrenbach et al. 2002, Seki et al.2002, Simmons et al. 2010). Four of the sixleatherback turtles from PBI that moved towardsthe KE engaged in ARS behavior, and only one ofthe four tracks was more than 12 monthsduration, so inference for this region is limited.ARS behavior was only documented duringspring (April–May) at about 35–388 N latitude.The strongest patterns identified were that ARSbehavior occurred primarily in areas of low SSHvariation and low EKE, as in the EEP, and inareas of lower SST and deeper waters. (Fig. 4).Although the KE is known to be a region ofhigher productivity (Polovina et al. 2001, 2006),ARS behavior was highly associated with areasof lower rather than higher CHL (Fig. 7). Thismay be due to the mechanisms of productivity
and retention for zooplankton prey along thefront, which is characterized by a zone of north-to-south surface convergence with cool, verticallymixed, high-CHL surface water sinking beneathwarm stratified low-CHL water. The habitatassociations of the ARS locations suggest thatleatherback turtles are likely foraging in areas ofconvergence on the south side of the chlorophyllfront, moving northward throughout the sum-mer as the front moves north (see most northerlytrack in Fig. 1). This is consistent with patternsidentified previously for loggerhead turtles (Po-lovina et al. 2000, 2004, 2006).
East Australian Current Extension (EAC).—TheEast Australian Current is a western boundarycurrent system characterized by vigorous, south-ward moving eddies and a surface flow thatvaries seasonally in strength (Ridgway andGodfrey 1997) and is strongest south of about258 S during the austral summer. Eddy masstransports can be several times the mean trans-port, leading to strong recirculation patterns(Mata et al. 2006). At about 308 S, the currentsplits into the eastward flowing Tasman Front(Andrews et al. 1980) and the southward flowingEAC. ARS behavior by leatherbacks was identi-fied in two seasonally distinct areas within theEAC: a southern area near Bass Strait that wasused during austral spring, summer and fallmonths (Figs. 4, 8), and a northern area that wasoccupied seasonally during the austral winter(July–September). Similar to patterns describedfor the CCE, leatherbacks within the EACperformed seasonal movements between a pro-ductive, high latitude region and an offshorelower latitude overwintering area, although thetwo areas are geographically much closer togeth-er within the EAC than the CCE and EEP. In thiscase, the high-latitude foraging is concentrated inwaters along the eastern shelf of Bass Strait (38–418 S), where a wintertime cascade (Tomczak1985, Luick et al. 1994) produces downwellingand enhanced surface CHL (see Fig. 8, August)and where productivity is enhanced duringspring through autumn (Fig. 8, October andApril). Leatherbacks departed this area in June,possibly associated with a sharp drop in SST andthe initiation of the Bass Strait Cascade, andspent June–August between about 308 S and 378 Sassociated with the cool-water, high-CHL mar-gins of warm offshore eddies (Fig. 8).
//Xinet/production/e/ecsp/live_jobs/ecsp-02-07/ecsp-02-07-09/layouts/ecsp-02-07-09.3d � Tuesday, 26 July 2011 � 12:08 pm � Allen Press, Inc. � Page 16 ECSP ES11-00053R2 Benson
v www.esajournals.org 16 July 2011 v Volume 2(7) v Article 84
BENSON ET AL.

Leatherbacks that departed nesting beaches in
Solomon Islands during January–February ar-
rived in waters of the EAC in March–April,
sufficiently early to reach Bass Strait for 1–2
months of foraging before winter. In contrast, PBI
nesters did not reach the EAC until May–June,
and spent June–August within the offshore
eddies prior to continuing south to Bass Strait
during spring. Notably, turtles from Solomon
Islands and PNG were the largest recorded in our
study (Fig. 6), perhaps related to their ability to
return quickly to nearby high-latitude foraging
grounds following nesting. Further, water tem-
peratures within the high latitude foraging areas
of the EAC are warmer than temperate waters
frequented by leatherbacks in the northern
hemisphere, thus potentially providing an ener-
getic advantage.
Fig. 7. Telemetry locations with ARS behavior (white dots) and transit behavior (smaller black dots) for two
leatherback turtles relative to chlorophyll concentrations and sea surface height variation during April and May
2007 in the Kuroshio Extension (KE) high-use area.
//Xinet/production/e/ecsp/live_jobs/ecsp-02-07/ecsp-02-07-09/layouts/ecsp-02-07-09.3d � Tuesday, 26 July 2011 � 12:08 pm � Allen Press, Inc. � Page 17 ECSP ES11-00053R2 Benson
v www.esajournals.org 17 July 2011 v Volume 2(7) v Article 84
BENSON ET AL.

Tasman Front (TAS).—The TAS is a semi-
permanent frontal feature created by the East
Australia Current as it moves eastward and
offshore, and is characterized by marked mean-
ders and eddies and a zone of enhanced CHL
(Andrews et al. 1980, Tilburg et al. 2001, Belkin
and Cornillon 2007, Baird et al. 2008). Two
leatherbacks from SI nesting beaches arrived in
the TAS region during April–June and engaged
in ARS behavior in an area of low current-
velocity and potential zooplankton retention just
south of the TAS prior to passing New Zealand’s
North Cape (Fig. 9). As in the KE, leatherback
ARS behavior occurred within areas of lower
CHL directly adjacent to a region of enhanced
CHL. This pattern of association with low CHL is
Fig. 8. Leatherback turtle telemetry locations with ARS behavior (white dots) and transit behavior (black dots)
relative to chlorophyll concentrations and geostrophic currents (from which eddy kinetic energy is calculated)
during April–October 2007 in the East Australia Current Extension (EAC) high-use area.
//Xinet/production/e/ecsp/live_jobs/ecsp-02-07/ecsp-02-07-09/layouts/ecsp-02-07-09.3d � Tuesday, 26 July 2011 � 12:08 pm � Allen Press, Inc. � Page 18 ECSP ES11-00053R2 Benson
v www.esajournals.org 18 July 2011 v Volume 2(7) v Article 84
BENSON ET AL.

opposite to that identified for the CCE, EAC, andIndonesian Seas. Although sample sizes are small(only three turtles moved into the TAS region)track durations of two turtles were sufficientlylong to reveal subsequent northward movementduring the austral winter (July–September) and areturn to the TAS region the following October–June (Figs. 1, 4). This suggests that leatherbacksforaging in the TAS might undertake seasonalnorth/south movements and return to higherlatitudes during at least two consecutive years, asin the other temperate regions identified in thisstudy (CCE and EAC).
Indo-Pacific Archipelago (SCS and IND).—Trop-ical seas of the Indo-Pacific Archipelago (Long-hurst 2007) include the closest foragingdestinations to Indonesian nesting beaches andwere occupied by post-nesting leatherbacksthroughout the year. Leatherback ARS behavioroccurred in over half of all recorded positionswithin these regions and was highly concentrat-ed over shallow waters (,400 m, Figs. 4–5).There was, however, a marked geographicseparation between boreal summer nesters,which moved to SCS, and boreal winter nesters,which moved to IND, west and south of PBI.These tropical, semi-enclosed seas contain nu-merous islands and are connected to each other
and to the Pacific and Indian Oceans via multiplestraits. They are characterized by complexbathymetry and dynamic currents dominatedby seasonal monsoon winds (Wyrtki 1961, Long-hurst 2007). The difference in foraging destina-tions for summer vs. winter nesters may beattributable to the seasonal monsoon-relatedcurrent reversals and their effects on the dispers-al of hatchlings (P. Gaspar et al., unpublishedmanuscript). Particularly given the proximity ofthe SCS and IND foraging regions, the lack ofcrossover among seasonal nesting populationsstrongly suggests that leatherbacks developfidelity for specific foraging regions based onjuvenile dispersal patterns, as has been suggestedfor Atlantic leatherback populations and logger-head turtles (Fossette et al. 2010, Hays et al.2010).
The SCS region was used by the largestnumber of post-nesting turtles tagged in PBIduring summer (13 of 37), however the proxim-ity of this region to nesting beaches likelyallowed a greater number of turtles to reach thisdestination prior to transmitter failure vs. themore distant temperate foraging regions. Withinthe SCS, ARS behavior was most frequent overnarrow shelf waters adjacent to Palawan Island,over the broad shelf west of Borneo, and to a
Fig. 9. Telemetry locations with ARS behavior (white dots) and transit behavior (black dots) for two
leatherback turtles relative to chlorophyll concentrations and geostrophic currents (from which eddy kinetic
energy is calculated) during April–June 2007 in the Tasman Front (TAS) high-use area.
//Xinet/production/e/ecsp/live_jobs/ecsp-02-07/ecsp-02-07-09/layouts/ecsp-02-07-09.3d � Tuesday, 26 July 2011 � 12:08 pm � Allen Press, Inc. � Page 19 ECSP ES11-00053R2 Benson
v www.esajournals.org 19 July 2011 v Volume 2(7) v Article 84
BENSON ET AL.
lesser extent, the Sulu archipelago (Fig. 4). Theseare all regions where shelf-slope fronts have beenidentified (Belkin and Cornillon 2003, 2007).Leatherbacks occupied the northernmost areasoff Palawan Island during fall through springwhen the regional thermocline is deepest (Long-hurst 2007). The southward seasonal movementof leatherback ARS behavior along the westernshelf of Palawan Island coincided with monsoon-driven changes in surface winds and a shallow-ing of the thermocline within the South ChinaSea during the boreal summer (Wyrtki 1961,Longhurst 2007). Seasonal changes in thermo-cline depth within the Sulu Archipelago are lesspronounced (Longhurst 2007), and leatherbackmovements did not present a clear seasonalpattern other than use of these areas while enroute to the South China Sea. The broad shelfregion off western Borneo was occupied year-round. The association of ARS behavior withslightly warmer waters in areas of downwellingand greater SSH variation suggests leatherbacksare foraging in areas of convergence and reten-tion within this dynamic SCS region, but adetailed study of the tracks, dive records, andlocal oceanography will be required to resolvethe local processes involved.
The IND region was the most commondestination for post-nesting turtles tagged inPBI during winter (11 of 17), although as forSCS, the proximity to nesting beaches likelyallowed a greater number of turtles to reach thisdestination prior to transmitter failure comparedto the more distant EAC and TAS. ARS behaviorwithin this region was also highly concentratedalong narrow shelf areas adjacent to islands,particularly at Kei, Tanimbar and Ceram Islands,but the dynamic habitat features associated withARS (low SST, high CHL, and low EKE) differedmarkedly from those in the SCS. This mightindicate that the mechanisms producing suitableforaging habitat differ, although the strongassociation with low EKE suggests that ARSwithin IND also takes place in areas of retentionor convergence. As in SCS, frontal formation hasbeen documented in association with sills andother topographic features within the Halma-hera, Molucca and Banda Seas (Belkin andCornillon 2007), and upwelling is enhancedduring the southeast monsoon (May–August)within the eastern Banda Sea (Longhurst 2007).
Leatherbacks did not reveal any systematicseasonal movements, and some individualsremained virtually ‘stationary’ for many consec-utive months. In particular, a small area adjacentto the Kei Islands was occupied year-round andhas supported a traditional hunt for free-swim-ming adult leatherbacks for centuries (Suarezand Starbird 1996).
High-use areas of passageWestern Pacific leatherbacks ranged widely,
and no distinct ‘migratory corridors’ wereidentified (Fig. 1), but several regions stand outas areas of passage (Ptran . 0.5) used by manyturtles traveling between nesting and foraginglocations (darker gray shading in Fig. 3). Post-nesting females from PNG, SI, and winter PBIbeaches rapidly moved towards temperate andtropical foraging areas, with key passage areasincluding the Halmahera, Bismarck, Solomon,and Coral Seas. In contrast, summer PBI nestersoften spent weeks within the clockwise summer-time circulation of the Halmahera Eddy north ofPapua Barat (Arruda and Nof 2003) beforemoving in one of three predominant directions:westward through various passes in the Sulu andSulawesi Seas, eastward along the equatorialcurrents, or northeastward into the KE. Use ofthe equatorial currents region included both thewestward-flowing North Equatorial Current andthe eastward-flowing North Equatorial Counter-current, indicating that leatherbacks did notconsistently travel with or against prevailingsurface currents. Turtles accessing temperatenortheastern Pacific waters of the CCE subse-quently turned northeastward from the equato-rial region between about 1758 W and 1558 Wlongitude. The seasonal roundtrip between CCEand EEP spanned a broad triangular regionbetween the North American coast and Hawaii(Fig. 1), with animals moving southwestwardfrom October–February and northeastward fromabout February–July (Fig. 3). Capture effectslikely accelerated the initial departure fromCalifornia foraging areas directly following tag-ging in September, and drag from the harnessmay have affected swim speeds for all turtles inthis study (Fossette et al. 2008), but the observedseasonal patterns were consistent with indepen-dent observations where available (e.g., Starbirdet al. 1993, Benson et al. 2007a, b).
//Xinet/production/e/ecsp/live_jobs/ecsp-02-07/ecsp-02-07-09/layouts/ecsp-02-07-09.3d � Tuesday, 26 July 2011 � 12:08 pm � Allen Press, Inc. � Page 20 ECSP ES11-00053R2 Benson
v www.esajournals.org 20 July 2011 v Volume 2(7) v Article 84
BENSON ET AL.

Ecological implicationsThe sample size of telemetry deployments in
our study (n¼ 126) is relatively large for a singlestudy population, and the multi-year studyperiod allowed us to identify overarching pat-terns of movement and habitat use across broadgeographic areas. The diversity of observedmovements limited inference for some destina-tions, and other, as yet unidentified areas areprobably also used by this population. Forexample, three turtles exhibited distinctly differ-ent patterns (i.e., entering the Sea of Japan, theGulf of Papua, and the Gulf of California), butthese single observations are difficult to placeinto an ecological context. In other areas (e.g., theCCE), sample sizes are likely sufficient forfurther studies that evaluate interannual vari-ability in leatherback movements and habitat usein relation to underlying ecological and oceano-graphic processes. The patterns that were re-vealed in this study, however, clearlydemonstrate that western Pacific leatherbacksexploit resources in many areas where varyingphysical and biological mechanisms can produceaggregations of gelatinous zooplankton prey(Graham et al. 2001, Hamner and Dawson2009). Mechanisms linked to areas of ARSbehavior in this study included oceanic fronts,topographically-induced coastal retention zones,and mesoscale features, such as eddies. Thecommon theme for all these areas are that theyare regions of low physical energy, as demon-strated by the affinity of leatherbacks to exhibitARS behavior in regions of low EKE, reducedSSH variation, or downwelling. Eastern Pacificleatherbacks have also been found to migrate to alow energy region, the South Pacific Gyre(Shillinger et al. 2008), and similar patterns havebeen documented for other wide-ranging marinespecies, such as loggerhead turtles, seabirds, andtunas (Polovina et al. 2001, Hyrenbach et al.2002).
Although leatherbacks are widely distributedthroughout the oceans, this study has demon-strated the critical importance of coastal areasthroughout the Indo-Pacific basin to foragingleatherbacks. In these areas, coastal nutrientinput, high productivity, and shallow watersare favorable for the life history of many speciesof Scypohomedusae that require a benthic lifestage and are important prey for leatherbacks
(Graham et al. 2001, James and Herman 2001,Hamner and Dawson 2009, Graham et al. 2010).Some of the coastal regions identified in thisstudy as likely foraging areas for leatherbacksalso support fisheries for jellyfish (Omori andNakano 2001). Gelatinous zooplankton are gen-erally considered relatively nutrient-poor (Doyleet al. 2007), and leatherbacks must consume largequantities of prey (20–30% of their body massdaily, Davenport and Balazs 1991). The reliableavailability of abundant prey in relatively smallgeographic areas and associated with fixed orrecurrent physical features is likely a key factorcausing leatherbacks to travel great distances toreach coastal regions throughout the Indo-Pacif-ic, at a comparable scale to other far-rangingmarine predators, including sooty shearwaters(Puffinus griseus), which migrate from nestingareas in New Zealand to foraging areas offCalifornia (Shaffer et al. 2006), North Pacificalbatross, which exploit areas with predictablemesoscale features (Hyrenbach et al. 2002), andwhite sharks (Carcharodon carcharias), whichmigrate between distant offshore and coastalareas (Jorgensen et al. 2010).
In contrast to coastal areas, prey patches inopen ocean regions are likely more dynamic andephemeral (Olson et al. 1994, Hyrenbach et al.2000). Leatherbacks in this study covered mark-edly larger areas between bouts of ARS behaviorin such open ocean regions. Leatherback ARSbehavior in these areas was generally associatedwith low-CHL waters adjacent to high-CHLfrontal regions, as previously identified forloggerhead turtles (Polovina et al. 2001, Kobaya-shi et al. 2008). Although this might appear tocontradict the conclusions of H. Bailey et al.(unpublished manuscript), who found an associa-tion of Pacific leatherback ARS behavior withregions of higher CHL, it is, in fact, a reflection ofecological scale: leatherbacks are foraging in thelow-CHL portions of productive (high CHL)ecoregions. It should also be noted that ARSbehavior may have been underestimated in theseregions (EEP, KE, EAC, TAS) if the mesoscalefeatures associated with ARS were themselvesdynamic. Future studies using state-space mod-els may benefit from regional parameterizationthat can take this into account.
The diversity of foraging destinations andhabitat characteristics also has implications for
//Xinet/production/e/ecsp/live_jobs/ecsp-02-07/ecsp-02-07-09/layouts/ecsp-02-07-09.3d � Tuesday, 26 July 2011 � 12:08 pm � Allen Press, Inc. � Page 21 ECSP ES11-00053R2 Benson
v www.esajournals.org 21 July 2011 v Volume 2(7) v Article 84
BENSON ET AL.

the life history of western Pacific leatherbacks.Leatherbacks that exploit distant, seasonallyabundant resources (CCE, EAC, TAS) would beexpected to require multiple years of seasonalforaging before remigrating to nesting beaches.In contrast, leatherbacks exploiting geographi-cally closer, year-round prey resources (SCS,IND) would have the potential to remigratemore quickly. Winter nesters in this study, whichforaged relatively closer to the nesting beaches(IND, EAC, TAS), were documented to havegreater CCL and CCW than summer nesters thatmoved to more distant tropical and temperateregions (CCE, KE, SCS). Regardless of nestingseason, turtles that moved to temperate destina-tions had significantly greater CCW than turtlesthat moved to tropical destinations. Assumingthere is foraging site fidelity (see Discussion:California Current Ecosystem and Indo-PacificArchipelago), this would indicate that temperateforagers increase their body weight to a muchgreater extent before returning to nesting beach-es. Although no studies have yet examined eggproduction or hatching success by foragingdestination for western Pacific leatherback fe-males, we hypothesize that within-year repro-ductive output should be greater for temperateforagers because they have stored greater ener-getic reserves. Thus, two life history strategiesappear to exist in the western Pacific nestingpopulation: (1) forage tropically and return morequickly with fewer stored energy reserves, or (2)forage in distant temperate locations and returnless frequently but in markedly better bodycondition. Although an alternate explanationfor the larger CCW of temperate foragers is thatthey must store greater reserves to handle theadded energetic cost of distant migration, thelargest turtles in our study were not the mostdistant temperate foragers (CCE), but rather thewinter-nesting turtles (SI and PNG) foraging inthe closest available temperate foraging grounds(EAC and TAS). Further study of foraging sitefidelity, prey quality and quantity, prey con-sumption rates, and energetic cost of migrationfor each foraging area will be required to furtherelucidate the energetic mechanisms that createthe above patterns.
Our tracking results show that the westernPacific genetic stock (Dutton et al. 2007) is likelycomprised of demographically discrete foraging
‘‘units’’ that in the case of PBI nest on the samebeaches at different times of year. The multipledispersal strategies illustrated in our study forwestern Pacific leatherbacks are also found inAtlantic leatherback populations (Ferraroli et al.2004, Hays et al. 2004, Eckert 2006, Witt et al.2011), which are abundant and increasing (Dut-ton et al. 2005, Turtle Expert Working Group2007). This contrasts dramatically with theseverely depleted eastern Pacific genetic stock,which has a more limited distribution associatedwith foraging areas exclusively in the southeast-ern Pacific (Eckert and Sarti 1997, Shillinger et al.2008), making this population more vulnerable toimpacts from fishing (Alfaro-Shigueto et al.2010). Further, these southeastern Pacific forag-ing areas are characterized by low productivitylinked with frequent El Nino events (Saba et al.2007). A diverse foraging strategy provides agreater buffer against adverse anthropogenicimpacts and environmental perturbation in themarine environment, suggesting that the westernPacific stock is more likely to respond toconservation action on the nesting beachesdirected at increasing hatchling production (Dut-ton et al. 2005) than has been evident for theeastern Pacific leatherback stock.
Conservation implicationsThis study provides insights into temporal and
spatial patterns of high use for western Pacificleatherbacks and can guide efforts to minimizeoverlap between potentially harmful anthropo-genic activities and leatherback turtles. Forexample, leatherbacks departed the CCE andtraveled towards the EEP during fall andreturned northeastward again in spring forsummertime foraging off California, Oregonand Washington. Thus, risks in the transit areawould be expected to be greatest during springand fall, and lower when turtles are on theforaging grounds. A seasonal area closure thattakes this movement pattern into account hassuccessfully reduced the bycatch of leatherbacksin California drift gillnet fisheries since 2001(Carretta et al. 2004). In the central North Pacific,a dynamic product is available on-line thatdisplays near real time areas of likely overlapbetween longline fisheries targeting swordfish(Xiphias gladius) and loggerhead turtles (Howellet al. 2008) to allow fishermen to reduce bycatch.
//Xinet/production/e/ecsp/live_jobs/ecsp-02-07/ecsp-02-07-09/layouts/ecsp-02-07-09.3d � Tuesday, 26 July 2011 � 12:08 pm � Allen Press, Inc. � Page 22 ECSP ES11-00053R2 Benson
v www.esajournals.org 22 July 2011 v Volume 2(7) v Article 84
BENSON ET AL.

A similar product may be feasible for leatherbackturtles in the central Pacific and elsewhere, basedon the results of this study that shows associationof leatherbacks with low-energy regions.
In our study, transmission ceased prematurelyfor some deployments in all years (Table 1), butin most cases we cannot determine whether thisis due to transmitter/harness failure or death ofthe turtle. However, seven of the 126 leather-backs tagged in this study (5%) are known orsuspected to have been subsequently killed eitherincidentally or intentionally by humans. Webelieve three PBI-nesters were likely killed infisheries off Malaysia, Philippines, and Japanbased on transmission signals or local reports(Benson et al. 2007a; Salinas et al. 2009; S. R.Benson, unpublished data). Two turtles were killedfor subsistence hunting, one in PNG during 2001(S. R. Benson, unpublished data) and one in the KeiIslands during 2008 (C. Hitipeuw, unpublisheddata). Two additional nesting turtles were killedby youths in PNG during 2006 (Papua NewGuinea Post-Courier 2007). This is a high rate ofdocumented anthropogenic mortality for a long-lived species, of particular concern given thatthese were breeding adults and therefore of highreproductive value to the population (see Wallaceet al. 2008).
The extent of movements by western Pacificleatherbacks and the multiple threats they facethroughout the Indo-Pacific illustrate that con-servation efforts must consider both the nestingand at-sea portions of their life history in anecosystem context (Dutton and Squires 2011).Protection of nesting beaches and enhancementof recruitment is critical to recovery of thespecies, but the conservation of diverse foragingunits, as identified in this study, optimizes futurepotential for maintaining the western Pacificmetapopulation.
ACKNOWLEDGMENTS
We wish to acknowledge the assistance of beachpatrollers in PNG, SI, and PBI who participated in thetagging activities presented in this study. The authorsthank the World Wildlife Fund (WWF) for Nature–Indonesia, the Papua Barat–Indonesia Forestry De-partment (BBKSDA), The State University of Papua–Marine Science Department, The Nature Conservancy–Pacific Islands, Captain David Tomlinson and crew ofthe R/V Flamingo Bay, the Tetepare Descendants’
Association, and the communities of Lababia (PNG),Saubeba and Wau (PBI) for logistical support at thenesting beaches. The Indonesian Institute of Sciences(LIPI), and the PNG and SI Departments of Environ-ment and Conservation provided research permits forwork at the nesting beaches. We thank pilots and crewof Aspen Helicopters Inc., aerial observers, in partic-ular Erin LaCasella and Katherine Whitaker, the MossLanding Marine Laboratories (MLML) Marine Opera-tions Department, particularly Captains John Douglasand Lee Bradford, and Jim Harvey and Scott Hansen ofMLML for providing assistance with in-water capturework off California. S. Eckert manufactured theharnesses used for these deployments and wasinstrumental in developing the in-water captureprotocols. We thank Judy St. Leger and Heather Harrisfor veterinary support in developing leatherbackhandling guidelines for our in-water capture work.MODIS Chlorophyll data were provided courtesy ofthe Ocean Biology Products Group at NASA GoddardSpace Flight Center. Pathfinder version 5 data wereprovided courtesy of NOAA National OceanographicData Center and the University of Miami. Sea surfaceheight anomaly data were obtained from AVISO/Centre National d’Etudes Spatiales. QuikSCAT winddata were provided courtesy of the NASA’s JetPropulsion Laboratory at the California Institute ofTechnology. Financial support and personnel wereprovided by the National Marine Fisheries Service(Southwest Fisheries Science Center, Southwest Re-gion, Pacific Islands Region, and Office of ProtectedResources), and the Monterey Bay National MarineSanctuary. Telemetry data analysis was supported inpart by the Lenfest Ocean Program. We also thankBarbara Block, Tagging of Pacific Predators program ofthe Census of Marine Life, for providing some of thetransmitters used in this study. Telemetry deploymentswere conducted under Endangered Species Act permitnos. 1159, 1227, and 1596 using approved animalhandling protocols and in conformance with allapplicable laws. Aerial support was conducted underNational Marine Fisheries Service permit nos. 748 and773-1437 and National Marine Sanctuary permit nos.GFNMS / MBNMS / CINMS-04-98-A1, and MULTI-2002-003. This manuscript was improved by helpfulreviews of S. Bograd, W. Perrin, J. Polovina, J. Semin-off, S. Rands, and two anonymous reviewers.
LITERATURE CITED
Alfaro-Shigueto, J., J. C. Mangel, M. Pajuelo, P. H.Dutton, J. A. Seminoff, and B. J. Godley. 2010.Where small can have a large impact: Structure andcharacterization of small-scale fisheries in Peru.Fisheries Research 106:8–17.
Andrews, J. C., M. W. Lawrence, and C. S. Nilsson.1980. Observations of the Tasman Front. Journal of
//Xinet/production/e/ecsp/live_jobs/ecsp-02-07/ecsp-02-07-09/layouts/ecsp-02-07-09.3d � Tuesday, 26 July 2011 � 12:08 pm � Allen Press, Inc. � Page 23 ECSP ES11-00053R2 Benson
v www.esajournals.org 23 July 2011 v Volume 2(7) v Article 84
BENSON ET AL.
Physical Oceanography 10:1854–1869.Arruda, W. Z., and D. Nof. 2003. The Mindanao and
Halmahera Eddies—Twin eddies induced by non-linearities. Journal of Physical Oceanography33:2815–2830.
Bailey, H., B. R. Mate, D. M. Palacios, L. Irvine, S. J.Bograd, and D. P. Costa. 2009. Behaviouralestimation of blue whale movements in thenortheast pacific from state-space model analysisof satellite tracks. Endangered Species Research10:93–106.
Bailey, H., G. Shillinger, D. Palacios, S. Bograd, J.Spotila, F. Paladino, and B. Block. 2008. Identifyingand comparing phases of movement by leather-back turtles using state-space models. Journal ofExperimental Marine Biology and Ecology356:128–135.
Baird, M. E., P. G. Timko, J. H. Middleton, T. J.Mullaney, D. R. Cox, and I. M. Suthers. 2008.Biological properties across the Tasman Front offsoutheast Australia. Deep Sea Research Part I:Oceanographic Research Papers 55:1438–1455.
Belkin, I., and P. Cornillon. 2003. SST fronts of thePacific coastal and marginal seas. Pacific Oceanog-raphy 1:90–113.
Belkin, I., and P. Cornillon. 2007. Fronts in the worldocean’s large marine ecosystems. Proceedings ofthe International Council on the Exploration of theSeas Annual Science Conference. 17–21 September,Helsinki, Finland. ICES CM 2007/D-21. Copenha-gen, Denmark.
Benson, S. R., P. H. Dutton, C. Hitipeuw, B. Samber, J.Bakarbessi, and D. Parker. 2007a. Post-nestingmigrations of leatherback turtles (Dermochelyscoriacea) from Jamursba-Medi, Birds Head Penin-sula, Indonesia. Chelonian Conservation and Biol-ogy 6:150–154.
Benson, S. R., K. A. Forney, J. T. Harvey, J. V. Carretta,and P. H. Dutton. 2007b. Abundance, distribution,and habitat of leatherback turtles (Dermochelyscoriacea) off California, 1990–2003. Fishery Bulletin105:337–347.
Benson, S. R., K. M. Kisokau, L. Ambio, V. Rei, P. H.Dutton, and D. Parker. 2007c. Beach use, internest-ing movement, and migration of leatherbackturtles, Dermochelys coriacea, nesting on the northcoast of Papua New Guinea. Chelonian Conserva-tion and Biology 6:7–14.
Bolten, A. B. 1999. Techniques for measuring seaturtles. Pages 126–132 in K. L. Eckert, K. A.Bjorndal, A. F. Abreu-Grobois, and M. Donelly,editors. Research and management techniques forthe conservation of sea turtles. Publication No. 4.International Union for the Conservation of NatureSpecies Survival Commission, Marine Turtle Spe-cialist Group, Blanchard, Pennsylvania, USA.
Breed, G. A., I. D. Jonsen, R. A. Myers, W. D. Bowen,
and M. L. Leonard. 2009. Sex-specific, seasonalforaging tactics of adult grey seals (Halichoerusgrypus) revealed by state-space analysis. Ecology90:3209–3221.
Carretta, J. V., T. Price, D. Peterson, and B. Read. 2004.Estimates of marine mammal, sea turtle, andseabird mortality in the California drift gillnetfishery for swordfish and thresher shark, 1996–2002. Marine Fisheries Review 66:21–30.
Chan, E. H., and H. C. Liew. 1996. Decline of theleatherback population in Terengganu, Malaysia,1956–1995. Chelonian Conservation Biology 2:196–203.
Chelton, D. B., P. A. Bernal, and J. A. McGowan. 1982.Large-scale interannual physical and biologicalinteraction in the California Current. Journal ofMarine Research 40:1095–1125.
Costelao, R. M., T. P. Mavor, J. A. Barth, and L. C.Breaker. 2006. Sea surface temperature fronts in theCalifornia Current System from geostationarysatellite observations. Journal of Geophysical Re-search 111, C09026. [doi: 10.1029/2006JC003541]
Crowder, L. 2000. Leatherback’s survival will dependon an international effort. Nature 405:881.
Davenport, J. H., and G. H. Balazs. 1991. ‘Fierybodies’—Are pyrosomas an important componentof the diet of leatherback turtles? British Herpeto-logical Society Bulletin 37:33–38.
Doyle, T. K., J. D. R. Houghton, R. McDevitt, J.Davenport, and G. C. Hays. 2007. The energydensity of jellyfish: Estimates from the bomb-calorimetry and proximate composition. Journalof Experimental Biology and Ecology 343:239–252.
Ducet, N., P. Y. Le Traon, and G. Reverdin. 2000.Global high resolution mapping of ocean circula-tion from TOPEX/Poseidon and ERS-1 and �2.Journal of Geophysical Research 105 (C5):19477–19498.
Dutton, P. H., B. W. Bowen, D. W. Owens, A. Barragan,and S. Davis. 1999. Global phylogeography of theleatherback turtle (Dermochelys coriacea). Journal ofZoology 248:397–409.
Dutton, D. L., P. H. Dutton, M. Chaloupka, and R.Boulon. 2005. Increase of a Caribbean leatherbackturtle Dermochelys coriacea nesting populationlinked to long-term nest protection. BiologicalConservation 126:186–194.
Dutton, P. H., A. Frey, R. LeRoux, and G. Balazs. 2000.Molecular ecology of leatherback turtles in thePacific. Pages 248–253 in N. Pilcher and G. Ismail,editors. Sea turtles of the Indo-Pacific: Research,management and conservation. ASEAN AcademicPress, London.
Dutton, P. H., C. Hitipeuw, M. Zein, S. R. Benson, G.Petro, J. Pita, V. Rei, L. Ambio, and J. Bakarbessy.2007. Status and genetic structure of nestingpopulations of leatherback turtles (Dermochelys
//Xinet/production/e/ecsp/live_jobs/ecsp-02-07/ecsp-02-07-09/layouts/ecsp-02-07-09.3d � Tuesday, 26 July 2011 � 12:08 pm � Allen Press, Inc. � Page 24 ECSP ES11-00053R2 Benson
v www.esajournals.org 24 July 2011 v Volume 2(7) v Article 84
BENSON ET AL.

coriacea) in the western Pacific. Chelonian Conser-vation and Biology 6:47–53.
Dutton, P. H., and D. L. McDonald. 1994. Use of PITtags to identify adult leatherbacks. Marine TurtleNewsletter 67:13–14.
Dutton, P. H. and D. Squires. 2008. Reconcilingbiodiversity with fishing: a holistic strategy forPacific sea turtle recovery. Ocean Development andInternational Law 39:200–222.
Dutton, P. H., and D. Squires. 2011. A holistic strategyfor Pacific sea turtle conservation. Pages 37–59 inP. H. Dutton, D. Squires, and A. Mahfuzuddin,editors. Conservation and sustainable managementof sea turtles in the Pacific Ocean. University ofHawaii Press, Honolulu, Hawaii, USA.
Eckert, S. A. 2006. High-use oceanic areas for Atlanticleatherback sea turtles (Dermochelys coriacea) asidentified using satellite telemetered location anddive information. Marine Biology 149:1257–1267.
Eckert, S. A., and K. L. Eckert. 1986. Harnessingleatherbacks. Marine Turtle Newsletter 37:1–3.
Eckert, S. A., and A. L. Sarti. 1997. Distant fisheriesimplicated in the loss of the world’s largestleatherback population. Marine Turtle Newsletter78:2–7.
Efron, B., and R. J. Tibshirani. 1993. An introduction tothe bootstrap. Monographs on Applied Statisticsand Applied Probability 57. Chapman & Hall, NewYork, New York, USA.
Ferraroli, S., J. Y. Georges, P. Gaspar, and Y. L. Maho.2004. Where leatherback turtles meet fisheries.Nature 429:521.
Fiedler, P. C., and L. D. Talley. 2006. Hydrography ofthe eastern tropical Pacific: A review. Progress inOceanography 69:143–180.
Fossette, S., H. Corbel, P. Gaspar, Y. Le Maho, and J.Georges. 2008. An alternative technique for thelong-term satellite tracking of leatherback turtles.Endangered Species Research 4:33–41.
Fossette, S., et al. 2010. Atlantic leatherback migratorypaths and temporary residence areas. PLoS ONE5(11):e13908. [doi: 10.1371/journal.pone.0013908]
Goericke, R., et al. 2007. The state of the CaliforniaCurrent, 2006–2007: regional and local processesdominate. California Cooperative Fisheries Inves-tigations Report 48:33–74.
Graham, T. R., J. T. Harvey, S. R. Benson, J. S. Renfree,and D. A. Demer. 2010. Acoustic identification andenumeration of scyphozoan jellies as prey forleatherback sea turtles (Dermochelys coriacea) offcentral California. ICES Journal of Marine Science67:1739–1748. [doi: 10.1093/icesjms/fsq112]
Graham, W. M., F. Pages, and W. M. Hamner. 2001. Aphysical context for gelatinous zooplankton aggre-gations: a review. Hydrobiologia 451:199–212.
Halpern, B. S., et al. 2008. A global map of humanimpact on marine ecosystems. Science 319:948–952.
Hamner, W. M., and M. N. Dawson. 2009. A reviewand synthesis on the systematics and evolution ofjellyfish blooms: advantageous aggregations andadaptive assemblages. Hyrdobiologia 616:161–191.
Hays, G. C., J. D. Houghton, and A. E. Myers. 2004.Pan-Atlantic leatherback turtle movements. Nature429:522.
Hays, G. C., S. Fossette, K. A. Katselidis, P. Mariani, G.Schofield. 2010. Ontogenetic development of mi-gration: Lagrangian drift trajectories suggest a newparadigm for sea turtles. Journal of the RoyalSociety Interface 7:1319–1327. [doi: 10.1098/rsif.2010.0009]
Hitipeuw, C., P. H. Dutton, S. R. Benson, J. Thebu, andJ. Bakarbessy. 2007. Population status and inter-nesting movement of leatherback turtles, Der-mochelys coriacea, nesting on the northwest coastof Papua, Indonesia. Chelonian Conservation andBiology 6:28–36.
Howell, E. A., D. R. Kobayashi, D. M. Parker, G. H.Balazs, and J. J. Polovina. 2008. TurtleWatch: a toolto aid in the bycatch reduction of loggerheadturtles Caretta caretta in the Hawaii-based pelagiclongline fishery. Endangered Species Research5:267–278.
Hyrenbach, K. D., P. Fernandez, and D. J. Anderson.2002. Oceanographic habitats of two sympatricNorth Pacific albatrosses during the breedingseason. Marine Ecology Progress Series 233:283–301.
Hyrenbach, K. D., K. A. Forney, and P. K. Dayton.2000. Marine protected areas and ocean basinmanagement. Aquatic Conservation: Marine andFreshwater Ecosystems 10:437–458.
James, M. C., and T. B. Herman. 2001. Feeding ofDermochelys coriacea on Medusae in the NorthwestAtlantic. Chelonian Conservation Biology 4:202–205.
James, M. C., C. A. Ottensmeyer, and R. A. Myers.2005. Identification of high-use habitat and threatsto leatherback sea turtles in northern waters: newdirections for conservation. Ecology Letters 8:195–201. [doi: 10.1111/j.1461-0248.2004.00710.x]
Jonsen, I. D., J. M. Fleming, and R. A. Myers. 2005.Robust state-space modeling of animal movementdata. Ecology 86:2874–2880.
Jonsen, I. D., R. A. Myers, and M. C. James. 2007.Identifying leatherback turtle foraging behaviourfrom satellite-telemetry using a switching state-space model. Marine Ecology Progress Series337:255–264.
Jorgensen, S. J., C. A. Reeb, T. K. Chapple, S. Anderson,C. Perle, S. R. Van Sommeran, C. Fritz-Cope, A. C.Brown, A. P. Klimley, and B. A. Block. 2010.Philopatry and migration of Pacific white sharks.Proceedings of the Royal Society Series B 277:679–688.
//Xinet/production/e/ecsp/live_jobs/ecsp-02-07/ecsp-02-07-09/layouts/ecsp-02-07-09.3d � Tuesday, 26 July 2011 � 12:08 pm � Allen Press, Inc. � Page 25 ECSP ES11-00053R2 Benson
v www.esajournals.org 25 July 2011 v Volume 2(7) v Article 84
BENSON ET AL.

Kareiva, P., and G. Odell. 1987. Swarms of predatorsexhibit ‘‘Preytaxis’’ if individual predators usearea-restricted search. American Naturalist130:233–270.
Kilpatrick, K. A., G. P. Podesta, and R. Evans. 2001.Overview of the NOAA/NASA Advanced VeryHigh Resolution Radiometer Pathfinder algorithmfor sea surface temperature and associated match-up database. Journal of Geophysical Research106(C5):9179–9197.
Kobayashi, D. R., J. J. Polovina, D. M. Parker, N.Kamezaki, I. J. Cheng, I. Uchida, P. H. Dutton, andG. H. Balazs. 2008. Pelagic habitat characterizationof loggerhead sea turtles, Caretta caretta, in theNorth Pacific Ocean (1997–2006): Insights fromsatellite tag tracking and remotely-sensed data.Journal Experimental Marine Biology and Ecology356:96–114.
Lewison, R. L., L. B. Crowder, A. J. Read, and S. A.Freeman. 2004. Understanding impacts of fisheriesbycatch on marine megafauna. Trends in Ecologyand Evolution 19:598–604.
Limpus, C. J. 2009. A biological review of Australianmarine turtles. 6. Leatherback turtle, Dermochelyscoriacea (Vandelli ). Environmental ProtectionAgency of the Queensland Government, Brisbane,Australia.
Longhurst, A. 2007. Ecological geography of the sea.Second edition. Academic Press, Amsterdam,Netherlands.
Luick, J. L., R. Kase, and M. Tomczak. 1994. On theformation and spreading of the Bass Strait cascade.Continental Shelf Research 14:385–399.
Lunn, D. J., A. Thomas, N. Best, and D. Spiegelhalter.2000. Winbugs—a Bayesian modelling framework:Concepts, structure, and extensibility. Statistics andComputing 10:325–337.
Lynn, R. J., and J. J. Simpson. 1987. The CaliforniaCurrent system: The seasonal variability of itsphysical characteristics. Journal of GeophysicalResearch 92:12,947–12,966.
Mata, M. M., S. E. Wijffels, J. A. Church, and M.Tomczak. 2006. Eddy shedding and energy con-versions in the East Australian Current. Journal ofGeophysical Research 111:C09034. [doi: 10.1029/2006JC003592]
Mrosovsky, N. 1980. Thermal biology of sea turtles.American Zoologist 20:531–547.
Olson, D. B., G. L. Hitchcock, A. J. Mariano, C. J.Ashjan, G. Peng, R. W. Nero, and G. P. Podesta.1994. Life on the edge: marine life and fronts.Oceanography 7(2):52–60.
Omori, M., and E. Nakano. 2001. Jellyfish fisheries inSoutheast Asia. Hydrobiologia 451:19–26.
O’Reilly, J. E., et al. 2000. Ocean color chlorophyll aalgorithms for SeaWiFS, OC2, and OC4: Version 4.Pages 9–23 in S. B. Hooker, and E. R. Firestone,
editors. SeaWiFS Postlaunch Technical ReportSeries. Volume 11. SeaWiFS Postlaunch Calibrationand Validation Analyses, Part 3. NASA, GoddardSpace Flight Center, Greenbelt, Maryland, USA.
Paladino, F. V., M. P. O’Connor, and J. R. Spotila. 1990.Metabolism of leatherback turtles, gigantothermy,and thermoregulation of dinosaurs. Nature344:858–860.
Papua New Guinea Post-Courier. 2007. Protectedleatherback killed. January 4, 2007. Port Moresby,Papua New Guinea. hhttp://www.postcourier.com.pg/pdfsfront/040107-PC-frontpage.pdfi
Patterson, T. A., L. Thomas, C. Wilcox, O. Ovaskainen,and J. Matthiopoulos. 2008. State-space models ofindividual animal movement. Trends in Ecologyand Evolution 23:87–94.
Polovina, J. J., G. H. Balazs, E. A. Howell, D. M. Parker,M. P. Seki, and P. H. Dutton. 2004. Forage andmigration habitat of loggerhead (Caretta caretta)and olive ridley (Lepidochelys olivacea) sea turtles inthe central North Pacific Ocean. Fisheries Ocean-ography 13:36–51.
Polovina, J. J., E. Howell, D. R. Kobayashi, and M. P.Seki. 2001. The transition zone chlorophyll front, adynamic global feature defining migration andforaging habitat for marine resources. Progress inOceanography 49:469–483.
Polovina, J. J., D. R. Kobayashi, D. M. Parker, M. P.Seki, and G. H. Balazs. 2000. Turtles on the edge:movement of loggerhead turtles (Caretta caretta)along oceanic fronts, spanning longline fishinggrounds in the central North Pacific, 1997–1998.Fisheries Oceanography 9:71–82.
Polovina, J., I. Uchida, G. Balazs, E. A. Howell, D.Parker, and P. H. Dutton. 2006. The KuroshioExtension Bifurcation Region: A pelagic hotspot forjuvenile loggerhead sea turtles. Deep-Sea ResearchII 53:326–339.
R Development Core Team. 2008. R: A language andenvironment for statistical computing. R Founda-tion for Statistical Computing, Vienna, Austria.hhttp://www.R-project.orgi
Ridgway, K. R., and J. S. Godfrey. 1997. Seasonal cycleof the East Australian Current. Journal of Geo-physical Research 102 C10:22,921–22,936.
Robins, C. M., S. J. Bache, and S. R. Kalish. 2002.Bycatch of sea turtles in pelagic longline fisheries—Australia. Bureau of Rural Sciences, Final Report tothe Fisheries Resources Research Fund. Agricul-ture, Fisheries and Forestry–Australia, Canberra,Australia.
Saba, V. S., P. Santidrian-Tomillo, R. D. Reina, J. R.Spotila, J. A. Musick, D. A. Evans, and F. V.Paladino. 2007. The effect of the El Nino SouthernOscillation on the reproductive frequency ofeastern Pacific leatherback turtles. Journal ofApplied Ecology 44:395–404.
//Xinet/production/e/ecsp/live_jobs/ecsp-02-07/ecsp-02-07-09/layouts/ecsp-02-07-09.3d � Tuesday, 26 July 2011 � 12:08 pm � Allen Press, Inc. � Page 26 ECSP ES11-00053R2 Benson
v www.esajournals.org 26 July 2011 v Volume 2(7) v Article 84
BENSON ET AL.

Salinas, R. A. F., N. B. Jr. Ramoso and L. D. Rodriguez.2009. A leatherback turtle encountered in El Nido,Palawan, Philippines. Marine Turtle Newsletter125:13–14.
Sarti Martinez, A. L. 2000. Dermochelys coriacea. InIUCN 2010. IUCN Red List of Threatened Species.Version 2010.4 hhttp://www.iucnredlist.orgi
Scott, D. W. 1992. Multivariate density estimation:theory, practice, and visualization. John Wiley &Sons, New York, New York, USA.
Seki, M. P., J. J. Polovina, D. R. Kobayashi, R. R.Bidigare, and G. T. Mitchum. 2002. An oceano-graphic characterization of swordfish (Xiphiasgladius) longline fishing grounds in the springtimesubtropical North Pacific. Fisheries Oceanography11:251–266.
Shaffer, S. A., Y. Tremblay, H. Weimerskirch, D. Scott,D. R. Thompson, P. M. Sagar, H. Moller, G. A.Taylor, D. G. Foley, B. A. Block, and D. P. Costa.2006. Migratory shearwaters integrate oceanicresources across the Pacific Ocean in an endlesssummer. Proceedings of the National Academy ofSciences 103:12799–12802.
Shenker, J. M. 1984. Scyphomedusae in surface watersnear the Oregon coast, May–August, 1981. Estua-rine, Coastal and Shelf Science 19:619–632.
Shillinger, G. L., et al. 2008. Persistent leatherbackturtle migrations present opportunities for conser-vation. PLoS Biology 6(7):e171. [doi: 10.1371/journal.pbio.0060171]
Simmons, E. S., D. E. Crocker, J. L. Hassrick, C. E.Kuhn, P. W. Robinson, Y. Tremblay, and D. P. Costa.2010. Climate-scale hydrographic features relatedto foraging success in a capital breeder, thenorthern elephant seal Mirounga angustirostris.Endangered Species Research 10:233–243.
Spotila, J. R., A. E. Dunham, A. J. Leslie, A. C.Steyermark, P. T. Plotkin, and F. V. Paladino. 1996.Worldwide population decline of Dermochelyscoriacea: are leatherbacks going extinct? ChelonianConservation Biology 2:209–222.
Spotila, J. R., R. D. Reina, A. C. Steyermark, P. T.Plotkin, and F. V. Paladino. 2000. Pacific leather-back turtles face extinction. Nature 405:529–530.
Suarez, A., and C. Starbird. 1996. Subsistence huntingof leatherback turtles, Dermochelys coriacea, in theKai Islands, Indonesia. Chelonian ConservationBiology 2:190–195.
Starbird, C. H., A. Baldridge, and J. T. Harvey. 1993.
Seasonal occurrence of leatherback sea turtles(Dermochelys coriacea) in the Monterey Bay region,with notes on other sea turtles, 1986�1991.California Fish and Game 79(2):54–62.
Thomas, A., and P. T. Strub. 2001. Cross-shelfphytoplankton pigment variability in the CaliforniaCurrent. Continental Shelf Research 21:1157–1190.
Tilburg, C. E., H. E. Hurlburt, J. J. O’Brien, and J. F.Shriver. 2001. The dynamics of the East AustralianCurrent System: The Tasman Front, the EastAuckland Current, and the East Cape Current.Journal of Physical Oceanography 31:2917–2943.
Tomczak, M., Jr. 1985. The Bass Strait Water Cascadeduring winter 1981. Continental Shelf Research4:255–278.
Turtle Expert Working Group. 2007. An assessment ofthe leatherback turtle population in the AtlanticOcean. U.S. Department of Commerce, NOAATechnical Memorandum NMFS-SEFSC-555.
Vincent, C., B. J. McConnell, V. Ridoux, and M. A.Fedak. 2002. Assessment of Argos location accura-cy from satellite tags deployed on captive grayseals. Marine Mammal Science 18:156–166.
Wallace, B. P., S. S. Heppell, R. L. Lewison, S. Kelez,and L. B. Crowder. 2008. Impacts of fisheriesbycatch on loggerhead turtles worldwide inferredfrom reproductive value analyses. Journal ofApplied Ecology 45:1076–1085.
Walli, A., S. L. H. Teo, A. Boustany, C. J. Farwell, T.Williams, H. Dewar, E. Prince, and B. A. Block.2009. Seasonal movements, aggregations and div-ing behavior of Atlantic bluefin tuna (Thunnusthynnus) revealed with archival tags. PLoS ONE4(7):e6151. [doi: 10.1371/journal.pone.0006151]
Weng, K. C., D. G. Foley, J. E. Ganong, C. Perle, G. L.Shillinger, and B. A. Block. 2008. Migration of anupper trophic level predator, the salmon sharkLamna ditropis, between distant ecoregions. MarineEcology Progress Series 372:253–264.
Witt, M. J., et al. 2011. Tracking leatherback turtlesfrom the world’s largest rookery: assessing threatsacross the South Atlantic. Proceedings of the RoyalSociety Series B [doi: 10.1098/rspb.2010.2467]
Wyrtki, K. 1961. The physical oceanography of thesoutheast Asian waters. Naga Report 2:1–195.
Xie, L., andW.W. Hsieh. 1995. The global distribution ofwind-induced upwelling. Fisheries Oceanography4:52–67. [doi: 10.1111/j.1365-2419.1995.tb00060.x]
//Xinet/production/e/ecsp/live_jobs/ecsp-02-07/ecsp-02-07-09/layouts/ecsp-02-07-09.3d � Tuesday, 26 July 2011 � 12:08 pm � Allen Press, Inc. � Page 27 ECSP ES11-00053R2 Benson
v www.esajournals.org 27 July 2011 v Volume 2(7) v Article 84
BENSON ET AL.