large scale aerobic composting of sourceseparated organic ... · conducted to identify the best...
TRANSCRIPT
1
Largescaleaerobiccompostingofsourceseparatedorganicwastes:Acomparativestudyofenvironmentalimpacts,costs,
andcontextualeffects.
by
RobvanHaaren
Advisor:Prof.NickolasJ.Themelis,ColumbiaUniversity,
Coadvisor:Prof.MortonBarlaz,NorthCarolinaStateUniversity
InpartialfulfillmentofrequirementsforM.S.DegreeinEarthResourcesEngineering
DepartmentofEarthandEnvironmentalEngineering
FuFoundationofEngineeringandAppliedScience
ColumbiaUniversity
August2009
Researchsponsoredbythe
EarthEngineeringCenter
SustainableUseofResources(SUR)
ColumbiaUniversity

2
ExecutiveSummary
This thesis describes research conducted to identify thebest available technologyfor processing source‐separated organic wastes, by means of a multi‐criteriaanalysis (MCA): a) Environmental impact, b) cost, c) land area required, d) odorcontrol and e) feedstock flexibility. A Life‐Cycle Analysis (LCA) assessed theenvironmental impacts of each process. In conjunction with the financial andcontextual (e.g., odor control) aspects thatwere examined in this study, this LCAcompared four methods for disposing organic wastes: Three aerobic compostingmethods (windrowcomposting, aerated staticpile, and in‐vessel composting) andtheuseofyardwastesasAlternativeDailyCover(ADC)onalandfill.Thesemethodswere rated for each criterion and individual dominance scores were generated,using case‐specific weighting factors for each criterion. As a result, a decisionmaking model was created that can help communities and waste managementcompaniesinchoosingtheappropriatetechnologyforaparticularsituation.
TheLCAstudyshowedthatboth theADCand the in‐vessel technologyweremostbeneficial for the environment. The ADC scenario was also found to be the leastcostly,atanestimated$14pertonwithwindrowcompostingcomingnextwith$22perton.TheGoreCover,foraspecificapplication,wasestimatedat$42/ton.Thein‐vesseltechnologywasbyfarthemostcostlymethodofallfour,with$147perton.Theaeratedstaticpiletechnologywasratedbestintheotherthreecriteria,i.e.areaneeded,odorcontrolandinputmaterialflexibility.Basedonapplyingdifferentsetsof weighting factors for all five criteria, two technologies were rated as mostpreferable:theaeratedstaticpile(GoreCoversystem)andtheuseofyardwastesasADCinlandfills.Ofcourse,thelatterdependsontheavailabilityofsanitarylandfillsanddemandforADCinthearea.
3
TableofContents
CHAPTER1:Introduction .....................................................................................................42.1:Windrowcomposting ..............................................................................................................52.2:Aeratedstaticpiles:Gorecovers.........................................................................................62.3:Invesselaerobiccompostinginarotarydrum..............................................................82.4:UseofYardWastesasAlternativeDailyCover ...............................................................9
CHAPTER3:LifeCycleAnalysis ....................................................................................... 113.1:Methodology ............................................................................................................................ 113.2:FunctionalunitinLCAcomparison.................................................................................. 123.3:Systemboundariesofthemethodsandsoftwareinputs ......................................... 143.3.1:WindrowComposting ....................................................................................................................143.3.2:Aeratedstaticpiles:Gore‐covers ..............................................................................................173.3.3:In‐vesselaerobiccompostinginarotarydrum..................................................................193.3.4:UseofYardWastesasAlternativeDailyCover...................................................................20
3.4:Results ....................................................................................................................................... 233.5:ResultsofLCAstudy .............................................................................................................. 263.6:DiscussionofLCAResults.................................................................................................... 26
CHAPTER4:CostStudy ....................................................................................................... 264.1:WindrowComposting........................................................................................................... 274.2:Aeratedstaticpile(GoreCover) ....................................................................................... 294.3:Invesselaerobiccompostingwitharotarydrum...................................................... 324.4:Useofyardwasteasanalternativedailycoveronalandfill .................................. 334.5:Results ....................................................................................................................................... 34
CHAPTER5:Operationandoutputeffectsstudy....................................................... 355.1:Areaneeded............................................................................................................................. 355.2:Odorproblems........................................................................................................................ 375.3:Inputmaterialflexibility ..................................................................................................... 41
CHAPTER6:MultiCriteriaAnalysisResults................................................................ 42CHAPTER7:Conclusions.................................................................................................... 45CHAPTER8:DiscussionandFutureResearch ............................................................ 46References: ............................................................................................................................. 49AppendixA–WalkerIMStripnotesJuly7,2009 ...................................................... 53AppendixB–NantuckettripWasteOptionsnotes,July19,2009 ....................... 60AppendixC–GoreTripnotes,May30th,2008............................................................ 69Acknowledgements.............................................................................................................. 71

4
CHAPTER1:IntroductionAccordingtotheBioCycle2006StateofGarbagestudy(R.vanHaarenetal.,2008),22.7million tons of the organic fraction in theU.S.Municipal SolidWaste (MSW)were compostedormulched.Also, according toEPA reports, the recycling rate ofyardwastesin2006(62%)wasmuchgreaterthanthatoffoodwastes(2.2%)(EPA,2006).
Theserecyclingratesconstitutethetotaltonnagesofyardandfoodwastesthatareprocessed by different methods. There is no data in the literature on tonnagesprocessed by each type of composting facility; however, windrow composting isknown to be the commonpractice. In theUnitedKingdom, for instance,windrowcompostingisthedominanttechnology,with79%ofallgreenwasteprocessed,ascomparedto11%forin‐vesselcompostingandlessthan1%foraeratedstaticpiles(R. Smith, 2007). Also, there is little information as to how these technologiescompareincapitalandoperatingcosts,andinenvironmentalimpacts.
Thisstudycomparesthreecompostingtechnologies,togetherwitharelativelynewtrendofusingyardwastesasAlternativeDailyCover(ADC)inlandfills,onthebasisof five criteria: a) Environmental impact, b) cost, c) land area required, d) odorcontrolande)feedstockflexibility..
5
CHAPTER2:OrganicWasteManagingTechnologies
Asnotedabove,fourorganicwastemanagingmethodswerecomparedinthisstudy.Three of them are aerobic composting technologies (windrow composting withturning,aeratedstaticpileandin‐vesselcomposting)andthefourthisuseofgreenwasteasanAlternativeDailyCover(ADC)onalandfill.
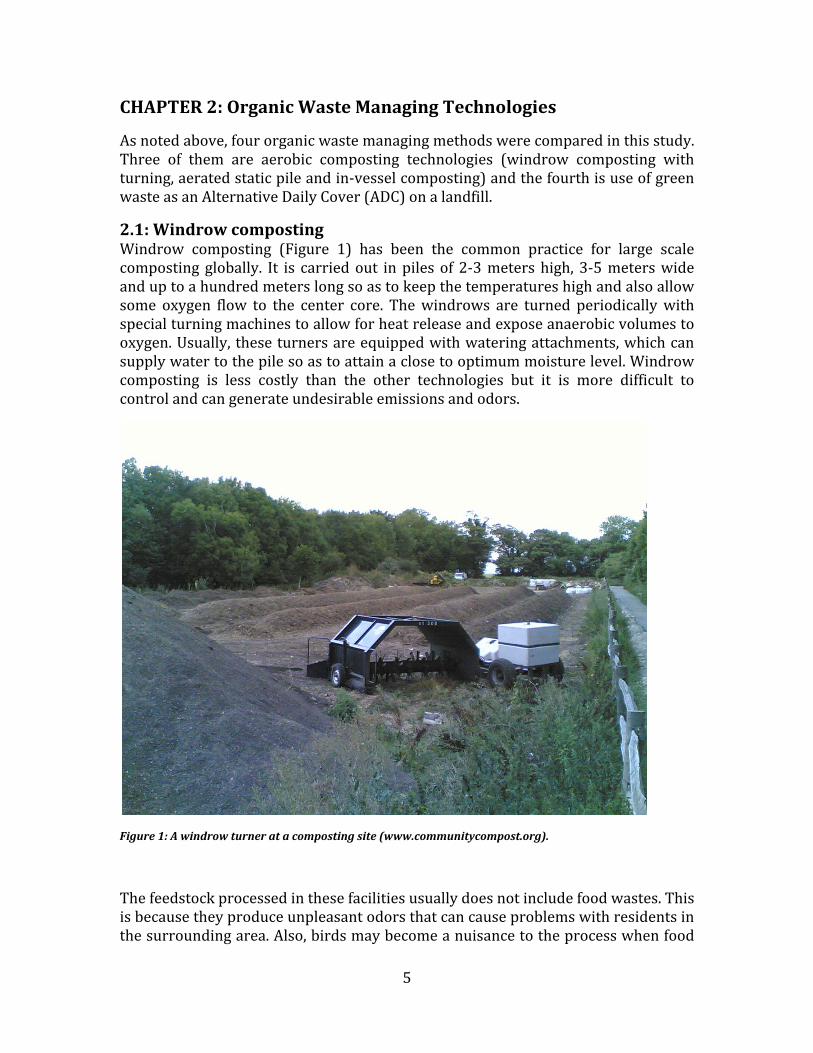
2.1:WindrowcompostingWindrow composting (Figure 1) has been the common practice for large scalecompostingglobally. It is carriedout inpilesof2‐3metershigh,3‐5meterswideanduptoahundredmeterslongsoastokeepthetemperatureshighandalsoallowsome oxygen flow to the center core. Thewindrows are turned periodicallywithspecialturningmachinestoallowforheatreleaseandexposeanaerobicvolumestooxygen.Usually, theseturnersareequippedwithwateringattachments,whichcansupplywatertothepilesoastoattainaclosetooptimummoisturelevel.Windrowcomposting is less costly than the other technologies but it is more difficult tocontrolandcangenerateundesirableemissionsandodors.
Figure1:Awindrowturneratacompostingsite(www.communitycompost.org).
Thefeedstockprocessedinthesefacilitiesusuallydoesnotincludefoodwastes.Thisisbecausetheyproduceunpleasantodorsthatcancauseproblemswithresidentsinthesurroundingarea.Also,birdsmaybecomeanuisancetotheprocesswhenfood
6
ispresentinthepiles.
IntheLifeCycleinventoryofKomilisandHam(D.Komilis,2004),yardwastesaremodeled as feedstock inwindrow composting. In that study, a 100 ton/day yardwaste composting facility was compared with two municipal solid waste (MSW)composting facilities.TheMSW feedstockwas assumed to comprise threeorganiccomponents, foodwaste, yard waste andmixed paper. The retention time of theyard waste in the facility was 24 weeks. The different stages in the process ofwindrowcompostingwillbediscussedintheLCAsectionbelow.
The bioconversion reactions occur mostly under aerobic conditions. The bulk ofoxygen is supplied by turning thewindrows,with awindrow turner. The aerobicconversionreactioncanbeexpressedasfollows:
(C6H10O4)x+6.5O2(C6H10O4)x‐1+6CO2+5H2O (1)
where (C6H10O4)x is a simplified formula (Themelis, 2000). This reaction isexothermicandreleasesabout616kcalofheatpermoleoforganicmatter.
In normal practice of windrow composting, oxygen is not always present for allbiodegradable matter, e.g. in the core of the windrow. The amount available forbiodegradable matter is a function of turning frequency and pile porosity. Thebenefitof turning frequently is tominimizeanaerobic reactionsandgenerationofmethaneaccordingtothefollowingmethanogenesisreaction:
(C6H10O4)x+1.5H2O(C6H10O4)x‐1+2.75CO2+3.25CH4 (2)
Compared to the strongly exothermic aerobic reaction, anaerobic bioconversionrangesfromslightlyendothermictoslightlyexothermic,dependingonthestructureoftheC6H10O4molecule.Itwillbeshowninalatersectionthatthereishardlyanymethaneemittedpertonofyardwaste:2.3E‐05kgofmethane,ascomparedto350kgofcarbondioxide(CO2).Itcanbesurmisedthatsomeofthemethaneisoxidizedbymethanotrophs,bacteriathatoxidizemethaneinthepresenceof:
• Sufficientoxygensupply;• A suitable carrier that offers adequate nutrient supply and facilitates colony
formation;• Adequatemoisturecontentandambientconditionsinthemedium.
Someof the factors affecting the activityof themethanotrophs arepH (preferablybetween 6 and 8), temperature (optimum between 25 to 35 oC) and moisturecontent (L.Diaz, 2005).However, theoptimalmoisture content and theoxidationrateincreaseasorganicmattercontentincreases(MetteChristophersen,2000).
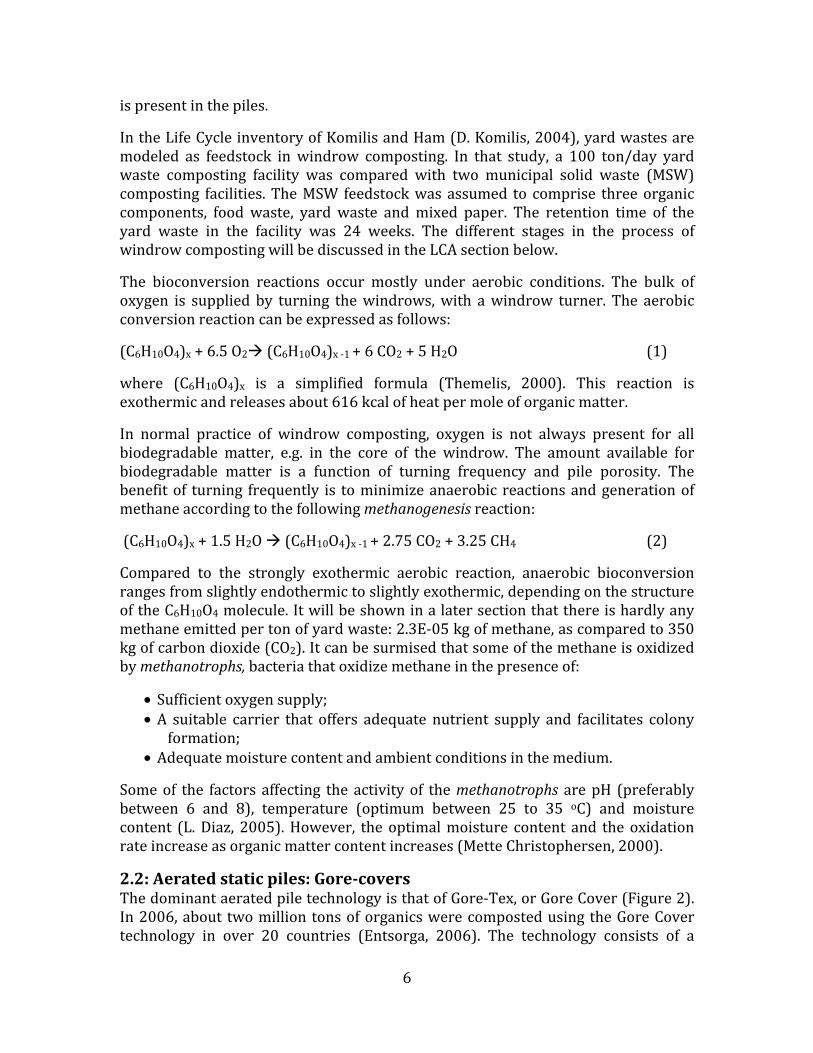
2.2:Aeratedstaticpiles:GorecoversThedominantaeratedpiletechnologyisthatofGore‐Tex,orGoreCover(Figure2).In2006,about twomilliontonsoforganicswerecompostedusingtheGoreCovertechnology in over 20 countries (Entsorga, 2006). The technology consists of a

7
concretefoundationwithhorizontalaerationtubesonitssurfacethroughwhichairflowsupwardintothewastepile.Theorganicwastesareusuallyshreddedandthendeposited on this floor, similarly to windrow composting. The entire pile is thencovered by a special membrane cloth that keeps organic vapors andmoisture inwhile allowing the passage of nitrogen, carbon dioxide and unused oxygen. Thecoversarekeptinplacebyeithersandbags,firehosesortheyareattachedtoboltsinsmallwallswithrubberropes(WalkerIndustriestripnotes,2009).Moistureandoxygenlevelsarekeptattheoptimumlevelfordegradationtotakeplace.
Figure2:SchematicoverviewoftheGoreCovercompostingsystem.Thecloth'sfiberstructureisweatherresistant,letsmoistureandcarbondioxidethrough,whilekeepingtheheat,odorsandbacteriainside.Thecentral control unit keeps oxygen levels and moisture levels at an optimum by adjusting the aerationthroughundergroundchannels(GoreAssociates,2008).
Similarly to the windrow composting equation (1), the oxidation taking place inaerobic conditions is representedas follows,now taking intoaccounta50%‐50%mixoffoodwasteandyardwaste:
(C4.09H6.35O2)n+4.4O2(C4.09H6.35O2.79)n‐1+4.1CO2+3.4H2O (3)
Takingintoaccounttheatomicmassoftheelements,itiscalculatedthatthemassofairneededfortheconversionof1kgoffeedstockisabout6.9kg,or5.8Nm3.
The waste handling process of Gore Cover, as practiced at Cedar Grove, Seattleconsistsof:
1. Weighingtheincomingfeedstock;
2. Tippingmaterialsinanodor‐controlledbuildingundernegativeairflowthat

8
isthenconveyedthroughabiofilter;
3. Premixingwithfront‐endloader(FEL)andthenmaterialsarescreened;
4. Transporttothepileswithaconveyorbelt;
5. Threephasebiodegradationprocess(seebelow);
6. Screeningofanyremainingplasticpieces
7. Finalagingprocessbeforeusingassoilamendment/lowqualityfertilizer.
Shredding is only necessary when particle size is too big to allow properdegradation.Thebiodegradationprocessconsistsgenerallyof threepartsand lastfor about 9 weeks. In Edmonton, California the retention time of organics is asfollows:
• 1‐4weeksbiodegradationundercover;
• 2‐4weekspost‐rottingundercover;
• 2‐3weeksexposedcuring(Entsorga,2006).
For theGoreCovercompostingsystemsatCedarGrove,SeattleandNiagaraFalls,Ontario, the three stages take 4, 2 and 2 weeks of time, respectively (SURCompostingReport,2006)(WalkerIndustriesVisit,2009).
Many variations are possible in the shape and structure of the Gore Cover plant.Piles in the Gore Cover system operated by Walker Industries in Niagara Falls,Canada, are deposited in between two lowwalls extending over the length of thepile. The cover is then connected to bolts in thewalls by rubber ropes insteadofusingsandbagsorafirehose.Thisworksbetterinthewinter,sinceitpreventstheattachmentsof thecovers frombeingcovered in snowand ice (Walker Industriestripnotes,2009).Also,thecoverscanbeattachedtoaframestructurethatcanbeopenedupforloadingandunloading,asisdoneatGermanoperationsofGore‐Tex.ItisinterestingtonotethattheGoreCoversystemisusedtheretodryMSWbeforeit is sent to the combustion chamber of a Waste‐To‐Energy facility (WalkerIndustriesVisit,2009).TheGoresystemcanbedesignedforoptimalconditionsforeachspecificconfigurationofthepile.
With respect to cost and complexityof operation, aerated staticpiles are situatedsomewherebetweenwindrowsandthein‐vesseltechnologiestobediscussedinthenextsection.Thesefacilitiesdonottakeupasmuchspaceaswindrowcompostingbut for optimal operation they require close monitoring of moisture and oxygenlevels.
2.3:InvesselaerobiccompostinginarotarydrumIn‐vessel aerobic composting of organics (both yard waste and food wastes aresuitable)isamethodofprocessingwastethatprovidesahighdegreeofcontrol.It
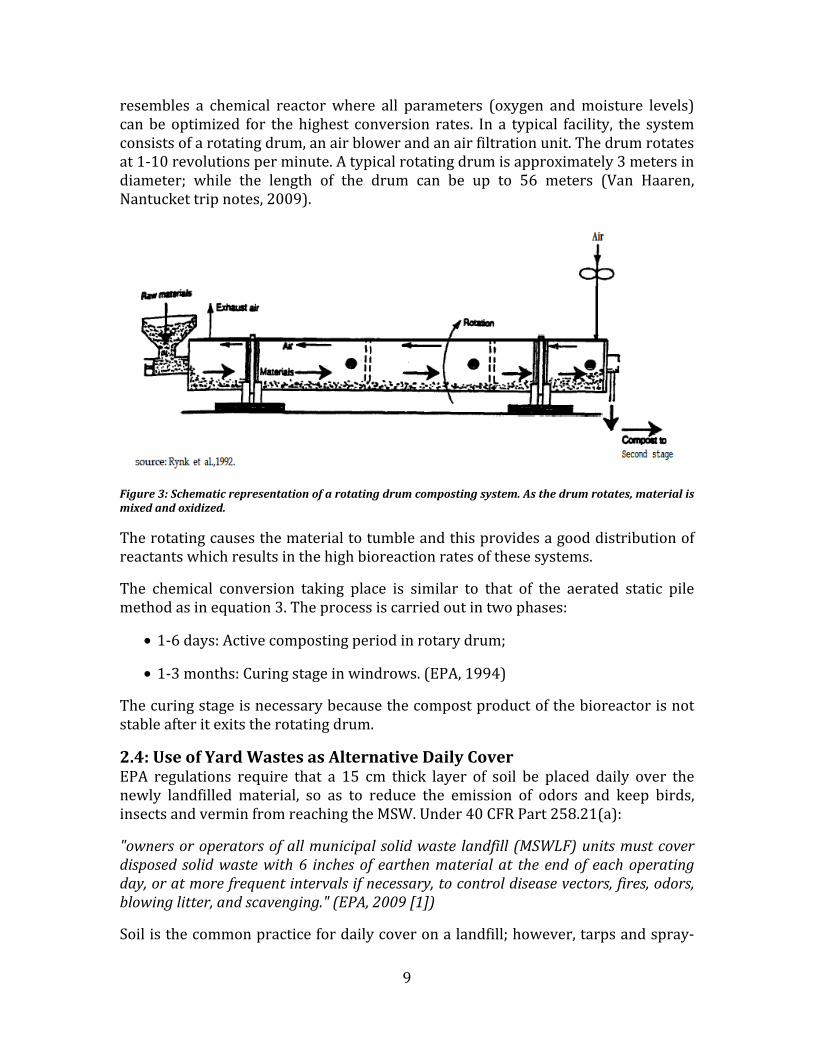
9
resembles a chemical reactorwhere all parameters (oxygen andmoisture levels)canbeoptimized for thehighest conversion rates. In a typical facility, the systemconsistsofarotatingdrum,anairblowerandanairfiltrationunit.Thedrumrotatesat1‐10revolutionsperminute.Atypicalrotatingdrumisapproximately3metersindiameter; while the length of the drum can be up to 56 meters (Van Haaren,Nantuckettripnotes,2009).
Figure3:Schematicrepresentationofarotatingdrumcompostingsystem.Asthedrumrotates,materialismixedandoxidized.
Therotatingcausesthematerialtotumbleandthisprovidesagooddistributionofreactantswhichresultsinthehighbioreactionratesofthesesystems.
The chemical conversion taking place is similar to that of the aerated static pilemethodasinequation3.Theprocessiscarriedoutintwophases:
• 1‐6days:Activecompostingperiodinrotarydrum;
• 1‐3months:Curingstageinwindrows.(EPA,1994)
Thecuringstageisnecessarybecausethecompostproductofthebioreactorisnotstableafteritexitstherotatingdrum.
2.4:UseofYardWastesasAlternativeDailyCoverEPA regulations require that a 15 cm thick layer of soil be placed daily over thenewly landfilled material, so as to reduce the emission of odors and keep birds,insectsandverminfromreachingtheMSW.Under40CFRPart258.21(a):
"ownersoroperatorsofallmunicipal solidwaste landfill (MSWLF)unitsmustcoverdisposed solidwastewith6 inchesof earthenmaterial at the endof eachoperatingday,oratmorefrequentintervalsifnecessary,tocontroldiseasevectors,fires,odors,blowinglitter,andscavenging."(EPA,2009[1])
Soilisthecommonpracticefordailycoveronalandfill;however,tarpsandspray‐

10
onmulchmixesarealsousedasADC.InCalifornia,anestimated2.1milliontonsofsource‐separatedyardwastesareshreddedandusedinlandfillsasAlternateDailyCover(ADC,Stephens,2007).TheCaliforniaAssemblyhaspassedabillthatallowsfor this use of yard wastes to be counted as part of the recycling effort of acommunity (Haughey, 2001). However, some environmental organizations arequestioning the environmental benefit of this use and suggest that this materialshouldbesenttoconventionalcompostingfacilities,suchaswindrowcomposters.
Conditions in the landfill aremainly anaerobic.Thewaterneeded to generate themethane from the biomass wastes present in the landfill is either provided byprecipitation or it is part of the moisture fraction of the waste. However, someaerobicreactionoccurseitherduetotheoxygencontainedinopenvolumesduringthedumpingprocess,oroxygendiffusing throughthecover layer into the landfill.Typically,landfillgascontainsequalvolumesofmethaneandcarbondioxideandasmallamountofnitrogen.
The depth of a typical landfill cell varies considerably, from 15 to 80 meters,dependingonthelandfillgeometryandoverallsize.Similarly,theheightofadailycell varies but a value of about 10 feet represents a reasonable approximation.Landfillgascollectionwellsaretypicallyinstalledincrementallyafterwasteburial.Regulations require that wells be installed within the earlier of two years ofplacement of the final cover or five years after waste burial. However, at manylandfills,gascollectionsystemsareinstalledsooner,onceanareaofalandfillhasanintermediatecover(Barlaz,2009).
A cross‐section of a landfill is shown in Figure 4. The working landfill cell isprepared with a liner and MSW is deposited daily. It is important to equip thelandfillwithanimperviouslayer(liner)tokeepleachatefromleakingintothesoiland contaminating surface or groundwater.. More information about this can befoundinAppendixB.Whenthecellreachesitsfinalheight,thefinalcoverisplacedafterthegascollectionsystemisinstalled.TheEPArequireslandfillsoveracertainsizetocollectandcombustlandfillgasundertheCleanAirAct(EPA,2009[2]).

11
Figure4:Schematicoverviewofthelayersinalandfill.Thecellsarecoveredbydailycoversandwhentheyareleftandintermediatecovers(Haughey,2001).
Inordertosavespace,somelandfillsscrapeoffdailycoversoilbeforethenextlayerofMSWisdepositedandthesoilisthenre‐used.Ontheaverage,thevolumeratioofMSWtosoilinlandfillsisapproximately9:1(Barlaz,2009).
CHAPTER3:LifeCycleAnalysis
3.1:MethodologyTheLCAwasconductedusingtheSimaProLCAsoftwareprogram(PREConsultants,2009). Itconsistsofanextensivedatabaseofproductsandprocessesthatprovidean inventory of energy andmaterial resources used and of chemical compoundsemitted(waterborne,airborneandintothesoil)duringmanufacturingaproductoroperating a process. This software program allows users to create their owndatabase,byselectingrelevantdataentriesfromtheSimaProdatabase.Inthenextstage, theprogramaccounts forall theenvironmental impacts involved. Inseveralcategories (health effects, ecosystem effects and resource conservation) SimaProgenerates a bar chart where all impacts are weighted, by means of appropriateweighting factors, it then integrates these impacts into one number for eachcompetitiveproductorprocess.
In this case, the material and energy inventory of the four processes describedearlierwere developed, aswell as their corresponding emissions, on the basis ofinformation provided in the literature and company reports or obtained in plantvisits.
In LCA studies, the same functional unit should be used in allmethods.Also, it isveryimportanttodefinetheboundariesofthesystemsthatarebeingresearchedsothat a fair comparison is made. In the following, the functional unit and theboundariesofthefourmethodswillbediscussed.

12
3.2:FunctionalunitinLCAcomparisonThe functional unit in this LCA study is one metric ton (1000 kg) of source‐separatedyardwastes (also called “greenwastes”).However, twoof themethodsdiscussed in this paper (aerated static pile and in‐vessel composting) can alsoprocess foodwastes because they are enclosed and emit relatively little odor. Incontrast, if foodwastesareadmixedwithyardwastes inthewindrowcompostingandADCscenarios,theyresultintheemissionofundesirableodors;also,birdsandinsects can become a nuisance. For this reason, foodwastes should not bemixedwithyardwastesinthecaseofwindrowandADCdisposal.
Ideally, thefourmethodsshouldbecomparedusingthesamefeedstock.However,theonlyavailabledatafortheGoreCoverandin‐vesseltechnologieswereformixedfeedstocks.Becauseofthis, intheLCAstudy, itwasnecessarytousefeedstocksoftwodifferentcompositionsincomparingthefourmethods.Itisthereforeusefultoconsiderhowthechemicalcompositionsofyardwastesandyardandfoodwastesdiffer.Table1 shows that foodwastes contain10%moremoistureand8.6% lessvolatilematterthanyardwastes.Also,thenon‐combustiblefractionishigherthanforyardwastes.
Table 1: Average composition and heating value of typical waste streams in the U.S. From:(Tchobanoglous,Theisen,Vigil,1993)
% Moisture Volatilematter
Fixedcarbon
Non‐combustible
kJ/kg ascollected
Yardwastes 60 30 9.5 0.5 6,050Mixedfoodwastes 70 21.4 3.6 5 4,180
Laboratoryandpilot researchhaveshown that theoptimummoisturecontent foraerobic composting reactions ranges from 45‐60%; also, temperatures should bemaintainedbelow60 oC (Themelis,2000).The10%highermoisturecontentdoesnotsignificantlyaffect thedegradationenvironment in thereactorsof theaeratedstatic pile and the in‐vessel aerobic composting scenarios. This is because theseprocesses are provided with moisture control systems that keep optimumconditionswithinthebioreactingmass;astemperatureand,therefore,evaporationincrease, the control systemaddswater tokeep the rightmoisture content in thereactor.
Table 2: Elemental composition of typicalwaste streams in theU.S. Besides the five elementsbelow, other elementsarepresent too, likephosphorus. From: (Tchobanoglous,Theisen,Vigil,1993)
% Carbon Hydrogen Oxygen Nitrogen SulfurYardwastes 46 6 38 3.4 0.3Mixedfoodwastes 48 6.4 37.6 2.6 0.4
13
Table2shows that thecarbonandhydrogencontentof the foodandyardwastesarenearlythesame.Theonlylargerelativedifferenceisinnitrogencontent.Thesetwo elements yield a higher nutrient content in the final compost product of theaerated static pile and in‐vessel processes i.e. a more effective fertilizerreplacements than the product from composting yard waste in windrows. Therespective chemical composition of yard wastes and mixtures of yard and foodwastescanbecalculatedfromthefractionalmasscompositionshowninTable2andtheatomicweightsoftheelements.Theresultisasfollows:
Yardwaste: (C3.83H5.95O2.38N0.24S0.009)n
Mixedfoodwastes: (C4.00H6.35O2.35N0.19S0.012)m
where the ‘m’ and ‘n’ factors can be adjusted according to the length of thehydrocarbonchainmolecule.Asthechainsbecomesmallerduringdegradation,themolecules become more stable and the rate of conversion decreases (Themelis,2000).
Itcanbeseenthatthechemicalformulaoffeedstockcontainingfoodwastesdifferslittlefromthatconsistingonlyofyardwastes.Thefunctionalunitforthewindrowand ADC scenario is onemetric ton of yardwaste: (C3.83H5.95O2.38N0.24S0.009)n. Theinput of the aerated static pile and in‐vessel processes can be generally anythingbetween the above displayed yard waste and mixed food waste compositions.Typically, a 50%‐50% mix would give a chemical formula of(C3.91H6.15O2.36N0.21S0.011)n.
Animportantproductofthebiodegradationistheformationofammonia.Itoccursinallscenariosandageneralexplanationwillbegivenhereforthatreason.
Ammonificationandnitrogenlosses
In the presence of water and sufficiently high pH and temperatures, ammonia isformed.Carbonpresent isused for thegrowthofnewcells aswell as a sourceofenergy.Whenthereisaninsufficientamountofcarbonorenergy,unstablenitrogenresultsinammonification.TheC:Nratioisanimportantfigureforammonificationinthecompostingprocess.AninitialC:Nratioof20:1to40:1isrecommendedforfastcompostingrates(Gravesetal.,2000).Whentheratiogoesbelowthatrangeandtheright conditions are present, ammonia is formed. The reaction equation is asfollows:
R−NH3+H2OR−OH+NH3+Energy (4)
Consideringthefeedstocksthatareusedintheanalysis,thefollowingC:Nratiosarepresent:
14
Feedstock
C:Nratio
Yardwaste
15.8
Yardandfoodwastemix(50/50) 18.3
These figures imply that ammonia formationmay occur, even in the case of yardwastefeedstock.
It was found that a significant amount of nitrogen is lost during the compostingprocess,rangingbetween3.7to69.2%whenmanureisthefeedstock.Ofthis,46.8to77.4%wasemittedinagaseousform,mostofitasammonia(NH3)(Gravesetal.,2000). For yard wastes, 4 to 35% of initial nitrogen present was emitted asammonia in a experimental study (Insam et al., 2002). Projecting this onto thenitrogenavailable inonemetric tonofyardwaste inourstudy,between0.54and4.76 kg of ammoniawould be emitted. These ammonia emissions have ecologicalenvironmental impacts in the eutrophication/acidification categories and healthimpactsintherespiratoryorganicscategory.
3.3:SystemboundariesofthemethodsandsoftwareinputsAsnotedearlier, it is importanttodefinetheboundariesoftheprocessthat isthesubjectof theLCA. In this section, the resourceuseandenvironmental impactsofeachofthefourprocesses,withinthedefinedsystemboundaries,areincorporatedintheimpactassessment.
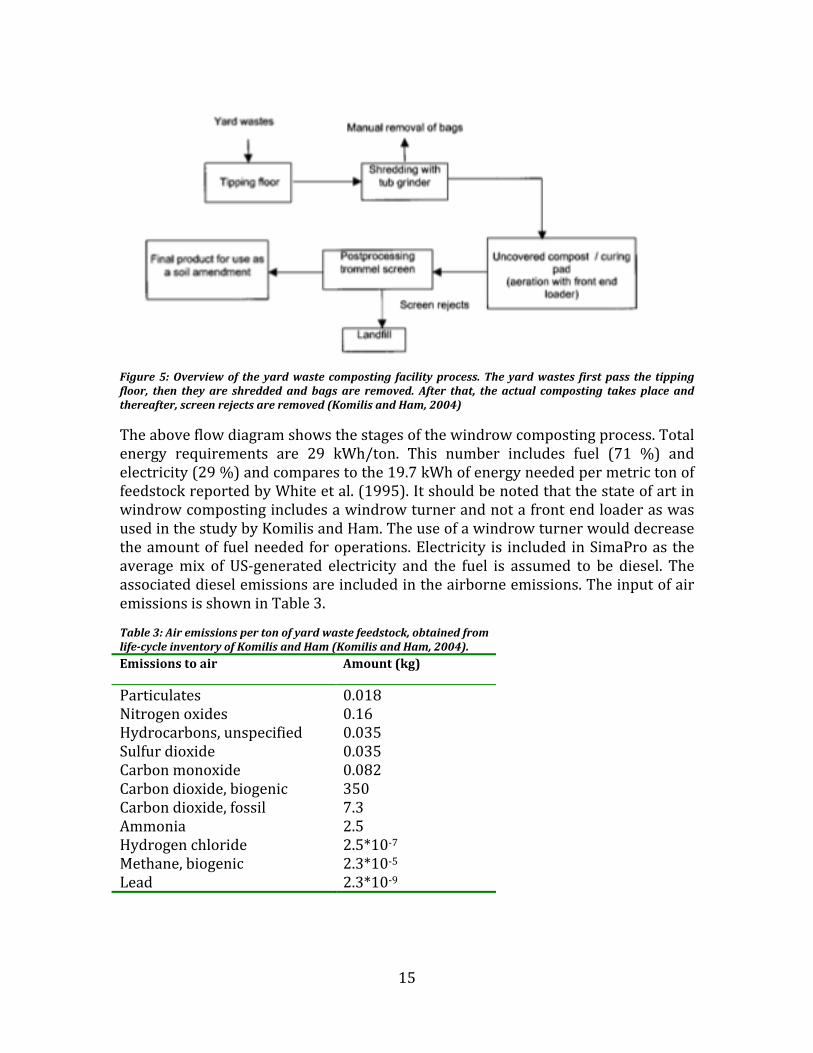
3.3.1:WindrowCompostingBoundariesofthesystem
The boundaries set in the yardwaste composting facility (YWCF) in the paper ofKomilisandHam(KomilisandHam,2004)areshowninFigure5.
15
Figure5:Overviewof theyardwaste composting facilityprocess.Theyardwastes firstpass the tippingfloor, then they are shredded and bags are removed. After that, the actual composting takes place andthereafter,screenrejectsareremoved(KomilisandHam,2004)
Theaboveflowdiagramshowsthestagesofthewindrowcompostingprocess.Totalenergy requirements are 29 kWh/ton. This number includes fuel (71 %) andelectricity(29%)andcomparestothe19.7kWhofenergyneededpermetrictonoffeedstockreportedbyWhiteetal.(1995).ItshouldbenotedthatthestateofartinwindrowcompostingincludesawindrowturnerandnotafrontendloaderaswasusedinthestudybyKomilisandHam.Theuseofawindrowturnerwoulddecreasetheamountof fuelneededforoperations.Electricity is included inSimaProas theaveragemix of US‐generated electricity and the fuel is assumed to be diesel. Theassociateddieselemissionsareincludedintheairborneemissions.TheinputofairemissionsisshowninTable3.
Table3:Airemissionspertonofyardwastefeedstock,obtainedfromlifecycleinventoryofKomilisandHam(KomilisandHam,2004).Emissionstoair Amount(kg)
Particulates 0.018Nitrogenoxides 0.16Hydrocarbons,unspecified 0.035Sulfurdioxide 0.035Carbonmonoxide 0.082Carbondioxide,biogenic 350Carbondioxide,fossil 7.3Ammonia 2.5Hydrogenchloride 2.5*10‐7Methane,biogenic 2.3*10‐5Lead 2.3*10‐9

16
Table3showsthat2.5kgofammoniawerereleasedper1000kgofyardwaste.Thisisapproximately18%oftheinitialnitrogenmassinthefeedstock.
Waterborneemissionswerealsoobtainedfromthesamepaper(Table4).
Table4:Wateremissionspertonofyardwastefeedstock,obtainedfromthelifecycleinventoryofKomilisandHam.
Emissionstowater Amount(kg)
Suspendedsolids,unspecified 2*10‐5Solvedsolids 0.021BOD5,BiologicalOxygenDemand 2.1*10‐5COD,ChemicalOxygenDemand 1*10‐4Oils,unspecified 2.5*10‐4Sulfuricacid 1.5*10‐3Iron 3.7*10‐4Chromium 6.9*10‐9Lead 3.1*10‐9Zinc 4.5*10‐8Solids,inorganic 0.26
Theseemissionshowever,areassociatedwiththecombustionoffuelandelectricityuse, not the leaching emissions to the ground from composting operations. It isassumedthatthiswindrowcompostingplanthasa leachatecollectionsystemthatstores the slurry waste in a pond or an enclosed vessel before it is treated anddisposedofinthesewerorispickedupbytruck.
Avoidedproduct:fertilizer
Theend‐productofwindrowcompostingcanbeusedasasoilamendment.Thishasabeneficialeffectontheoverallenvironmentalimpactofaprocess,sincefertilizerproductionconsumesalotofenergy.Theeffectivenessofthecompostproductcanbecomparedtothatofanaveragefertilizerbymeansofamassbalance.
Assuming amass loss forwindrow composting of 20% from the initial feedstock(CompostScience&Utilization,2004),amoisturecontentof34.8%forthecompostproduct (White et al. 1995), andmasspercentagesofN,P andKnutrientsof2%,0.3%and0.8%respectively(CraigCogger,2002),theeffectivenessofthecompostproductcanbecomparedtoatypicalfertiliser.Fertilisersareusuallycharacterizedbymeansoftheir“NPKnumber”,whichdenotestheirnitrogen(asN),phosporus(asP2O5)andpotassium(asK2O)content.Forinstance,takingintoaccounttheatomicweight of the three elements, a (17‐17‐17) fertilizer contains 17%N, 7.4%P and14.1%K.
Onthebasisof theabovenumbers, it iscalculatedthatonetonofwetyardwastewouldyieldafertilizerwithan2‐0.7‐1NPKnumber.Thisis17timeslesseffective

17
on a nutrient mass basis than a ton of (17‐17‐17) fertilizer. For the LCA, it isimportant to consider the fact that the use of the soil amendment replacesfertilizers. Therefore, the calculated mass of each nutrient in fertilizer that isavoided,becauseoftheuseofcompost,isenteredintheSimaProanalysis.Table5showstheavoidedproductsforeachelement.
Table5:Avoidedproductsofthecompostproductofonetonofyardwasteprocessedinthewindrowcompostingfacility.
Fertilizer effectiveness (avoided products) ofwindrowcompostproduct
Amount(kg)pertonoffeedstock
Fertilizer(N) 10.4Fertilizer(P) 1.6Fertilizer(K) 4.2
InapreliminarycalculationbyFavoino(Favoino,2008),itwasfoundthatonetonofdrymattercompostproductwouldreplace19kgN fertilizerand,ofcourse,avoidtheuseofenergyneededfortheproductionofthefertilizer.Assumingamasslossof20% during the composting process, he found that 15.2 kg N fertilizer would bereplacedby1tonofinputfeedstock.Ifhewouldhavecalculatedthisfigureonawetproduct basis with a 0.348 moisture content (White et al., 1995), the 15.2 kg Nwould be reduced to 9.9 kg N. This compares to the 10.4 kg N calculated in themodelusedforthisstudy.
3.3.2:Aeratedstaticpiles:GorecoversThe electricity used for air blowing in the piles and operation of themonitoringsysteminanaeratedstaticpilehasbeenreportedtobe0.75kWh/ton(GoreVisit,2008).Additionalenergyisusedforrollingstock,(optional)shredders,screensandbiofilters; informationabout thesespecificprocesses isnot found,but it isknownthat the total cost for fuels and supplies is $50,000 and for electricity $20,000.Electricityconsumption is thereforeestimatedatabout3.3kWhper ton (at$0.15perkWh)andapproximately$40,000offuel,correspondingtoabout15kWh/ton.
Hydrocarbon emissions from a Gore Cover operation were studied in 2007 by aGermangroupofscientists(Schmidtetal.,2009)usingfluxchambertechnology.Sixsamples were taken on different positions on the Gore Cover pile. The reportedvalueswereconverted from lb/1,000ft2 tokg/metric ton,on thebasisof the totalweightofgreenwastesintheaeratedstaticpile.Measurementswerecarriedoutfortwo types of feedstocks: greenwaste and greenwastemixedwith biosolids. Theresultsof themeasurementswereas follows:1.74kg/tonofhydrocarbons for thegreenwastefeedstockand0.81kg/tonforthegreenwaste/biosolidsmix.
Since it is assumed that biosolids are also added to the mixture for the Gorecompostingprocess, the valueof 0.81kg/tonof hydrocarbon emissionswasusedfortheLCAoftheGore‐Tex.

18
The carbon dioxide emissions were assumed to be the same as in the windrowcomposting scenario (350kg), since thedegradationprocess is the sameandCO2canpassthroughthemembraneGorecovers.
The ammonia emitted in the Gore Cover process ismuch lower than inwindrowcomposting:Only0.82kgpertonareemitted,accordingtoairemissionstudiesatthree different sites in theUS (Gore summary of emission control data, 2009), ascompared to 2.50 kg for windrow composting (Komilis and Ham, 2004). VOCemissions according to the same study are 0.09 kg/ton. The estimated total airemissionsfromtheGoreCoveroperationarelistedinTable6.
Table 6: Overview of the air emissions from the Gore Cover composting method. The carbon dioxideemissionsaresetequaltothewindrowcompostingmethodduetolackofdata.
Emissionstoair Amount(kg)
VOC,volatileorganiccompounds 0.09Ammonia 0.82Carbondioxide,biogenic 350Hydrocarbons,unspecified 0.8
Fertilizeryield
ThetotalvolumereductionduringtheGoreCoverprocessisabout35%.Sincethefeedstock has a higher nutrient content due to the foodwaste present (R. Zhang,2006), the compost product has a higher fertilizer value than that fromwindrowcomposting.For100%foodwaste,ifallnitrogen,potassiumandphosphorusinthefeedstockareassumedtoremaininthecompostproduct,theavoidedfertilizerforeachelement(NPK)9.1,1.5and3.0kgper tonofwet feedstock inputof theGoreCoverfacility.Table7showshowthefractionoffoodwastesinthefeedstockaffectstheelementalfertilizersreplacedbythefinalcompostproduct.
Table7:Replacedelemental fertilizerper tonofwet feedstockgoing into theASPGore cover facility forthreedifferentfractionsoffoodwasteintheyardwastemix.Yardwasteisassumedtohave20%masslossand60%moisturecontentofthecompostproductandfoodwasteisassumedtohave20%masslossand70%moisturecontentofthecompostproduct.
Fertilizereffectiveness 0%FW 20%FW 50%FW
kgN 6.4 7.49 9.13
kgP 0.96 1.16 1.46
kgK 2.56 2.72 2.97

19
3.3.3:InvesselaerobiccompostinginarotarydrumThismethodwasassessedinanLCAstudybyCabarabanetal.(Cabaraban,2007).Itwas estimated that 0.86 tons CO2,eq were emitted permetric ton of feedstock, ascomparedto1.54tonsCO2eqforabioreactorlandfill.
Figure 6: Schematic overview of the LCA process of invessel aerobic composting. Resources used andemissionsaredisplayedwithdottedarrows(Cabaraban,2007).
Theflowdiagramofin‐vesselcomposting(Figure6)showsthatinadditiontoyardwastes,soiledpaperandfoodresidualscanbeprocessedbythismethod.However,the authors did not mention the composition of the feedstock in terms of masspercentages.TheemissionofCO2equivalentsduringthein‐vesselcompostingwas0.36 tons per metric ton of waste processed. This is similar to the 0.35 tons ofbiogenic CO2 released during the windrow composting process. For the entireprocessof in‐vesselcompostingandthesubsequentstepofcuring,1.2tonsofCO2equivalents were emitted per metric ton of feed. Energy requirements werereportedtobe55kWhpertonofwaste.Sincenooutlineofthespecificenergyuseswasgiven,itwasassumedtobeallprovidedbytheelectricitygrid.
Otheremissionsfromthein‐vesselcompostingprocedureareshowninTable8.
20
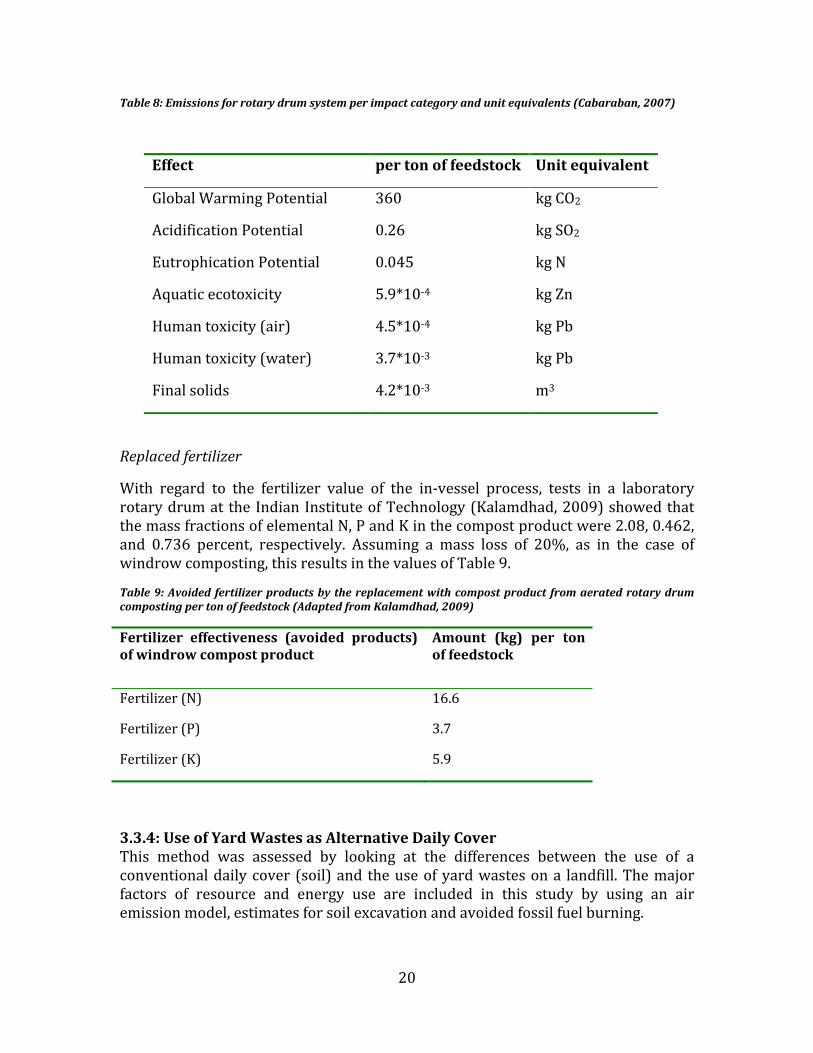
Table8:Emissionsforrotarydrumsystemperimpactcategoryandunitequivalents(Cabaraban,2007)
Replacedfertilizer
With regard to the fertilizer value of the in‐vessel process, tests in a laboratoryrotarydrumattheIndianInstituteofTechnology(Kalamdhad,2009)showedthatthemassfractionsofelementalN,PandKinthecompostproductwere2.08,0.462,and 0.736 percent, respectively. Assuming a mass loss of 20%, as in the case ofwindrowcomposting,thisresultsinthevaluesofTable9.
Table9:Avoidedfertilizerproductsbythereplacementwithcompostproduct fromaeratedrotarydrumcompostingpertonoffeedstock(AdaptedfromKalamdhad,2009)
Fertilizer effectiveness (avoided products)ofwindrowcompostproduct
Amount (kg) per tonoffeedstock
Fertilizer(N) 16.6
Fertilizer(P) 3.7
Fertilizer(K) 5.9
3.3.4:UseofYardWastesasAlternativeDailyCoverThis method was assessed by looking at the differences between the use of aconventionaldailycover(soil)and theuseofyardwastesona landfill.Themajorfactors of resource and energy use are included in this study by using an airemissionmodel,estimatesforsoilexcavationandavoidedfossilfuelburning.
Effect pertonoffeedstock Unitequivalent
GlobalWarmingPotential 360 kgCO2
AcidificationPotential 0.26 kgSO2
EutrophicationPotential 0.045 kgN
Aquaticecotoxicity 5.9*10‐4 kgZn
Humantoxicity(air) 4.5*10‐4 kgPb
Humantoxicity(water) 3.7*10‐3 kgPb
Finalsolids 4.2*10‐3 m3

21
Airemissionsandlandfillgascollection
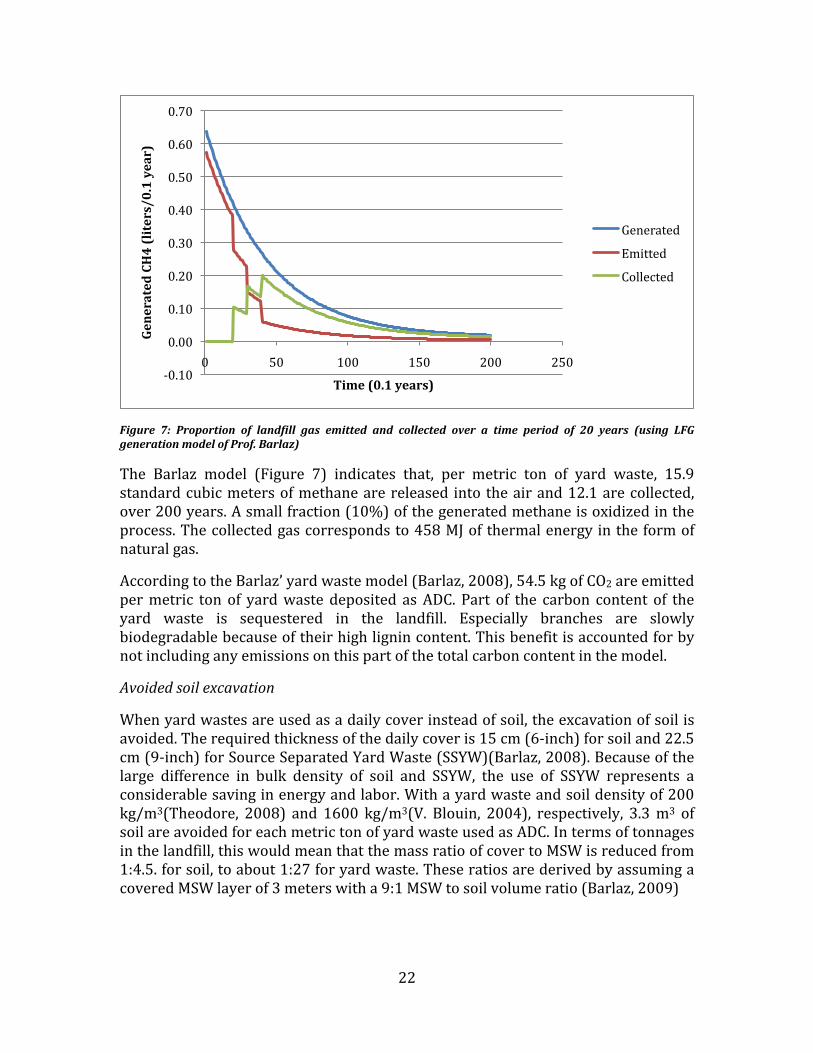
Thebiogasgeneratedinmodernlandfillsiscapturedandcanbeusedinagasengineor turbine togenerateelectricity.Theyardwaste that isusedasADC ina landfillalsodecayspartiallyandgeneratesbiogas.Inordertodeterminethefractionoftheyieldofmethanethatcanbeexpectedfromtheyardwaste,adecaymodelwasused.This model, developed by Prof. M. Barlaz, calculates the fraction of methanegenerated, collected and emitted. Themodel considers three constituents of yardwaste:grass(40%),leaves(40%)andbranches(20%).Allwereassumedtocontain50%moisture.Thedecayfunctionisexpressedasfollows:
rateofdecay=wLkekt (5)
wherew is the weight of dry material, L is the CH4 potential in liters/kg of drymaterial,andkthefirstorderratecoefficientofthedecayreaction.
ThemodeledlandfillinthisstudyisassumedtohavealandfillgascollectionsysteminstalledonaveragetwoyearsafterMSWisdepositedandcoveredwithyardwaste.Eight layers are deposited after the final cover is placed and the gas collectionsystemis installed.Thelandfillcellsarefilledevenlywith1,500tons/day,overanarea of 47 acres. With a total capacity of roughly 6 million cubic yards it takesapproximately4yearstofillup.Thecollectionof landfillgas inthistimeperiodisincrementally increasedovertime:Duringthefirst twoyears,gases(methaneandcarbondioxide)generatedbythedecayprocessareemitted.Then,inthethirdyear,aquarterofthegasesarecollectedwhiletheremainderisstillemitted.Inthefourthyear, collection efficiency is 50%.After the fourth year, 75% is collected and thisremains so until the end of the modeled time frame (20 years). This system ofphasedcollection is thecurrentpracticeof landfills in theUnitedStates(Barlazetal.,2009).Especiallybecausemostofthemethaneisgeneratedinthefirstyearsofthedegradationprocess,itisimportanttotakethisintoaccount.
ThiswasnotdoneinastudybytheresearchgroupofLosAngelesCountySanitationDistrict (LACSD, 2008). They assumed a collection efficiency of 91% for the LFGcollection system. According to the yard waste memo by Dr. M. Barlaz (Barlaz,2008), 9% of all the methane is generated already in the first 6 months ofdegradation,thismeansthattheestimateof91%canonlybevalidifthecollectionsystem is installed before the first six months of landfilling and that the LFGcollectionsystemwillbe100%efficientafterthisperiod.
22
Figure 7: Proportion of landfill gas emitted and collected over a time period of 20 years (using LFGgenerationmodelofProf.Barlaz)
The Barlaz model (Figure 7) indicates that, per metric ton of yard waste, 15.9standardcubicmetersofmethanearereleased into theairand12.1arecollected,over200years.Asmallfraction(10%)ofthegeneratedmethaneisoxidizedintheprocess.Thecollectedgascorrespondsto458MJofthermalenergyintheformofnaturalgas.
AccordingtotheBarlaz’yardwastemodel(Barlaz,2008),54.5kgofCO2areemittedpermetric ton of yardwaste deposited asADC. Part of the carbon content of theyard waste is sequestered in the landfill. Especially branches are slowlybiodegradablebecauseoftheirhighlignincontent.Thisbenefitisaccountedforbynotincludinganyemissionsonthispartofthetotalcarboncontentinthemodel.
Avoidedsoilexcavation
Whenyardwastesareusedasadailycoverinsteadofsoil,theexcavationofsoilisavoided.Therequiredthicknessofthedailycoveris15cm(6‐inch)forsoiland22.5cm(9‐inch)forSourceSeparatedYardWaste(SSYW)(Barlaz,2008).Becauseofthelarge difference in bulk density of soil and SSYW, the use of SSYW represents aconsiderablesavinginenergyandlabor.Withayardwasteandsoildensityof200kg/m3(Theodore, 2008) and 1600 kg/m3(V. Blouin, 2004), respectively, 3.3m3 ofsoilareavoidedforeachmetrictonofyardwasteusedasADC.Intermsoftonnagesinthelandfill,thiswouldmeanthatthemassratioofcovertoMSWisreducedfrom1:4.5.forsoil,toabout1:27foryardwaste.TheseratiosarederivedbyassumingacoveredMSWlayerof3meterswitha9:1MSWtosoilvolumeratio(Barlaz,2009)
‐0.10
0.00
0.10
0.20
0.30
0.40
0.50
0.60
0.70
0 50 100 150 200 250
GeneratedCH4(liters/0.1year)
Time(0.1years)
Generated
Emitted
Collected
23
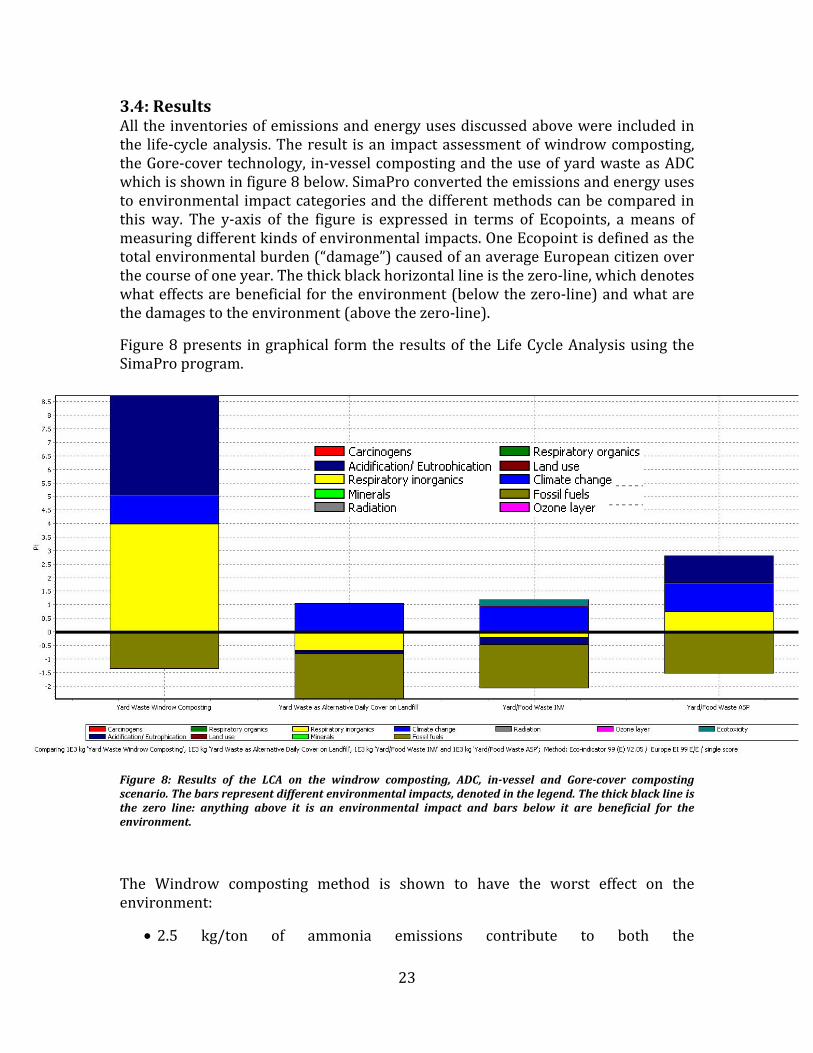
3.4:ResultsAlltheinventoriesofemissionsandenergyusesdiscussedabovewereincludedinthe life‐cycleanalysis.Theresult isan impactassessmentofwindrowcomposting,theGore‐covertechnology, in‐vesselcompostingandtheuseofyardwasteasADCwhichisshowninfigure8below.SimaProconvertedtheemissionsandenergyusestoenvironmental impactcategoriesandthedifferentmethodscanbecomparedinthis way. The y‐axis of the figure is expressed in terms of Ecopoints, ameans ofmeasuringdifferentkindsofenvironmentalimpacts.OneEcopointisdefinedasthetotalenvironmentalburden(“damage”)causedofanaverageEuropeancitizenoverthecourseofoneyear.Thethickblackhorizontallineisthezero‐line,whichdenoteswhateffectsarebeneficialfortheenvironment(belowthezero‐line)andwhatarethedamagestotheenvironment(abovethezero‐line).
Figure8presents ingraphical formtheresultsof theLifeCycleAnalysisusingtheSimaProprogram.
Figure 8: Results of the LCA on the windrow composting, ADC, invessel and Gorecover compostingscenario.Thebarsrepresentdifferentenvironmentalimpacts,denotedinthelegend.Thethickblacklineisthe zero line: anything above it is an environmental impact and bars below it are beneficial for theenvironment.
The Windrow composting method is shown to have the worst effect on theenvironment:
• 2.5 kg/ton of ammonia emissions contribute to both the
24
acidification/eutrophicationandrespiratoryinorganicscategories;
• The biogenic carbon dioxide produced by the biodegradation is the biggestcontributortoclimatechange.
Usingyardwasteasanalternativedailycoverhasthelowestoverallenvironmentalimpact of all four methods. It is shown that methane emission is the maincontributortonegativeimpactontheenvironment.ItisduetothepartofLFGthatis releasedprimarily in the firstmonthsafter theyardwasteADC isdepositedonthe landfill.The largestpositivecontributionofthisprocess isduetothemethanegasthatiscollectedbytheLFGcollectionsystem.
Thein‐vesselaerobiccompostingscenarioderives itsbeneficialscoremainlyfromtheavoidedproductoffertilizer.Therelativelylargeamountofenergyusedinthisprocess gives the in‐vessel technology its largest positive impact on theenvironmentintheformofclimatechange.
Ascanbeseen inFigure8, theGoreCovercompostingscenario (ASP)hassimilarclimate change impacts and fossil fuel use benefits compared to the windrowcompostingscenario.Thebigdifferencebetween these twomethods isdue to theability of ASP to reduce ammonia emissions, which lead to both impacts in theeutrophicationandrespiratoryinorganicscategories.
Table10showstheindividualscoresofeachprocessandthelistofcontributionstothe total scores by each single process. It can be seen that ammonia (2.5 kg airemissions)isthebiggestcontributortoboththewindrowcompostingscenarioandtheGorecovermethod.
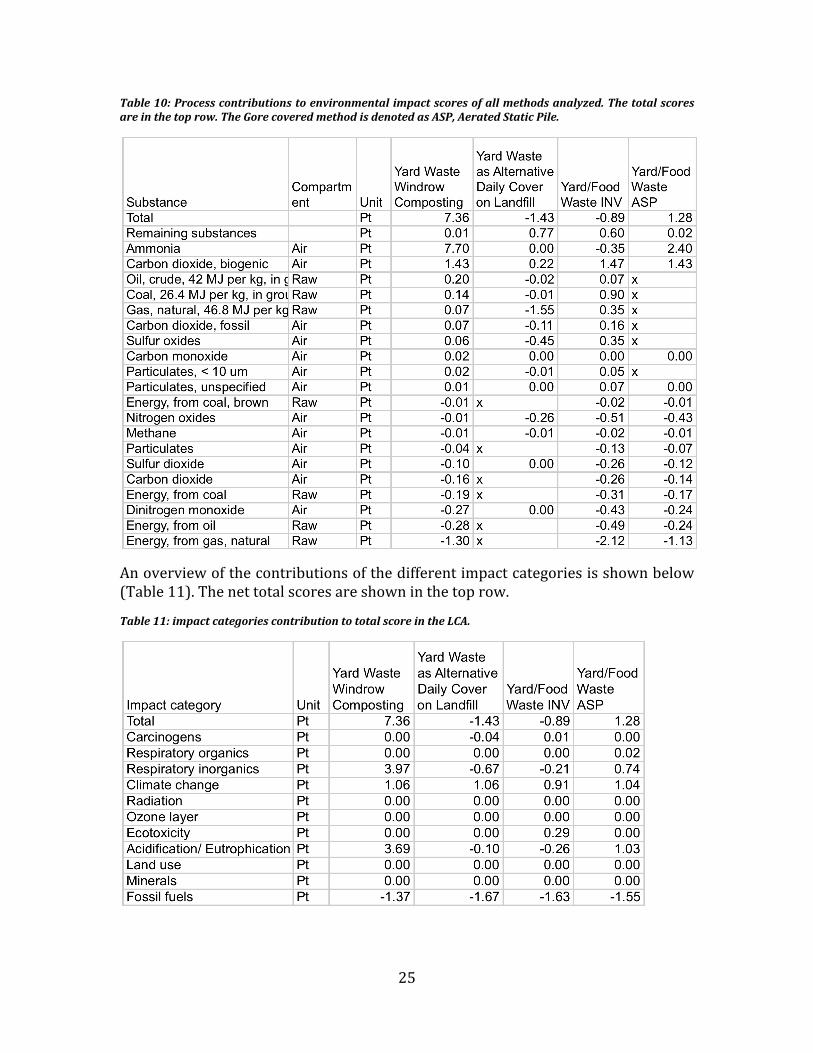
25
Table10:Processcontributionstoenvironmentalimpactscoresofallmethodsanalyzed.Thetotalscoresareinthetoprow.TheGorecoveredmethodisdenotedasASP,AeratedStaticPile.
Anoverviewofthecontributionsofthedifferentimpactcategoriesisshownbelow(Table11).Thenettotalscoresareshowninthetoprow.
Table11:impactcategoriescontributiontototalscoreintheLCA.

26
3.5:ResultsofLCAstudyOn thebasisof theLCAstudy, theuseof yardwasteas analternativedaily cover(ADC) isconcludedtobethebestwaytoprocessyardwastes. It ispreferredoverwindrowcompostingbecauseithasnonegativeeffectfromammoniaemissionsandtheGHGemissionsaresmall, incomparison to theCO2‐emissionsof thewindrow.TheADCprocesshastwootherbenefits:a)methaneisrecoveredintheprocess,andb) itavoidstheexcavationofheavysoil foruseasdailycover..Thecorrespondingavoided fossil fuel, for digging up and moving the soil, is similar to the energysavings by avoiding the manufacturing of the fertilizer replaced by the in‐vesselcompostingofonetonofyardandfoodwastes.
An important distinction should bemade between themethods that can processdifferentfeedstocks.Ifsource‐separationisdoneinawaythatyardwasteandfoodwastearecollectedseparately,thendisposaloftheyardwasteina landfillasADCanddisposalofthefoodwasteinanin‐vesselaerobiccompostingfacilitywouldbethebestoptions.However,iftheyarecollectedtogether,windrowcompostingandADCcannotbeappliedduetoodors.Inthatcase,in‐vesselcompostingortheGoreCovercompostingmethodshouldbeapplied,dependingontherespectiveemissionsinaparticularcase.
3.6:DiscussionofLCAResultsThe factor of transport of feedstock is not accounted for in this study. Sometechnologies allow facilities to be located nearmunicipalities where the waste isgenerated.Thisgivesthemanadvantageoverfacilitiesthatcannotbelocatednearthepointofgenerationbecauseoftheemissionsthatareassociatedwithtransport.However,preliminarycalculationsshowedthattransportisaminorcontributortothe overall impact assessment: the biogenic emissions from biodegradation, forinstance,arefarlargerthantheemissionsrelatedtothetransportofthewastewithtrucks.
Also, in this study itwasassumed that theyardwaste in theADCscenariowouldreplacea layerof soil.However, in someU.S. landfills tarpaulinsorother typesofADC are used instead of soil. LCA comparison with such covers was beyond thescopeofthisstudy.
CHAPTER4:CostStudyInadditiontocomparingtheenvironmental impactofthefourmethodsoforganicwasteprocessing, it isessential toalsoput thesemethodssidebyside intermsofcapitalandoperatingcosts.Thefinalunitofcomparisonthatiscalculatedforeachtechnology is $/metric ton of feedstock. This number includes repayment of thecapitalcostoftheplant(annualizedover15yearsatanassumed6%interestrate)andoperationandmaintenance(O&M)costs.
Thecostpertonoffeedstockforasiteusuallydecreasesastheannualthroughputofthe facility increases. Therefore, in order to make a fair comparison, a fixed

27
throughputforallplantswaschosenof40,000tons/year.Thisisacommonfigureforindustrialscalecompostingplants.
In the following sections, each method is analyzed separately. As will becomeapparent, somemethodsrequirea larger initial investment thanothers.Theextracost for systems often translates into higher controllability of odors and betterthroughputperarea.Thisextrainvestmentcanthereforebeinterestinginthecaseofacompostingplantnearmunicipalitieswhereodorsmustbe limitedandwherelandisexpensive.
CostsaredividedintoinitialinvestmentandO&Mandcosts.Becauseofthelackofdata, assumptionsaremadeabout cost categoriesusingdataavailable fromothersystems. Also, it is important to note that initial investment costs have beenannualizedassuminga15‐year lifetimeof the systemanda6% interest rate.Thecosts of the land are included in the operation andmaintenance costs under thecategory‘SiteLease’.Thefinalresultsofthecalculationswerethencomparedwithsourcesfoundincompostingreportsandsurveys.
The revenue from end products of composting are not taken into account in thisstudy, since the quality of the products of various composting technologies differwidely from location to location, as do the prices forwhich the end products aresold. Sometimes quantities are given away for nothing (Nantucket Visit 2008,Appendix B), or it is sold for prices ranging from $10/ton (Clemson University,2009)to$31perton(CedarGrovecomposting,2009).
4.1:WindrowCompostingTurned windrow composting is common practice in industrial scale compostingplants. However, some plants are more sophisticated than others and thereforeinvestment costs range considerably. For instance, preparation of the site thatincludespavingisasignificantpartofthetotalinvestmentbutitisnotanecessityfor a composting plant. Komilis and Ham reported costs for a 100 ton/daycomposting plant thatwas equippedwith a leachate collection systemwhere thesitewaspavedfor$180,000perhectare.About5.5hectareswereusedfortheplantso the total paving jobwas $1,000,000, amounting to a third of the total cost. Ofcourse, such an investment contributes to a lower environmental impact of thesystem.Fortunately,thesamestudywasusedasasourceofdatafortheLCAstudy,sothecostsareinlinewiththeenvironmentalimpact.Table12showsthedifferentcostcategoriesadaptedtoa110ton/dayfacility(orapproximately40,000tonsperyear).

28
Table12:Breakdownofcostsforthewindrowcompostingmethodfora110ton/dayfacility(KomilisandHam,2004)
CapitalCostcategory Cost
Paving $1,100,000Grading $82,500Fencing $22,000Building $550,000Leachatesystem $110,000Engineeringcost $550,000TubGrinder $275,000Windrowturner $220,000Legal $165,000Screens $220,000Frontendloader $198,000Total $3,492,500
Thetotalcostfora40,000ton/yearplantwasthenannualizedassuminga15yearlifetime and 6% interest of repayment. This resulted in a total cash flow of$5,635,000.Inordertocalculatethedollarsperton,thisamountwasdividedbythetotaltonnageprocessedintheplant’slifetime,resultingtoabout9$/ton.Notethatthisdoesnotincludethecostforlandproperty,whichisincludedintheO&Mcostsdiscussedbelow.
Operationandmaintenance fora40,000 ton/yearwindrowcompostingaddup toabout$473,000annually,or12$/ton.Labor(includingoverhead)andsiteleasearethe biggest contributors to the operation costs with amounts of $264,000 and$110,000,respectively.Table13showstheO&Mcostsofsuchafacility.
Table13:OperationandMaintenancecostsfora40,000tons/yearwindrowcompostingplant
O&MCostcategory Cost
Labor $187,000Overhead $77,000Windrowturner $27,500Tubgrinder $55,000Screens $5,500Frontendloader $5,500Building $5,500Sitelease $110,000Total $473,000
TherangeofcostsinwindrowcompostingwasstudiedbySteutevilleandreportedin the magazine BioCycle in 1995. Although the data is outdated, it shows thedifference in costs per ton due to extra steps in the process (shredding andscreening).Displayedbelowisatablewiththeresultsofhissurvey.Thetotalcost
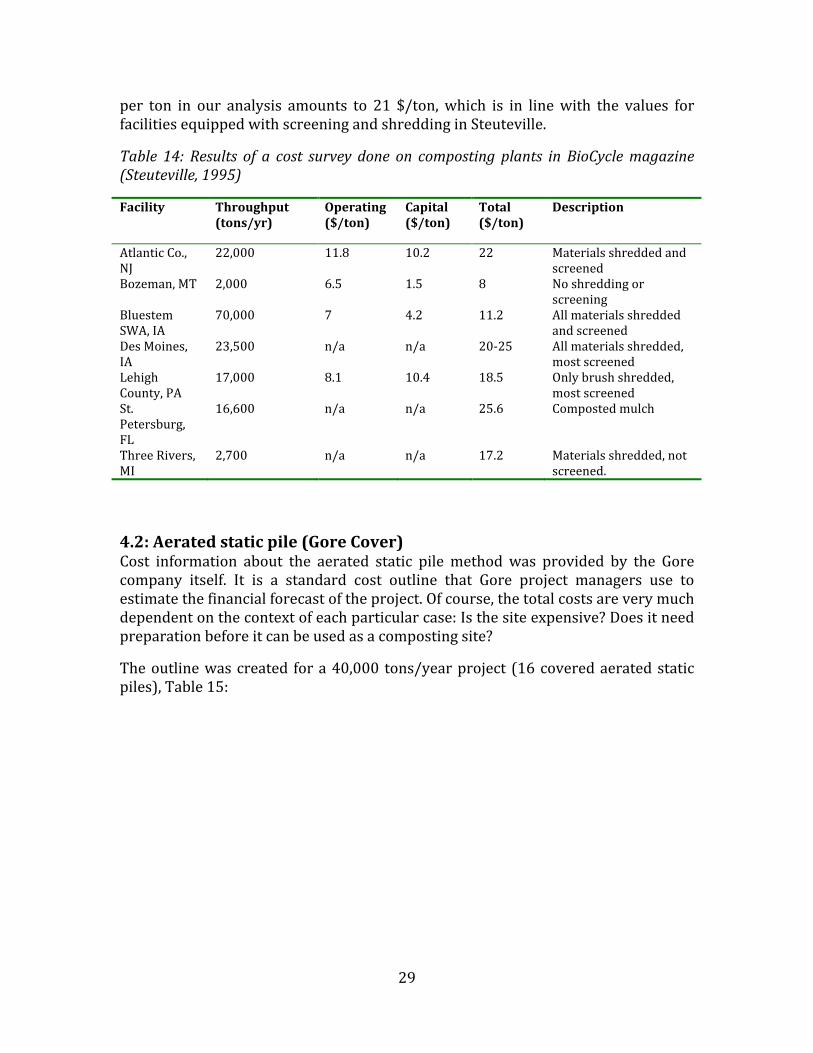
29
per ton in our analysis amounts to 21 $/ton,which is in linewith the values forfacilitiesequippedwithscreeningandshreddinginSteuteville.
Table 14: Results of a cost survey done on composting plants in BioCyclemagazine(Steuteville,1995)
Facility Throughput(tons/yr)
Operating($/ton)
Capital($/ton)
Total($/ton)
Description
AtlanticCo.,NJ
22,000 11.8 10.2 22 Materialsshreddedandscreened
Bozeman,MT 2,000 6.5 1.5 8 Noshreddingorscreening
BluestemSWA,IA
70,000 7 4.2 11.2 Allmaterialsshreddedandscreened
DesMoines,IA
23,500 n/a n/a 20‐25 Allmaterialsshredded,mostscreened
LehighCounty,PA
17,000 8.1 10.4 18.5 Onlybrushshredded,mostscreened
St.Petersburg,FL
16,600 n/a n/a 25.6 Compostedmulch
ThreeRivers,MI
2,700 n/a n/a 17.2 Materialsshredded,notscreened.
4.2:Aeratedstaticpile(GoreCover)Cost information about the aerated static pilemethodwas provided by the Gorecompany itself. It is a standard cost outline that Gore project managers use toestimatethefinancialforecastoftheproject.Ofcourse,thetotalcostsareverymuchdependentonthecontextofeachparticularcase:Isthesiteexpensive?Doesitneedpreparationbeforeitcanbeusedasacompostingsite?
Theoutlinewascreated fora40,000 tons/yearproject (16coveredaeratedstaticpiles),Table15:
30
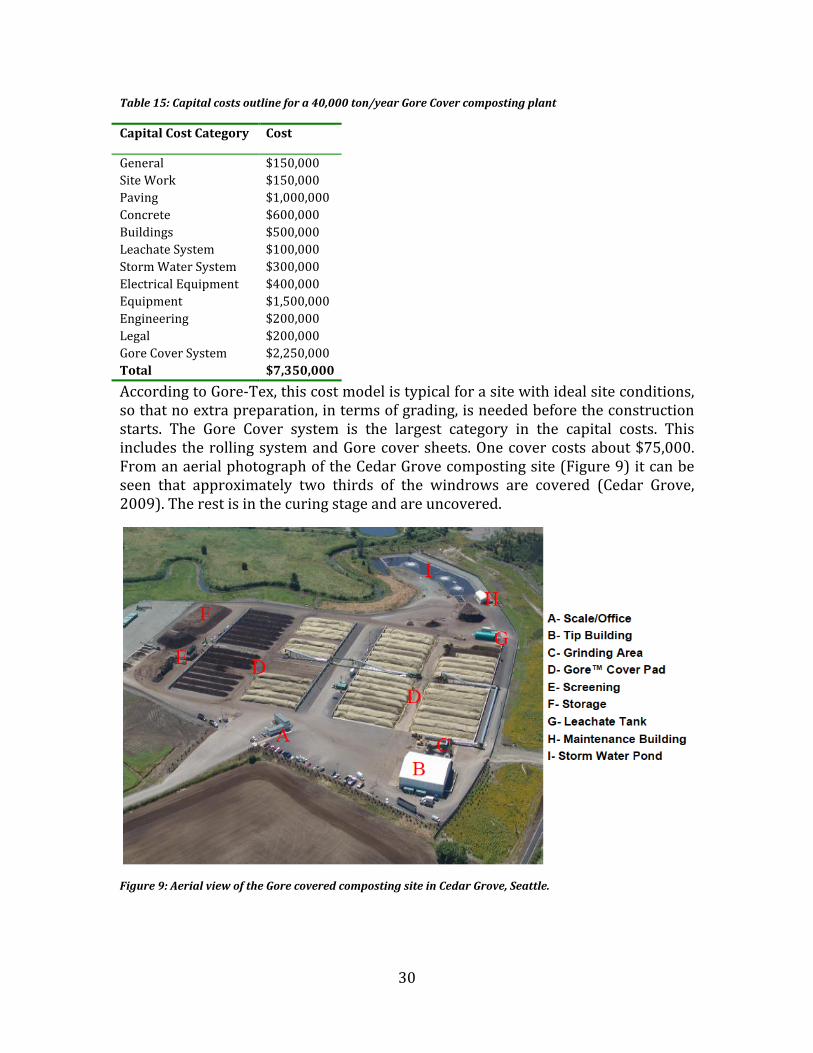
Table15:Capitalcostsoutlinefora40,000ton/yearGoreCovercompostingplant
CapitalCostCategory Cost
General $150,000SiteWork $150,000Paving $1,000,000Concrete $600,000Buildings $500,000LeachateSystem $100,000StormWaterSystem $300,000ElectricalEquipment $400,000Equipment $1,500,000Engineering $200,000Legal $200,000GoreCoverSystem $2,250,000Total $7,350,000
AccordingtoGore‐Tex,thiscostmodelistypicalforasitewithidealsiteconditions,sothatnoextrapreparation,intermsofgrading,isneededbeforetheconstructionstarts. The Gore Cover system is the largest category in the capital costs. Thisincludes therollingsystemandGorecoversheets.Onecovercostsabout$75,000.FromanaerialphotographoftheCedarGrovecompostingsite(Figure9)itcanbeseen that approximately two thirds of the windrows are covered (Cedar Grove,2009).Therestisinthecuringstageandareuncovered.
Figure9:AerialviewoftheGorecoveredcompostingsiteinCedarGrove,Seattle.

31
With16windrows,anestimated12windrowsarecovered,whichcosts$900,000.ThisisalittlelessthanhalfofthecostforallGorecomponents.Afterannualizingthetotal costandassuminga15year lifetimeandpaybackperiodat6% interest, thecalculatedcostpertonis$20/ton.
OperationandmaintenancecostsarealsoprovidedbyGoreinthesamecostmodelfora40,000tonsperyearfacility(Table16).
Table16:Annualoperationandmaintenancecostsfora40,000tons/yearGorecompostingplant
O&MCostcategory Cost
General&Administration $75,000Insurance $50,000Fuel/Supplies $50,000ContractedServices $10,000Payroll $250,000RepairsandMaintenance $100,000Electricity $20,000AccountingandLegal $25,000ResidualDisposal $20,000HostBenefits $35,000SiteLease $100,000GoreReplacementCost(2covers/year) $150,000Total $885,000
ItcanbeseenthatthepayrollforworkersisthelargestitemintheO&Mcosts.Itisnearly the same as the $264,000 of payroll in thewindrow composting scenario.Electricity amounts to $0.5/ton, i.e. about 3.5 kWh/ton, assuming a $0.14/kWhelectricity price. According to the Gore Visit notes (Gore Visit notes, 2008), theenergy needed for the blowers, computers and probes amounts to 0.75 kWh/ton(Gore trip notes, 2008). Electricity and fuel are also used for the rolling stock,grinders,screensandbiofilters.
A study done by Gore (Gore Associates, 2008) has shown that Gore Covercompostingsiteshaveashorterresidencetimeandupto4timeshigherthroughput(inthecompostingarea)thanatconventionalwindrowcompostingsites.Therefore,theGoresiterequiresasmallercompostingareaforthesamethroughput.However,becausetheGoresitecanbelocatedclosertomunicipalitieswherethelandismoreexpensive,itisassumedthattheoverallcostofthelandisthesameasforwindrowcomposting.
Gore incorporated the cost of replacing the covers in the model. Replacing twocovers per yearwould amount to $150,000 dollars.With 16windrows and threequartersofthemcoveredataparticulartime,thiswouldmeanthatthecoversareexpectedtolastforroughly6years.

32
ThetotalO&Mcostsare$885,000peryear,or$22/ton.Adding thecostofcapital($20/ton), results in$42/ton total.This is in linewithcorrespondencewithBrianFuchsofGoreTex,whostatedthatthecostsofGorecompostingare$40±$10,withthe error incrementdependingon the sizeof theplant. Small plants cangoup to$50/ton and large ones to $30/ton (Brian Fuchs, 2009). The Gore plant at CedarGrove reported a tipping fee of $42/ton (Gore trip notes, 2008). This is for a160,000tons/yearplantandincludesprofits.
4.3:InvesselaerobiccompostingwitharotarydrumIn‐vessel rotary drum composting is very capital intensive. Unlike the othercompostingmethods,itinvolvesalotofheavymachinery.Also,turning,loadingandunloadingoftherotarydrumsisverylaborandenergyintensive(55kWhofenergy,as stated earlier). In return for this high cost, this system has a lower land arearequirementandoffershighprocesscontrol.
Capital costs for this method (Table 17) are estimated by using cost data for a40,000ton/yearplant. Inadditionto therotatingdrumcost, thereareothercostssimilartothoseencounteredinwindrowcompostingandaeratedstaticpile.Table17showsallthecapitalcosts.
Table17:Capitalcostsfora40,000tons/yearinvesselrotarydrumplant.
Capitalcostcategory Cost
RotatingDrums(18) $4,500,000FrontEndLoader $315,000SurfaceConcreteandAsphalt $307,000LeafShredder $200,000Buildings $500,000Engineering $200,000Legal $200,000Total $6,272,000
The capital cost of the rotating drumswas scaled up from a 2,200 ton/year costmodel,whichwas stated tobe$250,000 fora6 tons/dayplant.Thus,18 rotatingdrum reactors are needed for a 40,000 ton/year composting plant. The front endloadercategorywasnotscaledupwiththesamefactor,becauseitisnotconstantlyusedliketherotatingdrums.Instead,afactor3wasused.Likewise,afactor4wasused for the leaf shredders. The same was done with the surface concrete andasphalt:a factor5wasapplied,assuming thatapproximately1/3of theasphaltedareaneededwasused for theactualdeviceand that2/3of thearea isofficesandother‘common’equipment.
Thecapitalcostperton,assuminga15‐yearlifetimeperiodat6%interest,amountsto$17/ton.Other sources report capital costsof in‐situvessels tobebetween3.3and8.25milliondollars,i.e.about8to$21/ton.

33
Abreakdownofin‐vesseloperationandmaintenancecostscouldnotbefoundintheliterature. However, an EPA report (EPA [3], 2009) provided the operation andmaintenancecostsperdry tonofhandledwaste in in‐vessel composting. It statedthatO&Mcostsvarywidelybecauseofthedifferenttechnologiesandthroughputsofplants.A1989survey(Alpertetal.,1989)foundoperationandmaintenancecostsbetween$61and$534perdryton,whichis31to$267/wetton,assuminga50%moisturecontent.Amorerecentstudy foundcompostingcostof$100 to280/dryton($50to$140/wetton)within‐vesselcompostingonthehighendofthisrange(o’Dette, 1996) (EPA, 2000 [1]). Another source estimated the cost to range from$188 to 250/dry ton (Shammas, 2007). Again, with a 50%moisture level, this isapproximately 94 to over $125/wet ton, which is the desired unit in this study.Averagedout,O&Mcostsofabout130dollarswereassumed.
AccordingtotheEPA,thefollowingitemsaretobetakenintoaccountinestimatingcostsforaspecificin‐vesselcompostplant:
• Landacquisition.• Equipmentprocurement,includingthecompostingvessel,loading
equipment,conveyors,airsupplyequipment,temperaturemonitoringequipment,andodorcontrolequipment.
• Operationandmaintenancelabor.• Additives,suchasbulkingagents,tobeusedinthespecificvesselselected.• Energy(electricityandfuelforequipment).• Waterandwastewatertreatment.• Equipmentmaintenanceandupkeep.• Productdistributionexpensesandmarketingrevenues.• Regulatorycomplianceexpensessuchaspermitting,productanalysis,
processmonitoring,recordkeepingandreporting;• Preprocessingequipment.(EPA,2000[2])
AddinguptheabovenumbersresultsinanestimateoftotalcapitalandO&Mcostsofabout$150/tonfora40,000ton/yearoperation.
4.4:UseofyardwasteasanalternativedailycoveronalandfillFor theADC‐scenario, there isnoneed tohaveaplantbuilt toprocess thewaste.Themethodreplacestheuseofsoilinalandfillwithwaste.Forthelandfillowner,thismeansthatthere isnoneedtodigupasmuchsoil,plusthere ismorelandfillspace to use in an existing landfill. Two separate streams of waste go into thelandfill, municipal solid waste (MSW) and source‐separated yard waste (ADC).Thesematerialsarechargeddifferenttippingfees.Forexample,alandfillinAzusa,California,charges$14pertonforincomingyardwastethatisusedasADC(Azusa,2009). In comparison, themedianMSW tipping fee in the year2000 inCaliforniawas$34perton(CIWMB,2000).
34
With regard to the total cost of ADC scenario, it depends fromwhat perspectivecostsareevaluated.Ifthecompanyownsalandfill,thenadecisiontouseyardwasteas ADC can save in capital and operating costs for heavy machinery. Less soilexcavatorsanddump truckswillbeneededand the frontend loadersand landfillcrawlersusedtospreadoutthedailycoverwillkeeptheirfunctionbuttheywillbespreadingoutadifferentmaterial.Typicalpricesofsoilexcavatorsanddumptrucksare $250,000 (Caterpillar 345 cl excavator) and $100,000 (Caterpillar 740ArticulatedDump truck) (ironplanet.com,2009).According toEMCON, the cost toimport and place soil on a landfill is about $2 per cubic yard (EMCON, 1997).Assuminga1‐millioncubicyardlandfill,approximately$500,000wouldbespentondepositingsoil.ShreddingofMSWtypicallycosts$8perton,withapproximately$4pertonforbothO&Mandcapitalcosts(Fitzgerald,2009).
The value of space in a landfill is also important in considering the differencebetweenusingsoilandADC.Witha$30/tontippingfeeforMSWata1millioncubicyardlandfill,thevalueofthespacesavedbyusingADCisapproximately$3,000,000(assumingrefusetosoilratioincreasefrom4:1to9:1)(Haughey,2001).Inaddition,the landfill owner can charge a tipping fee for the incoming yardwaste, as in thecaseoftheAzuzalandfillmentionedearlier.
Ifthelandfillisnotownedbythewastemanagingcompany,theyardwastecanbebroughttotheclosestlandfill.Atippingfeeof$14pertonisassumedforthecosts(liketheAzusa,CAlandfill),withoutincludingtransportcosts.
For the overall comparison, it is assumed that the landfill is not owned by theorganicwastemanagingcompanyandthatthecostisthereforeequalto$14perton.
4.5:ResultsThecapitalcostsandO&McostsofthefourtheorganicwasteprocessingmethodsareshowninTable18below.
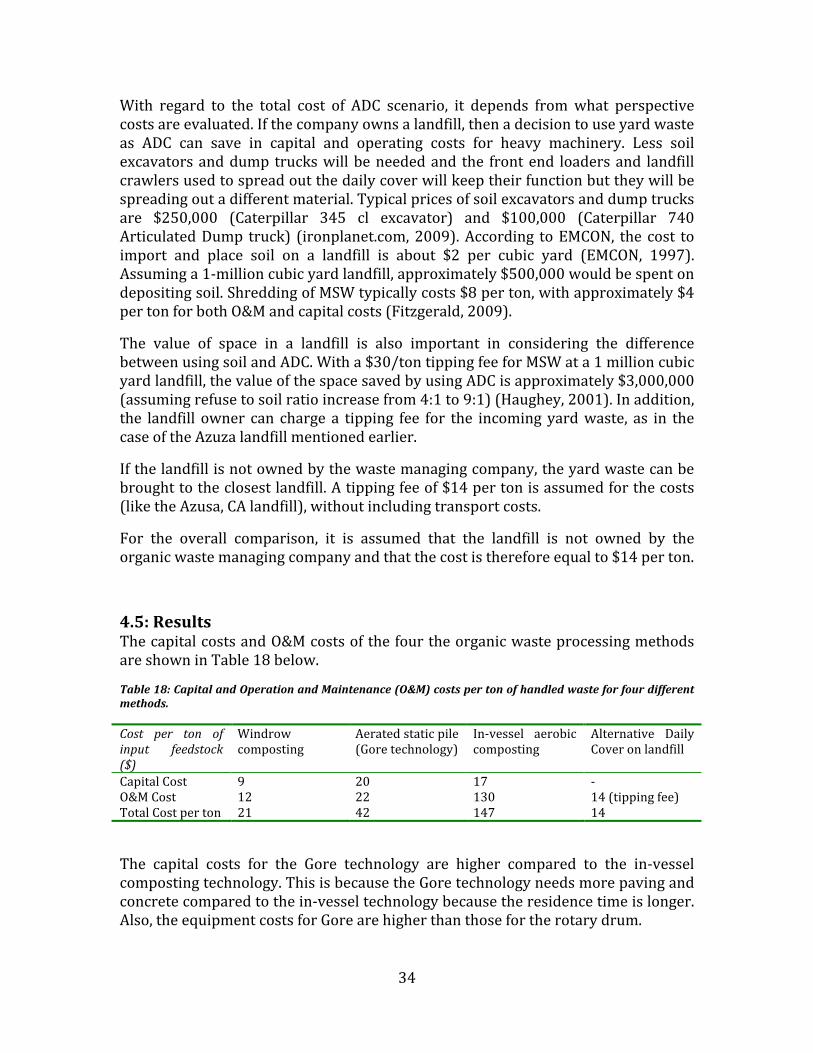
Table18:CapitalandOperationandMaintenance(O&M)costspertonofhandledwasteforfourdifferentmethods.
Cost per ton ofinput feedstock($)
Windrowcomposting
Aeratedstaticpile(Goretechnology)
In‐vessel aerobiccomposting
Alternative DailyCoveronlandfill
CapitalCost 9 20 17 ‐O&MCost 12 22 130 14(tippingfee)TotalCostperton 21 42 147 14
The capital costs for the Gore technology are higher compared to the in‐vesselcompostingtechnology.ThisisbecausetheGoretechnologyneedsmorepavingandconcretecomparedtothein‐vesseltechnologybecausetheresidencetimeislonger.Also,theequipmentcostsforGorearehigherthanthosefortherotarydrum.

35
TheADCmethodhasthelowestcostofallfourmethods,at14$/ton.Thisfigureisjustthetippingfeeofalandfill.However,fromtheperspectiveofthelandfillowner,the use of yard waste as daily cover will actually result in additional revenues,becauseof the increasedrefusecapacityand the loweruseof soil, incombinationwithatippingfeeasanextraincome.
Thein‐vesselaerobiccompostingscenariohasoperationandmaintenancecostsfarexceeding any othermethod. This is probably due to high energy needs andhighmaintenancecostoftherotatingdrums.
With $21 and $42/ton,windrow composting andGore‐covered aerated static pilecompostingareinthemid‐rangeofthefourprocesses.
CHAPTER5:OperationandoutputeffectsstudyInadditiontoassessingtheenvironmental impactandcostsoftheseveralorganicwaste processingmethods, it is also important to rate thesemethods in terms oftheirusabilityandflexibility.Forexample,amethodmaybecosteffectiveandhaveminimal environmental impact, but strong odor emissions can lead to problemswithsurroundingcommunities.Anumberofcriteriahavebeenselectedinordertoassessthemostimportantoftheseissues.Thelistincludes:
• Areaneeded• Odorproblems• Inputmaterialflexibility(abilitytohandledifficulttocompostmaterials)
It is critical to note that these criteria are very location specific. Some locationsrequirestrictodorcontrolbecausemunicipalitiesarenearby. In theMulti‐CriteriaAnalysis,weighting factorscanbeadjustedaccordingly toassess these issues:onecompanymightfindodorproblemsforaspecificsitemoreimportantthantheareaneededforthecompostingoperations.
5.1:AreaneededTheareaneededforcompostingoperationscanbedividedintwoparts:Anareaforadministration/maintenance and another for the actual composting operations(tipping area, leachate collection system and the area needed for thewindrows/compostingsystems).Thefirstisnotverymuchdependentonthesizeofthe plant. In contrast, the latter is directly proportional to the throughput of thecomposting facility. Retention times affect the area needed and therefore a highdegradationrateisdesirable.Forindustrialscaleplants,officesandadministrationonlytakeupasmallpartofthetotalareaneeded.Forexample,intheGoreplantatCedarGroveonlyaneighthofthetotalareaisforadministrationandmaintenance;therestismostlycoveredwindrowsandroomforthetruckstoloadandunload.
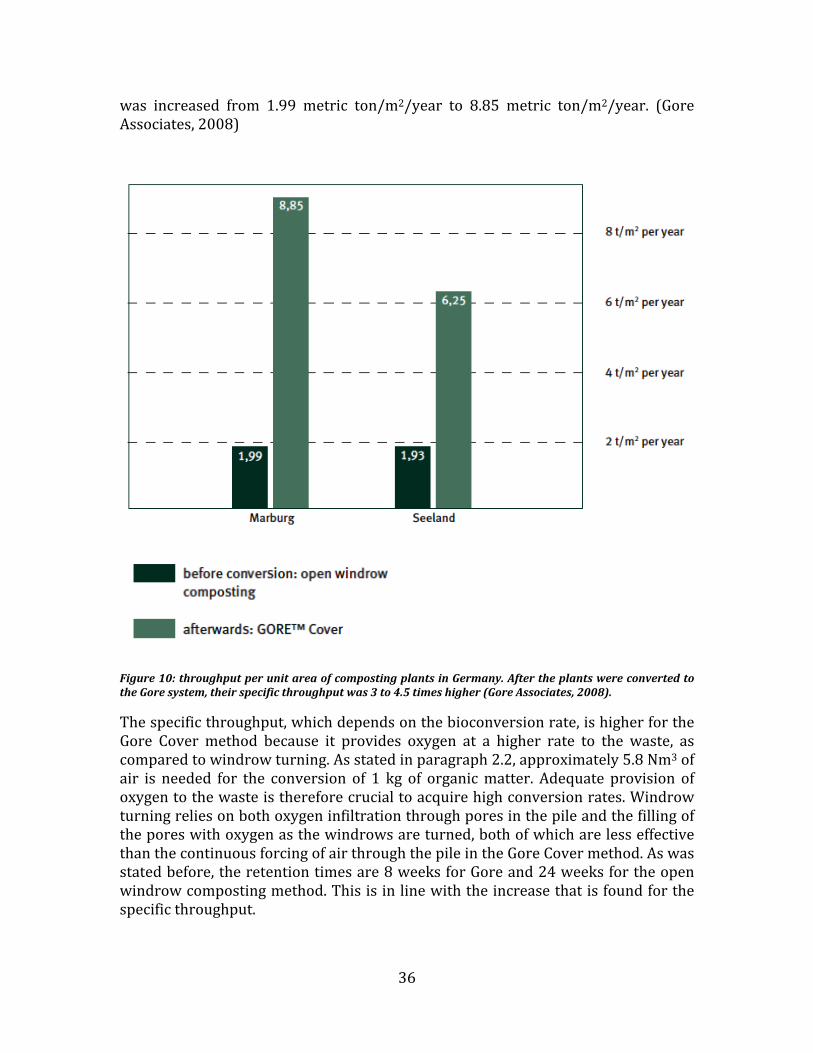
BecauseoftheshorterresidencetimesrequiredbytheGoreCovertechnology,thethroughput of feedstock per square meter and unit time is much higher than inwindrow composting (Figure 10).. At Marburg, Germany, the specific throughput
36
was increased from 1.99 metric ton/m2/year to 8.85 metric ton/m2/year. (GoreAssociates,2008)
Figure10:throughputperunitareaofcompostingplantsinGermany.AftertheplantswereconvertedtotheGoresystem,theirspecificthroughputwas3to4.5timeshigher(GoreAssociates,2008).
Thespecificthroughput,whichdependsonthebioconversionrate,ishigherfortheGore Cover method because it provides oxygen at a higher rate to the waste, ascomparedtowindrowturning.Asstatedinparagraph2.2,approximately5.8Nm3ofair is needed for the conversion of 1 kg of organicmatter. Adequate provision ofoxygentothewasteisthereforecrucialtoacquirehighconversionrates.Windrowturningreliesonbothoxygeninfiltrationthroughporesinthepileandthefillingoftheporeswithoxygenasthewindrowsareturned,bothofwhicharelesseffectivethanthecontinuousforcingofairthroughthepileintheGoreCovermethod.Aswasstatedbefore,theretentiontimesare8weeksforGoreand24weeksfortheopenwindrowcompostingmethod.Thisisinlinewiththeincreasethatisfoundforthespecificthroughput.
37
The rotary drum technology requires a small active composting area for the firststageofdegradationintherotarydrums.Ithasashortresidencetimeinthedrumsaswasmentionedinparagraph2.3(1to6days).However,thecuringstagetakesupto 3 months of time. According to the Clean Merseyside Centre in the UnitedKingdom, a30,000‐tonsperyear in‐vessel compostingplant requires about8,700m2ofcompostingarea(MerseysideCentre,2005).Thisamountsto3.4tons/m2peryear,primarilybecauseof the largewindrowareaneededfor thecuringstage. In‐vessel technologies can therefore be rated somewhere in between windrow andGorecoveredcompostingwithregardtolandrequirement.
5.2:OdorproblemsComposting of organic waste often is pairedwith odors. Odors emitted from thewasteprocessingcanbecomeproblematicifthesiteislocatednearmunicipalities.Many large MSW composting facilities throughout the US have been shut downbecause of odors. This happened to facilities in Portland, Oregon, Dade County,Maryland and Pembroke Pines, Florida, mainly because they were not equippedwith an odor control system (Epstein, 1996). Other plants had to modify theiroperationsbecauseofsimilarreasons.
Awindrowcompostingplant intheNiagaradistrictof theProvinceofOntariohashadtodealwiththeseissuessince2002(SURCompostingReport,2008).Apledgetodivert60%oftheMSWfromlandfillsledtoadecisiontoseparateorganicwasteand toput it inbins.Two‐thirdsof thehouseholdspurchased thesebins andalsostarted separating plastic, glass and paper. At the composting site, the source‐separatedorganicsweremixedwithwoodchipsasabulkingagentandthemixwasshredded. The diversion rates increased to 46% but by 2004 residents startedcomplaining thatodors fromoneof the twocompostingplants causedheadaches,nauseaandsorethroatsbetweenMayandAugust.Thewindrowswereshutdownand the municipality spent over 1.5 million dollars on a vapor extraction andtreatment system and also introducedwindrow size restrictions. However, odorsstillremainedaturn‐offforresidentsandpublicparticipationfellfrom80%to20%.
Generation of odors occurs mainly in the first stage of degradation because thedecompositionrateishighestatthatpoint.Also,theodorgenerationisverymuchdependent on the feedstock used. Rapidly decomposing biosolids generate moreodors than clean yard trimmings, for instance. Odors also depend on the type ofcompostingsystem,operationof facility. Indoorcomposting inanairtightbuildinggives thepossibility topump theair throughabiofilterbefore it isemitted to theatmosphere.At theMaterialsRecyclingFacility (MRF) inNantucket visitedby theauthor,acompanycalledWasteOptionsinstalledaningeniousodorcontrolsystem.They pump the odorous air from the buildings through underground pipes to a20,000 ft2 building filledwith a 3 feet highpile ofwoodchips.Under this layer ofwoodchips,thereisbaseofporousgravelunderwhichthepipesarelocated.Theairseepsthroughholesinthepipesandthenmovesupthroughthelayerofwoodchips
38
whereitisfilteredfromodorouscompounds.Thesystemisverycost‐efficientandeffectiveinodorcontrol(NantucketVisitnotes,2009).
Ofcourse,openwindrowcompostinghasmoreproblemswithodorsthanenclosedmethods.Feedstockswithhighodorgenerationarethereforenotusedinwindrowcomposting. Several states in theUShaveput restrictionsonbuilding compostingplants nearbymunicipalities and hospitals. In New York, for instance, a 500 feetbuffer is required forMSWand biosolid composting plants and 200 feet for yardwastecomposting.Mainerequiresabufferof500feetforanytypeofplantandNewJerseyaminimumbufferdistanceof150feetforleafcompostingsites.Californiasetitat300feetforanycompostingplant(Epstein,1996).
Odorsareoftenexpressedbyadilution‐to‐thresholdratio(D/T).TheED50numberisthenumberofdilutionsrequiredfor50%ofagroupofpeopletodetecttheodors.Commonodorouscompoundsincompostingareammonia(NH3),hydrogensulfide(H2S), dimethyl disulfide ((CH3)2S2), dimethyl sulfide ((CH3)2S) and limonene(C10H16).
Temperatures andmoisture in thepile also affect odor generation in composting.AccordingtoEpstein(Epstein,1996),odorgenerationdecreasesastemperaturesinthe pile increase. This would infer that odors are higher in winter than in thesummer,butthisisnotnecessarilytrue:VanDurme(VanDurme,1990)comparedodorsfromacompostingplantthroughouttheyearandfoundthatlevelsmeasuredin Junewere higher than inOctober. Themoisture content in the piles positivelyaffect odor levels generated. Thus, controlling moisture in the piles makes itpossibletooptimizedegradationandminimizeodorproblems.
Since so many parameters affect the odor generation in a plant, it is difficult tocompareindividualfacilities..Table19presentstheresultsofastudybyVanDurme(VanDurme,1990)thatmeasuredconcentrationofseveralodorouscompoundsatdifferenttypesoffacilities.ItcanbeseenthatthereisawiderangeofEffectiveDose(ED50) values within the same type of facility, even for the one with the samefeedstock.Therefore,itisnotpossibletoconcludefromthesemeasurementswhichoperationisbetterthananother.
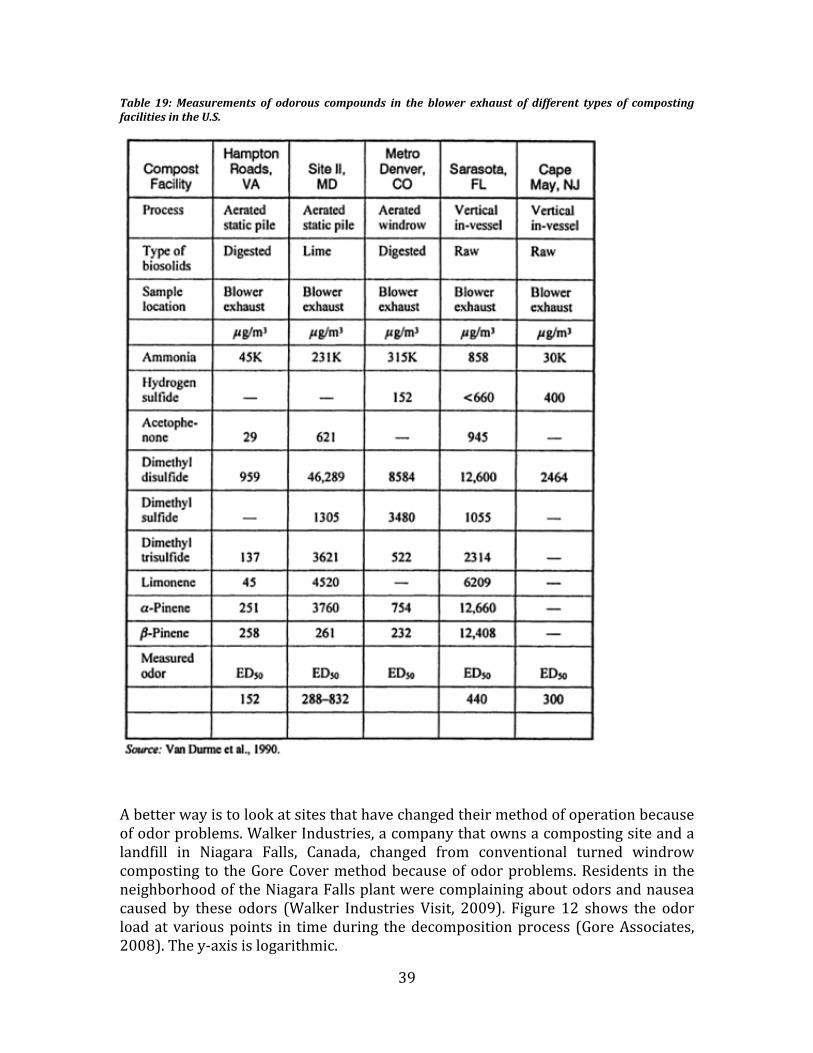
39
Table 19: Measurements of odorous compounds in the blower exhaust of different types of compostingfacilitiesintheU.S.
Abetterwayistolookatsitesthathavechangedtheirmethodofoperationbecauseofodorproblems.WalkerIndustries,acompanythatownsacompostingsiteandalandfill in Niagara Falls, Canada, changed from conventional turned windrowcomposting to theGoreCovermethodbecauseofodorproblems.Residents in theneighborhoodoftheNiagaraFallsplantwerecomplainingaboutodorsandnauseacaused by these odors (Walker Industries Visit, 2009). Figure 12 shows the odorloadatvariouspoints in timeduring thedecompositionprocess (GoreAssociates,2008).They‐axisislogarithmic.
40
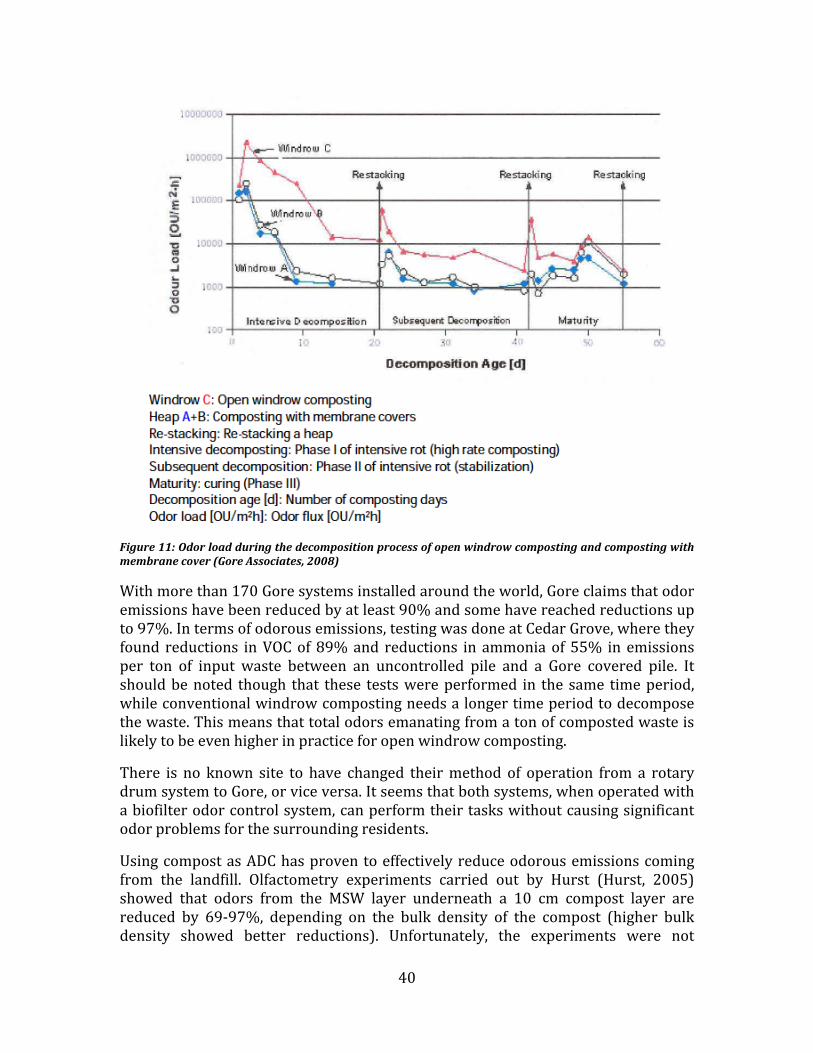
Figure11:Odorloadduringthedecompositionprocessofopenwindrowcompostingandcompostingwithmembranecover(GoreAssociates,2008)
Withmorethan170Goresystemsinstalledaroundtheworld,Goreclaimsthatodoremissionshavebeenreducedbyatleast90%andsomehavereachedreductionsupto97%.Intermsofodorousemissions,testingwasdoneatCedarGrove,wheretheyfound reductions inVOCof89%and reductions in ammoniaof55% in emissionsper ton of input waste between an uncontrolled pile and a Gore covered pile. Itshouldbenoted though that these testswereperformed in the same timeperiod,whileconventionalwindrowcompostingneedsalongertimeperiodtodecomposethewaste.Thismeansthattotalodorsemanatingfromatonofcompostedwasteislikelytobeevenhigherinpracticeforopenwindrowcomposting.
There is no known site to have changed theirmethod of operation from a rotarydrumsystemtoGore,orviceversa.Itseemsthatbothsystems,whenoperatedwithabiofilterodorcontrolsystem,canperformtheirtaskswithoutcausingsignificantodorproblemsforthesurroundingresidents.
UsingcompostasADChasproventoeffectivelyreduceodorousemissionscomingfrom the landfill. Olfactometry experiments carried out by Hurst (Hurst, 2005)showed that odors from the MSW layer underneath a 10 cm compost layer arereduced by 69‐97%, depending on the bulk density of the compost (higher bulkdensity showed better reductions). Unfortunately, the experiments were not

41
performedonfreshyardwaste,whichisthematerialusedasADCinthisstudy.Asthefreshyardwasteisnotstabilizedyet,moreodorousemissionsmaybeemittedfrom the ADC material itself. Care should be taken with the feedstock of thematerial, if any food waste or biosolids are present in the waste used as ADC,significantly more odors can be generated. The same counts for open windrowcomposting.Inthefollowing,thematerialinputflexibilitywillbediscussedinmoredetail.
5.3:InputmaterialflexibilityTheinputfeedstockforcompostingfacilitiesdiffersfromtechnologytotechnologyandsitetosite.Often,odorproblemsrestrictcertainmaterialstobecompostedinsystemsthathaveinsufficientodorcontrolsystemsinstalled.Also,thedegradationrate can be affected by a fluctuating input. The input material flexibility here isdefined as follows: The degree in which the waste processing plant can handlefluctuationsininputmaterialmixes.Inthefollowing,thetypesofcompostingplantsdiscussedinthisstudywillbeevaluatedonthismatter.
In turnedwindrowcomposting, strictlyyardwastesareusedas feedstock.Sourceseparatedorganicsfrommunicipalitiescontainingsignificantamountsoffoodwastehave caused odor problems in the past. This happened in Niagara Falls, Ontario,where residential food and biosolids were collected and mixed in with grasstrimmings,leafsandsmallbranches(WalkerIndustriestripnotes,2009).AlthoughaddingnitrogenrichfoodwastecanimprovethebiodegradationratebyoptimizingtheC:Nratio,itisnotrecommendedintermsofodors.
TheGoreCovertechnologyhasaddressedtheodorproblemtoanextentthatitcanactuallycompostevenmoreodorousbiodegradablematerials likebiosolids,slurryfrom a wastewater treatment plant andmanure. Mixing with these nitrogen richmaterialsgivesabetterC:Nratioforoptimumdegradation.ThecontrollabilityintheGore system gives an extra benefit while handling these different ‘recipes’.Depending on the incoming waste mix, aeration in the piles and consequentlymoisture content and temperatures can be adjusted to get the highestdecomposition rate and therefore the shortest retention times (Walker Industriestripnotes,2009).
In‐vessel composting technologies like the rotary drum system can also handlemoreodorousmaterialsasa feedstock,as longasabiofiltersystemis installed tocleantheexhaustgases.Temperaturescanbecontrolledtosomeextentbychangingtheaerationinthetube.

42
CHAPTER6:MultiCriteriaAnalysisResultsTable20summarizestheresultsofthisMulti‐CriteriaAnalysis:
Table20:Overviewof the finalresults for the fourorganicwasteprocessingmethods.Bothquantitativeandqualitativescoresareassignedtocriteria.
Theareaneededforthealternativedailycoverscenarioisundefined.Itisclearthatsendingthewastetoalandfilldoesnotrequireuseofland(asitreplacestheuseofsoil),soitwouldbegivenavaluehigherthananyothermethod.Inordertokeepthecomparison fair, theADC landfill scenario is assigned a value equal to that of thehighestcompostingvalue(7.55tons/m2forGore).
Two of the four methods (Rotary drum and ADC) show a negative value for theoverall environmental impact. This means that they are beneficial for theenvironment
Whenthequalitativeandquantitativescoresareconvertedintoascaleof0to100,theresultsofthisstudycanbepresentedasshowninTable20.
Table 21: Scores for eachmethod per criterion after the qualitative and quantitative values have beenconvertedtoa0100scale.Anextradominancescorewithoutweightingfactorsiscalculatedinthelowestrow.
Theoveralldominancescoredisplayedhereshowshowthemethodsareratedforthe casewheneach criterion contributes the same to theoverall score, i.e. the allweightingfactorsareassumedtobeequalto1.Also,the“positive/negative”columnshowswhetherthescoresareinverselyrelatedornot.A“plus”signmeansthatthehigherthescoreforthecriterion,thebetteritisfortheoveralldominancescore.A“minus”signobviouslymeanstheopposite.
43
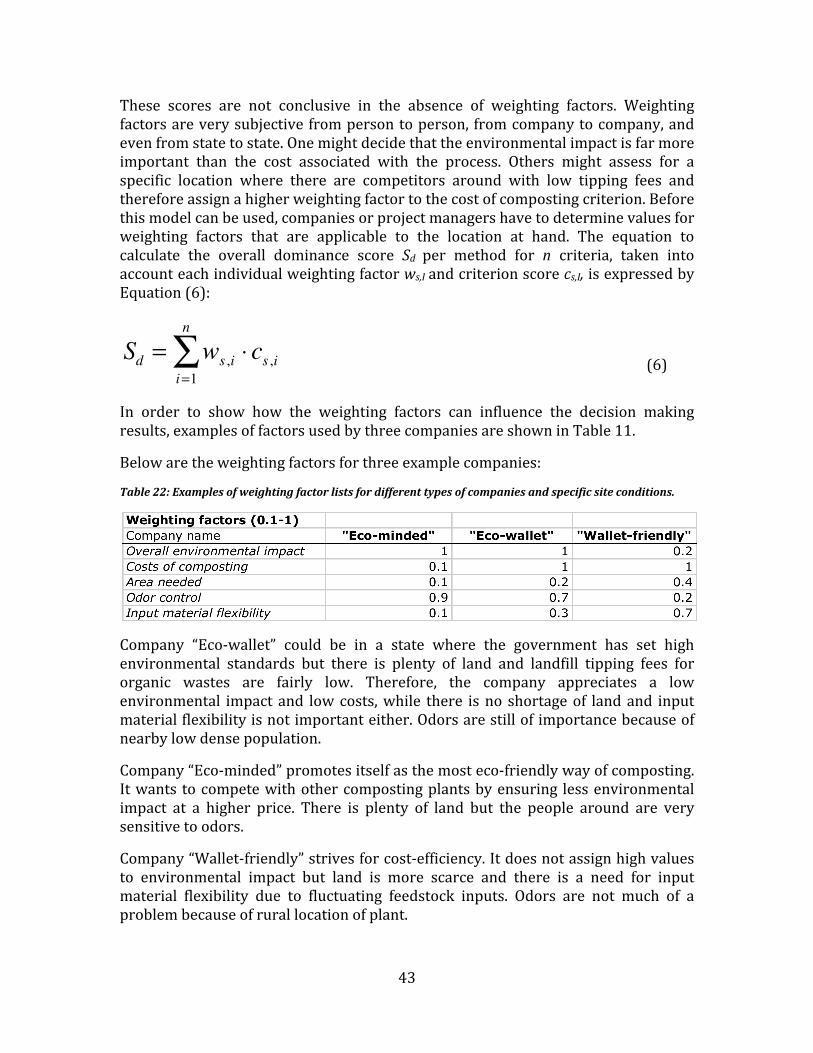
These scores are not conclusive in the absence of weighting factors. Weightingfactorsareverysubjectivefrompersontoperson, fromcompanytocompany,andevenfromstatetostate.Onemightdecidethattheenvironmentalimpactisfarmoreimportant than the cost associated with the process. Others might assess for aspecific location where there are competitors around with low tipping fees andthereforeassignahigherweightingfactortothecostofcompostingcriterion.Beforethismodelcanbeused,companiesorprojectmanagershavetodeterminevaluesforweighting factors that are applicable to the location at hand. The equation tocalculate the overall dominance score Sd per method for n criteria, taken intoaccounteachindividualweightingfactorws,Iandcriterionscorecs,I,isexpressedbyEquation(6):
(6)
In order to show how the weighting factors can influence the decision makingresults,examplesoffactorsusedbythreecompaniesareshowninTable11.
Belowaretheweightingfactorsforthreeexamplecompanies:
Table22:Examplesofweightingfactorlistsfordifferenttypesofcompaniesandspecificsiteconditions.
Company “Eco‐wallet” could be in a state where the government has set highenvironmental standards but there is plenty of land and landfill tipping fees fororganic wastes are fairly low. Therefore, the company appreciates a lowenvironmental impact and lowcosts,while there isno shortageof landand inputmaterialflexibilityisnotimportanteither.Odorsarestillofimportancebecauseofnearbylowdensepopulation.
Company“Eco‐minded”promotesitselfasthemosteco‐friendlywayofcomposting.Itwants tocompetewithothercompostingplantsbyensuring lessenvironmentalimpact at a higher price. There is plenty of land but the people around are verysensitivetoodors.
Company“Wallet‐friendly”strivesforcost‐efficiency.Itdoesnotassignhighvaluesto environmental impact but land is more scarce and there is a need for inputmaterial flexibility due to fluctuating feedstock inputs. Odors are not much of aproblembecauseofrurallocationofplant.

44
ApplyingtheweightingfactorsofthesethreecompaniestotheresultsofthisstudyyieldsTable23:
Table23:Dominancescoresforthreetypesofcompaniesafterapplyingtheirspecificweightingfactors.
For“Eco‐wallet”, theMCAscoresaslightpreferencefortheADCscenarioovertheGorecoveredmethod,while for“Wallet‐friendly” thebestoption ismodeledtobetheGore‐coveredmethod.“Eco‐minded”scoresaslightvictoryfortherotarydrumsystemduetothelowweightingfactorforcosts.
45
CHAPTER7:ConclusionsInconclusion,someofthetechnologiesexaminedaresuperiortootherswithregardto a particular criterion. Considering all five criteria and assigning the sameweighting factor to all five, windrow composting is rated below the ADC landfillscenario in four out of five criteria (overall environmental impact, costs, areaneededandodorcontrol).ItisevenwithADCinthefifth(inputmaterialflexibility).Therefore,windrowcompostingcannotbeselectedbythemodel.
TherotarydrumscenarioisratedbelowtheGoreCovermethodinthreeoutoffivecriteria: It is more costly, requires more land, and has lower input materialflexibility because it does not have the sophisticated measuring and controlequipment of the Gore‐Tex method. On the other hand, it has a slightly lowerenvironmentalimpactaccordingtotheLCA‐study.
ApplyingdifferentweightingfactorstoeachcriterionshowedthattheGore‐coveredcompostingmethodandthelandfillADCscenarioaresuperiortotheothermethods.They both score good/perfect on all criteria and share the highest rankings foreverycriterion.WhileADCuseofyardwastes issuperior incosts, theGoreCoversystemisratedmuchhigherintermsofodorcontrolandinputmaterialflexibility.
From the results it can be seen that the decisionmakingmodel finds a preferredmethod for sites with a certain input of weighting factors. By applying the rightweighting factors for each criterion, waste management companies andmunicipalities canget abetter insight as towhatmethodwouldbepreferable foreachspecificcase.
Economic factors are, in general, the major influence for companies to choose aspecificprocessingmethod.Inalmosteverycase,thereissomesortofcompetitionin a community which strongly affects whether the facility will actually receivewastematerialfromindividualsorcompanies.Forexample,ifapersoncanchoosetosendhis/herwastetotwodifferentprocessingplantsandoneischeaperthantheother, he/she will most likely choose the cheapest plant. Waste processing inNantucketconfirmsthistheory:theyoperatethemostexpensiveprocessingmethodfororganicwaste(rotarydrumsystem).Becauseitisanisland,theonlyprocessingplanthasanaturalmonopolyandcanthereforeaffordtorunanexpensiveplant.
Government influences the selection of a process by means of regulations andfinancial incentives. If the present trend of sustainability continues, governmentsmay provide the incentives for more expensive but also more environmentallyfriendlymethodsof processingorganicwaste. Thiswouldpositively influence thecostcriterionforthesemethods.
Thefollowingsectiondiscussesshortcomingsintheavailabledatausedinthisstudymethodologyusedandthepotentialforfurtherimprovementofthismethodology.

46
CHAPTER8:DiscussionandFutureResearchThissectiondiscussespossibleconcernsregardingthevalidityofthedataused.
Feedstockdifference
IntheLCAstudy,thedifferentmethodsusedifferentfeedstocks.Itisunfairtoscoreaparticularmethodwithafeedstockthatismorelikelytoemitsubstancessuchasammonia and thus have a high impact on the total LCA scores, versus anotherprocesswhereyardwasteisthefeedstock.Thein‐vesselandGoreCoverscenariosuse a mixed feedstock and therefore are expected to have higher ammoniaemissions than they would have processing yard waste. Although these twoprocesses provide means for controlling ammonia emissions (biofilters or Gorecovers), theenvironmental impactwouldhavebeenlower if theywereprocessingyardwaste.
Ideally, the fourmethods should be compared on emissions at the same site andwith the same input feedstock. With regard to the ADC scenario, an odormeasurement difference should be determined for a landfill using greenwaste asADCandconventionalsoilasthedailycover.Afocalpointofsuchastudywouldbetheemissionofammonia.
Ammoniaemissions
Ammoniaemissions(airborne)wasalargecontributorintheenvironmentalimpactassessmentofChapter4.Theammoniaemissionemittedper tonoforganicwasteinputforthewindrowscenariowasassumedtobe2.5kgperton,accordingtothestudyofKomilisandHam;thiscontributedalmost85%ofthetotalenvironmentalimpact. No other referenceswere found that give a full air emissions report andtherefore,thedatamightnotberepresentativeforanaveragewindrowcompostingfacility. It should be noted though, that the Gore Cover method also has a bigammonia contribution: it represents about 60% of total impact. An independentstudyofammoniaemissionsfromallprocessesisnecessarytofirmupthispoint.
ADCscenario
TheADCscenariointhisstudylackssufficientmeasurementdataforairemissions.Forinstance,ammoniaformationisnotincludedintheBarlazmodelalthoughithasa large impact on the total environmental impact assessment. Ideally, similar airemissionstudiestotheoneperformedinthewindrowcompostingscenarioshouldbedoneonalandfillusingyardwastesADC.Also,thecostforthisscenarioisbasedononetippingfeefoundfororganicwastethatissenttotheADClandfill.Sinceyardwastesreplacesoilonthelandfillitisfairtosaythatnoareaisneededatall,exceptfor somestorage spaceanda shredder.Anotherunknown factor is theeffect thatpassageofLFGthroughyardwasteADChasonemissionstoatmospherevs.passagethroughalayerofsoil.
Coststudy
47
Lack of data in the cost study is mostly due to the fact that it is classifiedinformation.GoreAssociateskindlyprovidedacostmodel.Thismodelwasusedindevelopingsomeofthecostsofthethreeotherprocesses.
Afullcostsurveymaybesentouttomanyorganicwasteprocessingplantstogetamuch better overview of the typical processing costs. Since this is proprietaryinformation, the names of the responding facilities would be maintainedconfidential.
Sellingofcompostproduct
Theoutputproductofthecompostingscenarioscanbesoldatacertainprice.Thesameappliestothecollectedlandfillgas intheADCscenario.Thecostassessmentdidnottakethisintoaccount,butitispossibletoincludeitinfurtherstudies.
MCAshortcomings
In aMCA, criteria are supposed to be unrelated. Some of the criteria in theMCAdoneherearerelated: Input feedstock flexibility relates toodorsbecausesomeofthemethodsareequippedwithodorcontrolandthereforecanaccommodatefoodwastes and biowastes. However, although the same cause leads to two differentbenefits,thesebenefitsshouldnotbecountedasone.
Finally,thedecisionmakingmodelusingMCAcanbetestedonrealcompanies.Thiscanbedonewithcompaniesthatareplanningtobuildacompostingfacilityorwithcompanies who have recently started such operations. After a discussion of theresults, the strong andweak points of themodel can be identified and theMulti‐CriteriaAnalysisimprovedaccordingly.

48

49
References:ProfessorM.Barlaz,Interviewed,January2008
ProfessorM.Barlaz,correspondencethroughemailwithProf.Themelis,September2009.
Cabaraban,Khire,Alocilja,Aerobicin‐vesselcompostingversusbioreactorlandfillingusinglifecycleinventorymodels,2007
CompostScience&Utilization,2004,Vol.12,No.4
CraigCogger,AndyBaryandDanM.Sullivan,FertilizingwithYardTrimmings,WashingtonStateUniversityConnection,2002
D.Komilis,R.Ham,Life‐CycleInventoryofMunicipalSolidWasteandYardWasteWindrowCompostingintheUnitedStates,2004
EPA,FactsandFigures,2006
EPA,2007,http://www.epa.gov/epawaste/basic‐solid.htm
E.Favoino,D.Hogg,Thepotentialroleofcompostinreducinggreenhousegases,WastemanagementandResearch,2008.
R.vanHaaren,L.Arsova,N.Goldstein,S.M.Kaufman,N.J.Themelis,StateofGarbageinAmerica,2008
L.Diaz,G.SavageandN.Goldstein,2005,http://www.jgpress.com/archives/_free/000396.html
MetteChristophersen,LisbetLinderød,PernilleErlandJensenandPeterKjeldsen,MethaneOxidationatLowTemperaturesinSoilExposedtoLandfillGas,TechnicalUniversityofDenmark,2000
PREConsultants,2009,http://www.pre.nl/simapro/
N.J.Themelis,Y.H.Kim,Materialandenergybalancesinalarge‐scaleaerobicbioconversioncell,2000
R.Smith,R.Pocock,TheStateofCompostingandBiologicalWasteTreatmentintheUK2006/07,AssociationforOrganicsRecycling,2007
Stephens,"Innovations"CaseStudies:OrganicsOptions,2007,http://www.ciwmb.ca.gov/LGlibrary/Innovations/Organics/Trimmings.htm
Theodore,WasteManagement,2008
50
V.Blouin,MargaretSchmidt,ChuckBulmerandMajaKrzic,SoilcompactionandwatercontenteffectsonlodgepolepineseedlinggrowthinBritishColumbia,2004,http://www.regional.org.au/au/asssi/supersoil2004/s14/oral/2036_blouinv.htm
Entsorga,2006,http://www.norterraorganics.com/PressRelease_Entsorga_2006.pdf
SURcompostingreportWMI26July.
http://www.sciencedirect.com/science?_ob=ArticleURL&_udi=B6V24‐4JT3S0X‐1&_user=18704&_coverDate=03%2F31%2F2007&_rdoc=1&_fmt=full&_orig=search&_cdi=5692&_sort=d&_docanchor=&view=c&_acct=C000002018&_version=1&_urlVersion=0&_userid=18704&md5=ad1afc0b12f94069d8be2069feabfa48#secx3
RuihongZhang,HamedM.El‐Mashad,etal.,Characterizationoffoodwasteasfeedstockforanaerobicdigestion,UniversityofCalifornia,2006
AjayS.Kalamdhad,AbsarA.Kazmi,Rotarydrumcompostingofdifferentorganicwastemixtures,2009.
Ca.gov:http://www.arb.ca.gov/energy/dg/meetings/wastegascomposition.pdf,2009
WhiteP,FrankeM,HindleP,Integratedsolidwastemanagement:alifecycleinventory.BlackieAcademic&Professional,London,NewYork,1995.
GravesRobertE.,HattemerGwendolynM.,NationalEngineeringHandbookPart637,Chapter2:Composting,TheUnitedStatesDepartmentofAgriculture(USDA),2000.
LACSD,EvaluationofGreenWasteManagementImpactsonGHGEmissions:AlternativeDailyCoverComparedwithComposting,April2008.
EPA,CompostingYardTrimmingsandMunicipalSolidWaste,May1994.
R.Steuteville,Howmuchdoesitcosttocompostyardtrimmings?,BioCycle,37(9)39‐40,1995.
CedarGrove,2009,link:http://www.compost.me.uk/assets/images/autogen/a_Gore‐Cedar‐Grove‐aerial.jpg
BrianFuchs,2009,correspondenceviae‐mail
Goretripnotes,May30th,2008,BrianFuchs(Gore),NCVasukiandNelsonWidell(PeninsulaCompost).
Alpert,J.E.,White,D.O.,andWilliams,T.O.,1989.TheRealitiesoftheEnclosedSystemSludgeComposting.InProceedingsoftheNationalConferenceonMunicipalTreatmentPlantSludgeManagement.SilverSpring:HazardousMaterialsControlResearchInstitute.

51
O’Dette,R.G.,1996.DeterminingTheMostCostEffectiveOptionforBiosolidsandResidualsManagement.InProceedingsofthe10thAnnualResidualsandBiosolidsManagementConference:10YearsofProgressandaLookTowardtheFuture.Alexandria:WaterEnvironmentFederation.EPA,2000[1],BiosolidsTechnologyFactSheetIn‐VesselCompostingofBiosolids.EPA832‐F‐00‐061.
NazihK.ShammasandLawrenceK.Wang,Biosolidscomposting,From:HandbookofEnvironmentalEngineering,Volume6:BiosolidsTreatmentProcesses,TheHumanaPressInc.,Totowa,NJ,2007.
EPA,2000[2],BiosolidsTechnologyFactSheetUseofCompostingforBiosolidsManagement.
Azusa,2009,http://www.ci.azusa.ca.us/DocumentView.aspx?DID=1953
Ironplanet.com,2009,http://www.ironplanet.com/jsp/find/searchresults.jsp?category=11&command=NewSearch&h=400
Haughey,RichardD.2001,Report:landfillalternativedailycover:conservingairspaceandreducinglandfilloperatingcost,WasteManagement&Research2001:19:89–95.
EMCON(1997)CityofBurbankLandfillNo.3,AlternativeDailyCoverApplication.EMCON,June24,1997.
Walkerindustriestripnotes,8thofJuly2009,RobvanHaaren,BrianFuchsandGregRobles.
CleanMerseysideCentre,2005,http://www.envirolinknorthwest.co.uk/Envirolink/Library0.nsf/0/6DC63B5C70838A6E8025724B00415D33/$file/In‐vessel%20Guide.pdf
SURcompostingreporttoWMI,March26th,2008.
EliotEpstein,TheScienceofComposting,1996
Nantuckettripnotes,19thofJuly2009,RobvanHaaren,NelsonWidell(PeninsulaCompost)
VanDurmeetal.,1990VanDurme,G.,McNamara,B.,McGinley,C.,1990.CharacterizationandtreatmentofcompostingemissionsatHamptonRoadsSanitationDistrict.In:Paperpresentedatthe63rdAnnualWaterPollutionControlFederationConference,Washington,DC.
52
ClaireHurst,PhilipLonghurst,SimonPollard,RichardSmith,BruceJefferson,JanGronow,Assessmentofmunicipalwastecompostasadailycovermaterialforodourcontrolatlandfillsites,EnvironmentalPollution135(2005)page171‐177.
SummaryoftheGorecompostingemissioncontroldata,GoreAssociates,2009
Schmidt,Card,Kiehl,Compostingtrialsevaluatevocemissioncontrol,BioCycle,april2009,33‐37.
Fitzgerald,G.C.,TechnicalandEconomicAnalysisofPre‐ShreddingMunicipalSolidWastesPriortoDisposal,August2009.
M.Barlaz,YardWasteMemo,amodelinexcelthatcalculatesthemethanegenerated,emittedandcaptured,2008
GeorgeTchobanoglous,HilaryTheisen,S.A.Vigil,“Integratedsolidwastemanagement:engineeringprinciplesandmanagementissues”,1993.
GoreAssociates,CompostingwithfoodandyardwastewithGoreTMCover,(obtainedfromBrianFuchs)2008
EPA2009,EnvironmentalProtectionAgency,
[1]http://www.epa.gov/osw/nonhaz/municipal/landfill/rev‐rule/dailycov.txt
[2]http://www.epa.gov/landfill/faq‐1.htm#q7
[3]http://www.epa.gov/owm/mtb/invessel.pdf
HeribertInsam,NuntavunRiddech,SusanneKlammer,Microbiologyofcomposting,Springer‐VerlagBerlin,2002.
CedarGroveComposting,2009,http://www.cedar‐grove.com/current_pricing.asp.
Barlaz,2009,e‐mailcorrespondenceon10/07/09betweenM.Barlaz,N.J.ThemelisandR.vanHaaren.
M.Barlaz,J.P.Chanton,R.B.Green,ControlsonLandfillGasCollectionEfficiency:InstantaneousandLifetimePerformance,2009.
ClemsonUniversity,CompostingPriceatBeesFerryLandfill,2009,http://www.clemson.edu/public/carolinaclear/consortiums/acsec_home/
CIWMB,Landfilltippingfeesfortheyear2000,http://www.ciwmb.ca.gov/landfills/tipfees/TFSums.htm

53
AppendixA–WalkerIMStripnotesJuly7,2009
VisitofGorecoveroperationofWalkerIMSCompany,NiagaraFalls,Ontario–July7,2009
By Rob van Haaren – Jr. Research Associate, Earth Engineering Center, ColumbiaUniversity
MetwithBrianFuchs–GoreCover;GregRoblesandJacquelineElston–WalkerIMS
Introduction
IwaspickedupatBuffaloairportbyJacquelineElston,anemployeeoftheWalkerIMS company. As we drove to Walker IMS, she told me about the company. Itemploysabout400people,it isfamily‐ownedandthefifthgenerationWalkersarein the Board. Last year,Walker IMS got in touchwith the Gore company. At thattime,itwasrunninga40,000tons/yearwindrowcompostingplant.Theyalsoownandoperatelimestonequarriesandalandfillthatisalmostfullnow.
TheyreceivewastefromtheNiagaraFallsareaandsomeofthebiosolidscomefromToronto.Themixtureisyardtrimmings,leafs,smallbranches,someresidentialfoodwaste and biosolids mostly from curbside and green bins. Plastic is the biggestcontamination of the feedstock. The composting windrows and also the leachateponds are not covered, somunicipalities around the sitewere complaining aboutodors.ThiswasWalker’sprimaryreasontocontactGore.
A design and construction process began andGore tested and confirmed that thetechnologywasapplicable for thewastemixtureand the locationconditions.Thistotal design and construction process will take about 6months. The plant is notcompletelyfinishedatthismoment:anofficewillbebuiltandtheleachatesystemisnotoptimizedintermsofodorsyet.
Thesystem
The site is paved, has an enclosed tipping area and a composting area with 16windrows.Theestimatedthroughputisapproximately40,000tons/yearandwillbeabletocompletelyreplacethewindrowcompostingoperationsonamuchsmallerarea.Thewaste isbrought intothetippingareabytruckswhereit ismixedintoanicehomogeneousmixtogettheidealrecipeforbiodegradation.Leachatecollectedfromthecompostingprocess isrecycledtothe feedbyspraying it intothemixingmachine. Two 75 hp electric motors keep a negative air pressure within theenclosed tipping area and the building air with outside and the air is pushedthrough a biofilter (the German ‘GEWITRA’ report shows howmuch this biofilter
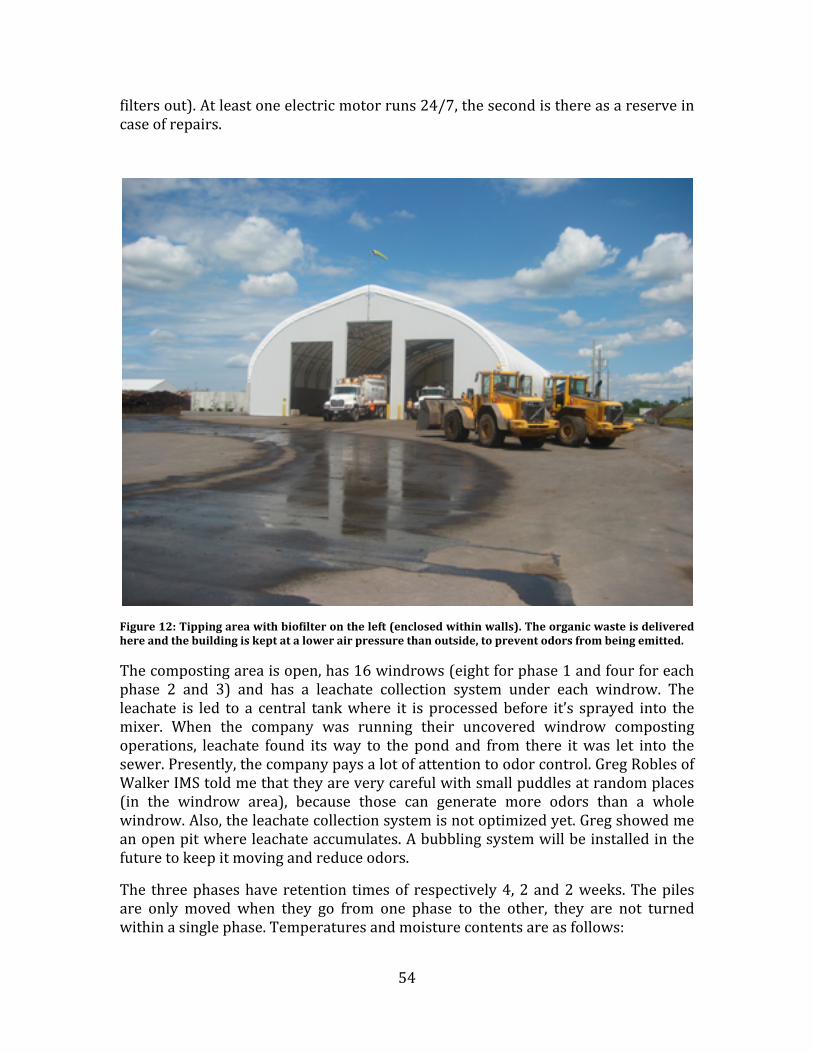
54
filtersout).Atleastoneelectricmotorruns24/7,thesecondisthereasareserveincaseofrepairs.
Figure12:Tippingareawithbiofilterontheleft(enclosedwithinwalls).Theorganicwasteisdeliveredhereandthebuildingiskeptatalowerairpressurethanoutside,topreventodorsfrombeingemitted.
Thecompostingareaisopen,has16windrows(eightforphase1andfourforeachphase 2 and 3) and has a leachate collection system under each windrow. Theleachate is led to a central tankwhere it is processedbefore it’s sprayed into themixer. When the company was running their uncovered windrow compostingoperations, leachate found itsway to the pond and from there itwas let into thesewer.Presently,thecompanypaysalotofattentiontoodorcontrol.GregRoblesofWalkerIMStoldmethattheyareverycarefulwithsmallpuddlesatrandomplaces(in the windrow area), because those can generate more odors than a wholewindrow.Also,theleachatecollectionsystemisnotoptimizedyet.Gregshowedmeanopenpitwhereleachateaccumulates.Abubblingsystemwillbeinstalledinthefuturetokeepitmovingandreduceodors.
The threephaseshaveretention timesof respectively4,2and2weeks.Thepilesare only moved when they go from one phase to the other, they are not turnedwithinasinglephase.Temperaturesandmoisturecontentsareasfollows:
55
Phase1:Temperaturesrun55‐80C,moisture65‐55%
Phase2:Temperaturesrun55‐70C,moisture55‐50%
Phase 3: Temperature are by purpose controlled down 55‐40 C, moisture bypurposeiscontrolleddownto45%.
Uniqueaboutthissitearethesmalltwofootwallsonbothsidesofeachwindrow.ThenormaloperationforGoreisforthefeedstocktobepiledontoaflatfloorandthecoverstoreachthefloorwheretheyareheldinplacebyplacingsandbagsontopoftheedges.IntheWalkersite,allthematerialisdumpedinbetweenthetwosmallwallsandthecoversareledoverthewalls.Attachedtothecoversarerubberropes,thecoversaretightenedbyputtingtheseropesaroundboltsinthewalls(seefigure13).The topof thewalls are coveredwitha rubbermaterial inorder tokeep thecoversfromwearingout(BrianFuchsofGore‐Texrecommendedthatthecoversbereplacedanywayaftera4to5yearperiod–UVsunlightisthemaincontributortowear).Comparedtothewayconventionalcoversarekeptinplace(sandbags),thissystemseemstobeworkingfaster:therubberropescaneasilybetightenedaroundtheboltsbeasingleperson.Anotherbenefitisthatinwintersthecoveredgeswillnotbecoveredwithabigpackofsnow,which isaprobleminmanyconventionalsitesatthislatitudeorfurthernorth.

56
Figure 14: The composting areawith the verticalwalls towhich the covers are attachedwith rubberropes.Ontheright,apileisbeingtransportedfromonewindrowtothearea.
The‘recipe’
Thewastemixor‘recipe’isaveryimportanttermintheGorecompostingprocess.In the start‐up of the plant, many measurements are made to find the optimumdegradation mix. Moisture levels, oxygen levels and C:N ratios are kept at theoptimumlevelbymixinginleachate,addingoxygenbyaerationandaddingbulkingagentthatisdeliveredbylocalresidents.Gregsaiditgettingtherightmixandtheoptimumdegradationis“morelikeanartthanascience”.
BrianFuchsshowedmesomescreenshotsofthesoftwarethattheyrun.Twoprobesare stuck into thepile, one foroxygenandone for temperature.The temperatureprobe measures at five different depths. The parameters can be adjusted in thesoftwareandthesystemwillreacttothenewsettings.For instance,oxygenlevelsaresettobeinbetween6%and8%.Wheneveritgoesabove8,theaerationisshutdownorlowered.WhenO2dropsbelow6%,aerationisactivatedorincreased.
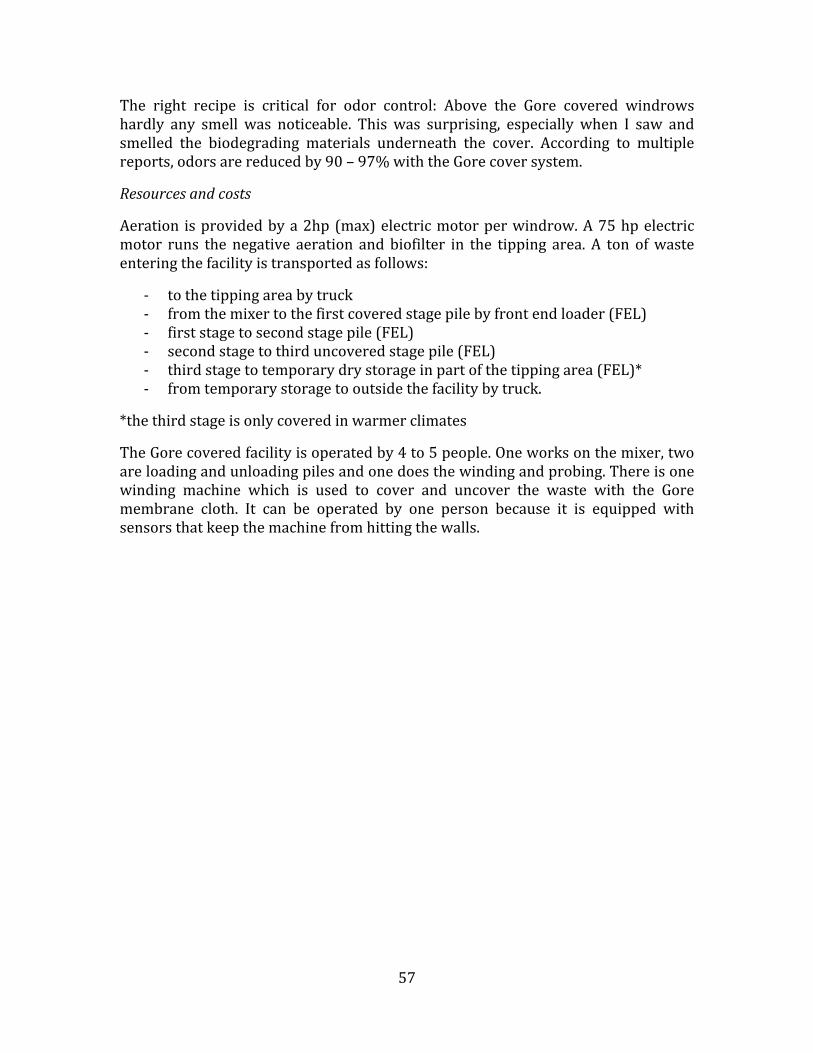
57
The right recipe is critical for odor control: Above the Gore covered windrowshardly any smell was noticeable. This was surprising, especially when I saw andsmelled the biodegrading materials underneath the cover. According to multiplereports,odorsarereducedby90–97%withtheGorecoversystem.
Resourcesandcosts
Aeration isprovidedbya2hp(max)electricmotorperwindrow.A75hpelectricmotor runs the negative aeration andbiofilter in the tipping area. A ton ofwasteenteringthefacilityistransportedasfollows:
‐ tothetippingareabytruck‐ fromthemixertothefirstcoveredstagepilebyfrontendloader(FEL)‐ firststagetosecondstagepile(FEL)‐ secondstagetothirduncoveredstagepile(FEL)‐ thirdstagetotemporarydrystorageinpartofthetippingarea(FEL)*‐ fromtemporarystoragetooutsidethefacilitybytruck.
*thethirdstageisonlycoveredinwarmerclimates
TheGorecoveredfacilityisoperatedby4to5people.Oneworksonthemixer,twoareloadingandunloadingpilesandonedoesthewindingandprobing.Thereisonewinding machine which is used to cover and uncover the waste with the Goremembrane cloth. It can be operated by one person because it is equipped withsensorsthatkeepthemachinefromhittingthewalls.
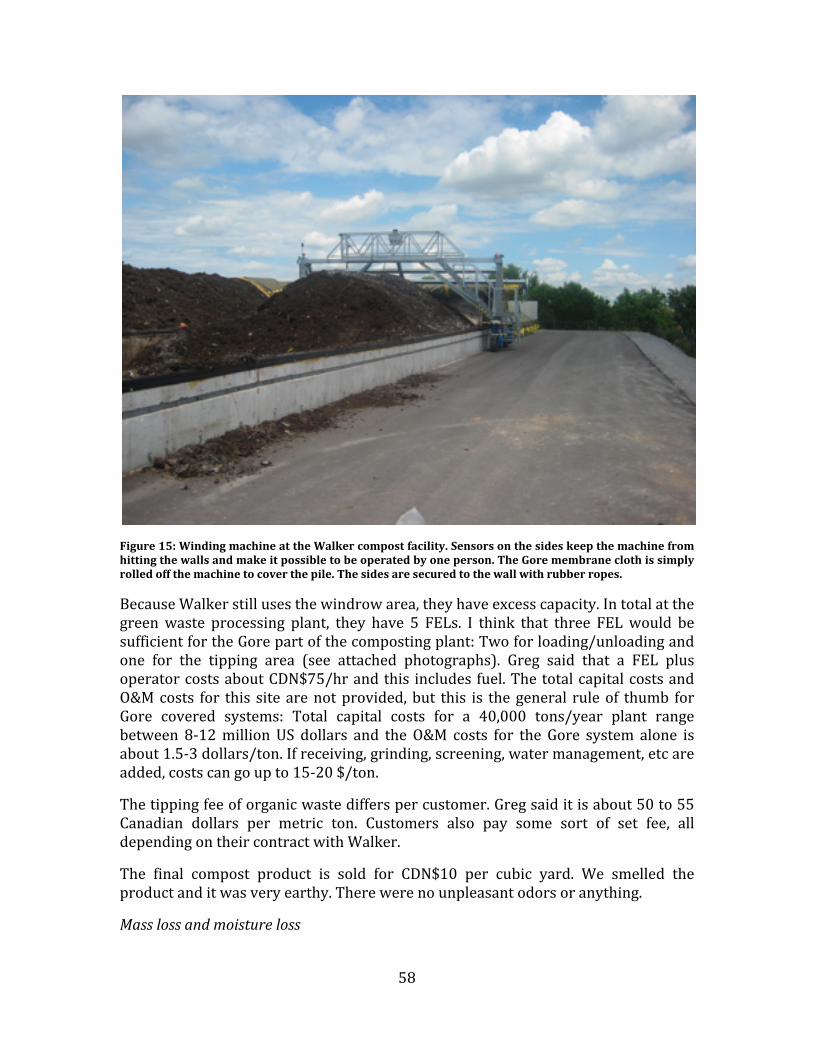
58
Figure15:WindingmachineattheWalkercompostfacility.Sensorsonthesideskeepthemachinefromhittingthewallsandmakeitpossibletobeoperatedbyoneperson.TheGoremembraneclothissimplyrolledoffthemachinetocoverthepile.Thesidesaresecuredtothewallwithrubberropes.
BecauseWalkerstillusesthewindrowarea,theyhaveexcesscapacity.Intotalatthegreenwaste processing plant, they have 5 FELs. I think that three FELwould besufficientfortheGorepartofthecompostingplant:Twoforloading/unloadingandone for the tipping area (see attached photographs). Greg said that a FEL plusoperatorcostsaboutCDN$75/hrandthis includes fuel.ThetotalcapitalcostsandO&Mcosts for this sitearenotprovided,but this is thegeneral ruleof thumb forGore covered systems: Total capital costs for a 40,000 tons/year plant rangebetween 8‐12millionUS dollars and theO&M costs for the Gore system alone isabout1.5‐3dollars/ton.Ifreceiving,grinding,screening,watermanagement,etcareadded,costscangoupto15‐20$/ton.
Thetippingfeeoforganicwastedifferspercustomer.Gregsaiditisabout50to55Canadian dollars per metric ton. Customers also pay some sort of set fee, alldependingontheircontractwithWalker.
The final compost product is sold for CDN$10 per cubic yard. We smelled theproductanditwasveryearthy.Therewerenounpleasantodorsoranything.
Masslossandmoistureloss

59
Overall, in theGore covered compostingprocess, a lowermoisture content of theproduct isachievedascomparedto the feedstock: It isdecreased from55‐60%to40%. The mass loss including the moisture loss was reported to be about 30%,althoughIthoughtthatthiswastoolow.
Thelandfill
Asstatedintheintroduction,WalkerIndustriesalsorunsalandfill.Fromtheroadon the way home I had the opportunity to take some pictures of the landfilloperations.Asadailycover,theyusedcontaminatedsoil(awasteproductfromoneofthelimestoneprocessoperations)insteadofcleansoilorADC.TheyneverusedtheirgreenwasteasadailycoverandIthinkthatmakesperfectsensebecausetheyjustbuiltamulti‐milliondollarplanttotakecareofthatwaste.Afterthefinalcoverisdeposited,theyinstallalandfillgascollectionsystemtocollectthemethane.
Goingbackhome
Afterthetour, IdrovebacktotheairportwithBrianFuchsandhis9‐yearoldsonwhocamealongonthistrip.Attheairport,Brianshowedmesomepicturesofthedifferent types of Gore covered plants that are in use around the world and wetalkedabout the legislation/design/constructionprocess forGore coveredsites. Itseemsthat theGore technology isapplicable inalmostanypartof theworldevenwithmore severeweather conditions. Every site canhave its specific adaptationsdependingontheconditionsinandaroundthesite.TheGorepeoplekeepintouchwiththemanagersofthefacility,ifthereisanyproblemtheycomeovertoworkitout.ThisalsoensuresthattheGoreproductqualityiskeptatahighlevel.

60
AppendixB–NantuckettripWasteOptionsnotes,July19,2009
Author:RobvanHaaren
Metwith:NelsonWidell(PeninsulaCompost)
I visited thewaste processing centrewhile Iwas on a‐weekend‐off in Nantucket.Brian Fuchs brought me in contact with Scott Woods and he arranged a tourthrough the facility for me. Nathan (Nelson Widell, Peninsula Compost), anemployee who has worked there since 2000 showed me the landfill, the MRF(MaterialsRecyclingFacility)andtherotarydrumcomposterinNantucket.
The passage below, comes from the website of Nantucket Waste Options(www.wasteoptions.com/nantucket.htm):
It was in 1997 that Waste Options signed a 25year contract with the Town ofNantucket.Aspartof thecontract,WasteOptionswouldoperatetheTown's landfill,operateitsconstructedMaterialsRecyclingFacility(MRF),andbuildastateoftheartcocomposting facility at their Madaket site. In the two years that followed,WasteOptions has cleaned up the landfill, restored eight acres of wetlands, shipped eightbarge loadsoftiresoff island,reducedthepopulationofseagullsatthe landfill from25,000 to just several hundred, and increased Nantucket's recycling rate from 17percentto42percent,rankingitasthecommunityinMassachusettswiththehighestrate of recycling. Since the composter beganoperation inDecember1999, that ratehasjumpedtocloseto90%.
Recyclingofhouseholdwaste
The residents of Nantucket can bring their householdwaste to theMRF for free.Thereisaclearexplanationforeveryspecificwastestreamthatcanbehandedin.Mixedpaper,newspaper,PETbottles,mixedplastics,metalcansandglassaresomeoftheseparatebinsthattheyhave.Thebulkoforganicwastesisbroughtinbybigtrucks, thatareweighedbeforeandaftertomeasuretheamountbrought in.Mostpeoplehavebinsintheirhouseswheretheyseparatewastebeforetheytakeitout.Inthepicturesbelow,theareaisvisiblewhereNantucketresidentsparktheircars(leftpicture)andseparatetheirwasteinthedifferentbins(rightpicture).

61
Figure16a,b.a:MRFcollectionarea.b:ResidentsofNantucketseparatingtheirrecyclablewaste.
Actually,whatthepeopledon’tsee, isthatall thedifferentpapersandplasticsareprocessed in just two ways. As can be seen in Figure 17 below, there is onecollection area for paper and one collection area for plastics. There is no clearreasonforthiswastedeffort,butwhatbothNathanandIthoughtwasthatitmakesthe people feel better about it and it gives the opportunity for future dedicatedprocessingmethodsforthespecifictypesofwaste.
Figure17:Insideviewofthematerialrecyclingfacility
Plastics
Theplasticsareprocessedinthefollowingway:
1. LoadedontoaconveyorbeltbyafrontendloaderBobcat.2. Byamagnet,mostmetalistakenouttoensureacleanstream.

62
3. Six pickers pick out dirty package material that cannot be recycled (forinstance,a tubeofketchupwitha fairamount left in it).This issent to theorganic waste stream that will be discussed later. They also pick outaluminumcansandothermetalsthatwerenotextractedbythemagnet.
4. Thecleanplasticsarethencompressedandtightenedtoapproximately6by6by4feetbalesandshippedouttoanotherfacilityforfurtherprocessing.
Figure18a,b,c,d.a:Plasticpushedontoaconveyorbeltandseparationofmetalsbymagnetattheend.b:Placewheretheplasticstreamentersthepickingroom.c:Temporarystorageofcontaminatedplasticsthatareseparatedoutoftheplasticstream.Ialsospottedsomecardboardandpaper.Thisislatermixedinwiththeorganicwastethatenterstherotarydrumdigester.d:SludgefromaWisconsinWWTPthatisalsomixedinwiththerotarydigester.
Paper
Thenewspapers,officepaperandanyothermixedpapersareallbaledtogetherandshippedoutforfurtherprocessing.
Glass

63
Glass(ofallcolors)isthrowninabigdumpster.Accordingtosomeoftheresidentsitisthefunniestmaterialtorecycleattherecyclingcentre.Sonowandthen,afulldumpsterissentoutofthefacilityandanemptyoneisbroughtback.
Metals
The metals that are separated are compressed and baled like the paper. In thepicturebelow,balesofaluminumandmetalsarestoredbecauseofthecurrentlowpricestheyreceiveforthem.
Figure19:lowmetalpricespushedthemanagerstostorebalestemporarilyintheirhall.
Organics
Organicwaste isbrought inby trucks.Nathansaid thatsomeof the trucksdonothave enclosed containers and that these cause odors as they drive pastmunicipalitiestotheWasteOptionsfacility.Theypaythefollowingtippingfeesfordifferenttypesofwaste:
• $120/tonforMSW• $180/tonforbulkymaterial• FlatfeesforslurrythatcomesfromWWTP’s.
It iscollectedand loaded intotherotarydrum(diameterapprox.12 feet,185 feetlong),togetherwithcontaminatedplasticsthatwereseparatedbythepickers.Thepicture below shows the very beginning of the drumwhere thewaste enters theapparatuswhichrotatesatabout1RPM.Temperaturesareatabout160F(71oC)inthefirstpartofthedrum,and180F(82oC)attheend.Airandwaterareaddedtoimprovedecomposition.Asmuchas60,000 ft3/minof air is added.The retentiontimeofthewasteinthedrumisabout3days.
64
Undersized material (less than 1inch), or unders, passes through the screen forprocessingascompost.Oversizedmaterial,orovers,isconveyedtoabalerforlandfilldisposal(WasteOptionsWebsite).
Theundersgotoanareawhereitisaeratedinpilesforcuring(ormaturation).Thematerial stabilizes there for 21 days. Then, a vibration screen takes out piecesbiggerthan3/8inchwhicharesenttothelandfillandsmallbutheavyparticles(likeglass, stones) are put in a container. The compost then can be used as a soilamendment/fertilizer for gardening purposes. It is marketed in the Nantucketcommunityand someof it is evendonated to the recyclingpeople as a ‘take it orleaveit’.
Besides this line, they alsohave a special shredder tomakewoodchips out of bigbranches.Allofthiswasteisreusedaslandscapingmaterial.Someoftheclean,non‐odorous organic waste is windrowed on top of the landfill and is turned everycoupleofweeks.
Notethatthecontaminatedplasticsthatwereaddedatthebeginningoftherotarydrumareseparatedagainlater.Thisistodigestasmuchofthefoodremainsintheplasticsaspossible.However,theseparationcomeswithhugecostsandbothofusconcludedthatthereshouldbeabetterwaytodisposeofthiswasteproperly.

65
Figure20a,b,c,d.a:mixedwasteenteringtherotatingdrum.b:Outsideviewoftherotatingdrum.c:Endpiece of the drum where the unstabilized material is falls out of the device. d: Conveyor belt thattransportsthewastetoanareawhereitiswindrowedandaeratedforcuring.
Abiofilterensurescleaningofairfromtheenclosedcompostbuildings.Thecleaningsystemcosts$120,000andisverylowmaintenance.Itconsistsofpipesandpumpsthat bring the air from these buildings under an enclosed area with a pile ofwoodchips. The odors are filtered out by thewoodchips and clean air is emittedfrom the top of the building. The woodchips have to be replaced with freshwoodchipseverytwoyears.
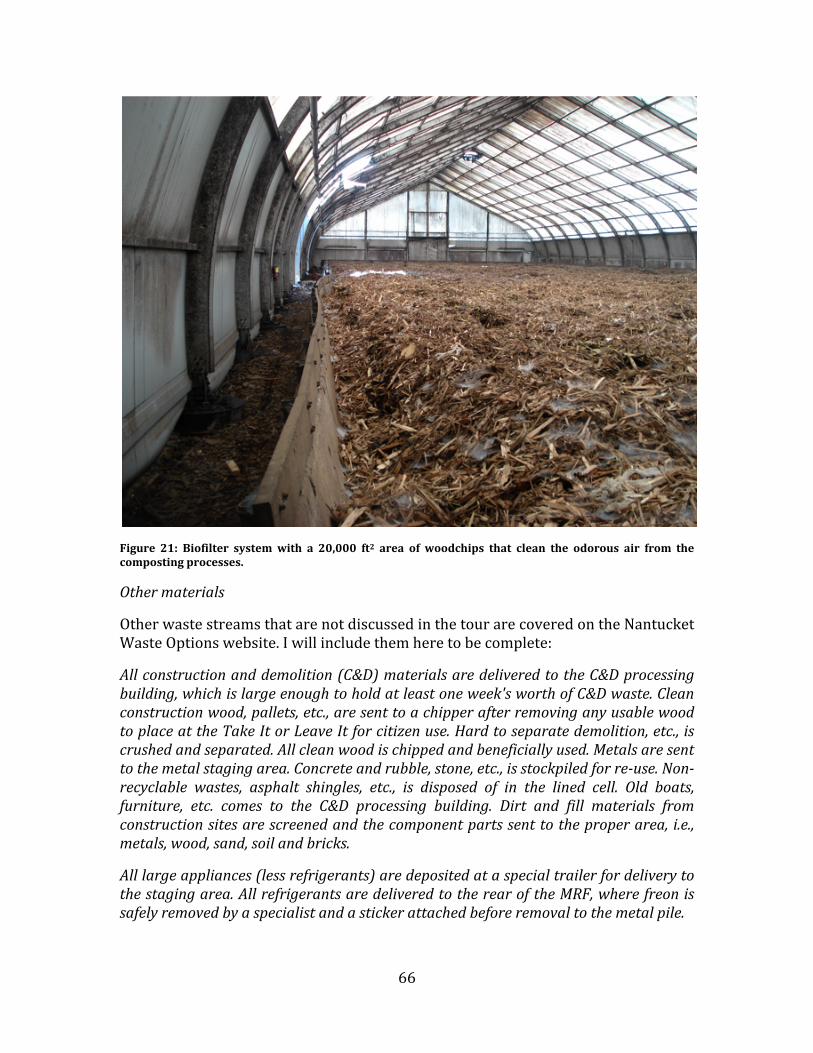
66
Figure 21: Biofilter system with a 20,000 ft2 area of woodchips that clean the odorous air from thecompostingprocesses.
Othermaterials
OtherwastestreamsthatarenotdiscussedinthetourarecoveredontheNantucketWasteOptionswebsite.Iwillincludethemheretobecomplete:
Allconstructionanddemolition(C&D)materialsaredeliveredtotheC&Dprocessingbuilding,whichislargeenoughtoholdatleastoneweek'sworthofC&Dwaste.Cleanconstructionwood,pallets,etc.,aresenttoachipperafterremovinganyusablewoodtoplaceattheTakeItorLeaveItforcitizenuse.Hardtoseparatedemolition,etc.,iscrushedandseparated.Allcleanwoodischippedandbeneficiallyused.Metalsaresenttothemetalstagingarea.Concreteandrubble,stone,etc.,isstockpiledforreuse.Nonrecyclable wastes, asphalt shingles, etc., is disposed of in the lined cell. Old boats,furniture, etc. comes to the C&D processing building. Dirt and fill materials fromconstructionsitesarescreenedandthecomponentpartssenttotheproperarea, i.e.,metals,wood,sand,soilandbricks.
Alllargeappliances(lessrefrigerants)aredepositedataspecialtrailerfordeliverytothestagingarea.AllrefrigerantsaredeliveredtotherearoftheMRF,wherefreonissafelyremovedbyaspecialistandastickerattachedbeforeremovaltothemetalpile.

67
Hardtomanagewaste(HTMW)suchasmattresses,boxsprings,rugs,couches,stuffedchairs,etc.,arecollectedattheHTMWtrailer.TheyarethenshippedtoamerchantinHyanniswhere cotton,woodandother components are removed to be recycledandreused.Alltiresaredeliveredtothetirestagingarea.Therimsmustberemovedandplacedinthemetalpile.Thetiresarethensenttorecyclersonthemainland.
Thelandfill
The landfill is pretty old (several decades). It has a capacity of 1.6 million cubicyards and takes up 21 acres. It is not prepared with a liner so the Nantucketgovernmentdecidedthatitwouldbebettertoemptyitanddisposeofthewasteinaproper way. A neighboring pond of water is believed to be contaminated by theleachatefromthelandfill.TheystartedminingthedayafterIvisitedthesite.Mostofthewasteinthelandfillissoold,thatthereishardlyanyLFGgeneratedanymore.Itcontainsapproximately30%plastics,15%metalsand55%soilandorganics.Atthemoment, twonew landfills arepreparedandone isbeingpreparedwithadoublelinerandtheyareusedasthecurrentlandfillnow.GlassisusedasanADCmaterial.Also, it has a leachate collection system that ensures that nothing ends up in thenearbyponds.
Figure22:NewlandfillwhereglassisusedasAlternativeDailyCover.
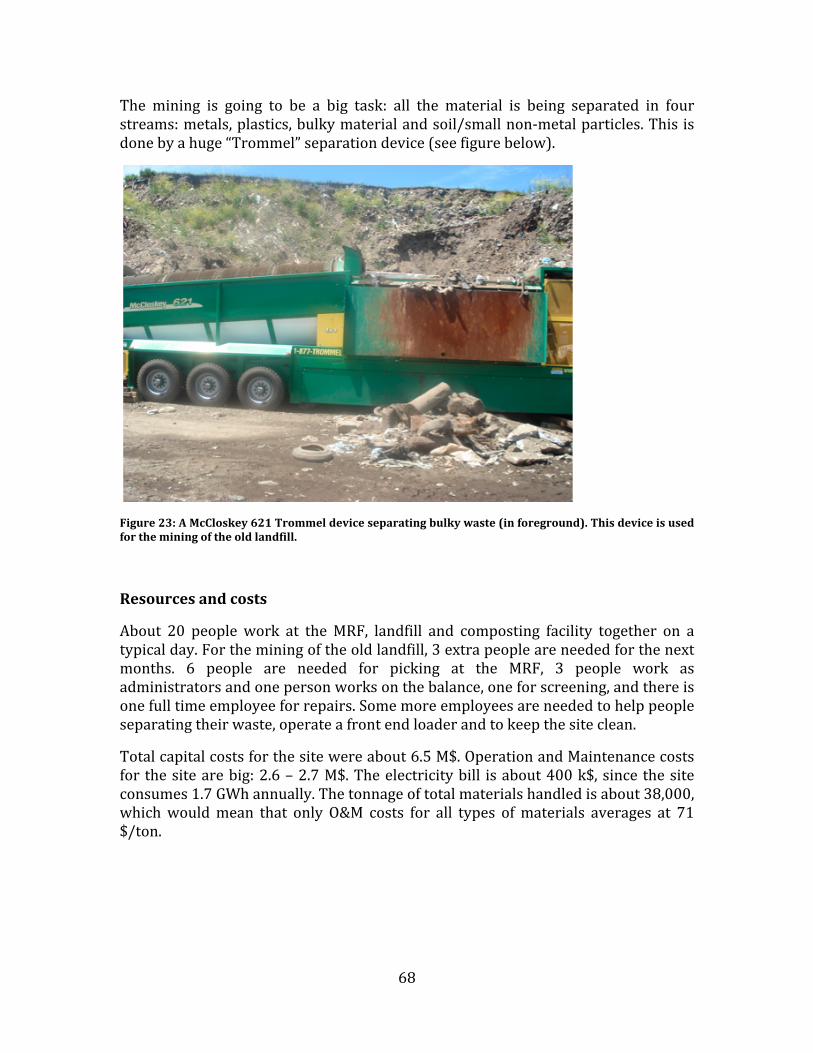
68
The mining is going to be a big task: all the material is being separated in fourstreams:metals,plastics,bulkymaterialandsoil/smallnon‐metalparticles.Thisisdonebyahuge“Trommel”separationdevice(seefigurebelow).
Figure23:AMcCloskey621Trommeldeviceseparatingbulkywaste(inforeground).Thisdeviceisusedfortheminingoftheoldlandfill.
Resourcesandcosts
About 20 people work at theMRF, landfill and composting facility together on atypicalday.Fortheminingoftheoldlandfill,3extrapeopleareneededforthenextmonths. 6 people are needed for picking at the MRF, 3 people work asadministratorsandonepersonworksonthebalance,oneforscreening,andthereisonefulltimeemployeeforrepairs.Somemoreemployeesareneededtohelppeopleseparatingtheirwaste,operateafrontendloaderandtokeepthesiteclean.
Totalcapitalcostsforthesitewereabout6.5M$.OperationandMaintenancecostsfor thesitearebig:2.6–2.7M$.Theelectricitybill isabout400k$,sincethesiteconsumes1.7GWhannually.Thetonnageoftotalmaterialshandledisabout38,000,whichwouldmean that only O&M costs for all types ofmaterials averages at 71$/ton.
69
AppendixC–GoreTripnotes,May30th,2008MortonBarlaz
BrianFuchsfromGore
NCVasuki
NelsonWidell–PeninsulaCompost
Wespentaboutanhourwithmedescribingthegoaltounderstandthestate‐of‐the‐practiceandBrianpresentingtheGoreTechnology.Wethenwentintoamorefree‐flowingdiscussionofwherethistechnologyfits.Takeawaymessagesforme:
- theGoretechnologyisquitegood,basedonwhatIsawatCedarGroveinWA,awellrunGoreplantcanbequitecleanandodorfree(seereferencebelow)
- TheissueiscostasinWAtheyweregettingatipfeeof$42aton.Ipointedoutthatthiswashighforyardwasteandeveryoneagreedthateconomicsarecritical.Theeconomicsthatmustbeconsideredarethetransportfeeplusthetipfee.Inmanycases,ifaloadisbroughttoatransferstation,thetipfeeatthetransferstationwillincludethecosttotransportandthendisposeofmaterialatalandfill.InpartsoftheNE,thetipfeeforalocalcompostfacilitywillbelowerthanthatofthelandfillsthatreceivewasteinVAandPA.
Specificpoints
- NelsonWidellisbuildingafacilityinDEthesamesizeasCedarGrove(160,000T/yr)
- ItwaspermittedinMay,2008andtheyhopetoberunninginMarch,09.Feedstockswillcomefromwithin50milesofWilmington,DEandthetippingfeewillbelowerthanthelandfill.Nelsonwascountingoncorporatedriveto“compost.”Hespokeofnationalcorporateaccounts.
- Nelsonsaidthathehadverystrongmarketsfortheendproductsastopsoil.Hecouldmarketfor$10/tonof$5/yardandwasnotworriedaboutmarketsaturation(personallyIamabitskepticalhere,thehighvaluemarketisbaggedmaterialandIcannotimaginethatdemandexpandingforever.Thealternativeisbulksalesandatsomepointitwouldseemthatthesalespricewillhavetodrop.Ofcourse,ifthetipfeecoverscosts+amargin,thenyoucanaffordtogiveitaway).
- Gorecoversareguaranteedfor4years,theyseemtolastlonger,harshestapplicationisEdmonton,CA
- Retentiontime:

70
- Phase1–4weeksundercover- Phase2–4(2:saysBrianFuchs)weeksundercover- Phase3–2weeksexposed
- Energyfortheblowers,computersandprobes(tempandoxygen)<0.75kWh/ton(thisdoesnotincludetherollingstock,grinders,screens,biofilters).Brianthoughtthispowerdemandwouldnotincreaseasthefoodwaste%increased.Theblowersturnonandoffbasedonoxygencontent.
- Fastestgrowingmarketisforbiosolids- Themachinethatputsthecoveroverthewindrowcanmovein4directions
soonemachinecancoverallwindrows- GoreisputtingthreeunitsintheTorontoarea,eachwillhandlecurbside
residentialcollectionofFWandYW(foodwasteandyardwaste).
CommentsonFeedstock
- Lowhangingfruitisacommercialplantsthatprocessfruitsandvegetables,thePhillyfarmersmarket.Thencomessupermarkets.
- Nelsonseesabout2%contaminationbyweightbasedonarigorouscontractwiththewastegenerator.Ifaloadiscontaminated,hetakespicturesandthensendsittothelandfillatthegeneratorsexpense.Hebudgetsatabout5%residualandsaysthatgroceriescanprovideexcellentfeedstock.(Ibelievethatthereareregionalissueshere.Forexample,attheKroger’swastedropinOH,therewaslotsofOCCinthewastethatshouldnotbethere–thisleadsmetowonderhowpeoplewillseparatefoodwasteiftheycannotgetOCCright.However,theneedtorecycleisdifferentinNJvs.OHandthismayexplainthedifference.Also,thisiseasiertoimplementifaloaderdumpsatthecompostplants.Itisdumpsatatransferstation,youneedaninspectorthere.
- BrianFuchsseesmorecontaminationwithresidentialwhichwasnottheprobleminWA.However,inWA,participationwasrelativelylowandonecaninferthatthepeoplethatparticipatedwantedtogetitright

71
AcknowledgementsThisthesisreportwouldnothavebeenmadepossiblewithoutthehelpofthefollowingpeople:
ProfessorThemelis(ColumbiaUniversity);forthemanydiscussionsattheofficeandthereviewsofthewrittenpartsofthethesis.Asmyadvisorandasaperson,heisthemainsupportinmyMSprogramatColumbiaUniversity.
ProfessorBarlaz(NorthCarolinaStateUniversity);forprovidingmetheADCgreenwastedegradationmodelandfortheinterviewsIhadwithhim.ProfessorBarlazistheco‐advisoronthisresearch.
BrianFuchs(GoreAssociates);forthee‐mailcontactwehadabouttheGoremethod.AlsoBrianarrangedtwotripsforme,oneinNiagaraFalls(WalkerIndustries)whereIhadthepleasuretomeethimandhisson,andoneinNantucket,throughScottWoods.
GregRobles(WalkerIndustries);forgivingmethetourattheWalkerIndustriescompostingplantonJuly8th,2009.
NelsonWidell (Peninsula Compost); for givingme a tour at the NantucketWasteOptionsfacilityonJuly19th,2009.
Also,I’dliketothankAthanasiosBourtsalasandLjupkaArsovafortheirworkonthelifecycleanalysis.
Finally,not to forget:my family.Without ‘PapenMam’ Iwouldn’thavegottentheopportunity to go toColumbiaUniversity to studyand todo research. Ikhouvanjullie!