large dna deletions drive premature aging in mitochondrial ... · large dna deletions drive...
TRANSCRIPT

Large DNA deletions drive premature aging in mitochondrial mutator mice Marc Vermulst1, Jonathan Wanagat2, Gregory C. Kujoth3, Jason H. Bielas1, Peter S. Rabinovitch1, Tomas A. Prolla3, Lawrence A. Loeb1 1Department of Pathology, University of Washington, Seattle, 91895 Washington, USA. 2Department of Gerontology and Geriatric Medicine, University of Washington, Seattle, WA 91895, USA 3Departments of Genetics and Medical Genetics, University of Wisconsin, Madison, WI 53706, USA. Supplementary Material Materials and Methods
MtDNA deletion detection. Deletions were PCR-amplified and quantified using
our recently described RMC-methodology1 with minor alterations (Fig. S1).
Deleted mtDNA molecules were quantified by single molecule amplification
according to previously published protocols2, or in triplicate using standard
comparative qPCR-methodology. Primer sequences are listed in table S1.
PCR conditions PCR reactions were performed using a DNA Engine Opticon®
Monitor 2, a continuous fluorescence detection system from BioRad, and
amplicons were quantified with Stratagene’s Brilliant® SYBR® Green qPCR
Mastermix. QPCR reactions were performed in 25 � l reactions containing
1xBrilliant® SYBR® Green qPCR Mastermix from Stratagene, 20 pM forward and
reverse primers, and 2 u uracil DNA glycosylase (UDG). The samples were
amplified as follows: UDG incubation at 37 °C for 10 min, 95 °C for 10 min, and
then 45 cycles of 95 °C for 30 sec, 60 °C for 1 min and 72 °C for 1.5 min.
Samples were held at 72 °C for 5 min and stored at -20 °C.
Histochemistry. Cytochrome oxidase staining solutions were prepared in 10ml
aliquots containing 750mg sucrose, 5mg DAB, 10mg cytochrome c. 1 ml
10xcatalase, and 9ml 50mM sodium phosphate buffer pH 7.4. Succinate
dehydrogenase staining solutions were prepared in 10 ml aliquots containing

100mg sodium succinate, 10mg NBT, 0.2mg phenazine methosulphate, and
10ml Tris-HCl, pH7.4. Frozen tissue sections were incubated with cytochrome
oxidase staining solution at room temperature for either 15 (heart), 35
(duodenum), or 60 minutes (brain), washed with 1xPBS, and incubated with
succinate dehydrogenase staining solution for 3 (heart), 10 (duodenum) or 30
minutes (brain) at 37°C. Samples where then washed with 1xPBS and either
coverslipped or washed in 70% ethanol.
Microdissection. Microdissection was performed on a PALM MicroBeam
System from P.A.L.M. Microlaser Technologies AG and Zeiss. Laser dissected
samples were caught in opaque adhesive caps from P.A.L.M. Microlaser
Technologies, inspected under a microscope, and lysed in a 3 � l reaction
containing 0.4mg/ml ProK, 0.5% SDS and 10mM EDTA at 46°C.
Tissue homogenization and organelle separation. Animals were sacrificed
and all tissues were harvested within 5 minutes of death. All animals were
cared for according to approved guidelines by the University of Washington and
the University of Wisconsin. Tissues were sliced in pieces with a scalpel and
rinsed in 1xPBS before homogenization in a Dounce-type glass homogenizer
with 25 firm strokes of a hand driven glass pestle. Homogenization buffer
contained 0.075M sucrose, 0.225M sorbitol, 1mM EGTA, 0.1% fatty acid free
bovine serum albumin (BSA), and 10mM Tris HCl, pH 7.8). Differential
centrifugation was performed as described previously3 to obtain a crudely
purified mitochondrial pellet.
Supplementary Data Detection of deletions in mitochondrial DNA. The RMC-assay uses restriction
enzymes and qPCR to detect random mutations at restriction sites1. Briefly, DNA
is digested with TaqI and PCR amplification is then attempted across a TaqI
restriction site. Thus, only molecules that contained a mutation in the restriction
site, which rendered it resistant to cleavage, provide a viable amplicon for PCR-
amplification. These mutant molecules are quantified, and compared to the total
number of mtDNA molecules, providing a measure of the mutation frequency.
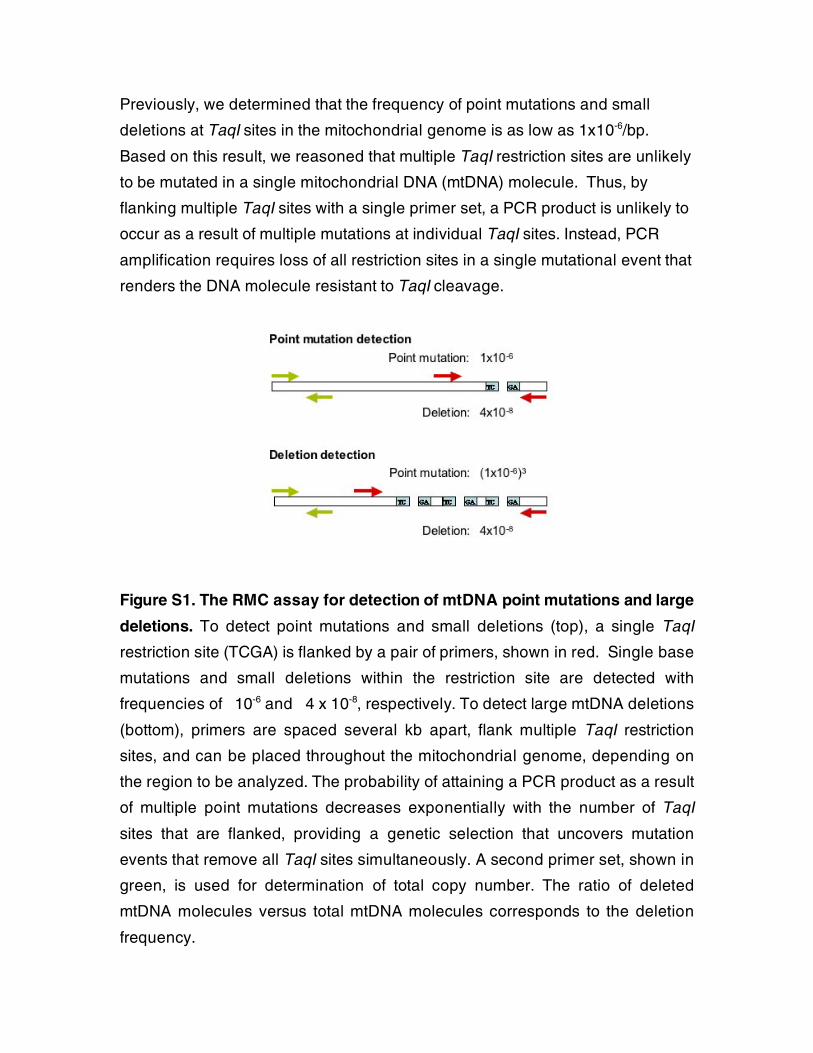
Previously, we determined that the frequency of point mutations and small
deletions at TaqI sites in the mitochondrial genome is as low as 1x10⁻⁶/bp.
Based on this result, we reasoned that multiple TaqI restriction sites are unlikely
to be mutated in a single mitochondrial DNA (mtDNA) molecule. Thus, by
flanking multiple TaqI sites with a single primer set, a PCR product is unlikely to
occur as a result of multiple mutations at individual TaqI sites. Instead, PCR
amplification requires loss of all restriction sites in a single mutational event that
renders the DNA molecule resistant to TaqI cleavage.
Figure S1. The RMC assay for detection of mtDNA point mutations and large
deletions. To detect point mutations and small deletions (top), a single TaqI
restriction site (TCGA) is flanked by a pair of primers, shown in red. Single base
mutations and small deletions within the restriction site are detected with
frequencies of � 10-6 and � 4 x 10⁻⁸, respectively. To detect large mtDNA deletions
(bottom), primers are spaced several kb apart, flank multiple TaqI restriction
sites, and can be placed throughout the mitochondrial genome, depending on
the region to be analyzed. The probability of attaining a PCR product as a result
of multiple point mutations decreases exponentially with the number of TaqI
sites that are flanked, providing a genetic selection that uncovers mutation
events that remove all TaqI sites simultaneously. A second primer set, shown in
green, is used for determination of total copy number. The ratio of deleted
mtDNA molecules versus total mtDNA molecules corresponds to the deletion
frequency.

Validation of assay for deletion detection. We validated our assay using a
plasmid that encodes a commonly observed mtDNA deletion, and yields a
430bp PCR-product when amplified. This deletion is the result of a
rearrangement between two 15bp direct repeats, and accounts for 50-80% of all
deletions recovered from WT and PolgA+/mut mice. We added the plasmid in
decreasing proportion to a large number (106) of mtDNA molecules. Using this
end-point dilution method, we were able to accurately detect the plasmid
harboring the mtDNA deletion over 5 log scales. Dilution of the plasmid in 20-
fold increments resulted in a concomitant linear decrease in the number of
molecules detected (Fig S2).
Figure S2. Assay validation. A TOPO4 plasmid containing a mtDNA deletion
was added in 20-fold dilutions to a pool of 106 WT mtDNA molecules The
logarithm of the number of plasmid molecules added is shown on the y-axis,
and the cycle, C(t), at which these molecules were detected with qPCR is
shown on the x-axis.
Detection of mtDNA deletions produced by oxidative damage and single
molecule amplification. In order to demonstrate the robustness of our assay,
we treated primary normal human dermal fibroblasts with 1mM H2O2. which
allowed for >95% cell survival. Cells were harvested 24-72 hrs post treatment to
permit mutation induction and mtDNA was isolated and analyzed. We
Plasmid detection C(t)
Pla
smid
ad
ded
(lo
g)

recovered multiple mtDNA deletions from the treated cells, but none from the
untreated control cells, constituting a >45-fold induction of deletions. In order to
demonstrate that our assay can detect single deleted mtDNA molecules, we
analyzed multiple tissue samples from mouse brain and heart. Samples were
diluted to single mutant molecule level, amplified, and sequenced in order to
map the breakpoints of the deletion (Fig S3). 98% of the recovered molecules
constituted mtDNA deletions that had lost all TaqI sites, in 2% of the cases
mispriming had occurred on residual nDNA.
Figure S3. Single molecule amplification of deleted mtDNA molecules.
MtDNA, extracted from a 15 month old mouse, was digested with TaqI and
displayed in a 96 well PCR plate, so that only 1 in 10 wells contained an
amplifiable, deleted mtDNA molecule. Single molecules were amplified,
analyzed on a gel, and sequenced. The gel displays six single, PCR-amplified
molecules.
200bp
600bp
400bp
800bp

Figure S4. mtDNA deletions in heart tissue as a function of age in WT,
PolgA+/mut and PolgAmut/mut mice. The average frequency of deletions in young
(1-3 months) WT mice is set to 1. Fold increases over that baseline are
depicted. * signifies a statistical difference (P<0.01, two sided t-test) between
PolgAmut/mut and WT animals at 1-3 or 15-17 months of age.
0
10
20
30
40
50
0 10 20 30 40
age (months)
fold
incre
ase
WT
+/mut
mut/mut
*
*

Figure S5. MtDNA deletion load at two additional loci. Deletion load was
assessed using two additional primer sets that exclude detection of
recombination events between a 15bp direct repeat. The level of deletions in 15
month old PolgAmut/mut mice (n=3) is compared to age matched WT mice (n=3).
The deletion load of WT mice was normalized to 1. PolgAmut/mut mice displayed
91 and 99-fold increases over WT levels (P<0.01, two sided t-test, n=3).
deletion load site 1 and 2
0
20
40
60
80
100
120
1 2
fold
incre
ase
WT
mut/mut
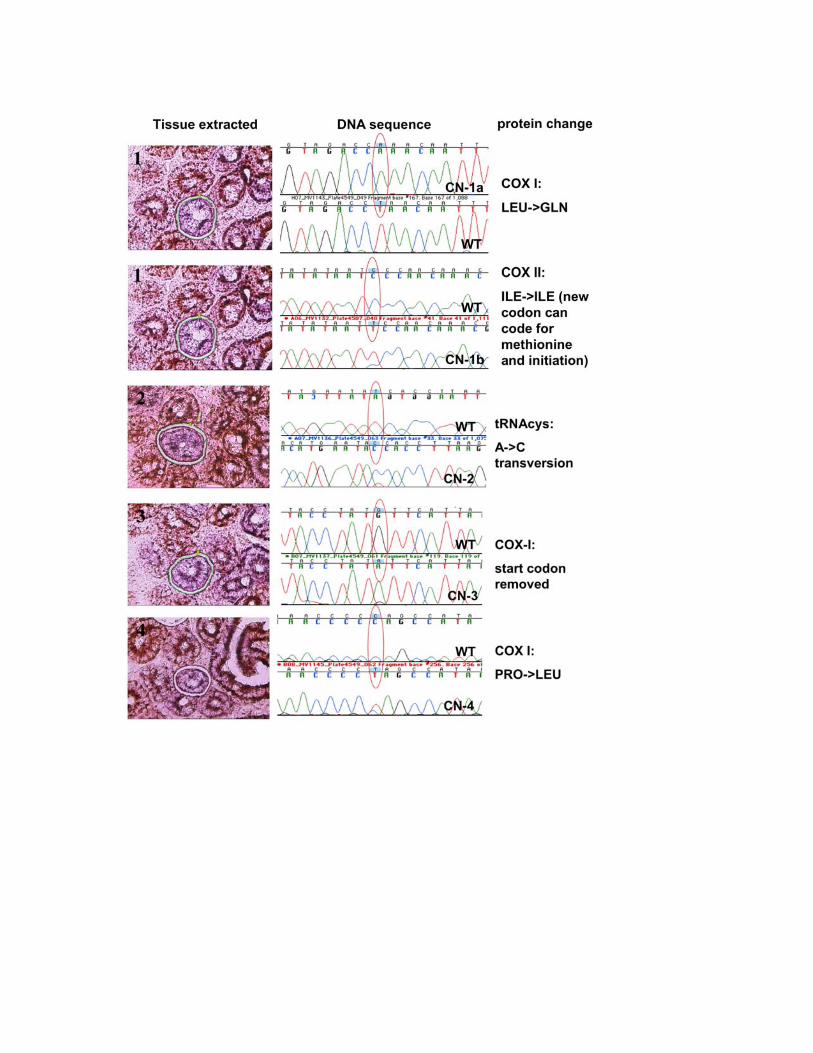
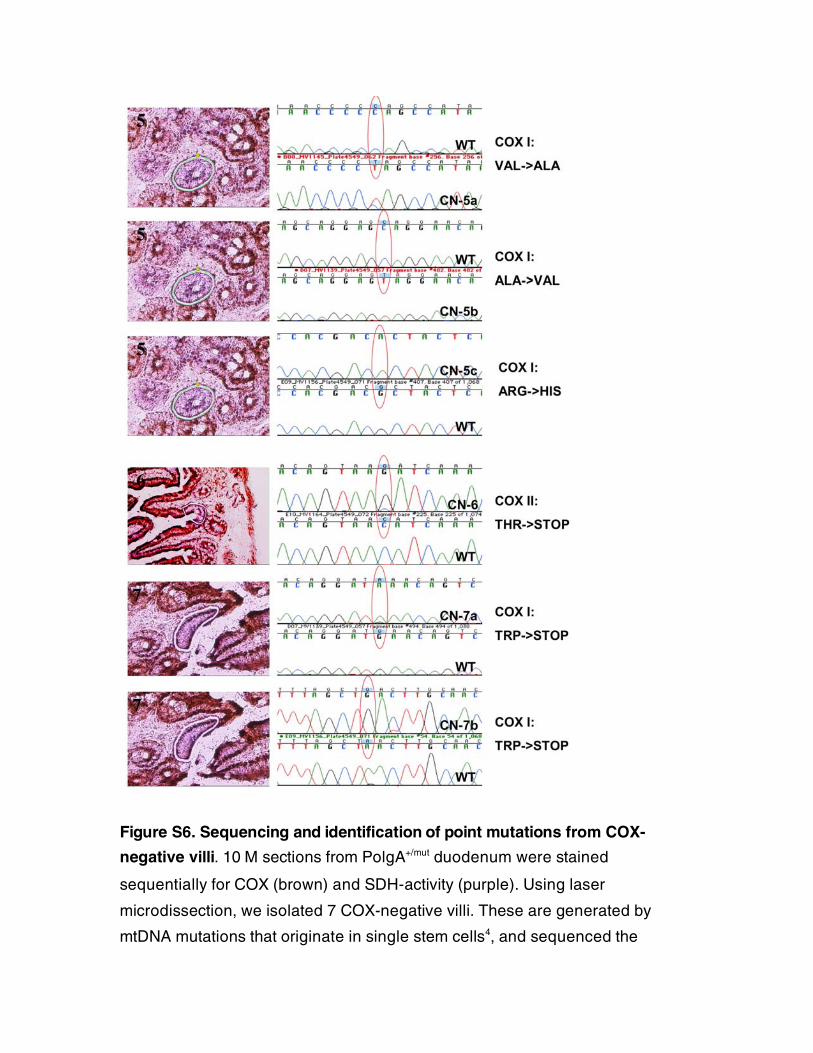
Figure S6. Sequencing and identification of point mutations from COX-
negative villi. 10 � M sections from PolgA+/mut duodenum were stained
sequentially for COX (brown) and SDH-activity (purple). Using laser
microdissection, we isolated 7 COX-negative villi. These are generated by
mtDNA mutations that originate in single stem cells4, and sequenced the

mitochondrial COX-genes. Point mutations with high degrees of heteroplasmy
were found in all instances and resulted either in lost start codons (CN-3),
premature stop codons (CN-6, 7a-b), or changes in conserved amino acid
residues (CN-1a, 2, 4, and 5a-c).
Figure S7. Quantitative PCR can detect mtDNA deletions from small amounts of
starting material. In order to demonstrate that we could detect near
homoplasmic deletions in cells using qPCR, we isolated normal, and COX-
negative SDH-hyperreactive, muscle fibers from WT mice using laser
microdissection. Fibers were selected (Fig. S5A, E), freed from the surrounding
tissue with a UV-laser (Fig. S5B, F), and catapulted into a cap (Fig. S5C, G).
COX-negative, SDH hyperreactive fibers invariably contain a single large
mtDNA deletion5. We lysed the fibers, and performed competitive qPCR with ten
200bp long amplicons, scattered throughout the genome, to detect copynumber
differences between them. The location of the amplicon relative to the mtDNA is
listed on the x-axis. A similar approach to detect deletions, using a limited
number of amplicons has been employed successfully by others6. PCR
products from WT fibers amplified in a very similar fashion, indicating the
absence of near homoplasmic deletions (fig. S5D), whereas COX-negative
fibers displayed amplification patterns indicative of two distinct sets of mtDNA
molecules (fig. S5H). One mtDNA molecule was present in high copynumber
(blue), and could only be amplified with a subset of neighbouring amplicons,
demonstrating it is a deleted mtDNA molecule. A second mtDNA molecule was
rare, but could be amplified equally with all primer pairs, demonstrating it is a
full length molecule. This approach thus provides qualitative data on the size
and the location of near homoplasmic mtDNA deletions, and quantifies the
relative ratio of WT vs. deleted mtDNA molecules as well. This allows one to
directly estimate if the threshold at which mtDNA mutations result in COX-
deficiency (approximately >80% mutant vs normal mtDNA) is breached (red
line). Amplicons function as internal controls for their neighbours. In the
example presented in figure 5H, one deleted mtDNA molecule was present
containing only bp4000-6000, which includes the origin of light strand
replication and is in 10-fold excess to WT mtDNA.
Table S1 Primers for mouse mtDNA bp Control forward: TCGGCGTAAAACGTGTCAAC 350-369
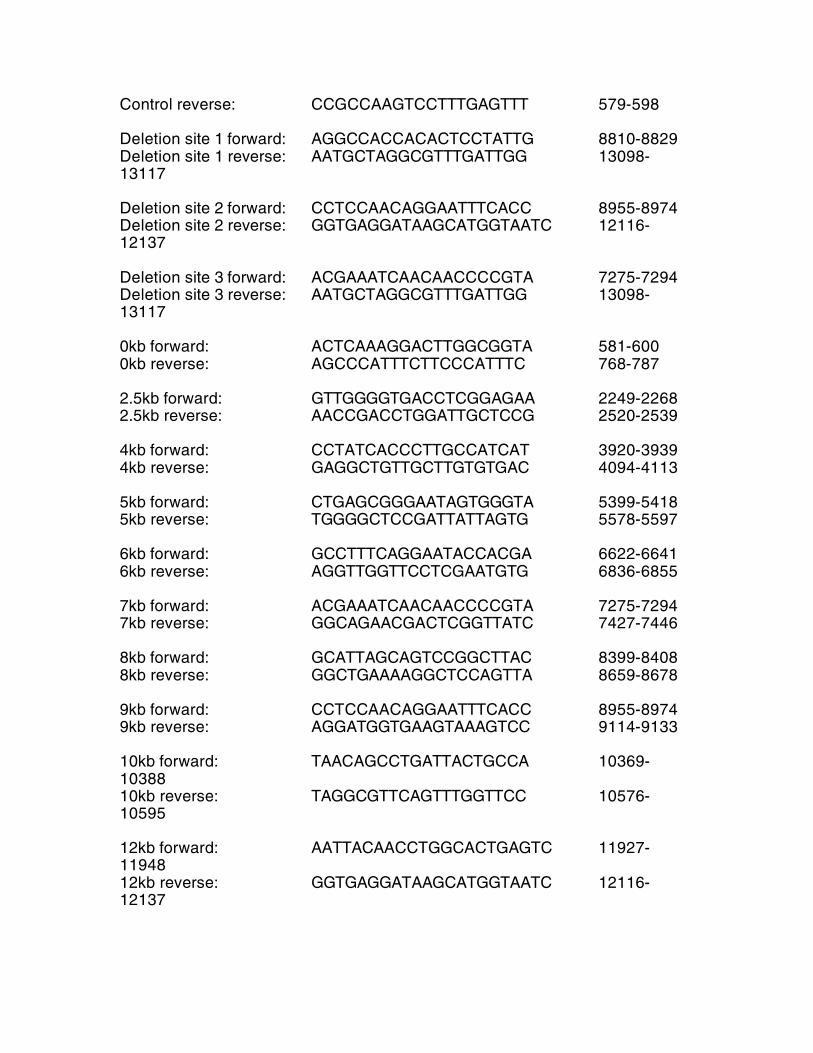
Control reverse: CCGCCAAGTCCTTTGAGTTT 579-598 Deletion site 1 forward: AGGCCACCACACTCCTATTG 8810-8829 Deletion site 1 reverse: AATGCTAGGCGTTTGATTGG 13098-13117 Deletion site 2 forward: CCTCCAACAGGAATTTCACC 8955-8974 Deletion site 2 reverse: GGTGAGGATAAGCATGGTAATC 12116-12137 Deletion site 3 forward: ACGAAATCAACAACCCCGTA 7275-7294 Deletion site 3 reverse: AATGCTAGGCGTTTGATTGG 13098-13117 0kb forward: ACTCAAAGGACTTGGCGGTA 581-600 0kb reverse: AGCCCATTTCTTCCCATTTC 768-787 2.5kb forward: GTTGGGGTGACCTCGGAGAA 2249-2268 2.5kb reverse: AACCGACCTGGATTGCTCCG 2520-2539 4kb forward: CCTATCACCCTTGCCATCAT 3920-3939 4kb reverse: GAGGCTGTTGCTTGTGTGAC 4094-4113 5kb forward: CTGAGCGGGAATAGTGGGTA 5399-5418 5kb reverse: TGGGGCTCCGATTATTAGTG 5578-5597 6kb forward: GCCTTTCAGGAATACCACGA 6622-6641 6kb reverse: AGGTTGGTTCCTCGAATGTG 6836-6855 7kb forward: ACGAAATCAACAACCCCGTA 7275-7294 7kb reverse: GGCAGAACGACTCGGTTATC 7427-7446 8kb forward: GCATTAGCAGTCCGGCTTAC 8399-8408 8kb reverse: GGCTGAAAAGGCTCCAGTTA 8659-8678 9kb forward: CCTCCAACAGGAATTTCACC 8955-8974 9kb reverse: AGGATGGTGAAGTAAAGTCC 9114-9133 10kb forward: TAACAGCCTGATTACTGCCA 10369-10388 10kb reverse: TAGGCGTTCAGTTTGGTTCC 10576-10595 12kb forward: AATTACAACCTGGCACTGAGTC 11927-11948 12kb reverse: GGTGAGGATAAGCATGGTAATC 12116-12137

Primers for human mtDNA Control forward: ACAGTTTATGTAGCTTACCTCC 574-595 Control reverse: TTGCTGCGTGCTTGATGCTTGT 751-772 Deletion forward: GAACCAACACCTCTTTACAG 8342-8361 Deletion reverse: CCTGCTAATGCTAGGCTGCC 13462-13481 Table S2
WT DNA sequence breakpoint location breakpoint bps homology CAAGCCCTACTAATTAC | ACTAA 9103 | 12976 15 (37X) CATCATAGCCT | GGCAGACGAA 9058 | 12791 9 AATAAACCCA | ATCAAACGCC 9448 | 13103 9 AACAGGAAT | ACCATTCCTA 8968 | 12890 8 (7X) GTCTCCATT | AACGAAAATG 9374 | 13071 8 TTCTATCATTC | ATAGCCTGG 8917 | 12784 7 CTCGTACCAAC | CACACCTAG 8932 | 12706 5 TTCTCCATT | GCCTTCTC 9170 | 12648 4 GCGTTCTA | GCATTCCTAC 8904 | 12714 3 GGATTCTT | TAGCTATAG 8897 | 12292 2 CACTTAACC | ACTCAAGTACA 8982 | 12484 2 GGATTCTTCT | ACCATTCCTAA 8901 | 12890 1 CTGCTGAC | TCGGAGCCC 8956 | 12852 1 CCATTATAC | CTACTGGTCC 9111 | 12516 1 TCTCGGAGT | TGATAATAG 8878 | 12676 0 TCTAGGAGGC | CCTACACATC 8948 | 12719 0 GGCTGCTG | GGAAACAT 8953 | 12819 0 CAACAGGAA | CCCCTAATC 8967 | 13056 0 AGTACTTCTA | ACTCAAGTAC 9020 | 12484 0 CTTATAGAAGG | GACCTCATAA 9067 | 13086 0
PolgA+/mut DNA sequence breakpoint location breakpoint bps homology CAAGCCCTACTAATTAC | ACTAA 9103 | 12976 15 (54X)
AACAGGAAT | ACCATTCCTA 8968 | 12890 8 (4X) TTTACTTC | GTAACAATAAC 9125 | 13029 8 TTTGCAGGATTCTTC | AAAGCT 8900 | 12748 7 CTATCATTC | ATAGCCTGG 8917 | 12784 7 (2X) ACTTCTA | TAACAGCTA 9020 | 12994 7 CTATACGTCTCCATT | AACG 9367 | 13065 7 C>T TACGTCTCCATT | AACG 9373 | 13071 7 CTTTTCC | CCCCTAATCTCC 9360 | 13066 5 -1bp GAAGTCCCAC | CCCCTCA 8997 | 12534 4 TGTACAC | CAACGCCTG 9472 | 12953 4 ATCTAGGA | GCCTCGCCC 8945 | 12870 3 GTCCCACTA | ATCTCCATT 8999 | 13062 3 TCAAGCCC | CTAATCTCC 9093 | 13059 3 ATGGTTCTACA | AAAATCA 9194 | 12831 3 +2bp CATGGCTAA | AAATCGGAA 9206 | 12863 3 TGTTTGG | CCTCGCCCTC 9259 | 12871 3 ATTTTTCTTT | AACGAA 8888 | 13071 2 TAGCCTC | ATACCATTCA 8924 | 12836 2 CAGGAATTTCA | TTCCT 8972 | 12894 2 TTTCACTTC | TCCATTAACG 9287 | 13065 2 TTCTGAGC | TCGGAGCCC 8905 | 12580 1 CCAACACA | ACAAAACCGC 8935 | 13038 1 CACATGATCT | CGGAAGCC 8941 | 12866 1 GCTGACCT | TTCCCCCCC 8957 | 13051 1 TTTCAGA | ACGAAAATGA 9175 | 13072 1 TTTTGTA | CCACATTATTT 9341 | 12592 1 TTTTGTAGACGT | TCCCCCCC 9346 | 13052 1 TTTGCAGGA | CAAAAGACC 8894 | 12913 0 TCTGAGCGT | ACGACAAT 8907 | 12361 0 GTTCTATC | GAAACATCAC 8913 | 12820 0 TCTAGCCT | ACCTAGCATT 8923 | 12709 0 GATCTAGGAGG | AGCACAATT 8947 | 12413 0 GGCTGCTGAC | ATTACACTAA 8955 | 12972 0 GAAACCAACAT | TTTGCCTC 9082 | 12574 0 ACTTTGAAAC | TGCCTTCT 9157 | 12647 0 CACTTCACAT | TCTCCATT 9291 | 13063 0
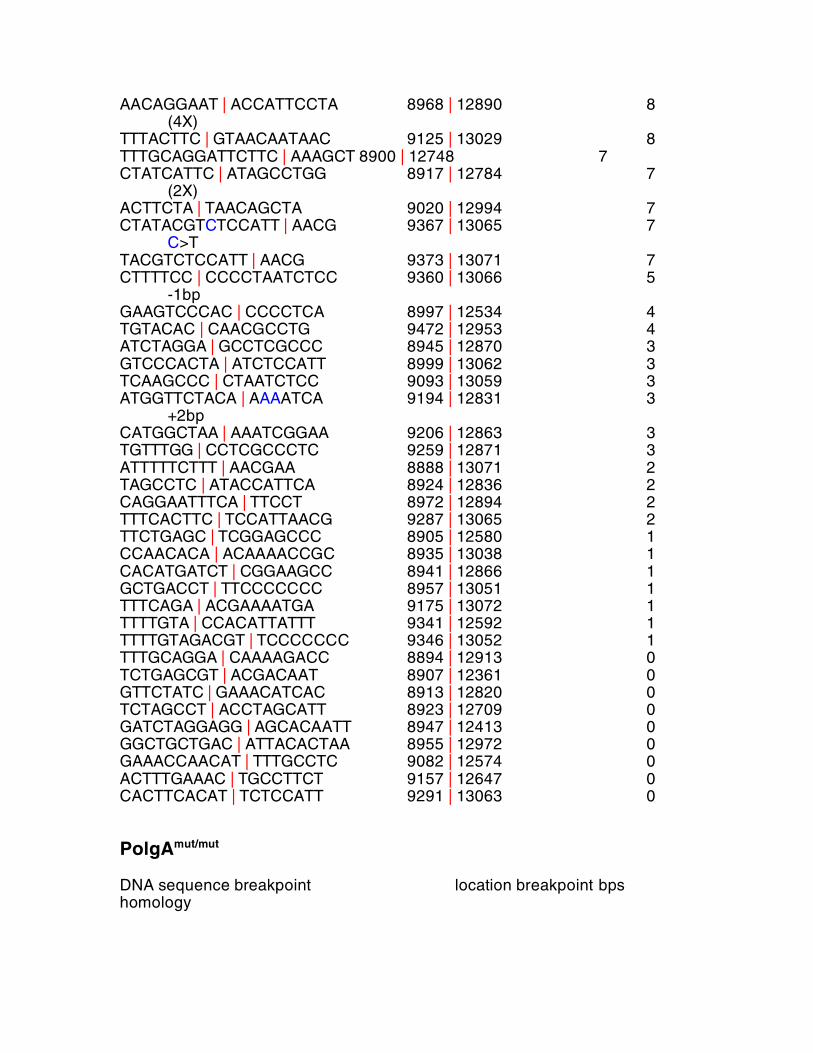
PolgAmut/mut DNA sequence breakpoint location breakpoint bps homology

CAAGCCCTACTAATTAC | ACTAA 9103 | 12976 15 (7X) TTCTGAGCGTT | TTCCCCCCC 8908 | 13051 5 TTCAGATGGT | CCGATTCCA 9179 | 12524 4 TTTCACTTC | TCTACATCAA 9287 | 12654 4 TTGCAGGATTC | CCCCCCTAA 8896 | 13054 3 AGGAATTTC | TCCAACAAC 8971 | 12351 3 TTATTGGATC | GCAGCTACAG 9241 | 12396 3 TGCTGACCTCC | CAGACCTC 8959 | 13084 2 TACTTCTAGC | CTCGGAGCCC 9022 | 12579 2 TCTAGCATCA | TCACAAAAA 9026 | 12826 2 GCCCTACT | GGCAGACG 9097 | 12791 2 CACTTCGGATT | CCCCCCCTAA 9310 | 13053 2 GTCTCGGAAG | TTCCCCCCCT 8877 | 13051 1 TTCTGAGC | ATCCGAAAAAA 8905 | 12807 1 TTCTGAGCGT | CCCCCCCTAA 8907 | 13053 1 CTGACCTC | ACCTAGCATT 8958 | 12709 1 AAACGAAAC | TAACAGGGTT 9077 | 12898 1 TTCAGATG | CCCTACTAAT 9177 | 12964 1 TTTCAGATG | CCAACTAGG 9177 | 12665 1 GCCGCAGCA | CATCCGAAA 9323 | 12806 1 TTGATGAG | GAACCCAGACC 9385 | 13081 1 GTCTCGGAAG | GGTCCGAT 8877 | 12521 0 GTCTCGGAG | GCCTGGCAG 8877 | 12787 0 TCTCGGAAG | GGCAGACGAA 8877 | 12791 0 GTCTCGGAG | ATCTCCATTAA 8877 | 13062 0 GGATTCTTCTG | TACATCAA 8902 | 12656 0 TGAGCGTTCT | GTAACAATAA 8910 | 13029 0 CTAGCC | CTCTCACCCAAA 8922 | 12616 0 CTAGCCTCG | CAAAAGACC 8925 | 12913 0 GGAGGCTG | TCTCCAT 8950 | 13063 0 GCTGCTGACC | CTGAGAAGGG 8956 | 12170 0 TTCAGTAC | CGAACAAGAC 9015 | 12797 0 TCAGGTGTT | ACCCAATCAA 9017 | 13096 0 GTAAACGAAACC | CAGCATAC 9078 | 13007 0 TAAATCAAGC | GACCTCATA 9091 | 13086 0 TAGGACTT | CTCTCACCT 9119 | 12616 0 ACTTCACCA | GAGCCCTAA 9129 | 12583 0 TCCTCCAAGC | CCAAAACG 9139 | 12623 0 CCTCCAAGC | CCTCCACCCA 9139 | 12425 0 GAATACTTTG | TTCCTACTGG 9153 | 12513 0 TTCTCCATTT | GGAATACCA 9160 | 12885 0 TTTCAGAT | CCTGGCAG 9176 | 12788 0 TTCTTCATG | CGACATCAA 9203 | 12629 0 TTCCATGG | GGCCTGATA 9220 | 12672 0 TTCCATGG | GGAAACATCA 9220 | 12819 0 GGATTCCATGGAC | CATCCGA 9222 | 12806 0 TTATTGGATC | GCCTGGCAGACG 9241 | 12787 0 CACTTCGGATT | AGACGAACA 9310 | 12794 0

CCGCAGCA | CGGAAGCC 9323 | 12866 0 CTTCGGATTT | TTCTTCAAA 9311 | 12741 0 TTTGTAGACG | GGCCTGATA 9345 | 12681 0 CTTACTCCC | CATCCGAAA 9396 | 12806 0 Table S2 Sequences, locations and homology surrounding the breakpoints of
isolated mtDNA deletions in WT, PolgA+/mut and PolgAmut/mut mice. Breakpoints
are depicted by vertical red lines. Some deletions were associated with
mutations around the breakpoint. If present, these are listed on the far right.
1. Bielas, J.H. & Loeb, L.A. Quantification of random genomic mutations. Nat
Methods 2, 285-90 (2005). 2. Vermulst, M. et al. Mitochondrial point mutations do not limit the natural lifespan
of mice. Nat Genet 39, 540-3 (2007). 3. Copeland. Mitochondrial DNA, methods and protocols. Methods in Molecular
Biology 197(2002). 4. Greaves, L.C. et al. Mitochondrial DNA mutations are established in human
colonic stem cells, and mutated clones expand by crypt fission. Proc Natl Acad Sci U S A 103, 714-9 (2006).
5. Wanagat, J., Cao, Z., Pathare, P. & Aiken, J.M. Mitochondrial DNA deletion mutations colocalize with segmental electron transport system abnormalities, muscle fiber atrophy, fiber splitting, and oxidative damage in sarcopenia. Faseb J 15, 322-32 (2001).
6. Taylor, R.W. et al. Mitochondrial DNA mutations in human colonic crypt stem cells. J Clin Invest 112, 1351-60 (2003).