large accelerated filer accelerated...
TRANSCRIPT
UNITED STATESSECURITIES AND EXCHANGE COMMISSION
WASHINGTON, D.C. 20549
FORM 10-Q
x QUARTERLY REPORT PURSUANT TO SECTION 13 OR 15(d) OF THE SECURITIES EXCHANGE ACT OF 1934
For the quarterly period ended September 28, 2018
OR
o TRANSITION REPORT PURSUANT TO SECTION 13 OR 15(d) OF THE SECURITIES EXCHANGE ACT OF 1934
For the transition period from to
Commission File Number: 001-10212
ANIXTER INTERNATIONAL INC.(Exact name of registrant as specified in its charter)
Delaware 94-1658138(State or other jurisdiction of Incorporation or Organization) (I.R.S. Employer Identification No.)
2301 Patriot Blvd.Glenview, IL 60026
(224) 521-8000(Address and telephone number of principal executive offices in its charter)
Indicate by check mark whether the registrant (1) has filed all reports required to be filed by Section 13 or 15(d) of the Securities Exchange Act of 1934during the preceding 12 months (or for such shorter period that the registrant was required to file such reports), and (2) has been subject to such filing requirementsfor the past 90 days. Yes x No o
Indicate by check mark whether the registrant has submitted electronically and posted on its corporate Web site, if any, every Interactive Data File requiredto be submitted and posted pursuant to Rule 405 of Regulation S-T (§232.405 of this chapter) during the preceding 12 months (or for such shorter period that theregistrant was required to submit and post such files). Yes x No o
Indicate by check mark whether the registrant is a large accelerated filer, an accelerated filer, a non-accelerated filer, a smaller reporting company, or anemerging growth company. See the definitions of “large accelerated filer,” “accelerated filer,” “smaller reporting company” and "emerging growth company" inRule 12b-2 of the Exchange Act.
Large Accelerated Filer x Accelerated Filer o
Non-Accelerated Filer o (Do not check if a smaller reporting company) Smaller Reporting Company o
Emerging Growth Company o
If an emerging growth company, indicate by check mark if the registrant has elected not to use the extended transition period for complying with any new orrevised financial accounting standards provided pursuant to Section 13(a) of the Exchange Act. o
Indicate by check mark whether the registrant is a shell company (as defined in Rule 12b-2 of the Exchange Act).Yes o No x
At October 17, 2018 , 33,481,846 shares of registrant’s Common Stock, $1 par value, were outstanding.
TABLE OF CONTENTS
Page PART I. FINANCIAL INFORMATION Item 1. Condensed Consolidated Financial Statements (unaudited) 1Item 2. Management’s Discussion and Analysis of Financial Condition and Results of Operations 15Item 3. Quantitative and Qualitative Disclosures About Market Risk 27Item 4. Controls and Procedures 27 PART II. OTHER INFORMATION Item 1. Legal Proceedings 28Item 1A. Risk Factors 28Item 6. Exhibits 28
This report may contain various “forward-looking statements” within the meaning of Section 27A of the Securities Act of 1933, as amended, and Section 21E ofthe Securities Exchange Act of 1934, as amended. These statements can be identified by the use of forward-looking terminology such as “believes”, “expects”,“intends”, “anticipates”, “contemplates”, “estimates”, “plans”, “projects”, “should”, “may”, “will” or the negative thereof or other variations thereon orcomparable terminology indicating our expectations or beliefs concerning future events. We caution that such statements are qualified by important factors thatcould cause actual results to differ materially from those in the forward-looking statements, a number of which are identified in this report. Other factors couldalso cause actual results to differ materially from expected results included in these statements. These factors include but are not limited to general economicconditions, the level of customer demand particularly for capital projects in the markets we serve, changes in supplier or customer relationships, risks associatedwith nonconforming products and services, political, economic or currency risks related to non-U.S. operations, new or changed competitors, risks associated withinventory and accounts receivable, copper and commodity price fluctuations, risks associated with substantial debt and restrictions contained in financial andoperating covenants in our debt agreements, capital project volumes, the impact of regulation and regulatory, investigative and legal proceedings and legalcompliance risks, information security risks, the impact and the uncertainty concerning the timing and terms of the withdrawal by the United Kingdom from theEuropean Union, unanticipated changes in our tax provision and tax liabilities related to the enactment of the Tax Cuts and Jobs Act, and risks associated with theintegration of acquired companies including, but not limited to, the risk that the acquisitions may not provide us with the synergies or other benefits that wereanticipated.
i

PART I. FINANCIAL INFORMATION
ITEM 1. CONDENSED CONSOLIDATED FINANCIAL STATEMENTS.
ANIXTER INTERNATIONAL INC.
CONDENSED CONSOLIDATED STATEMENTS OF COMPREHENSIVE INCOME(Unaudited)
Three Months Ended Nine Months Ended
September 28,
2018 September 29,
2017 September 28,
2018 September 29,
2017
(In millions, except per share amounts) Net sales $ 2,179.0 $ 2,016.4 $ 6,281.1 $ 5,913.6
Cost of goods sold 1,754.9 1,619.2 5,053.1 4,741.0Gross profit 424.1 397.2 1,228.0 1,172.6
Operating expenses 334.6 316.4 1,005.6 940.3Operating income 89.5 80.8 222.4 232.3Other expense:
Interest expense (19.3) (18.9) (56.5) (55.7)Other, net (1.6) 0.5 (2.6) (0.5)
Income before income taxes 68.6 62.4 163.3 176.1Income tax expense 21.0 24.8 48.8 67.5
Net income $ 47.6 $ 37.6 $ 114.5 $ 108.6
Income per share: Basic $ 1.41 $ 1.12 $ 3.39 $ 3.24 Diluted $ 1.40 $ 1.11 $ 3.36 $ 3.20
Basic weighted-average common shares outstanding 33.8 33.6 33.8 33.6Effect of dilutive securities:
Stock options and units 0.3 0.4 0.3 0.4
Diluted weighted-average common shares outstanding 34.1 34.0 34.1 34.0
Net income $ 47.6 $ 37.6 $ 114.5 $ 108.6Other comprehensive income (loss): Foreign currency translation 6.5 17.5 (22.8) 40.5 Changes in unrealized pension cost, net of tax 0.7 1.1 1.9 3.0 Other comprehensive income (loss) 7.2 18.6 (20.9) 43.5
Comprehensive income $ 54.8 $ 56.2 $ 93.6 $ 152.1
See accompanying notes to the Condensed Consolidated Financial Statements.
1

ANIXTER INTERNATIONAL INC.CONDENSED CONSOLIDATED BALANCE SHEETS
(Unaudited)
September 28,
2018 December 29,
2017
(In millions, except share and per share amounts) ASSETS
Current assets: Cash and cash equivalents $ 69.9 $ 116.0Accounts receivable, net 1,637.5 1,434.2Inventories 1,363.6 1,238.7Other current assets 45.6 44.9
Total current assets 3,116.6 2,833.8Property and equipment, at cost 404.2 376.9Accumulated depreciation (242.1) (222.6)
Property and equipment, net 162.1 154.3Goodwill 833.4 778.1Intangible assets, net 405.0 378.8Other assets 108.5 107.2
Total assets $ 4,625.6 $ 4,252.2LIABILITIES AND STOCKHOLDERS’ EQUITY
Current liabilities: Accounts payable $ 1,298.7 $ 1,081.6Accrued expenses 303.6 269.2Current portion of long-term debt 349.3 —
Total current liabilities 1,951.6 1,350.8Long-term debt 914.4 1,247.9Other liabilities 195.5 194.5
Total liabilities 3,061.5 2,793.2Stockholders’ equity: Common stock - $1.00 par value, 100,000,000 shares authorized, 33,853,031 and 33,657,466 shares issued andoutstanding at September 28, 2018 and December 29, 2017, respectively 33.9 33.7
Capital surplus 290.0 278.7Retained earnings 1,471.4 1,356.9Accumulated other comprehensive loss:
Foreign currency translation (146.0) (123.2)Unrecognized pension liability, net (85.2) (87.1)
Total accumulated other comprehensive loss (231.2) (210.3)Total stockholders’ equity 1,564.1 1,459.0
Total liabilities and stockholders’ equity $ 4,625.6 $ 4,252.2
See accompanying notes to the Condensed Consolidated Financial Statements.
2

ANIXTER INTERNATIONAL INC.CONDENSED CONSOLIDATED STATEMENTS OF CASH FLOWS
(Unaudited)
Nine Months Ended
September 28,
2018 September 29,
2017
(In millions) Operating activities:
Net income $ 114.5 $ 108.6Adjustments to reconcile net income to net cash provided by operating activities:
Depreciation 23.3 21.5Amortization of intangible assets 28.6 27.1Stock-based compensation 15.0 13.3Deferred income taxes 0.1 1.3Accretion of debt discount 1.8 1.7Amortization of deferred financing costs 1.2 1.6Pension plan contributions (5.8) (14.8)Pension plan expenses 3.2 7.9Changes in current assets and liabilities, net (74.8) (53.9)Other, net (4.3) (4.2)
Net cash provided by operating activities 102.8 110.1Investing activities:
Acquisitions of businesses, net of cash acquired (149.9) —Capital expenditures, net (32.0) (30.9)Other 9.1 —
Net cash used in investing activities (172.8) (30.9)Financing activities:
Proceeds from borrowings 2,036.8 1,324.2Repayments of borrowings (2,020.5) (1,370.9)Repayments of Canadian term loan — (70.9)Proceeds from stock options exercised 1.5 3.5Other, net — (0.2)
Net cash provided by (used in) financing activities 17.8 (114.3)Decrease in cash and cash equivalents (52.2) (35.1)Effect of exchange rate changes on cash balances 6.1 (3.1)Cash and cash equivalents at beginning of period 116.0 115.1Cash and cash equivalents at end of period $ 69.9 $ 76.9
See accompanying notes to the Condensed Consolidated Financial Statements.
3

ANIXTER INTERNATIONAL INC.NOTES TO THE UNAUDITED CONDENSED CONSOLIDATED FINANCIAL STATEMENTS
NOTE 1. SUMMARY OF SIGNIFICANT ACCOUNTING POLICIES
Basis of presentation: The unaudited interim Condensed Consolidated Financial Statements of Anixter International Inc. and its subsidiaries (collectivelyreferred to as "Anixter" or the "Company"), sometimes referred to in this Quarterly Report on Form 10-Q as "we", "our", "us", or "ourselves" have been preparedpursuant to the rules and regulations of the Securities and Exchange Commission ("SEC"). Therefore, certain information and disclosures normally included infinancial statements and related notes prepared in accordance with accounting principles generally accepted in the United States of America ("U.S. GAAP") havebeen condensed or omitted. Certain prior period amounts have been reclassified to conform to the current year presentation.
These financial statements should be read in conjunction with, and have been prepared in conformity with, the accounting principles reflected in theconsolidated financial statements and related notes included in Anixter's Annual Report on Form 10-K for the year ended December 29, 2017 ("2017 Form 10-K").The condensed consolidated financial information furnished herein reflects all adjustments (consisting of normal recurring accruals), which are, in the opinion ofmanagement, necessary for a fair presentation of the Condensed Consolidated Financial Statements for the periods shown.
The Company maintains its financial records on the basis of a fiscal year ending on the Friday nearest December 31, with the fiscal quarters spanningthirteen weeks, with the first quarter ending on the Friday of the first thirteen-week period. The third quarter of fiscal year 2018 ended on September 28, 2018, andthe third quarter of fiscal year 2017 ended on September 29, 2017.
Recently issued and adopted accounting pronouncements: In May 2014, the Financial Accounting Standards Board ("FASB") issued Accounting StandardsUpdate ("ASU") 2014-09, Revenue from Contracts with Customers , and issued subsequent amendments to the initial guidance in August 2015, March 2016, April2016, May 2016 and December 2016 within ASU 2015-14, ASU 2016-08, ASU 2016-10, ASU 2016-12 and ASU 2016-20, respectively. The core principle of thisnew revenue recognition guidance is that a company will recognize revenue when promised goods or services are transferred to customers in an amount thatreflects the consideration to which the company expects to be entitled in exchange for those goods or services. The new guidance defines a five-step process toachieve this core principle. The new guidance also requires more detailed disclosures to enable users of financial statements to understand the nature, amount,timing, and uncertainty of revenue and cash flows arising from contracts with customers. The new guidance provides for two transition methods, a fullretrospective approach and a modified retrospective approach. Anixter adopted the new revenue recognition guidance on December 30, 2017 utilizing the modifiedretrospective method of adoption for contracts not completed at the adoption date, and determined there were no changes required to its reported revenues as aresult of the adoption. The Company has enhanced its disclosures of revenue to comply with the new guidance.
In January 2017, the FASB issued ASU 2017-01, Business Combinations: Clarifying the Definition of a Business , which adds guidance to assist entities withevaluating whether transactions should be accounted for as acquisitions (or disposals) of assets or businesses. The standard was effective for Anixter's financialstatements issued for fiscal years beginning after December 15, 2017, and interim periods within those fiscal years. The Company adopted this standard effectivethe first quarter of fiscal year 2018. The result of this adoption did not have a material impact on the Condensed Consolidated Financial Statements.
In March 2017, the FASB issued ASU 2017-07, Compensation - Retirement Benefits: Improving the Presentation of Net Periodic Pension Cost and NetPeriodic Postretirement Benefit Cost , which changes how employers that sponsor defined benefit pension or other postretirement benefit plans present the netperiodic benefit cost in the income statement. The new guidance requires entities to report the service cost component in the same line item as other compensationcosts. The other components of net benefit cost are required to be presented in the income statement separately from the service cost component outside of incomefrom operations. The standard was effective for Anixter's financial statements issued for fiscal years beginning after December 15, 2017, and interim periodswithin those fiscal years. Upon adoption, ASU 2017-07 required changes to the presentation of the income statement to be applied retrospectively. The Companyadopted this standard effective the first quarter of fiscal year 2018. Service costs are recognized within "Operating expenses" in the Condensed ConsolidatedStatement of Comprehensive Income. All other components of net benefit costs are recorded in "Other, net" in the Company's Condensed Consolidated Statementsof Comprehensive Income. The result of this adoption did not have a material impact on the Condensed Consolidated Financial Statements.
4

ANIXTER INTERNATIONAL INC.NOTES TO THE UNAUDITED CONDENSED CONSOLIDATED FINANCIAL STATEMENTS – (Continued)
In May 2017, the FASB issued ASU 2017-09, Compensation - Stock Compensation: Scope of Modification Accounting , which clarifies when changes to theterms or conditions of a share-based payment award must be accounted for as modifications. Under the new guidance, modification accounting is required only ifthe fair value, the vesting conditions, or the classification of the award changes as a result of the change in terms or conditions. ASU 2017-09 was appliedprospectively to awards modified on or after the adoption date. The standard was effective for Anixter’s financial statements issued for fiscal years beginning afterDecember 15, 2017, and interim periods within those fiscal years. The Company adopted this standard effective the first quarter of fiscal year 2018. The result ofthis adoption did not have a material impact on the Condensed Consolidated Financial Statements.
Recently issued accounting pronouncements not yet adopted: In February 2016, the FASB issued ASU 2016-02, Leases , which requires lessees torecognize assets and liabilities on the balance sheet for the rights and obligations created by all leases with terms of more than 12 months. The standard is effectivefor Anixter's financial statements issued for fiscal years beginning after December 15, 2018, and interim periods within those fiscal years. The Company hasestablished an implementation team and is implementing a new lease accounting information system. In July 2018, the FASB issued additional authoritativeguidance providing companies with an optional prospective transition method to apply the provisions of this guidance. The Company will adopt the standard in thefirst quarter of 2019 and elect this transition method to apply the standard prospectively. While the Company is currently evaluating the impact of adoption of thisASU, the adoption is expected to result in a material increase in the assets and liabilities recorded on the Condensed Consolidated Balance Sheets.
In June 2016, the FASB issued ASU 2016-13, Financial Instruments - Credit Losses , which requires the measurement of expected credit losses for financialinstruments held at the reporting date based on historical experience, current conditions and reasonable forecasts. The main objective of this ASU is to providefinancial statement users with more decision-useful information about the expected credit losses on financial instruments and other commitments to extend creditheld by a reporting entity at each reporting date. The standard is effective for Anixter's financial statements issued for fiscal years beginning after December 15,2019, and interim periods within those fiscal years. Early adoption is permitted for fiscal years beginning after December 15, 2018, and interim periods withinthose fiscal years. The Company is currently evaluating the impact of adoption of this ASU, but it is not expected to have a material effect on the Company'sCondensed Consolidated Financial Statements.
In January 2017, the FASB issued ASU 2017-04, Intangibles - Goodwill and Other: Simplifying the Test for Goodwill Impairment , which removes step twofrom the goodwill impairment test. Step two measures a goodwill impairment loss by comparing the implied fair value of a reporting unit's goodwill with thecarrying amount of that goodwill. The new guidance requires an entity to perform its goodwill impairment test by comparing the fair value of a reporting unit withits carrying amount, including goodwill. The standard is effective for Anixter's financial statements issued for fiscal years beginning after December 15, 2019.Early adoption is permitted for interim or annual goodwill impairment tests performed on testing dates after January 1, 2017. The Company is currently assessingthe impact the adoption of this ASU will have on its methodology for evaluating goodwill for impairment subsequent to adoption of this standard.
In February 2018, the FASB issued ASU 2018-02, Income Statement - Reporting Comprehensive Income: Reclassification of Certain Tax Effects fromAccumulated Other Comprehensive Income, which will allow a reclassification from accumulated other comprehensive income to retained earnings for the taxeffects resulting from the December 22, 2017 enactment of the Tax Cuts and Jobs Act (the "Act") that are stranded in accumulated other comprehensive income.The standard is effective for Anixter's financial statements issued for fiscal years beginning after December 15, 2018, and interim periods within those fiscal years.Early adoption is permitted. The Company is currently evaluating the impact of adoption of this ASU on its Condensed Consolidated Financial Statements.
In June 2018, the FASB issued ASU 2018-07, Compensation - Stock Compensation: Improvements to Nonemployee Share-Based Payment Accounting,which will expand the scope of Topic 718 to include share-based payment transactions for acquiring goods and services from nonemployees. The standard iseffective for Anixter's financial statements issued for fiscal years beginning after December 15, 2018, and interim periods within those fiscal years. Early adoptionis permitted. The Company is currently evaluating the impact of adoption of this ASU on its Condensed Consolidated Financial Statements.
In August 2018, the FASB issued ASU 2018-13, Fair Value Measurement: Changes to the Disclosure Requirements for Fair Value Measurement, whichchanges the disclosure requirements for fair value measurements by removing, adding and modifying certain disclosures. The standard is effective for Anixter'sfinancial statements issued for fiscal years beginning after December 15, 2019. Early adoption is permitted. The Company is currently evaluating the impact ofadoption of this ASU on its related disclosures.
5

ANIXTER INTERNATIONAL INC.NOTES TO THE UNAUDITED CONDENSED CONSOLIDATED FINANCIAL STATEMENTS – (Continued)
In August 2018, the FASB issued ASU 2018-14, Compensation - Retirement Benefits - Defined Benefit Plans - General: Changes to the DisclosureRequirements for Defined Benefit Plans, which modifies the disclosure requirements for employers that sponsor defined benefit pension or other postretirementplans by removing and adding certain disclosures for these plans. The standard is effective for Anixter's financial statements issued for fiscal years ending afterDecember 15, 2020. Early adoption is permitted. The Company is currently evaluating the impact of adoption of this ASU on its related disclosures.
In August 2018, the FASB issued ASU 2018-15, Intangibles—Goodwill and Other—Internal-Use Software: Customer's Accounting for ImplementationCosts Incurred in a Cloud Computing Arrangement that is a Service Contract, which will align the requirements for capitalizing implementation costs incurred in ahosting arrangement that is a service contract with the requirements for capitalizing implementation costs incurred to develop or obtain internal-use software. Thestandard is effective for Anixter's financial statements issued for fiscal years beginning after December 15, 2019. Early adoption is permitted and the Companyintends to early adopt in the fourth quarter of 2018. The Company is currently evaluating the impact of adoption of this ASU on its Condensed ConsolidatedFinancial Statements.
The Company does not believe that any other recently issued, but not yet effective, accounting pronouncements, if adopted, would have a material impact onits Condensed Consolidated Financial Statements or disclosures.
Revenue recognition : Anixter is a leading global distributor of network and security solutions, electrical and electronic solutions and utility power solutions.Through a global distribution network along with supply chain and technical expertise, Anixter helps customers reduce the risk, cost and complexity of their supplychains. Anixter is a leader in providing advanced inventory management services including procurement, just-in-time delivery, material management programs,turn-key yard layout and management, quality assurance testing, component kit production, storm/event kitting, small component assembly and e-commerce andelectronic data interchange to a broad spectrum of customers with over 600,000 products. Revenue arrangements primarily consist of a single performanceobligation to transfer promised goods or services. See Note 8. "Business Segments" for revenue disaggregated by geography.
Sales to customers and related cost of sales are primarily recognized at the point in time when control of goods transfers to the customer. For product sales,this generally occurs upon shipment of the products, however, this may occur at a later date depending on the agreed upon sales terms, such as delivery at thecustomer's designated location, or based on consignment terms. In instances where goods are not stocked by Anixter and delivery times are critical, product ispurchased from the manufacturer and drop-shipped to the customer. Anixter generally takes control of the goods when shipped by the manufacturer and thenrecognizes revenue when control of the product transfers to the customer. When providing services, sales are recognized over time as control transfers to thecustomer, which occurs as services are rendered.
Revenue is measured as the amount of consideration the Company expects to receive in exchange for transferring goods or providing services. The Companyestimates different forms of variable consideration at the time of sale based on historical experience, current conditions and contractual obligations. Revenue isrecorded net of customer discounts, rebates and similar charges. When Anixter offers the right to return product, historical experience is utilized to establish aliability for the estimate of expected returns. Sales and other tax amounts collected from customers for remittance to governmental authorities are excluded fromrevenue. The Company has elected to treat shipping and handling as a fulfillment activity. The practical expedient not to disclose information about remainingperformance obligations has also been elected as these contacts have an original duration of one year or less or are contracts where the Company has applied thepractical expedient to recognize service revenue in proportion to the amount Anixter has the right to invoice. The Company typically receives payment 30 to 60days from the point it has satisfied the related performance obligation.
At December 29, 2017 , $9.5 million of deferred revenue related to outstanding contracts was reported in "Accrued expenses" in the Company'sConsolidated Balance Sheet . This balance primarily represents prepayments from customers. During the three and nine months ended September 28, 2018 , $1.6million and $7.0 million , respectively, of this deferred revenue was recognized. At September 28, 2018 , deferred revenue was $14.4 million . The Companyexpects to recognize this balance as revenue within the next twelve months.
6
ANIXTER INTERNATIONAL INC.NOTES TO THE UNAUDITED CONDENSED CONSOLIDATED FINANCIAL STATEMENTS – (Continued)
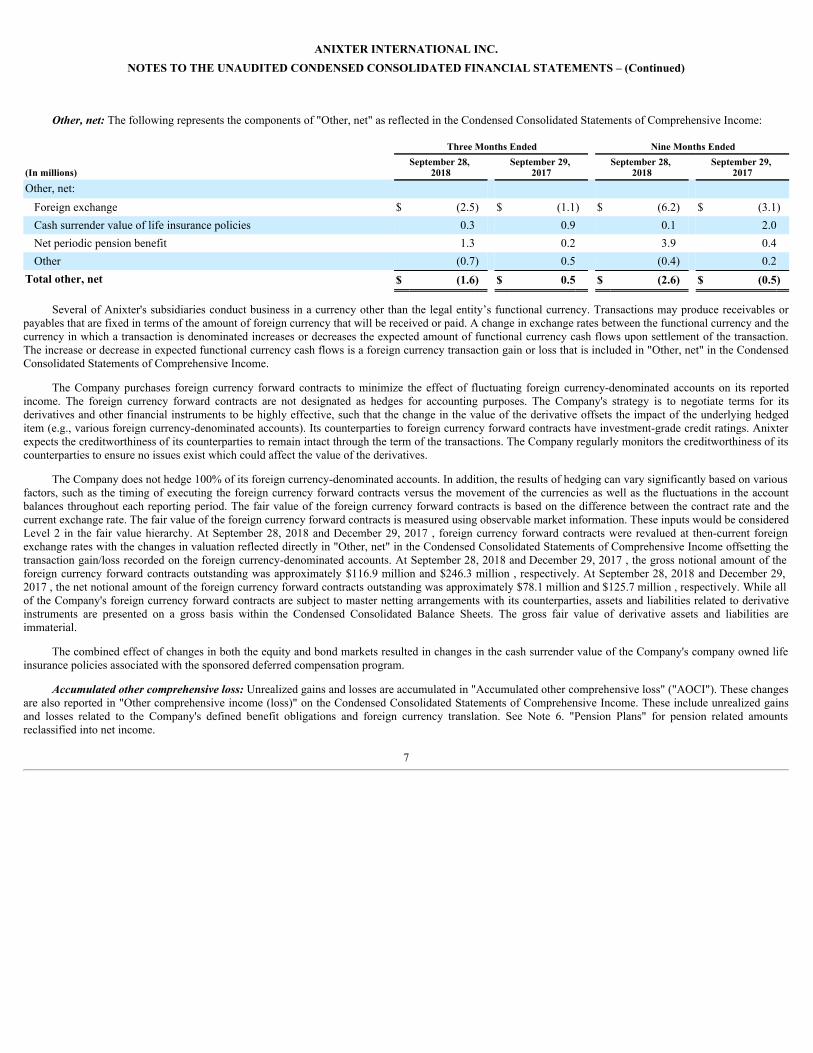
Other, net: The following represents the components of "Other, net" as reflected in the Condensed Consolidated Statements of Comprehensive Income:
Three Months Ended Nine Months Ended
(In millions) September 28,
2018 September 29,
2017 September 28,
2018 September 29,
2017Other, net: Foreign exchange $ (2.5) $ (1.1) $ (6.2) $ (3.1)Cash surrender value of life insurance policies 0.3 0.9 0.1 2.0Net periodic pension benefit 1.3 0.2 3.9 0.4Other (0.7) 0.5 (0.4) 0.2
Total other, net $ (1.6) $ 0.5 $ (2.6) $ (0.5)
Several of Anixter's subsidiaries conduct business in a currency other than the legal entity’s functional currency. Transactions may produce receivables orpayables that are fixed in terms of the amount of foreign currency that will be received or paid. A change in exchange rates between the functional currency and thecurrency in which a transaction is denominated increases or decreases the expected amount of functional currency cash flows upon settlement of the transaction.The increase or decrease in expected functional currency cash flows is a foreign currency transaction gain or loss that is included in "Other, net" in the CondensedConsolidated Statements of Comprehensive Income.
The Company purchases foreign currency forward contracts to minimize the effect of fluctuating foreign currency-denominated accounts on its reportedincome. The foreign currency forward contracts are not designated as hedges for accounting purposes. The Company's strategy is to negotiate terms for itsderivatives and other financial instruments to be highly effective, such that the change in the value of the derivative offsets the impact of the underlying hedgeditem (e.g., various foreign currency-denominated accounts). Its counterparties to foreign currency forward contracts have investment-grade credit ratings. Anixterexpects the creditworthiness of its counterparties to remain intact through the term of the transactions. The Company regularly monitors the creditworthiness of itscounterparties to ensure no issues exist which could affect the value of the derivatives.
The Company does not hedge 100% of its foreign currency-denominated accounts. In addition, the results of hedging can vary significantly based on variousfactors, such as the timing of executing the foreign currency forward contracts versus the movement of the currencies as well as the fluctuations in the accountbalances throughout each reporting period. The fair value of the foreign currency forward contracts is based on the difference between the contract rate and thecurrent exchange rate. The fair value of the foreign currency forward contracts is measured using observable market information. These inputs would be consideredLevel 2 in the fair value hierarchy. At September 28, 2018 and December 29, 2017 , foreign currency forward contracts were revalued at then-current foreignexchange rates with the changes in valuation reflected directly in "Other, net" in the Condensed Consolidated Statements of Comprehensive Income offsetting thetransaction gain/loss recorded on the foreign currency-denominated accounts. At September 28, 2018 and December 29, 2017 , the gross notional amount of theforeign currency forward contracts outstanding was approximately $116.9 million and $246.3 million , respectively. At September 28, 2018 and December 29,2017 , the net notional amount of the foreign currency forward contracts outstanding was approximately $78.1 million and $125.7 million , respectively. While allof the Company's foreign currency forward contracts are subject to master netting arrangements with its counterparties, assets and liabilities related to derivativeinstruments are presented on a gross basis within the Condensed Consolidated Balance Sheets. The gross fair value of derivative assets and liabilities areimmaterial.
The combined effect of changes in both the equity and bond markets resulted in changes in the cash surrender value of the Company's company owned lifeinsurance policies associated with the sponsored deferred compensation program.
Accumulated other comprehensive loss: Unrealized gains and losses are accumulated in "Accumulated other comprehensive loss" ("AOCI"). These changesare also reported in "Other comprehensive income (loss)" on the Condensed Consolidated Statements of Comprehensive Income. These include unrealized gainsand losses related to the Company's defined benefit obligations and foreign currency translation. See Note 6. "Pension Plans" for pension related amountsreclassified into net income.
7

ANIXTER INTERNATIONAL INC.NOTES TO THE UNAUDITED CONDENSED CONSOLIDATED FINANCIAL STATEMENTS – (Continued)
Investments in several subsidiaries are recorded in currencies other than the U.S. dollar ("USD"). As these foreign currency denominated investments aretranslated at the end of each period during consolidation using period-end exchange rates, fluctuations of exchange rates between the foreign currency and the USDincrease or decrease the value of those investments. These fluctuations and the results of operations for foreign subsidiaries, where the functional currency is notthe USD, are translated into USD using the average exchange rates during the periods reported, while the assets and liabilities are translated using period-endexchange rates. The assets and liabilities-related translation adjustments are recorded as a separate component of AOCI, "Foreign currency translation." In addition,as Anixter's subsidiaries maintain investments denominated in currencies other than local currencies, exchange rate fluctuations will occur. Borrowings are raisedin certain foreign currencies to minimize the exchange rate translation adjustment risk.
Goodwill: The Company evaluates goodwill for impairment annually at the beginning of the third quarter and when events or changes in circumstancesindicate the carrying value of reporting units might exceed their current fair values. The Company assesses goodwill for impairment by first performing aqualitative assessment, which considers specific factors, based on the weight of evidence, and the significance of all identified events and circumstances in thecontext of determining whether it is more likely than not that the fair value of a reporting unit is less than its carrying amount. If it is determined that it is morelikely than not that the fair value of a reporting unit is less than its carrying amount using the qualitative assessment, Anixter performs the two-step impairmenttest. From time to time, the Company may also bypass the qualitative assessment and proceed directly to the two-step impairment test. The first step of theimpairment test is to identify a potential impairment by comparing the fair value of a reporting unit with its carrying amount. The estimates of fair value of areporting unit are determined using the income approach and/or the market approach as described below. If step one of the test indicates a carrying value above theestimated fair value, the second step of the goodwill impairment test is performed by comparing the implied fair value of the reporting unit’s goodwill with thecarrying amount of that goodwill. The implied residual value of goodwill is determined in the same manner as the amount of goodwill recognized in a businesscombination.
The income approach is a quantitative evaluation to determine the fair value of the reporting unit. Under the income approach fair value is determined basedon estimated future cash flows discounted by an estimated weighted-average cost of capital plus a forecast risk, which reflects the overall level of inherent risk ofthe reporting unit and the rate of return a market participant would expect to earn. The inputs used for the income approach were significant unobservable inputs, orLevel 3 inputs, as described in the accounting fair value hierarchy. Estimated future cash flows were based on internal projection models, industry projections andother assumptions deemed reasonable by management.
The market approach measures the fair value of a reporting unit through the analysis of recent sales, offerings, and financial multiples (sales or earningsbefore interest, tax, depreciation and amortization ("EBITDA")) of comparable businesses. Consideration is given to the financial conditions and operatingperformance of the reporting unit being valued relative to those publicly-traded companies operating in the same or similar lines of business.
In connection with the annual assessment of goodwill at the beginning of the third quarter of 2018, the Company bypassed the qualitative assessment andperformed a quantitative test for all reporting units and utilized a combination of the income and market approaches. As a result of this assessment, the Companyconcluded that no impairment existed and the carrying amount of goodwill to be fully recoverable. All of the Company's reporting units had fair values thatexceeded their respective carrying values by greater than 30% .
8

ANIXTER INTERNATIONAL INC.NOTES TO THE UNAUDITED CONDENSED CONSOLIDATED FINANCIAL STATEMENTS – (Continued)
NOTE 2. RESTRUCTURING CHARGES
The Company considers restructuring activities to be programs whereby Anixter fundamentally changes its operations, such as closing and consolidatingfacilities, reducing headcount and realigning operations in response to changing market conditions. The following table summarizes activity related to liabilitiesassociated with restructuring activities:
Restructuring Activity
Q2 2018 Plan Q2 2016
Plan Q4 2015Plan Total
Employee-RelatedCosts (a) Facility Exit and
Other Costs (b) Employee-RelatedCosts (a) Facility Exit and
Other Costs (b) Employee-RelatedCosts (a) Employee-Related
Costs (a) Facility Exit andOther Costs (b)
Balance at December 29, 2017 $ — $ — $ 0.5 $ 0.5 $ 0.6 $ 1.1 $ 0.5Charges 9.6 0.5 — (0.4) (0.3) 9.3 0.1Payments and other (1.0) (0.3) (0.5) (0.1) (0.1) (1.6) (0.4)Balance at September 28, 2018 $ 8.6 $ 0.2 $ — $ — $ 0.2 $ 8.8 $ 0.2(a) Employee-related costs primarily consist of severance benefits provided to employees who have been involuntarily terminated.(b) Facility exit and other costs primarily consist of lease termination costs.
Q2 2018 Restructuring Plan
In the second quarter of 2018, the Company recorded a pre-tax charge of $2.1 million , $1.3 million and $1.1 million in its NSS, EES and UPS segments,respectively, and an additional $5.4 million at its corporate headquarters, primarily for severance-related expenses associated with a reduction of approximately260 positions. In the third quarter of 2018, the Company recorded an additional $0.2 million charge at its corporate headquarters. The $10.1 million charge relatedto the Q2 2018 plan primarily reflects actions related to facilities consolidation, systems integration and back office functions. This charge was included in"Operating expenses" in the Company's Condensed Consolidated Statements of Comprehensive Income for fiscal year 2018. The majority of the remaining chargeincluded in accrued expenses of $8.8 million as of September 28, 2018 is expected to be paid by the fourth quarter of 2019.
NOTE 3. DEBT
Debt is summarized below:
(In millions) September 28,
2018 December 29,
2017Current portion of long-term debt:
5.625% Senior notes due 2019 $ 349.3 $ — Long-term debt:
5.50% Senior notes due 2023 347.2 346.85.125% Senior notes due 2021 397.2 396.55.625% Senior notes due 2019 — 348.6Revolving lines of credit 168.6 159.0Other 4.9 1.7Unamortized deferred financing costs (3.5) (4.7)
Total debt $ 1,263.7 $ 1,247.9
The Senior notes due 2019 will mature on May 1, 2019, and have been classified as current on the Condensed Consolidated Balance Sheet at September 28,2018.
9

ANIXTER INTERNATIONAL INC.NOTES TO THE UNAUDITED CONDENSED CONSOLIDATED FINANCIAL STATEMENTS – (Continued)
Fair Value of Debt
The fair value of Anixter's debt instruments is measured using observable market information which would be considered Level 2 in the fair value hierarchydescribed in accounting guidance on fair value measurements. The Company's fixed-rate debt consists of Senior notes due 2023, Senior notes due 2021 and Seniornotes due 2019.
At September 28, 2018 , the Company's total carrying value and estimated fair value of debt outstanding was $1,263.7 million and $1,299.9 million ,respectively. This compares to a carrying value and estimated fair value of debt outstanding at December 29, 2017 of $1,247.9 million and $1,317.8 million ,respectively. The increase in the carrying value is primarily due to higher outstanding borrowings under Anixter's revolving lines of credit.
NOTE 4. LEGAL CONTINGENCIES
From time to time, Anixter is party to legal proceedings and matters that arise in the ordinary course of business. As of September 28, 2018 , the Companydoes not believe there is a reasonable possibility that any material loss exceeding the amounts already recognized for these proceedings and matters has beenincurred. However, the ultimate resolutions of these proceedings and matters are inherently unpredictable. As such, the Company's financial condition and resultsof operations could be adversely affected in any particular period by the unfavorable resolution of one or more of these proceedings or matters.
NOTE 5. INCOME TAXES
The Company's effective tax rate for the third quarter of 2018 was 30.6% compared to 39.7% in the prior year period. The Company's effective tax rate forthe nine months ended September 28, 2018 was 29.9% compared to 38.3% in the prior year period. Income tax expense for the nine months ended September 28,2018 included a $1.8 million tax benefit related to the reversal of deferred income tax valuation allowances, partially offset by $0.5 million of tax expense relatedto domestic permanent tax differences. The decrease in the effective tax rate was primarily due to a favorable tax impact from the December 22, 2017 Tax Cuts andJobs Act (the "Act"). Under the Act, the statutory U.S. federal tax rate was reduced from 35% to 21% effective January 1, 2018. The benefit from this ratereduction was partially offset by other newly enacted tax provisions.
In the fourth quarter of 2017, the Company recorded a provisional $50.0 million one-time transition tax. At September 28, 2018, the Company has notcompleted its accounting for the tax effects of the Act and has not made adjustments to the provisional amount recorded.
The Act subjects U.S. shareholders to tax on Global Intangible Low-Taxed Income (“GILTI”) earned by certain foreign subsidiaries. The Company iselecting to recognize the tax on GILTI as a period expense in the period the tax is incurred. Under this policy, the Company has not provided deferred taxes relatedto temporary differences that upon their reversal will affect the amount of income subject to GILTI in the period.
Anixter considers the undistributed earnings of its foreign subsidiaries to be indefinitely reinvested. Upon distribution of those earnings in the form ofdividends or otherwise, Anixter may be subject to withholding taxes payable to the various foreign countries.
NOTE 6. PENSION PLANS
The Company's defined benefit pension plans are the plans in the U.S., which consist of the Anixter Inc. Pension Plan, the Executive Benefit Plan and theSupplemental Executive Retirement Plan ("SERP") (together the "Domestic Plans") and various defined benefit pension plans covering employees of foreignsubsidiaries in Canada and Europe (together the "Foreign Plans"). The majority of these defined benefit pension plans are non-contributory and, with the exceptionof the U.S., cover substantially all full-time domestic employees and certain employees in other countries. Retirement benefits are provided based on compensationas defined in both the Domestic Plans and the Foreign Plans. The Company's policy is to fund all Domestic Plans as required by the Employee Retirement IncomeSecurity Act of 1974 ("ERISA") and the IRS and all Foreign Plans as required by applicable foreign laws. The Executive Benefit Plan and SERP are the only twoplans that are unfunded. Assets in the various plans consist primarily of equity securities.
10

ANIXTER INTERNATIONAL INC.NOTES TO THE UNAUDITED CONDENSED CONSOLIDATED FINANCIAL STATEMENTS – (Continued)
Components of net periodic pension (benefit) cost are as follows:
Three Months Ended
Domestic Plans Foreign Plans Total
(In millions) September 28, 2018 September 29, 2017 September 28, 2018 September 29, 2017 September 28, 2018 September 29, 2017Recorded in operating expenses:
Service cost $ 0.8 $ 1.4 $ 1.5 $ 1.6 $ 2.3 $ 3.0
Recorded in other, net: Interest cost $ 2.6 $ 3.2 $ 1.6 $ 1.7 $ 4.2 $ 4.9Expected return on plan assets (4.0) (4.2) (2.4) (2.3) (6.4) (6.5)Net amortization (a) 0.2 0.5 0.7 0.9 0.9 1.4Total recorded in other, net $ (1.2) $ (0.5) $ (0.1) $ 0.3 $ (1.3) $ (0.2)
Total net periodic pension (benefit)cost $ (0.4) $ 0.9 $ 1.4 $ 1.9 $ 1.0 $ 2.8(a) Reclassified from AOCI.
Nine Months Ended
Domestic Plans Foreign Plans Total
(In millions) September 28, 2018 September 29, 2017 September 28, 2018 September 29, 2017 September 28, 2018 September 29, 2017Recorded in operating expenses:
Service cost $ 2.6 $ 3.8 $ 4.5 $ 4.5 $ 7.1 $ 8.3
Recorded in other, net: Interest cost $ 7.7 $ 8.7 $ 5.1 $ 5.1 $ 12.8 $ 13.8Expected return on plan assets (12.0) (11.7) (7.4) (6.6) (19.4) (18.3)Net amortization (a) 0.5 1.7 2.2 2.4 2.7 4.1Total recorded in other, net $ (3.8) $ (1.3) $ (0.1) $ 0.9 $ (3.9) $ (0.4)
Total net periodic pension (benefit)cost $ (1.2) $ 2.5 $ 4.4 $ 5.4 $ 3.2 $ 7.9(a) Reclassified from AOCI.
11

ANIXTER INTERNATIONAL INC.NOTES TO THE UNAUDITED CONDENSED CONSOLIDATED FINANCIAL STATEMENTS – (Continued)
NOTE 7. STOCKHOLDERS' EQUITY
At the end of the third quarter of 2018, there were 1.7 million shares reserved for issuance under the 2017 Stock Incentive Plan. Under such plan, theCompany pays non-employee directors annual retainer fees and, at their election, meeting fees in the form of stock units. Employee and director stock units areincluded in common stock outstanding on the date of vesting, and stock options are included in common stock outstanding upon exercise by the participant. Thefair value of employee stock units is amortized over the respective vesting period representing the requisite service period, generally three , four or six years.Director stock units are expensed in the period in which they are granted, as these vest immediately. The employee performance-based restricted stock units("performance units") are issued on the third anniversary of the grant date based on the Company's total shareholder return ("TSR") relative to the TSR of the S&PMid Cap 400 index. The fair value of each performance unit tranche is estimated using the Monte Carlo Simulation pricing model at the date of grant.
During the three and nine months ended September 28, 2018 , the Company granted 11,375 and 194,113 stock units to employees, respectively, with aweighted-average grant-date fair value of $0.7 million and $14.4 million , respectively. During the three and nine months ended September 28, 2018 , the Companygranted 7,899 and 43,767 performance units to employees, respectively, with a weighted-average grant-date fair value of $0.4 million and $3.4 million ,respectively. During the nine months ended September 28, 2018 , the Company included additional stock compensation expense of $2.6 million related to aretirement agreement with the recently retired Chief Executive Officer ("CEO"), which extended the terms of his non-competition and non-solicitation restrictionsin exchange for extended vesting and termination provisions of previously granted equity awards.
During the three and nine months ended September 28, 2018 , the Company granted directors 9,733 and 25,771 stock units, respectively, with a weighted-average grant-date fair value of $0.6 million and $1.8 million , respectively.
Antidilutive stock options and units are excluded from the calculation of weighted-average shares for diluted earnings per share. For the third quarter of 2018and 2017, the antidilutive stock options and units were immaterial.
NOTE 8. BUSINESS SEGMENTS
Anixter is a leading distributor of enterprise cabling and security solutions, electrical and electronic wire and cable solutions and utility power solutions. TheCompany has identified Network & Security Solutions ("NSS"), Electrical & Electronic Solutions ("EES") and Utility Power Solutions ("UPS") as reportablesegments.
Corporate expenses are incurred to obtain and coordinate financing, tax, information technology, legal and other related services, certain of which wererebilled to subsidiaries. The Company also has various corporate assets which are reported in corporate. Segment assets may or may not include jointly used assets,but segment results include depreciation expense or other allocations related to those assets as such allocation is made for internal reporting. Interest expense andother non-operating items are not allocated to the segments or reviewed on a segment basis.
The categorization of net sales by end market is determined using a variety of data points including the technical characteristic of the product, the "sold to"customer information, the "ship to" customer information and the end customer product or application into which product will be incorporated. Anixter also haslargely specialized its sales organization by segment. As data systems for capturing and tracking this data evolve and improve, the categorization of products byend market can vary over time. When this occurs, the Company reclassifies net sales by end market for prior periods. Such reclassifications typically do notmaterially change the sizing of, or the underlying trends of results within, each end market.
12

ANIXTER INTERNATIONAL INC.NOTES TO THE UNAUDITED CONDENSED CONSOLIDATED FINANCIAL STATEMENTS – (Continued)
Segment Financial Information
Segment information for the three and nine months ended September 28, 2018 and September 29, 2017 are as follows:
(In millions) Third Quarter of 2018 NSS EES UPS Corporate TotalNet Sales $ 1,138.0 $ 597.4 $ 443.6 $ — $ 2,179.0Operating income 75.0 34.1 19.9 (39.5) 89.5
Third Quarter of 2017 NSS EES UPS Corporate TotalNet Sales $ 1,049.2 $ 555.0 $ 412.2 $ — $ 2,016.4Operating income 67.5 26.8 19.8 (33.3) 80.8
Nine Months of 2018 NSS EES UPS Corporate TotalNet Sales $ 3,229.1 $ 1,771.4 $ 1,280.6 $ — $ 6,281.1Operating income 194.6 101.1 54.2 (127.5) 222.4
Nine Months of 2017 NSS EES UPS Corporate TotalNet Sales $ 3,063.5 $ 1,643.9 $ 1,206.2 $ — $ 5,913.6Operating income 194.2 84.3 57.3 (103.5) 232.3
Geographic Information
The following tables summarize net sales by geographic areas for the three and nine months ended September 28, 2018 and September 29, 2017 :
Three Months Ended Nine Months Ended
(In millions) September 28, 2018 September 29, 2017 September 28, 2018 September 29, 2017
Net sales North America $ 1,774.0 $ 1,664.5 $ 5,148.9 $ 4,901.4EMEA 160.6 156.0 502.2 461.7Emerging Markets 244.4 195.9 630.0 550.5
Total net sales $ 2,179.0 $ 2,016.4 $ 6,281.1 $ 5,913.6
Goodwill Assigned to SegmentsThe following table presents the changes in goodwill allocated to the Company's reporting units during the nine months ended September 28, 2018 :
(In millions) NSS EES UPS TotalBalance as of December 29, 2017 $ 408.8 $ 181.7 $ 187.6 $ 778.1Acquisition related (a) 65.4 — — 65.4Foreign currency translation (5.4) (0.4) (4.3) (10.1)Balance as of September 28, 2018 $ 468.8 $ 181.3 $ 183.3 $ 833.4
(a) In the second quarter of 2018, the Company completed the acquisition of security businesses in Australia and New Zealand for $149.9 million , including apreliminary net working capital adjustment of $4.6 million . The transaction was financed primarily from borrowings under the revolving lines of credit. Thepurchase price was preliminarily allocated to $36.5 million of working capital and $60.4 million of intangible assets. Acquisition costs were $2.5 million . Thirdquarter year-to-date results include approximately $40.3 million of sales from the acquired entities. The purchase price allocation is pending finalization, and isexpected to be completed in early 2019.
13

ANIXTER INTERNATIONAL INC.NOTES TO THE UNAUDITED CONDENSED CONSOLIDATED FINANCIAL STATEMENTS – (Continued)
NOTE 9. SUMMARIZED FINANCIAL INFORMATION OF ANIXTER INC.
Anixter International Inc. guarantees, fully and unconditionally, substantially all of the debt of its subsidiaries, which include Anixter Inc., its 100% ownedprimary operating subsidiary. Anixter International Inc. has no independent assets or operations and all subsidiaries other than Anixter Inc. are minor. Thefollowing summarizes the financial information for Anixter Inc.:
ANIXTER INC.CONDENSED CONSOLIDATED BALANCE SHEETS
(In millions) September 28,
2018 December 29,
2017Assets:
Current assets $ 3,115.7 $ 2,833.5Property, equipment and capital leases, net 168.2 161.3Goodwill 833.4 778.1Intangible assets, net 405.0 378.8Other assets 108.5 107.2
$ 4,630.8 $ 4,258.9Liabilities and Stockholders' Equity:
Current liabilities $ 1,952.9 $ 1,351.9Long-term debt 923.4 1,257.7Other liabilities 193.5 192.9Stockholder’s equity 1,561.0 1,456.4
$ 4,630.8 $ 4,258.9
ANIXTER INC.CONDENSED CONSOLIDATED STATEMENTS OF INCOME AND COMPREHENSIVE INCOME
Three Months Ended Nine Months Ended
(In millions) September 28,
2018 September 29,
2017 September 28,
2018 September 29,
2017Net sales $ 2,179.0 $ 2,016.4 $ 6,281.1 $ 5,913.6Operating income $ 91.1 $ 82.4 $ 227.5 $ 237.4Income before income taxes $ 70.1 $ 63.9 $ 167.8 $ 180.6Net income $ 49.1 $ 38.5 $ 119.0 $ 111.4Comprehensive income $ 56.3 $ 57.2 $ 98.1 $ 154.9
14

ANIXTER INTERNATIONAL INC.
ITEM 2. MANAGEMENT’S DISCUSSION AND ANALYSIS OF FINANCIAL CONDITION AND RESULTS OF OPERATIONS.
The following is a discussion of our financial condition and results of operations for the three and nine months ended September 28, 2018 as compared to thecorresponding period in the prior year. This discussion should be read in conjunction with the Condensed Consolidated Financial Statements, including the relatednotes, set forth in this report under "Condensed Consolidated Financial Statements" and our Annual Report on Form 10-K for the year ended December 29, 2017.
Third Quarter and Year-to-Date 2018 and 2017 Consolidated Results of Operations
(In millions, except per share amounts) Three Months Ended Nine Months Ended
September 28,
2018 September 29,
2017 September 28,
2018 September 29,
2017Net sales $ 2,179.0 $ 2,016.4 $ 6,281.1 $ 5,913.6Gross profit 424.1 397.2 1,228.0 1,172.6
Operating expenses 334.6 316.4 1,005.6 940.3Operating income 89.5 80.8 222.4 232.3Other expense:
Interest expense (19.3) (18.9) (56.5) (55.7)Other, net (1.6) 0.5 (2.6) (0.5)
Income before income taxes 68.6 62.4 163.3 176.1Income tax expense 21.0 24.8 48.8 67.5Net income 47.6 37.6 114.5 108.6Diluted income per share $ 1.40 $ 1.11 $ 3.36 $ 3.20
Executive Overview
Third Quarter Highlights
We delivered third quarter sales of $2.2 billion , up 8.1% compared to the prior year, with growth in all segments and geographies. Network and SecuritySolutions ("NSS"), Electrical and Electronic Solutions ("EES") and Utility Power Solutions ("UPS") sales increased 8.5% , 7.6% , and 7.6% , respectively.Reflecting broad strength across the business, we delivered overall organic sales growth of 7.4% , reflecting organic growth in our NSS, EES and UPS segments of6.4% , 9.0% and 8.1% , respectively.
Strategy Update and Business Outlook
As we look ahead to the fourth quarter, we are optimistic that solid sales growth will continue, reflecting momentum across the business and a solid demandenvironment. Despite challenging macro economic factors including tariffs, wage increases and broader inflationary pressures, our top priority remains improvingprofitability through gross margin initiatives combined with our focus on cost structure.
During the second quarter of 2018, we completed the acquisition of security businesses in Australia and New Zealand. We expect these acquisitions to beaccretive to earnings in the first full year of operation, exclusive of transaction and integration costs.
15

ANIXTER INTERNATIONAL INC.
Items Impacting Comparability of Results
In addition to the results provided in accordance with U.S. Generally Accepted Accounting Principles ("U.S. GAAP") above, this report includes certain non-GAAP financial measures as defined by the Securities and Exchange Commission. Specifically, net sales comparisons to the prior corresponding period, bothworldwide and in relevant segments, are discussed in this report both on a U.S. GAAP and non-GAAP basis. We believe that by providing non-GAAP organicgrowth, which adjusts for the impact of acquisitions (when applicable), foreign exchange fluctuations, copper prices and the number of billing days, bothmanagement and investors are provided with meaningful supplemental sales information to understand and analyze our underlying trends and other aspects of ourfinancial performance. Historically, and from time to time, we may also exclude other items from reported financial results (e.g., impairment charges, inventoryadjustments, restructuring charges, tax items, currency devaluations, pension settlements, etc.) in presenting adjusted operating expense, adjusted operatingincome, adjusted income taxes and adjusted net income so that both management and financial statement users can use these non-GAAP financial measures tobetter understand and evaluate our performance period over period, and to analyze the underlying trends of our business. We have also excluded amortization ofintangible assets associated with purchase accounting from acquisitions from the adjusted amounts for comparison of the non-GAAP financial measures periodover period.
EBITDA is defined as net income from continuing operations before interest, income taxes, depreciation and amortization. Adjusted EBITDA is defined asEBITDA before foreign exchange and other non-operating expense and non-cash stock-based compensation, excluding the other items from reported financialresults, as defined above. We believe that adjusted operating income, EBITDA and Adjusted EBITDA provide relevant and useful information, which is widelyused by analysts, investors and competitors in our industry as well as by our management in assessing both consolidated and business segment performance.Adjusted operating income provides an understanding of the results from the primary operations of our business by excluding the effects of certain items that donot reflect the ordinary earnings of our operations. We use adjusted operating income to evaluate our period over period operating performance because we believethis provides a more comparable measure of our continuing business excluding certain items that are not reflective of expected ongoing operations. This measuremay be useful to an investor in evaluating the underlying performance of our business. EBITDA provides us with an understanding of earnings before the impactof investing and financing charges and income taxes. Adjusted EBITDA further excludes the effects of foreign exchange and other non-cash stock-basedcompensation, and certain items that do not reflect the ordinary earnings of our operations and that are also excluded for purposes of calculating adjusted netincome, adjusted earnings per share and adjusted operating income. EBITDA and Adjusted EBITDA are used by our management for various purposes includingas measures of performance of our operating entities and as a basis for strategic planning and forecasting. Adjusted EBITDA may be useful to an investor becausethis measure is widely used to evaluate a company’s operating performance without regard to items excluded from the calculation of such measure, which can varysubstantially from company to company depending on the accounting methods, book value of assets, capital structure and the method by which the assets wereacquired, among other factors. They are not, however, intended as an alternative measure of operating results or cash flow from operations as determined inaccordance with U.S. GAAP.
Non-GAAP financial measures provide insight into selected financial information and should be evaluated in the context in which they are presented. Thesenon-GAAP financial measures have limitations as analytical tools, and should not be considered in isolation from, or as a substitute for, financial informationpresented in compliance with U.S. GAAP, and non-GAAP financial measures as reported by us may not be comparable to similarly titled amounts reported byother companies. The non-GAAP financial measures should be considered in conjunction with the Condensed Consolidated Financial Statements, including therelated notes, and Management’s Discussion and Analysis of Financial Condition and Results of Operations included in this report. Management does not use thesenon-GAAP financial measures for any purpose other than the reasons stated above.
Our operating results can be affected by changes in prices of commodities, primarily copper, which are components in some of the electrical wire and cableproducts sold. Generally, as the costs of inventory purchases increase due to higher commodity prices, our mark-up percentage to customers remains relativelyconstant, resulting in higher sales revenue and gross profit. In addition, existing inventory purchased at previously lower prices and sold as prices increase mayresult in a higher gross profit margin. Conversely, a decrease in commodity prices in a short period of time would have the opposite effect, negatively affectingfinancial results. The degree to which spot market copper prices change affects product prices and the amount of gross profit earned will be affected by end marketdemand and overall economic conditions. Importantly, however, there is no exact measure of the impact of changes in copper prices, as there are thousands oftransactions in any given year, each of which has various factors involved in the individual pricing decisions. Therefore, all references to the effect of copper pricesare estimates.
16

ANIXTER INTERNATIONAL INC.
The following summarizes the various items that favorably/(unfavorably) impact the comparability of the results for the three and nine months endedSeptember 28, 2018 and September 29, 2017 .
Items Impacting Comparability of Results:
(In millions, except per share amounts) Three Months Ended Nine Months Ended
September 28,
2018 September 29,
2017 September 28,
2018 September 29,
2017Items impacting operating expense and operating income: Favorable / (Unfavorable)
Amortization of intangible assets $ (9.6) $ (9.1) $ (28.6) $ (27.1)Restructuring charge (0.2) — (9.4) —Acquisition and integration costs (0.3) (0.8) (2.9) (0.8)CEO retirement agreement expense — — (2.6) —U.K. facility relocation costs (0.2) — (0.8) —Total of items impacting operating expense and operating income $ (10.3) $ (9.9) $ (44.3) $ (27.9)
Items impacting income taxes: Tax impact of items impacting pre-tax income above 3.1 3.3 11.1 9.1Reversal of deferred income tax valuation allowances — — 1.8 —Tax expense related to domestic permanent tax differences — — (0.5) —Total of items impacting income taxes $ 3.1 $ 3.3 $ 12.4 $ 9.1
Net income impact of these items $ (7.2) $ (6.6) $ (31.9) $ (18.8)Diluted EPS impact of these items $ (0.21) $ (0.19) $ (0.94) $ (0.55)
The items impacting operating expense and operating income by segment are reflected in the tables below.
Items Impacting Comparability of Operating Expense and Operating Income by Segment: Three Months Ended September 28, 2018
(In millions) NSS EES UPS Corporate TotalAmortization of intangible assets $ (5.0) $ (1.4) $ (3.2) $ — $ (9.6)Restructuring charge — — — (0.2) (0.2)Acquisition and integration costs (0.2) — — (0.1) (0.3)U.K. facility relocation costs (0.1) (0.1) — — (0.2)Total of items impacting operating expense and operating income $ (5.3) $ (1.5) $ (3.2) $ (0.3) $ (10.3)
Three Months Ended September 29, 2017
(In millions) NSS EES UPS Corporate TotalAmortization of intangible assets $ (3.6) $ (2.2) $ (3.3) $ — $ (9.1)Acquisition and integration costs — — — (0.8) (0.8)Total of items impacting operating expense and operating income $ (3.6) $ (2.2) $ (3.3) $ (0.8) $ (9.9)
17

ANIXTER INTERNATIONAL INC.
Nine Months Ended September 28, 2018
(In millions) NSS EES UPS Corporate TotalAmortization of intangible assets $ (13.0) $ (5.7) $ (9.9) $ — $ (28.6)Restructuring charge (2.1) (1.3) (0.7) (5.3) (9.4)Acquisition and integration costs (2.5) — — (0.4) (2.9)CEO retirement agreement expense — — — (2.6) (2.6)U.K. facility relocation costs (0.2) (0.6) — — (0.8)Total of items impacting operating expense and operating income $ (17.8) $ (7.6) $ (10.6) $ (8.3) $ (44.3)
Nine Months Ended September 29, 2017
(In millions) NSS EES UPS Corporate TotalAmortization of intangible assets $ (10.8) $ (6.4) $ (9.9) $ — $ (27.1)Restructuring charge — 0.5 (0.1) (0.4) —Acquisition and integration costs — — — (0.8) (0.8)Total of items impacting operating expense and operating income $ (10.8) $ (5.9) $ (10.0) $ (1.2) $ (27.9)
U.S. GAAP to Non-GAAP Net Income and EPS Reconciliation:
(In millions, except per share amounts) Three Months Ended Nine Months Ended
September 28,
2018 September 29,
2017 September 28,
2018 September 29,
2017Reconciliation to most directly comparable U.S. GAAP financial measure: Net income - U.S. GAAP $ 47.6 $ 37.6 $ 114.5 $ 108.6Items impacting net income 7.2 6.6 31.9 18.8Net income - Non-GAAP $ 54.8 $ 44.2 $ 146.4 $ 127.4
Diluted EPS – U.S. GAAP $ 1.40 $ 1.11 $ 3.36 $ 3.20Diluted EPS impact of these items 0.21 0.19 0.94 0.55Diluted EPS – Non-GAAP $ 1.61 $ 1.30 $ 4.30 $ 3.75
18

ANIXTER INTERNATIONAL INC.
Net Sales
Sales Growth Trends
Three Months Ended September 28, 2018 Three Months Ended September 29, 2017
($ millions) As Reported
ForeignExchange
Impact Copper Impact As Adjusted As Reported Acquisitions
Impact Adjusted forAcquisitions
OrganicGrowth /(Decline)
Network & Security Solutions (NSS) North America $ 854.0 $ 3.7 $ — $ 857.7 $ 818.5 $ — $ 818.5 4.8 %
EMEA 100.6 1.0 — 101.6 88.9 1.0 89.9 13.2 %
Emerging Markets 183.4 6.4 — 189.8 141.8 29.9 171.7 10.5 %
NSS $ 1,138.0 $ 11.1 $ — $ 1,149.1 $ 1,049.2 $ 30.9 $ 1,080.1 6.4 %
Electrical & Electronic Solutions (EES) North America $ 476.4 $ 3.4 $ 2.6 $ 482.4 $ 433.8 $ — $ 433.8 11.2 %
EMEA 60.0 0.3 — 60.3 67.1 — 67.1 (10.2)%
Emerging Markets 61.0 1.0 0.3 62.3 54.1 — 54.1 15.3 %
EES $ 597.4 $ 4.7 $ 2.9 $ 605.0 $ 555.0 $ — $ 555.0 9.0 %
Utility Power Solutions (UPS) North America $ 443.6 $ 1.7 $ 0.1 $ 445.4 $ 412.2 $ — $ 412.2 8.1 %
UPS $ 443.6 $ 1.7 $ 0.1 $ 445.4 $ 412.2 $ — $ 412.2 8.1 %
Total $ 2,179.0 $ 17.5 $ 3.0 $ 2,199.5 $ 2,016.4 $ 30.9 $ 2,047.3 7.4 %
Geographic Sales North America $ 1,774.0 $ 8.8 $ 2.7 $ 1,785.5 $ 1,664.5 $ — $ 1,664.5 7.3 %
EMEA 160.6 1.3 — 161.9 156.0 1.0 157.0 3.2 %
Emerging Markets 244.4 7.4 0.3 252.1 195.9 29.9 225.8 11.6 %
Total $ 2,179.0 $ 17.5 $ 3.0 $ 2,199.5 $ 2,016.4 $ 30.9 $ 2,047.3 7.4 %
NSS – Sales of $1,138.0 million increased 8.5% from $1,049.2 million in the prior year period. Adjusting for the unfavorable impact from foreign exchangeand favorable impact from acquisitions, NSS organic sales increased 6.4% , reflecting growth in both the network infrastructure and security portions of thebusiness and in all geographies. NSS sec urity sales in the third quarter of 2018 of $489.8 million, which represents 43.0% of total segment sales, increased 12.3%from the prior year period. Adjusted for the $29.5 million favorable impact from acquisitions and $6.4 million unfavorable currency impact, organic security salesgrowth was 6.6% compared to the third quarter of 2017.
EES – Sales of $597.4 million increased 7.6% from $555.0 million in the prior year period, with growth driven by ongoing strength in industrial businessand strong growth with OEM customers. Adjusting for the unfavorable impacts from foreign exchange and copper, EES organic sales increased by 9.0% .
UPS – Sales of $443.6 million increased 7.6% from $412.2 million in the prior year period, reflecting broad-based growth with both investor-owned utilityand public power customers. UPS organic sales increased 8.1% , adjusting for the unfavorable impacts from foreign exchange and copper.
19

ANIXTER INTERNATIONAL INC.
Sales Growth Trends
Nine Months Ended September 28, 2018 Nine Months Ended September 29, 2017
($ millions) As Reported
ForeignExchange
Impact CopperImpact As Adjusted As Reported
AcquisitionsImpact
Adjusted forAcquisitions
OrganicGrowth /(Decline)
Network & Security Solutions (NSS) North America $ 2,475.4 $ (3.1) $ — $ 2,472.3 $ 2,403.6 $ — $ 2,403.6 2.9 %
EMEA 303.8 (11.5) — 292.3 268.3 1.2 269.5 8.5 %
Emerging Markets 449.9 4.1 — 454.0 391.6 41.2 432.8 4.9 %
NSS $ 3,229.1 $ (10.5) $ — $ 3,218.6 $ 3,063.5 $ 42.4 $ 3,105.9 3.6 %
Electrical & Electronic Solutions (EES) North America $ 1,392.9 $ (2.4) $ (15.4) $ 1,375.1 $ 1,291.6 $ — $ 1,291.6 6.5 %
EMEA 198.4 (10.2) (1.9) 186.3 193.4 — 193.4 (3.7)%
Emerging Markets 180.1 0.1 (1.4) 178.8 158.9 — 158.9 12.5 %
EES $ 1,771.4 $ (12.5) $ (18.7) $ 1,740.2 $ 1,643.9 $ — $ 1,643.9 5.9 %
Utility Power Solutions (UPS) North America $ 1,280.6 $ (1.5) $ (0.5) $ 1,278.6 $ 1,206.2 $ — $ 1,206.2 6.0 %
UPS $ 1,280.6 $ (1.5) $ (0.5) $ 1,278.6 $ 1,206.2 $ — $ 1,206.2 6.0 %
Total $ 6,281.1 $ (24.5) $ (19.2) $ 6,237.4 $ 5,913.6 $ 42.4 $ 5,956.0 4.7 %
Geographic Sales North America $ 5,148.9 $ (7.0) $ (15.9) $ 5,126.0 $ 4,901.4 $ — $ 4,901.4 4.6 %
EMEA 502.2 (21.7) (1.9) 478.6 461.7 1.2 462.9 3.4 %
Emerging Markets 630.0 4.2 (1.4) 632.8 550.5 41.2 591.7 6.9 %
Total $ 6,281.1 $ (24.5) $ (19.2) $ 6,237.4 $ 5,913.6 $ 42.4 $ 5,956.0 4.7 %
NSS – Sales of $3,229.1 million increased 5.4% from $3,063.5 million in the prior year period. Adjusting for the favorable impact from acquisitions andforeign exchange, NSS organic sales increased 3.6% , reflecting growth in both the network infrastructure and security portions of the business and in allgeographies . NSS sec urity sales in the nine months ended September 28, 2018 of $1,367.5 million, which represents 42.3% of total segment sales, increased 9.0%from the prior year period. Adjusted for the $41.0 million favorable impact from acquisitions and $0.4 million unfavorable currency impact, organic security salesgrowth was 5.6% compared to the nine months ended September 29, 2017 .
EES – Sales of $1,771.4 million increased 7.8% from $1,643.9 million in the prior year period, strengthened by the favorable impacts from copper andforeign exchange. EES organic sales increased by 5.9% , with growth driven by ongoing strength in industrial business and strong growth with OEM customers.
UPS – Sales of $1,280.6 million increased 6.2% from $1,206.2 million in the prior year period, reflecting broad-based growth with both investor-ownedutility and public power customers. UPS organic sales increased 6.0% , adjusting for the favorable impacts from foreign exchange and copper.
Gross Margin
Gross margin of 19.5% in the third quarter of 2018 compares to 19.7% in the third quarter of 2017 . Gross margin of 19.6% in the nine months endedSeptember 28, 2018 compares to 19.8% in the nine months ended September 29, 2017 . The lower gross margin was caused by competitive pressure, customer andproduct mix and cost inflation.
20

ANIXTER INTERNATIONAL INC.
Operating Expenses
Operating expenses were $334.6 million and $316.4 million in the third quarter of 2018 and 2017 , respectively. The third quarter of 2018 includes $9.6million of intangible asset amortization, a restructuring charge of $0.2 million , $0.3 million of acquisition and integration costs and $0.2 million of U.K. facilityrelocation costs. The U.K. facility relocation costs relate to expenses we incurred to move our largest warehouse in EMEA. We were forced to move this locationdue to a government-backed rail line that will run through our existing facility. The third quarter of 2017 includes $9.1 million of intangible asset amortization and$0.8 million of acquisition and integration costs. Excluding these items from their related periods, adjusted operating expenses in the third quarter of 2018increased 5.8% to $324.3 million , or 14.9% of sales, which compares to prior year adjusted operating expenses of $306.5 million , or 15.2% of sales. Furtheradjusting operating expenses for a favorable $2.8 million impact of foreign currency in the third quarter of 2018, adjusted operating expenses would have increasedby 6.7% .
Operating expenses were $1,005.6 million and $940.3 million in the nine months ended September 28, 2018 and September 29, 2017 , respectively. The ninemonths ended September 28, 2018 includes $28.6 million of intangible asset amortization, a restructuring charge of $9.4 million , $2.9 million of acquisition andintegration costs, $2.6 million of CEO retirement agreement expense and $0.8 million of U.K. facility relocation costs. The CEO retirement agreement expenserelates to additional stock compensation for a retirement agreement with the recently retired CEO, which extended the terms of his non-competition and non-solicitation restrictions in exchange for extended vesting and termination provisions of previously granted equity awards. The nine months ended September 29,2017 includes $27.1 million of intangible asset amortization and $0.8 million of acquisition and integration costs. Excluding these items from their related periods,adjusted operating expenses in the nine months ended September 28, 2018 increased 5.3% to $961.3 million or 15.3% of sales, which compares to prior yearadjusted operating expenses of $912.4 million or 15.4% of sales. Further adjusting operating expenses for an unfavorable $4.6 million impact of foreign currencyin the nine months ended September 28, 2018 , adjusted operating expenses would have increased by 4.8% .
Operating Income
Three Months Ended
(In millions) NSS EES UPS Corporate Total
Operating income, 2018 $ 75.0 $ 34.1 $ 19.9 $ (39.5) $ 89.5
Operating income, 2017 67.5 26.8 19.8 (33.3) 80.8
$ Change $ 7.5 $ 7.3 $ 0.1 $ (6.2) $ 8.7
% Change 11.1% 27.1% 0.3% (18.3)% 10.8%
Items impacting operating income in 2018 $ 5.3 $ 1.5 $ 3.2 $ 0.3 $ 10.3
Adjusted operating income, 2018 (Non-GAAP) $ 80.3 $ 35.6 $ 23.1 $ (39.2) $ 99.8
Items impacting operating income in 2017 $ 3.6 $ 2.2 $ 3.3 $ 0.8 $ 9.9
Adjusted operating income, 2017 (Non-GAAP) $ 71.1 $ 29.0 $ 23.1 $ (32.5) $ 90.7
Adjusted % Change (Non-GAAP) 12.9% 22.8% —% (20.6)% 10.0%
Plus the % impact of: Foreign exchange 1.1% 0.9% 0.6% (0.3)% 1.3%
Copper pricing —% 2.1% 0.1% — % 0.7%
Organic (Non-GAAP) 12.2% 30.1% 1.0% (18.6)% 12.8%
21

ANIXTER INTERNATIONAL INC.
NSS – Operating income was $75.0 million , or 6.6% of sales, in the third quarter of 2018, compared to $67.5 million , or 6.4% of sales, in the third quarterof 2017. The increase in operating income was due to sales growth in both the network infrastructure and security portions of the business. NSS delivered adjustedoperating income of $80.3 million in the third quarter of 2018, resulting in adjusted operating margin of 7.0% . NSS delivered adjusted operating income of $71.1million in the third quarter of 2017, resulting in adjusted operating margin of 6.8% .
EES – Operating income was $34.1 million , or 5.7% of sales, in the third quarter of 2018, compared to $26.8 million , or 4.8% of sales, in the third quarterof 2017. The increase in operating income was driven by strong operating expense leverage. EES delivered adjusted operating income of $35.6 million in the thirdquarter of 2018 , resulting in adjusted operating margin of 6.0% . EES delivered adjusted operating income of $29.0 million in the third quarter of 2017, resultingin adjusted operating margin of 5.2% .
UPS – Operating income was $19.9 million , or 4.5% of sales, in the third quarter of 2018, compared to $19.8 million , or 4.8% , in the third quarter of 2017.UPS delivered adjusted operating income of $23.1 million in the third quarter of 2018 , resulting in adjusted operating margin of 5.2% . UPS delivered adjustedoperating income of $23.1 million in the third quarter of 2017, resulting in adjusted operating margin of 5.6% .
Nine Months Ended
(In millions) NSS EES UPS Corporate Total
Operating income, 2018 $ 194.6 $ 101.1 $ 54.2 $ (127.5) $ 222.4
Operating income, 2017 194.2 84.3 57.3 (103.5) 232.3
$ Change $ 0.4 $ 16.8 $ (3.1) $ (24.0) $ (9.9)
% Change 0.2 % 19.9 % (5.4)% (23.2)% (4.3)%
Items impacting operating income in 2018 $ 17.8 $ 7.6 $ 10.6 $ 8.3 $ 44.3
Adjusted operating income, 2018 (Non-GAAP) $ 212.4 $ 108.7 $ 64.8 $ (119.2) $ 266.7
Items impacting operating income in 2017 $ 10.8 $ 5.9 $ 10.0 $ 1.2 $ 27.9
Adjusted operating income, 2017 (Non-GAAP) $ 205.0 $ 90.2 $ 67.3 $ (102.3) $ 260.2
Adjusted % Change (Non-GAAP) 3.6 % 20.5 % (3.7)% (16.5)% 2.5 %
Plus the % impact of: Foreign exchange (0.2)% (0.8)% (0.1)% 0.6 % (0.2)%
Copper pricing — % (4.5)% (0.1)% — % (1.7)%
Organic (Non-GAAP) — % 14.6 % (5.6)% (22.6)% (6.2)%
22

ANIXTER INTERNATIONAL INC.
NSS – Operating income was $194.6 million , or 6.0% of sales, in the nine months ended September 28, 2018 , compared to $194.2 million , or 6.3% ofsales, in the nine months ended September 29, 2017 . The increase in operating income was due to sales growth in both the network infrastructure and securityportions of the business. NSS delivered adjusted operating income of $212.4 million in the nine months ended September 28, 2018 , resulting in adjusted operatingmargin of 6.6% . NSS delivered adjusted operating income of $205.0 million in the nine months ended September 29, 2017 , resulting in adjusted operating marginof 6.7% .
EES – Operating income was $101.1 million , or 5.7% of sales, in the nine months ended September 28, 2018 , compared to $84.3 million , or 5.1% of sales,in the nine months ended September 29, 2017 . The increase in operating income was driven by the favorable impacts of higher copper prices combined with salesgrowth and strong operating expense leverage. EES delivered adjusted operating income of $108.7 million in the nine months ended September 28, 2018 , resultingin adjusted operating margin of 6.1% . EES delivered adjusted operating income of $90.2 million in the nine months ended September 29, 2017 , resulting inadjusted operating margin of 5.5%
UPS – Operating income was $54.2 million , or 4.2% of sales, in the nine months ended September 28, 2018 , compared to $57.3 million , or 4.7% , in thenine months ended September 29, 2017 . The decrease in operating income was driven by lower gross margin. UPS delivered adjusted operating income of $64.8million in the nine months ended September 28, 2018 , resulting in adjusted operating margin of 5.1% . UPS delivered adjusted operating income of $67.3 millionin the nine months ended September 29, 2017 , resulting in adjusted operating margin of 5.6% .
Interest Expense and Other
Interest expense was $19.3 million and $18.9 million in the third quarter of 2018 and 2017 , respectively. Interest expense was $56.5 million and $55.7million in the nine months ended September 28, 2018 and September 29, 2017 , respectively. The increase in interest expense in 2018 was driven by higherborrowings under the revolving lines of credit due to increased working capital investment to support the growth in the business.
Foreign exchange and other expense of $1.6 million in the third quarter of 2018 compares to $0.5 million of income in the third quarter of 2017 . Foreignexchange and other expense of $2.6 million in the nine months ended September 28, 2018 compares to $0.5 million of expense in the nine months endedSeptember 29, 2017 . The increase in foreign exchange and other expense was driven by the strengthening of the U.S. dollar against certain foreign currencies,primarily in Europe, Canada and Latin America.
Income Taxes
Our effective tax rate for the third quarter of 2018 was 30.6% compared to 39.7% in the prior year period. Our effective tax rate for the nine months endedSeptember 28, 2018 was 29.9% compared to 38.3% in the prior year period. The nine months ended September 28, 2018 included a $1.8 million tax benefit relatedto the reversal of deferred income tax valuation allowances, partially offset by $0.5 million of tax expense related to domestic permanent tax differences. Thedecrease in our effective tax rate was primarily due to a favorable tax impact from the December 22, 2017 Tax Cuts and Jobs Act (the "Act"). Under the Act, thestatutory U.S. federal tax rate was reduced from 35% to 21% effective January 1, 2018. The benefit from this rate reduction was partially offset by other newlyenacted tax provisions.
23

ANIXTER INTERNATIONAL INC.
EBITDA and Adjusted EBITDA
Q3 EBITDA and Adjusted EBITDA by Segment: Three Months Ended September 28, 2018
(In millions) NSS EES UPS Corporate TotalNet income $ 75.0 $ 34.1 $ 19.9 $ (81.4) $ 47.6Interest expense — — — 19.3 19.3Income taxes — — — 21.0 21.0Depreciation 0.9 0.6 1.1 5.6 8.2Amortization of intangible assets 5.0 1.4 3.2 — 9.6
EBITDA $ 80.9 $ 36.1 $ 24.2 $ (35.5) $ 105.7
Total of items impacting operating income* $ 0.3 $ 0.1 $ — $ 0.3 $ 0.7Foreign exchange and other non-operating expense — — — 1.6 1.6Stock-based compensation 0.4 0.3 (0.1) 2.6 3.2
Adjusted EBITDA $ 81.6 $ 36.5 $ 24.1 $ (31.0) $ 111.2
* Items impacting operating income excludes amortization of intangible assets in the calculation of adjusted EBITDA as amortization is already added back in the
EBITDA calculation above.
Three Months Ended September 29, 2017
(In millions) NSS EES UPS Corporate TotalNet income $ 67.5 $ 26.8 $ 19.8 $ (76.5) $ 37.6Interest expense — — — 18.9 18.9Income taxes — — — 24.8 24.8Depreciation 0.7 0.5 1.1 5.1 7.4Amortization of intangible assets 3.6 2.2 3.3 — 9.1
EBITDA $ 71.8 $ 29.5 $ 24.2 $ (27.7) $ 97.8
Total of items impacting operating income* $ — $ — $ — $ 0.8 $ 0.8Foreign exchange and other non-operating (income) — — — (0.5) (0.5)Stock-based compensation 0.5 0.2 0.6 3.1 4.4
Adjusted EBITDA $ 72.3 $ 29.7 $ 24.8 $ (24.3) $ 102.5
* Items impacting operating income excludes amortization of intangible assets in the calculation of adjusted EBITDA as amortization is already added back in the
EBITDA calculation above.
NSS – NSS adjusted EBITDA of $81.6 million in the third quarter of 2018 compares to $72.3 million in the third quarter of 2017 . The increase in adjustedEBITDA was driven by operating expense leverage and the favorable impact from acquisitions.
EES – EES adjusted EBITDA of $36.5 million in the third quarter of 2018 compares to $29.7 million in the third quarter of 2017 . The increase in adjustedEBITDA was driven by strong expense leverage associated with the sales growth.
UPS – UPS adjusted EBITDA of $24.1 million in the third quarter of 2018 compares to $24.8 million in the third quarter of 2017 . The decrease in adjustedEBITDA was caused primarily by customer mix combined with inflationary pressures on product costs and freight expense.
24

ANIXTER INTERNATIONAL INC.
Q3 YTD EBITDA and Adjusted EBITDA by Segment: Nine Months Ended September 28, 2018
(In millions) NSS EES UPS Corporate TotalNet income $ 194.6 $ 101.1 $ 54.2 $ (235.4) $ 114.5Interest expense — — — 56.5 56.5Income taxes — — — 48.8 48.8Depreciation 2.6 1.8 2.9 16.0 23.3Amortization of intangible assets 13.0 5.7 9.9 — 28.6
EBITDA $ 210.2 $ 108.6 $ 67.0 $ (114.1) $ 271.7
Total of items impacting operating income* $ 4.8 $ 1.9 $ 0.7 $ 5.7 $ 13.1Foreign exchange and other non-operating expense — — — 2.6 2.6Stock-based compensation 1.2 1.1 0.4 12.3 15.0
Adjusted EBITDA $ 216.2 $ 111.6 $ 68.1 $ (93.5) $ 302.4
* Items impacting operating income excludes amortization of intangible assets and CEO retirement agreement expense in the calculation of adjusted EBITDA as
amortization is already added back in the EBITDA calculation and CEO retirement agreement expense is added back as part of Stock-based compensation.
Nine Months Ended September 29, 2017
(In millions) NSS EES UPS Corporate TotalNet income $ 194.2 $ 84.3 $ 57.3 $ (227.2) $ 108.6Interest expense — — — 55.7 55.7Income taxes — — — 67.5 67.5Depreciation 2.2 1.7 3.1 14.5 21.5Amortization of intangible assets 10.8 6.4 9.9 — 27.1
EBITDA $ 207.2 $ 92.4 $ 70.3 $ (89.5) $ 280.4
Total of items impacting operating income* $ — $ (0.5) $ 0.1 $ 1.2 $ 0.8Foreign exchange and other non-operating expense — — — 0.5 0.5Stock-based compensation 1.5 1.0 1.2 9.6 13.3
Adjusted EBITDA $ 208.7 $ 92.9 $ 71.6 $ (78.2) $ 295.0
* Items impacting operating income excludes amortization of intangible assets in the calculation of adjusted EBITDA as amortization is already added back in the
EBITDA calculation above.
NSS – NSS adjusted EBITDA of $216.2 million in the nine months ended September 28, 2018 compares to $208.7 million in the nine months endedSeptember 29, 2017 . The increase in adjusted EBITDA was driven by operating expense leverage and the favorable impact from acquisitions.
EES – EES adjusted EBITDA of $111.6 million in the nine months ended September 28, 2018 compares to $92.9 million in the nine months endedSeptember 29, 2017 . The increase in adjusted EBITDA was driven by strong expense leverage associated with the sales growth combined with the benefit ofhigher copper prices.
UPS – UPS adjusted EBITDA of $68.1 million in the nine months ended September 28, 2018 compares to $71.6 million in the nine months endedSeptember 29, 2017 . The decrease in adjusted EBITDA was due primarily to lower gross margin.
25

ANIXTER INTERNATIONAL INC.
Financial Liquidity and Capital Resources
Cash Flow
As a distributor, our use of capital is largely for working capital to support our revenue growth. Capital commitments for property and equipment are limitedto information technology assets, warehouse equipment, office furniture and fixtures and leasehold improvements, because we operate almost entirely from leasedfacilities. Therefore, in any given reporting period, the amount of cash consumed or generated by operations other than from net earnings will primarily be due tochanges in working capital as a result of the rate of increases or decreases in sales.
In periods when sales are increasing, the expanded working capital needs will be funded first by cash from operations, then from additional borrowings andlastly from additional equity offerings. In periods when sales are decreasing, we will have improved cash flows due to reduced working capital requirements.During such periods, we will use the expanded cash flow to reduce the amount of leverage in our capital structure until such time as economic conditions improveand growth resumes. Also, we will, from time to time, issue or retire borrowings or equity in an effort to maintain a cost-effective capital structure consistent withour anticipated capital requirements.
Net cash provided by operations was $102.8 million in the nine months ended September 28, 2018 compared to net cash provided by operations of $110.1million in the prior year period. The decrease is primarily due to higher investment in working capital to support growth in the business.
Net cash used in investing activities was $172.8 million in the nine months ended September 28, 2018 , which included $149.9 million for the acquisition ofsecurity businesses in Australia and New Zealand and $32.0 million for capital expenditures. Net cash used in investing activities was $30.9 million in the ninemonths ended September 29, 2017 and related to capital expenditures. Capital expenditures are expected to be approximately $45 - $50 million in 2018 as wecontinue to invest in warehouse equipment, information system upgrades, integration of acquired businesses and new software to support our infrastructure.
Net cash provided by financing activities was $17.8 million in the nine months ended September 28, 2018 compared to net cash used in financing activitiesof $114.3 million in the nine months ended September 29, 2017 . During the nine months ended September 28, 2018 , we had net borrowings on our revolvinglines of credit of $16.3 million . During the nine months ended September 29, 2017 , we had net repayments on our revolving lines of credit of $46.7 million and arepayment of our Canadian term loan of $70.9 million .
Liquidity and Capital Resources
At September 28, 2018 , our primary liquidity source was the Receivables Facility in an aggregate committed amount of $600.0 million and the InventoryFacility in an aggregate committed amount of $150.0 million. At September 28, 2018 , there was $145.0 million of borrowings under the Receivables Facility, andthere were no borrowings under the Inventory Facility.
Our debt-to-capital ratio decreased from 46.1% at December 29, 2017 to 44.7% at September 28, 2018 , below our targeted range of 45-50%.
We are in compliance with all of our covenants and believe that there is adequate margin between the covenant ratios and the actual ratios given the currenttrends of the business. For further information, including information regarding our credit arrangements, see Note 3. "Debt" in the Notes to the CondensedConsolidated Financial Statements.
Critical Accounting Policies and Estimates
There were no material changes in our critical accounting policies since the filing of our 2017 Form 10-K. For further information about recently issuedaccounting pronouncements, see Note 1. "Summary of Significant Accounting Policies" in the Notes to the Condensed Consolidated Financial Statements. Asdiscussed in the 2017 Form 10-K, the preparation of the consolidated financial statements in conformity with accounting principles generally accepted in theUnited States requires management to make certain estimates and assumptions that affect the amount of reported assets and liabilities and disclosure of contingentassets and liabilities at the date of the consolidated financial statements and revenues and expenses during the periods reported. Actual results may differ fromthose estimates.
26

ANIXTER INTERNATIONAL INC.
ITEM 3. QUANTITATIVE AND QUALITATIVE DISCLOSURES ABOUT MARKET RISK.There were no material changes to market risks and related disclosures in Item 7A. of Part II in the Company's Annual Report on Form 10-K for the year
ended December 29, 2017, as filed with the Securities and Exchange Commission on February 22, 2018.
ITEM 4. CONTROLS AND PROCEDURES.
Under the supervision and with the participation of Anixter's management, including its principal executive officer and principal financial officer, anevaluation was conducted as of September 28, 2018 of the effectiveness of the design and operation of disclosure controls and procedures, as such term is definedunder Rule 13a-15(e) promulgated under the Securities Exchange Act of 1934, as amended. Based on this evaluation, the Company's principal executive officerand principal financial officer concluded that disclosure controls and procedures were effective as of September 28, 2018 . There was no change in internal controlover financial reporting that occurred during the three months ended September 28, 2018 that has materially affected, or is reasonably likely to materially affect,the Company's internal control over financial reporting.
27

PART II. OTHER INFORMATION
ITEM 1. LEGAL PROCEEDINGS.Information regarding legal proceedings is contained in Note 4. "Legal Contingencies" in the Notes to the Condensed Consolidated Financial Statements
contained in this report and is incorporated herein by reference.
ITEM 1A. RISK FACTORS.There were no material changes to the risk factors disclosed in Item 1A of Part 1 in the Company's Annual Report on Form 10-K for the year ended
December 29, 2017, as filed with the Securities and Exchange Commission on February 22, 2018.
ITEM 6. EXHIBITS.
(31) Rule 13a — 14(a) /15d — 14(a) Certifications.31.1 William A. Galvin, President and Chief Executive Officer, Certification Pursuant to Section 302 of the Sarbanes-Oxley Act of 2002.31.2
Theodore A. Dosch, Executive Vice President-Finance and Chief Financial Officer, Certification Pursuant to Section 302 of the Sarbanes-OxleyAct of 2002.
(32) Section 1350 Certifications.32.1
William A. Galvin, President and Chief Executive Officer, Certification Pursuant to 18 U.S.C. Section 1350, as adopted pursuant to Section 906of the Sarbanes-Oxley Act of 2002.
32.2 Theodore A. Dosch, Executive Vice President-Finance and Chief Financial Officer, Certification Pursuant to 18 U.S.C. Section 1350, as adoptedpursuant to Section 906 of the Sarbanes-Oxley Act of 2002.
101.INS** XBRL Instance Document101.SCH** XBRL Taxonomy Extension Schema Document101.CAL** XBRL Taxonomy Extension Calculation Linkbase Document101.DEF** XBRL Taxonomy Extension Definition Linkbase101.LAB** XBRL Taxonomy Extension Label Linkbase Document101.PRE** XBRL Taxonomy Extension Presentation Linkbase Document
** Attached as Exhibit 101 to this report are the following documents formatted in XBRL (Extensible Business Reporting Language): (i) the CondensedConsolidated Statements of Comprehensive Income for the three and nine months ended September 28, 2018 and September 29, 2017 , (ii) the CondensedConsolidated Balance Sheets at September 28, 2018 and December 29, 2017 , (iii) the Condensed Consolidated Statements of Cash Flows for the nine monthsended September 28, 2018 and September 29, 2017 , and (iv) Notes to the Condensed Consolidated Financial Statements for the three and nine months endedSeptember 28, 2018 .
28

ANIXTER INTERNATIONAL INC.
SIGNATURES
Pursuant to the requirements of the Securities Exchange Act of 1934, the Registrant has duly caused this report to be signed on its behalf by the undersigned,thereunto duly authorized.
ANIXTER INTERNATIONAL INC.
October 23, 2018 By: /s/ William A. Galvin William A. Galvin President and Chief Executive Officer
October 23, 2018 By: /s/ Theodore A. Dosch Theodore A. Dosch
Executive Vice President – Finance and Chief Financial
Officer
29
EXHIBIT 31.1
PRESIDENT AND CHIEF EXECUTIVE OFFICER CERTIFICATION
I, William A. Galvin, certify that:
(1) I have reviewed this quarterly report on Form 10-Q of Anixter International Inc.;
(2) Based on my knowledge, this report does not contain any untrue statement of a material fact or omit to state a material fact necessary to make thestatements made, in light of the circumstances under which such statements were made, not misleading with respect to the period covered by this report;
(3) Based on my knowledge, the financial statements, and other financial information included in this report, fairly present in all material respects thefinancial condition, results of operations and cash flows of the registrant as of, and for, the periods presented in this report;
(4) The registrant's other certifying officer and I are responsible for establishing and maintaining disclosure controls and procedures (as defined in ExchangeAct Rules 13a-15(e) and 15d-15(e)) and internal control over financial reporting (as defined in Exchange Act Rules 13a-15(f) and 15d-15(f)) for theregistrant and have:
a) Designed such disclosure controls and procedures, or caused such disclosure controls and procedures to be designed under our supervision, toensure that material information relating to the registrant, including its consolidated subsidiaries, is made known to us by others within thoseentities, particularly during the period in which this report is being prepared;
b) Designed such internal control over financial reporting, or caused such internal control over financial reporting to be designed under oursupervision, to provide reasonable assurance regarding the reliability of financial reporting and the preparation of financial statements forexternal purposes in accordance with generally accepted accounting principles;
c) Evaluated the effectiveness of the registrant's disclosure controls and procedures and presented in this report our conclusions about theeffectiveness of the disclosure controls and procedures, as of the end of the period covered by this report based on such evaluation; and
d) Disclosed in this report any change in the registrant's internal control over financial reporting that occurred during the registrant's most recentfiscal quarter (the registrant's fourth fiscal quarter in the case of an annual report) that has materially affected, or is reasonably likely tomaterially affect, the registrant's internal control over financial reporting; and
(5) The registrant's other certifying officer and I have disclosed, based on our most recent evaluation of internal control over financial reporting, to theregistrant's auditors and the audit committee of the registrant's board of directors (or persons performing the equivalent functions):
a) All significant deficiencies and material weaknesses in the design or operation of internal control over financial reporting which are reasonablylikely to adversely affect the registrant's ability to record, process, summarize and report financial information; and
b) Any fraud, whether or not material, that involves management or other employees who have a significant role in the registrant's internal controlover financial reporting.
October 23, 2018 /s/ William A. Galvin William A. Galvin President and Chief Executive Officer

EXHIBIT 31.2
EXECUTIVE VICE PRESIDENT – FINANCE AND CHIEF FINANCIAL OFFICER CERTIFICATION
I, Theodore A. Dosch, certify that:
(1) I have reviewed this quarterly report on Form 10-Q of Anixter International Inc.;
(2) Based on my knowledge, this report does not contain any untrue statement of a material fact or omit to state a material fact necessary to make thestatements made, in light of the circumstances under which such statements were made, not misleading with respect to the period covered by this report;
(3) Based on my knowledge, the financial statements, and other financial information included in this report, fairly present in all material respects thefinancial condition, results of operations and cash flows of the registrant as of, and for, the periods presented in this report;
(4) The registrant's other certifying officer and I are responsible for establishing and maintaining disclosure controls and procedures (as defined in ExchangeAct Rules 13a-15(e) and 15d-15(e)) and internal control over financial reporting (as defined in Exchange Act Rules 13a-15(f) and 15d-15(f)) for theregistrant and have:
a) Designed such disclosure controls and procedures, or caused such disclosure controls and procedures to be designed under our supervision, toensure that material information relating to the registrant, including its consolidated subsidiaries, is made known to us by others within thoseentities, particularly during the period in which this report is being prepared;
b) Designed such internal control over financial reporting, or caused such internal control over financial reporting to be designed under oursupervision, to provide reasonable assurance regarding the reliability of financial reporting and the preparation of financial statements forexternal purposes in accordance with generally accepted accounting principles;
c) Evaluated the effectiveness of the registrant's disclosure controls and procedures and presented in this report our conclusions about theeffectiveness of the disclosure controls and procedures, as of the end of the period covered by this report based on such evaluation; and
d) Disclosed in this report any change in the registrant's internal control over financial reporting that occurred during the registrant's most recentfiscal quarter (the registrant's fourth fiscal quarter in the case of an annual report) that has materially affected, or is reasonably likely tomaterially affect, the registrant's internal control over financial reporting; and
(5) The registrant's other certifying officer and I have disclosed, based on our most recent evaluation of internal control over financial reporting, to theregistrant's auditors and the audit committee of the registrant's board of directors (or persons performing the equivalent functions):
a) All significant deficiencies and material weaknesses in the design or operation of internal control over financial reporting which are reasonablylikely to adversely affect the registrant's ability to record, process, summarize and report financial information; and
b) Any fraud, whether or not material, that involves management or other employees who have a significant role in the registrant's internal controlover financial reporting.
October 23, 2018 /s/ Theodore A. Dosch
Theodore A. Dosch Executive Vice President-Finance and Chief Financial Officer

EXHIBIT 32.1
CERTIFICATION PURSUANT TO 18 U.S.C. SECTION 1350, AS ADOPTED PURSUANT TOSECTION 906 OF THE SARBANES-OXLEY ACT OF 2002
In connection with the quarterly report of Anixter International Inc. (the "Company") on Form 10-Q for the period ending September 28, 2018 as filedwith the Securities and Exchange Commission on the date hereof (the "Report") I, William A. Galvin, President and Chief Executive Officer of the Company,certify, pursuant to 18 U.S.C. Sec. 1350, as adopted pursuant to Sec. 906 of the Sarbanes-Oxley Act of 2002, that to my knowledge:
(1) The Report fully complies with the requirements of section 13(a) or 15(d) of the Securities Exchange Act of 1934; and
(2) The information contained in the Report fairly presents, in all material respects, the financial condition and results of operations of the Company.
/s/ William A. Galvin William A. Galvin President and Chief Executive Officer October 23, 2018
EXHIBIT 32.2
CERTIFICATION PURSUANT TO 18 U.S.C. SECTION 1350, AS ADOPTED PURSUANT TOSECTION 906 OF THE SARBANES-OXLEY ACT OF 2002
In connection with the quarterly report of Anixter International Inc. (the "Company") on Form 10-Q for the period ending September 28, 2018 as filedwith the Securities and Exchange Commission on the date hereof (the "Report") I, Theodore A. Dosch, Executive Vice President-Finance and Chief FinancialOfficer of the Company, certify, pursuant to 18 U.S.C. Sec. 1350, as adopted pursuant to Sec. 906 of the Sarbanes-Oxley Act of 2002, that to my knowledge:
(1) The Report fully complies with the requirements of section 13(a) or 15(d) of the Securities Exchange Act of 1934; and
(2) The information contained in the Report fairly presents, in all material respects, the financial condition and results of operations of the Company.
/s/ Theodore A. Dosch Theodore A. Dosch Executive Vice President-Finance and Chief Financial Officer October 23, 2018