lao pdr national assessment report on disaster risk · pdf filechapter 5 cover mines advisory...
TRANSCRIPT

Linkages between Poverty and Disaster Risk
A
National Disaster Management OfficeMinistry of Labor and Social Welfare
Lao PDR2012
Lao PDRNational Assessment Report on Disaster Risk Reduction (2012)Linkages between Poverty and Disaster Risk

Disclaimer
The document is based on existing reports as well as evidence based historical data collection and analysis using DesInventar database created at the National Disaster Management Office (NDMO), Lao PDR. Efforts have been made to ensure the accuracy and reliability of the information contained in the document. The document remains open for correction and improvement.
Key Contributors
NDMO Lao PDR Mr. Khamphao Hompanhya ([email protected])Mr. Vilayphong Sisomvang ([email protected])Ms. Bouasy Thammasack ([email protected])
ADPC Mr. Aslam Perwaiz ([email protected])Mr. Thanongdeth Insixiengmay ([email protected])Ms. Thitiphon Sinsupan ([email protected])Ms. Somvath Keokhamphoui ([email protected])Ms. Phitsamai Khammanivong ([email protected])Ms. Mareike Bentfeld ([email protected])
Photo credits:Cover ADPCChapter 1 Cover ADPCChapter 2 Cover ADPCChapter 3 Cover ADPCChapter 4 Cover ADPCChapter 5 Cover Mines Advisory Group1
1 http://www.flickr.com/photos/mag-photos/4777635220/

Linkages between Poverty and Disaster Risk
i
Acknowledgement
Appreciation is expressed to all who supported the development of the Lao PDR National Assessment Report 2012 under the leadership of NDMO, Lao PDR. Sincere thanks goes to the members of the Inter-Ministerial Technical Working Group for their contribution and especially their support in data collection as well as their contribution to the draft versions of the LNAR. Appreciation is also expressed to ADPC for their cooperation with the NDMO as well as their technical support.
Furthermore, sincere acknowledgment is due to Mr. Julio Serje, from UNISDR, for his technical support during the DesInventar database creation, capacity building of national and provincial officials to maintain, analyze and update the system. He has been instrumental in assisting NDMO in analyzing the data in perspective.
Last but not least we would like to express our thanks to UNISDR whose financial support to implement this project has been highly appreciated.

Lao PDR National Assessment Report on Disaster Risk Reduction
ii
Table of Content
iv Acronyms
v List of Tables
vi List of Figures
1 Background of the Report
2 Objective of the Report
2 Structure of the Report
3 chapter 1
Introduction
4 Location and Geography Lao PDR
5 Population Size and Demographic Indicators
6 Economic Development Profile
6 Disaster Management Profile
9 chapter 2 National Risk Profile
of Lao PDR
10 Introduction
11 Earthquakes
13 Floods
14 Landslide
15 Epidemics
16 Unexploded Ordinances
16 Drought
18 Storm

Linkages between Poverty and Disaster Risk
iii
19 chapter 3 Initial Analysis of Disasters in
Lao PDR using DesInventar
20 Introduction
21 Overall Disaster Analysis
22 Hazard Risk and Disaster Impact
40 Existing National Disaster Management Strategies in Lao PDR
43 chapter 4 Linking Poverty Reduction
and DRR
44 Introduction
47 Facts and Figures: Poverty in Lao PDR
49 Existing National Disaster Management and Poverty Reduction Policies in Lao PDR
51 Poverty and Disaster Linkages in Lao PDR
56 Disaster Risk Reduction to Support Poverty Reduction in Lao PDR
57chapter 5 Conclusion and Recommendations
60 Annex

Lao PDR National Assessment Report on Disaster Risk Reduction
iv
Acronyms
AADMER ASEAN Agreement on Disaster Management and Emergency Response
ADB Asian Development BankADPC Asian Disaster Preparedness Center
CPI Committee for Planning and InvestmentDFID Department for International Development, UKDMH Department of Meteorology and HydrologyGAR Global Assessment ReportGoL Government of Lao PDRHFA Hyogo Framework of ActionLDC Least Developed Countries
LECS Lao PDR Expenditure and Consumption SurveyLNAR Lao PDR National Risk Assessment Report on Disaster Risk
ReductionLNLCRDPE Lao National Leading Committee for Rural Development and
Poverty EradicationLRC Lao Red Cross Society
MDG Millennium Development GoalMEPF Ministry of Economic Planning and Finance
MLSW Ministry of Labor and Social WelfareMONRE Ministry of Natural Resources and Environment
MPI Ministry for Planning and InvestmentNAPA National Adaptation Programme of Action to Climate Change
NDMC National Disaster Management CommitteeNDMO National Disaster Management OfficeNDPCC National Disaster Prevention and Control CommitteeNGPES National Growth and Poverty Eradication StrategyNSEDP National Socio-Economic Development Plan
PTI Public Work and Transport InstituteSPI Standard Precipitation Index
TWG Technical Working GroupUNDP United Nations Development Programme
UNISDR United Nations International Strategy for Disaster ReductionUNOPS United Nations Office for Project ServicesUNPFA United Nations Population Fund
UXO Unexploded Ordnances

Linkages between Poverty and Disaster Risk
v
List of Tables
4 Table 1.1 Borders of Lao PDR
5 Table 1.2 Administrative Units of Lao PDR
7 Table 1.3 Demographic and socio-economic indicators of Lao PDR
12 Table 2.1 Distribution of Seismic Hazard Zones in Lao PDR
21 Table 3.1 Hazard Profile of Lao PDR
23 Table 3.2 Impacts of Epidemics on Lao PDR
23 Table 3.3 Impact of Plagues on the different Provinces
26 Table 3.4 Comparison between Epidemics and Plagues
26 Table 3.5 Overview of Impacts of Cold Waves on the Provinces in Lao PDR
26 Table 3.6 Overview of the Impact of Droughts on the Different Province
27 Table 3.7 Impact of Forest Fire on the Different Districts
27 Table 3.8 Comparison of the Impact of the Different Climatological Hazards
30 Table 3.9a Overview of the Impact of Floods on Lao PDR
31 Table 3.9b Overview of the Impact of Floods on Lao PDR (continued)
31 Table 3.10 Impact of Flash Floods on the Different Provinces
32 Table 3.11 Impact of Rain on the Provinces of Lao PDR
32 Table 3.12 Impact of Storms on the Provinces in Lao PDR
35 Table 3.13 Impact of storms on the most affected districts in Lao PDR
36 Table 3.14 Impacts of Thunderstorms on Districts in Lao PDR
37 Table 3.15 Impact of Wind Storms on the Districts in Lao PDR
39 Table 3.16 Impact of Hydro-Meteorological Disaster on the Different Provinces
40 Table 3.17 Impact of Fires on Lao PDR
46 Table 4.1 Matrix of Poverty, Inequality, Poverty Intensity and Poverty Gaps in Society
46 Table 4.2 Poverty rates in the different regions
48 Table 4.3 Matrix combining altitude with ethnicity and rural/urban areas
54 Table 4.4 Correlation of poverty and disaster indicators on provincial level
54 Table 4.5 Correlation of poverty and disaster indicators on district level
Lao PDR National Assessment Report on Disaster Risk Reduction
vi
List of Figures
11 Figure 2.1 Earthquake hazard map of Lao PDR
13 Figure 2.2 Xe Kong flood inundation for 10, 50 and 100 years return period
14 Figure 2.3 Landslide Susceptibility in Lao PDR
15 Figure 2.4 Disease susceptibility for Acute Watery Diarrhea and Dengue Fever
16 Figure 2.5 Distribution of UXOs in Lao PDR
17 Figure 2.6 Figure 2.6 Severe drought susceptibility map
18 Figure 2.7 Storm distribution in Lao PDR for different return period from 1979 to 2009
22 Figure 3.1 Distribution of hazard events in Lao PDR
24 Figure 3.2 Overview of Events in the Different Provinces
24 Figure 3.3 Distribution of Biological Hazard Events in Lao PDR
25 Figure 3.4 Number of Events in the Different Districts
25 Figure 3.5 Number of Drought Events Experienced by the Different Provinces
28 Figure 3.6 Overview of the number of different climatological events per province
28 Figure 3.8 Overview of Number of Flood Events per Province
28 Figure 3.7 Distribution of climatological hazards in Lao PDR
28 Figure 3.9 Most affected districts (more than 15 reported flood events)
29 Figure 3.10 Distribution of flood events in Lao PDR
36 Figure 3.11 Distribution of storm events in Lao PDR
37 Figure 3.12 Comparison of the number of different hydro-meteorological hazards per province
38 Figure 3.13 Distribution of hydro-meteorological events in Lao PDR
38 Figure 3.14 Distribution of Fire Events in Lao PDR
47 Figure 4.1 Percentage of poor in the different provinces

Linkages between Poverty and Disaster Risk
1
Background of the Report
The Lao National Assessment report on disaster risk reduction in 2012 is the key output of the implementation of the project “Strengthen Institutional Capacity for Development of Lao National Assessment Report (LAR-2012) on Disaster Risk Reduction in Lao PDR” and it will be the contribution of the Lao Government to the United Nation’s Global Assessment Report on Disaster Risk Reduction in 2013 which is prepared by UNISDR. The Lao PDR National Risk Assessment Report on Disaster Risk Reduction (LNAR) has been developed by the National Disaster Management Office (NDMO), Lao PDR, with technical and consultative support of UNISDR as the Lead Coordinator and ADPC who provided the necessary technical support as well as coordination support to the NDMO. To complete the report, NDMO has established a Technical Working Group (TWG) (Annex III.) under the Chairmanship of the Director General of NDMO. The representatives are;
1. National Disaster Management Office
2. Ministry of Planning and Investment
3. Ministry of Agriculture and Forestry
4. Ministry of Public Work and Transportation
5. Ministry of Education and Sport
6. Ministry of Labor Social Welfare
7. Ministry of Public Health
The report uses the DesInventar methodology which has been initiated by UNDP and UNISDR in Lao PDR since 2005. The DesInventar system supports historical data collection over longer periods by using a standardized disaster data template and also provides data analysis support by the integrated DesInventar software. The aim of the NDMO is to use the DesInventar software for the systematic collection, documentation and analysis of data related to disaster losses associated to natural hazards. However, no exhaustive analysis of the disaster data has been carried out yet. The LNAR is the first attempt to

Lao PDR National Assessment Report on Disaster Risk Reduction
2
analyze disaster data included in the DesInventar system. Capacities of Lao Government officials have been built focusing on the management of disaster management systems as well as evidence based historic data collection and analysis as a tool for disaster risk assessment.
Objective of the Report
The objective of this report is to present the current status of disaster risks in Lao PDR through a comprehensive assessment of past and existing initiatives by the National and Provincial Governments as well as Development partners. The report tries to establish a relationship between disaster risk and poverty reduction and guide the stakeholder in Lao PDR in mainstreaming disaster risk reduction into poverty reduction strategies and programs. Additionally, the report will be a contribution of the Lao Government to the Global Assessment Report (GAR)-2013 being prepared by UNISDR.
Structure of the Report
The report is structured in 5 chapters. Chapter 1 describes the geographical, economic, and administrative situation of Lao PDR. Furthermore, it provides a short paragraph about disaster management in Lao PDR. Chapter 2 provides a short overview of the national hazard profile. Chapter 3 presents the initial analysis of the DesInventar data. The DesInventar database was implemented in 2010/11 by the Lao PDR government and serves as a computer-based information management system that helps with the “systematic collection, documentation and analysis of data about losses caused by disasters associated to natural hazards” (DesInventar, n.d.). So far no exhaustive analysis of the disaster data has been carried out. Furthermore, existing policies and regulations are presented. Chapter 4 discusses the linkages between disaster risk and poverty using DesInventar data as well as poverty data on different levels. The last chapter, chapter 5, will give conclusions of the analysis and recommendations for the future are given. Furthermore, the importance of Disaster Risk Reduction in the context of Lao PDR is stressed as a means to reach sustainable economic growth and therefore graduate from the status of LDC by 2020.

Linkages between Poverty and Disaster Risk
3
chapter 1Introduction

Lao PDR National Assessment Report on Disaster Risk Reduction
4
Location and Geography Lao PDR
Lao PDR is a landlocked country covering a territory of 236,800 km2 in the center of the Southeast Asian peninsula and is surrounded by Myanmar in the North West, Cambodia in the south, China in the north, Thailand in the west and east Viet Nam.
Geographically, Lao PDR is divided into three regions, namely the Northern, Central, and Southern areas. Administratively, however, the country is divided into 17 political entities: 16 provinces (‘khoueng’), and 1 municipality (Vientiane). The provinces are divided into districts (‘muang’) with districts numbers per province ranging from 4 to 15. The districts are further
divided in smaller administrative units, namely villages (‘baan’). Table 1.2 gives an overview of the administrative units in each province.
The topography of Laos is characterized by its mountainous landscape which is dominated by the Annamite Range in the northeast and east and the Luang Prabang Range in the northwest. About two-third of the country is mountainous and thickly forested. Elevations are often above 500 meters and typically characterized by steep terrain, narrow river valleys, and low agricultural potential. Especially the north of Lao PDR is mostly mountainous with mountains reaching heights of more than 2,700 meters (8,860 ft). The
highest mountain is the Phou Bia with 2,819 meters which lies in the Annamite Range in Xiengkhuang Province. The only exceptions to the mountainous character of the north of Laos are the plain of Vientiane and the Plain of Jars in the Xiengkhuang Plateau. In the south of the country, more low level areas can be found for example in Savannakhet and
Table 1.1 Borders of Lao PDR
Region Borders with Length of borders (km)
North China 505
South Cambodia 435
East Viet Nam 2,069
North-West Myanmar 236
West Thailand 1,835
Source: ACD, 2012

Linkages between Poverty and Disaster Risk
5
Table 1.2 Administrative Units of Lao PDR
Province (17) Number of Districts (143)
Number of Villages (8647)
01 Vientiane Capital 9 491
02 Phongsaly 7 541
03 Luangnamtha 5 355
04 Oudomxay 7 472
05 Bokeo 5 283
06 Luangprabang 12 782
07 Huaphanh 8 720
08 Xayabury 11 448
09 Xiengkhuang 8 512
10 Vientiane 13 518
11 Borikhamxay 7 323
12 Khammuane 9 558
13 Savannakhet 15 1,015
14 Saravane 8 608
15 Sekong 4 230
16 Champasack 10 641
17 Attapeu 5 150
Source: Lao PDR Statistical Bureau, 2010
Champasack provinces. These areas are also well suited for crop cultivation and livestock raising. However, in total, only about 20% of the land area of Lao PDR consists of alluvial plains and terraces. In addition, only 4% of the total land area is classified as arable.
Lao PDR is located in tropical areas; the climate is divided into 2 seasons: dry and rainy season. The dry season begins in mid of October and ends mid of May. Due to the northwest monsoon cover in some years, the weather is considerably cold from October to February. Cold weather is experienced for a shorter period, namely from November to January, in the northern parts of Lao PDR, in the Bolaven plateau as well as in the east part of central Lao. From March to April the weather is hot. The lowest average temperature is about 13 to 17 degree Celsius, while the highest average temperature is about 35 to 38 degree Celsius. The yearly average temperature is about 26 to 28 degree Celsius. The monsoon reaching Lao PDR from the southwest of the Indian Ocean and the gulf of Thailand brings rain to Lao PDR. Rainy season ranges from mid May to mid October and especially from July to September Lao PDR sees frequent rainfall. The yearly average rainfall in the whole country is around 1900 to 3500 mm (DMH, 2012).
Population Size and Demographic Indicators
Since 1985, Lao PDR is carrying out population censuses on a regular basis every 10 years. Since 1985, the population size of Laos has tremendously increased. The total population has grown by nearly 80% in 25 years from 3.6 million in 1985 to 6.29 in 2010. Table 1.3 summarizes the basic demographic indicators using data which was gathered during the population censuses in 1995 and 2005. In addition, various estimates from different sources such as the UN Population Yearbook have been gathered to allow a more recent understanding of the situation in Lao PDR.

Lao PDR National Assessment Report on Disaster Risk Reduction
6
Economic Development Profile
The Lao PDR continues to develop rapidly and achieves non-income Millennium Development Goals as scheduled by enhancing economic diversification to become less reliant on volatile commodity prices, job creation for a very young population, enhancing governance and institutional capacity, creating a conducive environment for the private sector, and balancing growth with equity and sustainability (ADB, 2012). Between 2008 and 2011, Lao’s economic growth even exceeded 7% per year. The economic growth is also reflected in the increase of the GDP in Laos. In 1990, Lao PDR had a GDP per capita of 207.4 US $ and in 2011 the GDP per capita is estimated to increase to 1,281 US. In general, economic growth has reduced official poverty rates from 46% in 1992 to 26% in 2010 indicating the enormous effect of increased economic activity in Laos on the population (World Bank, 2012).
Disaster Management Profile
Lao PDR has experienced increasing intensity and severity of natural hazards (flood, drought and storms) that turned into unprecedented disasters. In addition, small scale but recurrent events cause increasing loss of human lives and loss of property. In recent years, Lao PDR was severely impacted by flood (particularly flash floods) caused by Typhoon Ketsana in 2009 and by the Typhoons Haima and Nokten in 2011. More than hundred thousand people were affected, dozens people were killed and houses and infrastructure were damaged. Every sector was affected by the disasters for instance agriculture, public works and transport, education, health, wash and sanitation, tourism, industry and trade, etc. with estimated cost of more than hundred million US $.
At the same time, the Lao PDR has made good progress and achievements in the implementation of the National Strategic Plan on Disaster Risk Management which is in line with the Hyogo Framework of Action (HFA) and ASEAN Agreement on Disaster Management and Emergency Response (AADMER). Some of its recent achievements are:
• legislationanddisasterriskmanagementandreductionmechanismhavebeenimproved and developed at national and local levels;
• disasterriskreduction(DRR)hasbeenintegratedintothecurrent7thNationalSocial and Economic Development Plan 2011-2015 in order to ensure every step of development and investment processes are protected from natural disasters and does not create new vulnerability and hazards2
2 The urban planning law is e.g. currently being revised to ensure that DRR is incorporated

Linkages between Poverty and Disaster Risk
7
• theGovernmentofLaoPDRhas implemented policy of empowering the local administration at all levels emphasizing that all the government agencies should focus on the macro-management such as strategic planning for development of their respective sectors, drafting the legislations, human resources development last but not least audit, control and inspection to ensure good governance
• disasterpreparednessandriskreduction plans have been developed and implemented with active participation of communities
• DRRwasgraduallyintegratedinto poverty reduction programs, gender and livelihood enhancement activities
• earlywarningsystemhasbeen improved through the development of national strategy and standard operating procedure (SOP) on Early Warning
upgrading and setting up of a data collection and monitoring system, improvement of flood and weather monitoring and forecasting, earthquake monitoring, dissemination of flood early warning information
• DRRwasintegratedintocurriculumof upper primary and lower secondary schools school safety construction guideline was developed and disseminated
• capacitybuildingprogramsandcommunity based disaster risk reduction have been implemented at the local and community levels, such as community risk
Table 1.3 Demographic and socio-economic indicators of Lao PDR
Indicators Census Year
1995 2005 2011*
Population (in millions) 4.58 5.62 6.59
Population below 15 (in millions)
2.02(44%)
2.19(39%)
2.31(36.7%)
Annual growth rate (in %) 2.4 2.1 1.7
Population density (pop/sq.km)
19.4 25 n.a.
Sex ratio (males per 100 females)
97.7 99.3 98.0
Total dependency ratio [persons aged (0-14) and 65+ per 100 (15-59) years]
1.1 0.8 n.a.
Urban population (‘000) 778 1,517 2,157
Proportion of urban population (%)
17 27 33
Total literacy rate in % 60 73 n.a.
Literacy rate of males in % 74 82 83
Literacy rate of females in % 48 63 63
Crude birth rates (per 1000) 36.6 25.7 25.7
Crude death rates (per 1000) 13.6 9.8 7.9
Infant mortality rates (per 1000 live births)
104 70 57
Maternal mortality rate (per 100,000 live births)
n.a. 405 580
Total fertility rate (children per women)
6.7 3.3 3.06
Life expectancy at birth (years)
51 61 63
Life expectancy at birth for males (years)
50 59 61
Life expectancy at birth for females (years)
52 63 65
Land under cereal production (‘000 ha)
n.a. 822 1.090
Source: Ministry of Planning and Investment – Population Census of Lao PDR; World Bank, 2012; WHO, 2012* Not a census year
Lao PDR National Assessment Report on Disaster Risk Reduction
8
assessment, planning and implementing village disaster reduction plan, raising awareness and education for school children and communities, etc.
• riskmappingandprofilinghasbeenconductedatthenationallevel work will be continued in other provinces with high risk to natural disasters
• disasterdatacollection,databaseandinformationmanagementsystemhavebeenimproved
• activecooperationandpartnershipwithUNagencies,internationaldevelopmentpartners, donors, INGOs, ASEAN, etc. in strengthening disaster preparedness and disaster risk reduction, in particular, the implementation of HFA and ADDMER
The Government of Laos (GoL) has set a strong vision for the country to achieve the MDGs, graduate from the LDC status in 2020 and strive towards sustainable development. Reducing vulnerabilities to disaster and climate change to ensure food security improve access to water and sanitation and sustain livelihoods, especially of rural population will be essential for Lao PDR to achieve its ambitious national development goals. Reducing disaster loses and adapt to climate change are mentioned explicitly in the 7th National Socio-Economic Development Plan 2011-2015 (7th NESDP) of Lao PDR. There are ongoing efforts to integrate DRR and CCA into sector policies such as agriculture and forestry, public work and transportation, water resources management and public health. These policies need to be translated into coherent practices, driven by strong political commitments for long-term sustainability vs. short-term economic growth aspirations. This is especially important in the context of resource-led growth in Lao PDR where deforestation, unsustainable management of watersheds and degradation of the ecosystems are driving increasing disaster risks.
The lessons from the 2008 flooding and later the Typhoons Ketsana, Haima and Nokten show the need of a comprehensive risk assessment based on historical data and probabilistic data for potential disaster impacts followed with developing and implementing safer development activities that takes into account hazard and consequent risks. There is an identified knowledge gap in Lao PDR with respect to the multi hazard assessment and demarcation of potential risks from natural disaster, without which it is difficult to effectively implement many developmental programs. A key prerequisite for this is the identification of relevant hazard and the definition of consequent risk.
The National Risk Profile of Lao PDR developed by NDMO with the support of UNDP and ADPC is aimed at hazard assessment and risk assessment. This was done based on broad assessments that included all natural hazards such as earthquake, flooding, landslide, storm, drought, epidemic and UXO. The challenge faced by NDMO was the availability of disaster related data, systematic analysis of the natural hazards and trend analysis of its impacts. However, since the shift in the country away from disaster management, response, and relief towards disaster risk reduction and climate change adaptation, a holistic approach with sustained efforts to reduce the costs of disaster has been adopted. This is to maintain a steady advance towards poverty alleviation and economic growth.

Linkages between Poverty and Disaster Risk
9
chapter 2National Risk Profile
of Lao PDR

Lao PDR National Assessment Report on Disaster Risk Reduction
10
The Lao Government has recognized the increasing trends of disasters in terms of frequency and magnitude. It has expressed its serious concern that disasters have already and will continue to impact the poverty reduction efforts and development gains as well as the achievement of the Millennium Development Goals (MDGs), HFA by 2015 and the graduation from the Least Developed Country’s status by 20203. The NDMO has recently developed an extensive National Risk Profile of Lao PDR focusing on hazard assessment which covers the development of a multi-hazard risk map for Lao PDR including a description of the baseline data, and hazard assessment and mapping for earthquakes, floods, drought, landslides, epidemics and diseases, UXO and storms hazards at the national level. The recommendations are segmented into eight sections: policy; institutional mandates and institutional development; hazard, vulnerability and risk assessment; multi-hazard early warning systems; preparedness and response plans; the integration of disaster risk reduction into development planning; community-based disaster risk management; and public awareness, education and training.
Introduction
The hazard assessment and hazard mapping at the national level has been carried out for earthquakes, floods, landslides, droughts, UXOs, storms and epidemics (UNDP, 2010). Well-established scientific tools and techniques have been used to assess the hazards and mapping accordingly. For earthquakes, hazard mapping is done for 250-year return periods. For flooding, the most flood-prone rivers and catchments are considered in the flood hazard assessment. The flood hazard mapping presents flood severity in terms of inundation depth and area with respect to 10-year, 25-year, 50-year and 100-year return periods.
3 Statement of the Head of the Lao delegation at the 5th Ministerial Conference on Disaster Risk Reduction, 22 - 25 October 2012, Yogyakarta, Republic of Indonesia.

Linkages between Poverty and Disaster Risk
11
The landslide hazard mapping is carried out considering rainfall as a triggering factor. Landslide-prone areas are classified as low, moderate and high-prone areas. The drought hazard mapping consisted of an analysis for the whole of Lao PDR using the Standard Precipitation Index (SPI). Drought hazards were classified into moderate, severe and extreme conditions.
Hazard assessment and mapping is conducted for several epidemics and diseases including ten diseases: Acute Bloody Diarrhea, Acute Respiratory Tract Infection, Acute Watery Diarrhea, Dengue Fever, Dengue Hemorrhagic Fever, Food Poisoning, Hepatitis, Malaria, Measles and Typhoid Fever. UXO hazard-prone areas have been mapped based on the National Regulatory Authority database for UXO. The storm mapping is developed based on historical storm data, with a 10-year, 20-year, 30-year and 50-year return period. The hazard assessment reveals that Lao PDR is prone to various geological, hydro-meteorological and human-induced hazards with specific degrees of severity.
Earthquakes
There is limited information available about the seismic activities in Lao PDR. The earthquake hazard maps were developed using MMI scale. The hazard assessment was based on earthquake intensity maps developed by UNOCHA (OCHA, 2011). The results show that one fourth of the area of Lao PDR is located in a high earthquake hazard zone. These areas include Xayabury, Bokeo, Oudomxay, Luangnamtha and Phongsaly provinces. More than 30% of the country is located in a moderate earthquake hazard zone, while 43.62% falls in a low earthquake risk zone. Figure 2.1 shows a map created for the National Risk Profile that shows that different earthquake risk zones. As can be seen there, especially the north part of Lao PDR is prone to earthquakes.
Figure 2.1 Earthquake hazard map of Lao PDR
Source: UNDP, National Risk Profile Lao PDR, 2010

Lao PDR National Assessment Report on Disaster Risk Reduction
12
Table 2.1 Distribution of Seismic Hazard Zones in Lao PDR
Earthquake risk Area in each province % area covered by earthquake hazard
Name of province Area in sq km
High risk Xayabury 15,541.07 56.7
Phongsaly 15,470.98 97.6
Luangnamtha 9,605.49 100
Bokeo 6,989.57 94.5
Oudomxay 11,794.83 100
Total 59,401.94 25.78
Moderate risk Vientiane 12,591.74 90.3
Xiengkhuang 12,715.39 95.9
Huaphanh 17,522.78 99.9
Luang Prabang 19,971.56 56.9
Total 70,511.11 30.6
Low risk Attapeu 9,551.72 100
Champasack 14,982.04 100
Sekong 8,396.82 100
Saravane 10,163.70 100
Savannakhet 21,400.51 100
Khammuane 16,724.40 100
Borikhamxay 15,711.30 94.7
Vientiane Mun. 3,586.91 67.9
Total 100,517.40 43.62
Source: UNDP, National Risk Profile Lao PDR, 2010
Based on the statistical record of the Department of Meteorology and Hydrology, earthquakes are experienced frequently in the northeast of Lao PDR. There were seven earthquakes with magnitudes 5 to 6.9 Richter scale occurred between 1973 and 2009. In 2009 there were 34 low magnitude earth quakes in 2009 (4 times: 4.0 to 4.9, 15 times: 3.0 to 3.9 and 15 times: 2.0-2.9) Seismic events in North-West part of Laos PDR have become more evident (DMH, 2010). In February 2011 an earth quake with magnitude of 4.7 Richter scale occurred in Xayabury province (Vientiane Times, 25 February 2011). At the end of March 2011, a 6.8 magnitude earth quake in Myanmar, near the border between Myanmar, Thailand and Lao PDR could be felt in northern Lao PDR. While there were 74 people had been killed, 111 injured three hundred and ninety houses, fourteen monasteries and nine government buildings damaged (IBT, March 2011). So far there has not been any record of earthquake damage or casualty in the north of Lao PDR. Most data about earthquakes
Linkages between Poverty and Disaster Risk
13
in Lao PDR is retrieved from the earthquake center in Unan province, China, while the earthquake information for the earthquakes that happened after 2007 were retrieved from the earthquake centers in Luang Prabang and Lakxao.
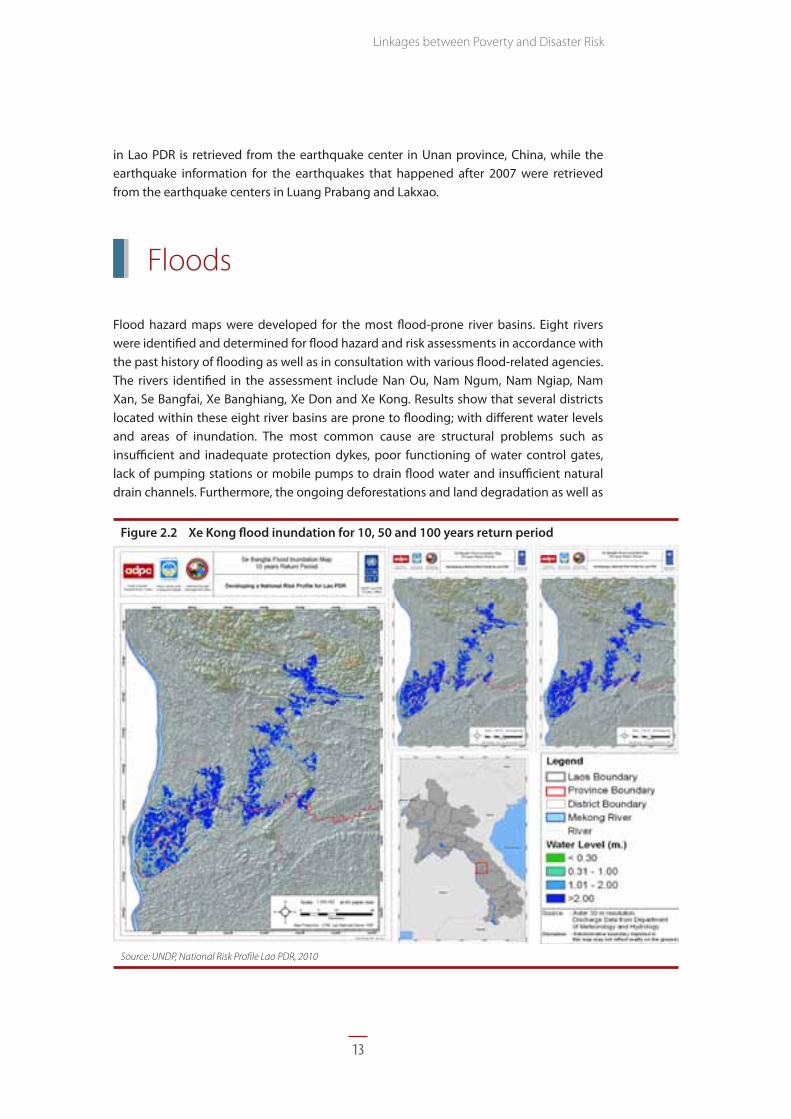
Floods
Flood hazard maps were developed for the most flood-prone river basins. Eight rivers were identified and determined for flood hazard and risk assessments in accordance with the past history of flooding as well as in consultation with various flood-related agencies. The rivers identified in the assessment include Nan Ou, Nam Ngum, Nam Ngiap, Nam Xan, Se Bangfai, Xe Banghiang, Xe Don and Xe Kong. Results show that several districts located within these eight river basins are prone to flooding; with different water levels and areas of inundation. The most common cause are structural problems such as insufficient and inadequate protection dykes, poor functioning of water control gates, lack of pumping stations or mobile pumps to drain flood water and insufficient natural drain channels. Furthermore, the ongoing deforestations and land degradation as well as
Figure 2.2 Xe Kong flood inundation for 10, 50 and 100 years return period
Source: UNDP, National Risk Profile Lao PDR, 2010
Lao PDR National Assessment Report on Disaster Risk Reduction
14
river straightening works and reclamation of wetlands combined with general poor land use planning increase the risk of disastrous floods.
However, there is also a relation between tropical storms and the occurrence of floods. Examples for that are the tropical Storm “Xangsane” in 2006 which caused severe floods in central and southern Lao PDR, the tropical Storm “Lekima” which hit the country in 2007 and also the tropical Storm “Ketsana” in September 2009. The Typhoon Ketsana affected more than 5 provinces caused an estimated damage of 58 million USD. The severe flood in 2011 caused by Typhoon Haima and Nokten killed 42 people in 12 provinces and severely destroyed houses, crops, schools, hospitals, roads, bridges, electricity polls, extension lines, communication systems, and caused widespread damage to irrigation schemes, aquaculture infrastructure and riverbanks. The total damages were around 200
million USD as estimated by the NDMO (Government of Lao PDR, 2011). Figure 2.2 shows the flood inundation for the Xe Kong river for 10, 50 and 100 years return period indicating the high risk of flooding in this area.
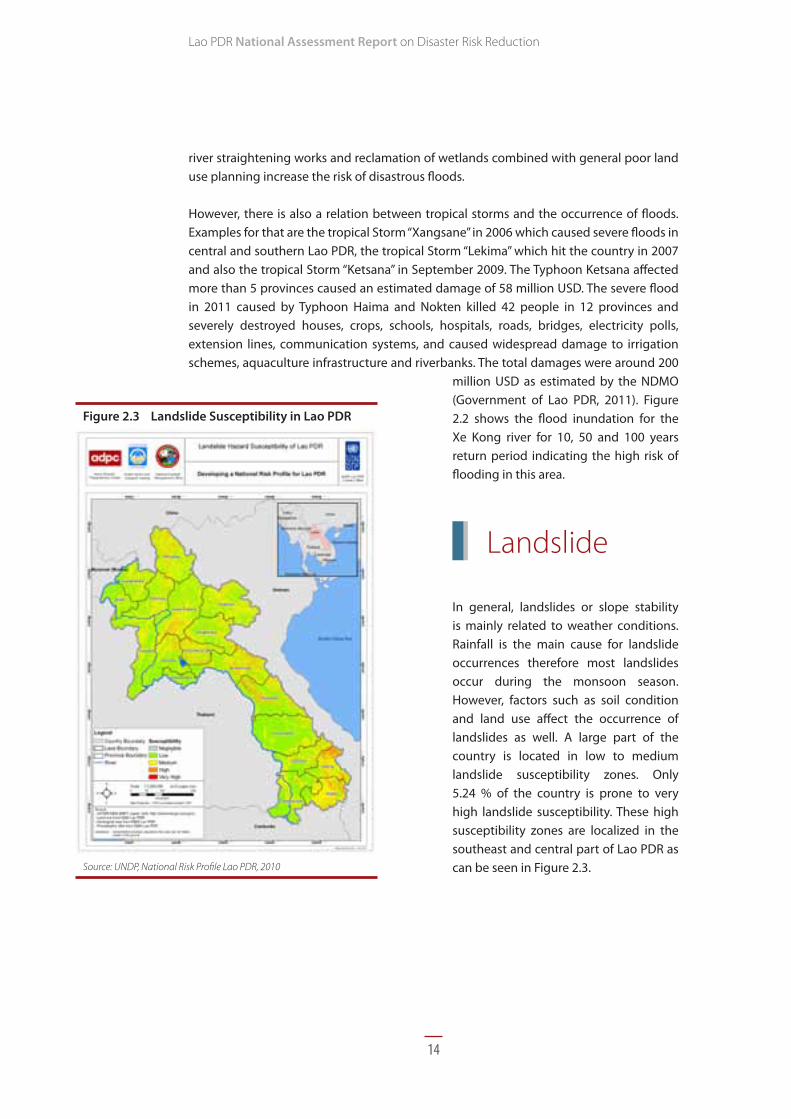
Landslide
In general, landslides or slope stability is mainly related to weather conditions. Rainfall is the main cause for landslide occurrences therefore most landslides occur during the monsoon season. However, factors such as soil condition and land use affect the occurrence of landslides as well. A large part of the country is located in low to medium landslide susceptibility zones. Only 5.24 % of the country is prone to very high landslide susceptibility. These high susceptibility zones are localized in the southeast and central part of Lao PDR as can be seen in Figure 2.3.
Figure 2.3 Landslide Susceptibility in Lao PDR
Source: UNDP, National Risk Profile Lao PDR, 2010
Linkages between Poverty and Disaster Risk
15
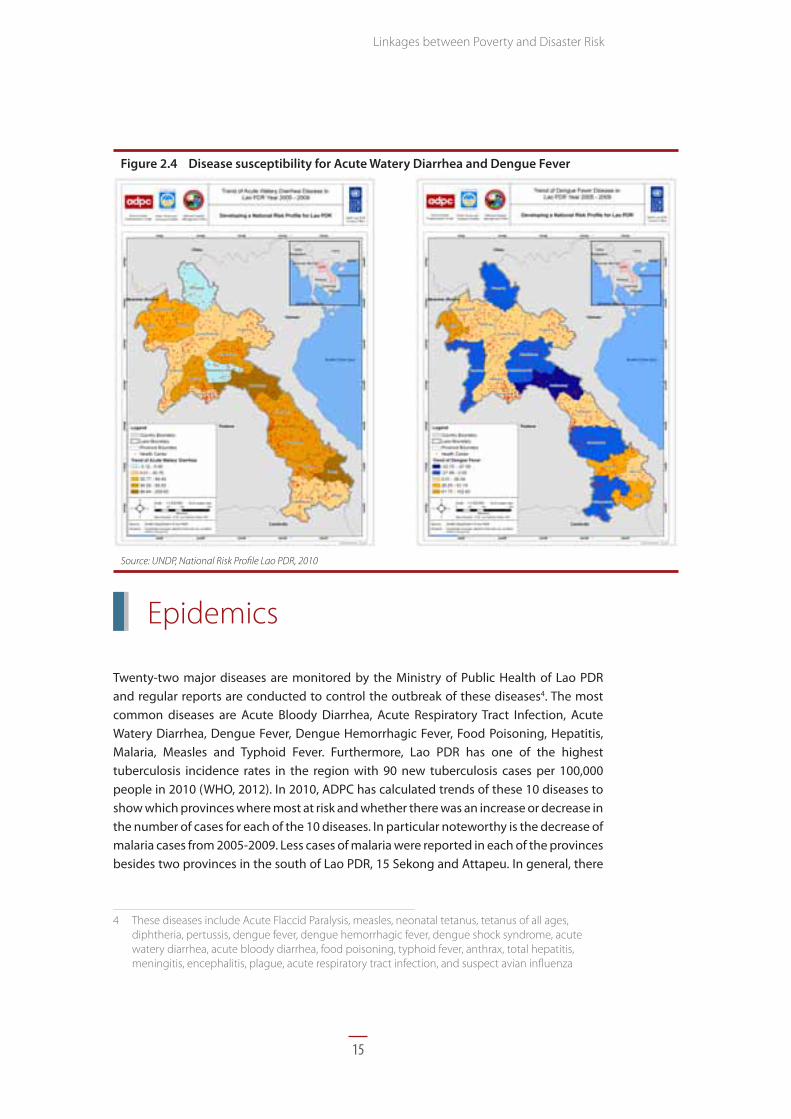
Figure 2.4 Disease susceptibility for Acute Watery Diarrhea and Dengue Fever
Source: UNDP, National Risk Profile Lao PDR, 2010
Epidemics
Twenty-two major diseases are monitored by the Ministry of Public Health of Lao PDR and regular reports are conducted to control the outbreak of these diseases4. The most common diseases are Acute Bloody Diarrhea, Acute Respiratory Tract Infection, Acute Watery Diarrhea, Dengue Fever, Dengue Hemorrhagic Fever, Food Poisoning, Hepatitis, Malaria, Measles and Typhoid Fever. Furthermore, Lao PDR has one of the highest tuberculosis incidence rates in the region with 90 new tuberculosis cases per 100,000 people in 2010 (WHO, 2012). In 2010, ADPC has calculated trends of these 10 diseases to show which provinces where most at risk and whether there was an increase or decrease in the number of cases for each of the 10 diseases. In particular noteworthy is the decrease of malaria cases from 2005-2009. Less cases of malaria were reported in each of the provinces besides two provinces in the south of Lao PDR, 15 Sekong and Attapeu. In general, there
4 These diseases include Acute Flaccid Paralysis, measles, neonatal tetanus, tetanus of all ages, diphtheria, pertussis, dengue fever, dengue hemorrhagic fever, dengue shock syndrome, acute watery diarrhea, acute bloody diarrhea, food poisoning, typhoid fever, anthrax, total hepatitis, meningitis, encephalitis, plague, acute respiratory tract infection, and suspect avian influenza

Lao PDR National Assessment Report on Disaster Risk Reduction
16
are several diseases, amongst them dengue fever, which have a decreasing overall trend in the country (UNDP, 2010).
Unexploded Ordinances
Several districts of Khammuane and Savannakhet province have a very high density of UXOs ranging from 2 – 4 UXOs per square kilometer. Several other districts in Huaphanh, Xiengkhuang, Saravane, 15 Sekong and Attapeu were also identified as areas with a high density of UXOs.
Drought
Due to the limited availability of data, only climatological data from 1993 to 2008 was considered for the drought assessment. SPI was used for drought
analysis at different time scales. It was found that droughts of all categories occur in Lao PDR in all four durations. Moderate drought frequently occurs in all the durations but severe and extreme droughts are less common; except for severe drought in the dry season which has occurred many times. Drought was relatively more frequent in the first and third 5-year periods of analysis, with a lull in between. Probability of occurrence of drought of any category is found to be highest (27%) in Phalan in the dry season. It is also found to be high (25-27%) in Phiengluang. It should be noted that both the stations contain only about one decade of data and as a result of this lack of data availability amongst stations, it was difficult to make conclusive statements on drought-prone areas. In Lao PDR, southern parts of the central region, northern parts of the central region and southern parts of the northern region appear as drought susceptible areas in both dry and wet seasons.
A study conducted by the World Food Programme reveals that about 46 % of the rural population is vulnerable to drought. Most households vulnerable to drought live in the provinces of Khammouane, Savannakhet, Vientiane, Saravanh, Champasack and Sayaboury (WFP, 2006).
Figure 2.5 Distribution of UXOs in Lao PDR
Source: UNDP, National Risk Profile Lao PDR, 2010

Linkages between Poverty and Disaster Risk
17
Figure 2.6 Severe drought susceptibility map
Source: UNDP, National Risk Profile Lao PDR, 2010

Lao PDR National Assessment Report on Disaster Risk Reduction
18
Storm
Storm hazard assessments were carried out for four storm return periods (10, 20, 30 and 50 years). The assessment analyzed areas covered in various provinces with regards to storms. Findings show that the Khammuane province is the most vulnerable province in the country. For 50 years return period, a class 3 (178 – 209 km/hr) storm is expected to hit parts of Khammuane province. Refer to Figure 2.7 for more details. The hazard assessment was based on the collection of relevant authentic data from various focal departments and agencies. For assessment purposes, well established technical methodologies were used and further validated by the focal departments.
Figure 2.7 Storm distribution in Lao PDR for different return period from 1979 to 2009
Source: UNDP, National Risk Profile Lao PDR, 2010

Linkages between Poverty and Disaster Risk
19
chapter 3Initial Analysis
of Disasters in Lao PDR using DesInventar

Lao PDR National Assessment Report on Disaster Risk Reduction
20
Introduction
The DesInventar database was originally developed in Latin America by the LA RED network in 1994. It is a computer-based information management system that helps with the “systematic collection, documentation and analysis of data about losses caused by disasters associated to natural hazards” (DesInventar, n.d.). Therefore, it can be used to analyze disaster trends as well as disaster impacts leading to better-informed prevention, mitigation and preparedness measures. Lao PDR started to implement the DesInventar in 2010/2011 with organizational support of the Asian Disaster Preparedness Center (ADPC) and monetary support of the United Nations Office for Project Services (UNOPS). The database is currently updated and the goal is to include disaster data from 1970 until now. While the database is still in its developing phase, the data needs to be analyzed with caution. Some provinces did not gather as much information as others which could give the expressions that some of the provinces/districts experienced less disaster than others, even though that is not the case in reality. The Government of Lao PDR and especially the National Disaster Management Office of Lao PDR will continue their work on the DesInventar in the coming years to ensure that the database can be used as a reliable information tool in the near future.
Natural hazards are classified in this analysis in five different groups: Biological hazards (caused by the exposure of living organisms to germs and toxic substances), climatological hazards (caused by long-lived/meso to macro scale processes), geophysical hazards (events originating from solid earth), hydrological hazards (events caused by deviations in the normal water cycle and/or overflow of bodies of water caused by wind set-up) and meteorological hazards (events caused by short-lived/small to meso scale atmospheric processes). In addition, a group of man-made hazards has been included in the analysis to ensure that hazards such as UXO are accounted for as well.
Linkages between Poverty and Disaster Risk
21
The DesInventar database of Lao PDR includes currently information about the following hazards: epidemics, plagues, fires, forest fires, floods, flash floods, storms, thunderstorms, windstorms, rains, cold waves and droughts and etc. For the initial analysis, these available hazards have been allocated to the different hazard groups. Unfortunately, there is not yet information available about earthquakes and landslides in the DesInventar database, which means that the impact of geophysical hazards on Lao PDR could not be studied more thoroughly.
Overall Disaster Analysis
The overall analysis is based on Lao PDR as a whole without differentiating between the different geographical units. This analysis will be based on the real data existed within DesInventar database at the moment. As can be seen in Table 3.1, fires are the most frequently reported disaster on a national level. Epidemics caused the death of the highest number of people in total; however, accidents are reported as deadliest incident in the case of Lao PDR. In agreement with other available analyses is that floods affected the highest number of people in total and floods are also associated with the highest overall costs in the last years as well as the highest costs per event.
Table 3.1 Hazard Profile of Lao PDR
# of Events Killed Total Affected Losses in Kip
Biological Epidemic 90 186 8.080 2,083,209,750
Plague 59 - 199,805 3,110,414,000
Climatological Forest Fire 12 - 677 687,086,000
Cold Wave 9 - 670 224,150,000
Drought 150 - 487,763 25,748,505,640
Hydro-Meteorological
Flood 1,205 113 3,496,846 4,111,115,514,955
Flash Flood 32 2 2,269 21,496,081,010
Rain 60 2 2,625 113,769,056,300
Storm 693 38 550,415 2,495,688,775,878
Thunderstorm 10 1 248 193,553,000
Wind Storm 14 - 3,259 2,119,813,508
Man-Made Fire 1,548 38 44,887 212,771,569,759
Source: DesInventar Data Lao PDR 2012 (1992 – 2012)

Lao PDR National Assessment Report on Disaster Risk Reduction
22
Taking into account the geographical distribution of disaster events in Lao PDR, Xayabury reported a remarkable number of events exceeding 450. Savannakhet and Xiengkhuang
have reported the lowest number of events with less than 150 events in total. Further information about the geographical distribution of disasters can be found in Figure 3.1.
Hazard Risk and Disaster Impact
Biological Hazards
Epidemics
Epidemics are defined as “disease attacking many individuals in a same community during short terms (days, weeks, months
maximum), such as cholera, typhoid, bubonic plague, etc.” (DesInventar, n.d.).
Only 10 out of 17 provinces experienced an epidemic according to DesInventar which means that epidemics are not among the most common hazards in Lao PDR. The district Phongsaly (Phongsaly province) reported the highest number of events; the number of affected people however remained considerably low. Furthermore, only Xayabury reported lost cattle associated with epidemics (170 in total).
Plagues
DesInventar defines plagues as “proliferation of insects or animal pests affecting communities, agriculture, cattle or stored perishable goods; for example, rats, locusts, African bees, etc.” (DesInventar, n.d.).
As can be seen in Table 3.3, According to data existed in DesInventar database, only 11 provinces experienced plagues in the last 15 years. Plagues are associated with high number of affected and also with high damages in crops.
Figure 3.1 Distribution of hazard events in Lao PDR
Source: DesInventar Data Lao PDR 2012 (1992 – 2012)

Linkages between Poverty and Disaster Risk
23
Comparison of the two biological hazards
Biological hazards are not among the most common hazards in Lao PDR. Only 13 provinces of Lao PDR reported any biological hazards and most reported only occasional events. With regard to epidemics, the district Phongsaly (Phongsaly province) reported a very high
Table 3.2 Impacts of Epidemics on Lao PDR
Province No of Events Deaths ffected Lost Cattle Losses in Kip
01 Vientiane Mun. 3 0 0 0 461,435,000
02 Phongsaly 12 3 2,576 0 3,958,000
03 Luangnamtha 4 0 0 0 83,384,550
04 Oudomxay 4 0 0 0 6,000,000
07 Huaphanh 1 0 0 0 0
08 Xayabury 26 164 1,098 170 1,292,570,000
14 Saravane 17 0 75 0 0
15 Sekong 4 7 1,133 0 235,862,200
16 Champasack 19 12 3,198 0 0
Total 90 186 8,080 170 2,083,209,750
Source: DesInventar Data 2012 (1992-2011)
Table 3.3 Impact of Plagues on the different Provinces
Province No of Events Affected Lost Cattle Damages in crops Ha.
Losses in Kip
02 Phongsaly 4 7,758 0 264 870,478,000
03 Luangnamtha 2 4,508 0 0 0
04 Oudomxay 8 111,201 0 17,380 0
05 Bokeo 1 6,350 0 0 0
06 Luang Prabang 5 13,819 0 0 0
07 Huaphanh 16 27,343 0 890 5,940,000
08 Xayabury 8 18,830 0 4,144 727,236,000
09 Xiengkhuang 7 2,908 0 1,616 0
11 Borikhamxay 1 0 0 106 1,000,560,000
14 Saravane 4 0 0 0 0
15 Sekong 3 7,088 0 582 506,200,000
Total 59 199,805 0 24,982 3,110,414,000
Source: DesInventar Data 2012 (1997 – 2012)

Lao PDR National Assessment Report on Disaster Risk Reduction
24
Figure 3.2 Overview of Events in the Different Provinces
Source: Own analysis based on DesInventar Data 2012
Figure 3.3 Distribution of Biological Hazard Events in Lao PDR
Source: DesInventar Data 2012
number of events. However, the number of affected people remained considerably low. In comparison to that, plagues affect a high number of people (98.2% of the total number of affected people by biological hazards). Surprisingly, no lost cattle have been reported in association with plagues; however, Xayabury reported 170 lost cattle associated with epidemics. According to the DesInventar data, Xayabury is most prone to biological hazards, mostly caused by the high number of reported epidemics in that province. Please refer to Figure 3.2 for a more detailed overview of biological hazard events. This graph shows that most provinces experienced epidemics as well as plagues, and most provinces experienced more epidemics than plagues.
Table 3.4 shows that plagues did not cause a single death but they did affect significantly more people than epidemics. Furthermore, economic losses are higher for plagues which could be related to the huge damage in crops caused by plagues.
Climatological Hazards
Cold Wave
Cold waves are defined as a “drop of atmospheric average temperature well above the averages of a region, with effects on human populations, crops, properties and services” (DesInventar, n.d.).
Since the climate change in the world, some years in Lao PDR was cooler than usual, but the cold wave data are not well documented. Under DesInventar only two provinces (Xayabury and Attapeu)

Linkages between Poverty and Disaster Risk
25
reported cold waves and in general, cold waves are not associated with severe impacts. As can be seen in Table 3.5, there were only 9 events reported in total, and these events were not associated with a high number of affected or high losses. Furthermore, more than half of all events were reported by a single district, Phiang in Xayabury, as can be seen in Figure 3.4, indicating that cold waves are not a major hazard for Lao PDR on a national level.
Drought
Drought is “unusually dry seasons, without rain or with rain deficit and as a whole, these are long periods (months, years, and even decades) typical in limited continental areas or on regional scales” (DesInventar, n.d.).
Particularly all parts of Lao PDR has experienced with drought, due to the data collection from some provinces have some limitations. The DesInventar database shows that most of the provinces reported drought events. However, only Vientiane and Savannakhet did not report a single event, but it doesn’t mean there are not drought events. Figure 3.5 presents that Huaphanh and Phongsaly were most prone to droughts compare to other provinces reported. However, the total number of droughts is still considerably low compared to other hazards.
Forest fire
Forest fires include all open-air fires in rural areas, natural and artificial forests, plains or similar. In general, forest fires are no frequent hazard in Lao PDR. Only 6 provinces reported any forest fires and besides in district Xai (Oudomxay province) all districts only reported single events. The worst incident was the forest fire in Phongsaly (Samphan district) on 26 September 2009 where 204 people got injured and additional 400 got affected.
Figure 3.4 Number of Events in the Different Districts
Source: DesInventar Data 2012 (2001-2011)
Figure 3.5 Number of Drought Events Experienced by the Different Provinces
Source: DesInventar 2012 (1996 – 2012)

Lao PDR National Assessment Report on Disaster Risk Reduction
26
Table 3.4 Comparison between Epidemics and Plagues
Event No of Events Deaths Affected Lost Cattle Damages in crops Ha.
Losses in Kip
Epidemic 90 186 8,080 170 0 2,083,209,750
Plague 59 0 199,805 0 24,983 3,110,414,000
Total 149 186 207,885 170 24,983 5,193,623,750
Source: DesInventar Data 2012
Table 3.5 Overview of Impacts of Cold Waves on the Provinces in Lao PDR
Province No of Events Affected Deaths Lost Cattle Losses in Kip
08 Xayabury 5 265 0 0 10,000,000
17 Attapeu 4 405 0 0 214,150,000
Total 9 670 0 0 224,150,000
Source: DesInventar Data 2012 (2001-2011)
Table 3.6 Overview of the Impact of Droughts on the Different Province
Province No of Events Affected Damages in crops Ha. Losses in Kip
01 Vientiane Mun. 6 1,255 0 0
02 Phongsaly 18 27,053 1,232 697,470
03 Luangnamtha 1 3,131 0 0
04 Oudomxay 8 30,460 566 0
05 Bokeo 3 0 2,048 0
06 Luang Prabang 12 25,634 0 418,500,000
07 Huaphanh 29 79,131 2,878 120,000,000
08 Xayabury 10 1,745 1,628 735,360,170
09 Xiengkhuang 10 19,639 11,324 10,541,180,000
11 Borikhamxay 2 881 620 0
12 Khammuane 3 0 2,227 297,200,000
14 Saravane 13 5,840 675,847 0
15 Sekong 6 23,386 72 6,336,103,000
16 Champasack 14 265,537 37,818 6,252,810,000
17 Attapeu 15 4,071 0 104,655,000
Total 150 502,751 736,260 25,748,505,640
Source: DesInventar 2012 (1996 – 2012)

Linkages between Poverty and Disaster Risk
27
Table 3.7 Impact of Forest Fire on the Different Districts
Province District No of Events
Affected Houses Damaged
Damaged Crops in Ha
Losses in Kip
01 Vientiane Mun.
Sangthong 1 0 0 260 0
02 Phongsaly Samphan 1 675 0 0 0
04 Oudomxay
Beng 1 0 0 0 0
Nga 1 0 0 0 0
Xai 3 0 0 0 0
06 Luang Prabang
Louangphrabang 1 0 0 0 38,971,000
Pak-Ou 1 0 0 0 88,840,000
08 Xayabury Xaignabouri 1 0 0 0 529,930,000
Xaisathen 1 0 0 0 26,000,000
11 Borikhamxay
Borikhan 1 2 1 0 3,345,000
Total 13 677 1 260 687,086,000
Source: DesInventar 2012 (2000 – 2010)
Conclusion Climatological Hazards
In conclusion, it can be said that droughts are by far the most frequently reported climatological hazard in Lao PDR (86.9% of the reported climatological hazards). Droughts have also the most serious consequences a single drought event affects more people, destroys and damages more houses as well as crops and roads, and results in the highest losses compared to a single forest fire or a single cold wave (refer to Table 3.8 for more detailed information). As can be seen in the Figure 3.6 underneath, most provinces are not affected by forest fires and/or cold waves but nearly all of the 17 provinces are affected by
Table 3.8 Comparison of the Impact of the Different Climatological Hazards
Event No of Events
Affected Death Houses Destroyed
Houses Damaged
Damaged Crops
Losses in Kip
Forest Fire
12 677 0 0 1 130 687,086,000
Cold Wave
9 670 0 32 0 0 224,150,000
Drought 150 487,763 0 6,074 69 736,261 25,748,505,640
Total 171 489,110 0 6,106 70 736,391 26,659,741,640
Source: DesInventar 2012

Lao PDR National Assessment Report on Disaster Risk Reduction
28
Figure 3.6 Overview of the number of different climatological events per province
Source: DesInventar 2012
Figure 3.8 Overview of Number of Flood Events per Province
Source: DesInventar 2012 (1994 – 2012)
Figure 3.7 Distribution of climatological hazards in Lao PDR
Source: DesInventar 2012
Figure 3.9 Most affected districts (more than 15 reported flood events)
Source: DesInventar 2012 (1994 – 2012)

Linkages between Poverty and Disaster Risk
29
droughts (no data for Vientiane and Savannakhet). Luangnamtha has a very low number of reported climatological hazards.
Hydro-Meteorological Hazards
Flood
As mentioned in the introduction of this chapter, floods are the most frequently experienced natural hazards in Lao PDR. Based on the data available on DesInventar database it can be concluded, that floods are the most detailed documented hazards in Lao PDR. Floods affected a very high number of people (nearly 3.5 million people have been reported to be affected by floods). Floods are also associated with high numbers of damaged and destroyed houses, stressing the high impact floods have on Lao PDR. The provinces mostly affected by flood are located in central and southern part of Lao PDR such as Vientiane Capital, Vientiane province, Borikhamxay, Khammuane, Savannakhet, Saravane, Champasack, Sekong and Attapeu provinces.
A DesInventar data analysis focusing on the most affected districts (more than 15 flood events) showed that the most affect district is Xai (Oudomxay province) with 30 reported events. However, the impact of these flood events was less severe than in other districts with considerably less events.
Figure 3.10 Distribution of flood events in Lao PDR
Source: DesInventar 2012 (1994 – 2012)

Lao PDR National Assessment Report on Disaster Risk Reduction
30
Flash Floods
Flash floods are relatively common in the province located in the northern part of Lao PDR: Phongsaly, Oudomxay, Luangnamtha, Bokeo, Xayabury, Luang Prabang, Huaphanh and Xiengkhuang (DMH, 2012). According to DesInventar, Flash floods were only reported in Bokeo, Huaphanh, Luang Prabang, Phongsaly, Vientiane, Xayabury and Xiengkhuang. However, even though flash floods are not a frequent disaster, they still affect a huge amount of people. There impact on houses and crops, however, is less severe. When analyzing the impact of floods on the different districts, Thathom district in Xiengkhuang and Vangvieng in Vientiane are indentified as the districts with the highest number of events (4 each). Due to a lack of information reported from Luangnamtha and Oudomxay, these two provinces are not included in table 3.10.
Table 3.9a Overview of the Impact of Floods on Lao PDR
Province No of Events
Affected Deaths Houses Destroyed
Houses Damaged
Losses in Kip
01 Vientiane Mun. 126 347,549 12 145 13,203 2,303,468,583,001
02 Phongsaly 44 55,846 1 30 108 542,809,351,700
03 Luangnamtha 40 60,725 0 1,369 13 17,394,266,400
04 Oudomxay 89 82,007 2 119 656 86,227,761,020
05Bokeo 44 42,651 0 11 106 40,382,531,930
06 Luang Prabang 95 23,327 11 38 112 11,625,514,400
07 Huaphanh 57 350,944 6 28 4,581 4,549,943,990
08 Xayabury 120 35,656 33 1,776 1,286 140,864,951,548
09 Xiengkhuang 45 3,538 6 94 1 7,990,152,000
10 Vientiane 50 75,948 4 92 4,256 2,622,337,860
11 Borikhamxay 76 332,410 5 10,688 796 51,132,082,097
12 Khammuane 126 1,089,765 5 0 1,906 56,241,239,624
13 Savannakhet 67 366,842 4 39 24,165 3,624,720,000
14 Saravane 47 190,917 2 176 78 1,148,560,844
15 Sekong 26 27,224 18 766 4,049 637,776,280,981
16 Champasack 120 338,351 4 16 385 202,024,213,560
17 Attapeu 33 73,146 0 69 222 1,233,024,000
Total 1,205 3,496,846 115 15,456 55,923 4,111,115,514,955
Table 3.9 Overview of the Impact of Floods on Lao PDR

Linkages between Poverty and Disaster Risk
31
Table 3.10 Impact of Flash Floods on the Different Provinces
Province No of Events
Affected Death Houses Destroyed
Houses Damaged
Damaged Crops Ha.
Losses in Kip
02 Phongsaly 7 647 0 0 0 641 14,942,490,000
05 Bokeo 1 92 0 0 0 0 125,084,000
06 Luang Prabang 4 60 0 9 0 0 826,012,500
07 Huaphanh 2 627 0 0 0 0,30 70,000,000
08 Xayabury 5 433 2 11 8 47 178,825,064
09 Xiengkhuang 10 0 0 0 0 142 4,683,449,446
10 Vientiane 3 410 0 0 65 0 670,220,000
Total 32 2.269 2 20 73 830 21,496,081,010
Source: DesInventar Data 2012 (1994 – 2012)
Table 3.9b Overview of the Impact of Floods on Lao PDR (continued)
Province Damages in crops Ha.
Education centers
Hospitals Lost Cattle Damages in roads Mts
01 Vientiane Mun. 479,707.22 0 2 696 18,497
02 Phongsaly 1,009.47 2 0 68 939
03 Luangnamtha 4 0 2 0 182.9
04 Oudomxay 82,519.13 7 0 50 0
05 Bokeo 538.18 0 0 124 0
06 Luang Prabang 20,564.44 0 0 109 28.35
07 Huaphanh 43,718.76 0 0 18 0
08 Xayabury 320,764,383.8 45,000,012 1 142 2,217,549,171
09 Xiengkhuang 1,415.94 2 2 63 0
10 Vientiane 24,285 16 0 276 0
11 Borikhamxay 47,629.831 57 0 457 90.35
12 Khammuane 788,053.99 116 0 8,544 420
13 Savannakhet 28,618.54 0 0 7 33
14 Saravane 32,266.15 66 10 0 0
15 Sekong 397.6 0 0 636 0
16 Champasack 51,052.252 4 0 166 178
17 Attapeu 611.15 0 0 0 0
Total 322,366,775.5 45,000,282 17 11,356 2,217,569.540
Source: DesInventar 2012 (1994 – 2012)

Lao PDR National Assessment Report on Disaster Risk Reduction
32
Table 3.11 Impact of Rain on the Provinces of Lao PDR
Province No of Event Affected Death Houses Destroyed Education Damaged Roads Damaged Crops Losses in Kip
02 Phongsaly 10 0 0 0 3 0 808 21,800,000
03 Luangnamtha 32 0 0 0 0 322 0 1,888,634,300
04 Oudomxay 1 31 2 0 0 0 0 0
06 Luang Prabang 1 11 0 0 0 0 0 22,149,000
07 Huaphanh 1 2,488 0 0 0 0 106 895,310,000
08 Xayabury 2 11 0 1 0 0 0 102,004,700,000
09 Xiengkhuang 7 0 0 0 0 4,000 0 2,172,193,000
10 Vientiane 5 21 0 2 0 0 0 6,751,870,000
15 Sekong 1 63 0 15 0 0 0 12,400,000
Total 60 2,625 6 18 3 4,322 914 113,769,056,300
Source: DesInventar 2012 (1996 – 2011)
Table 3.12 Impact of Storms on the Provinces in Lao PDR
Province No of Events
Affected Death Houses Destroyed
Houses Damaged
Education Hospital Lost Cattle Damaged Crops in Ha. Damaged Roads in Mts.. Losses in Kip
01 Vientiane Mun. 24 1,917 0 1 0 0 0 12 0 0 23,658,021,500
02 Phongsaly 47 2,762 0 36 0 61 0 1 0 318 16,231,999,000
03 Luangnamtha 35 6,307 0 43 0 0 1 0 0 0 2,229,650,500
04 Oudomxay 22 1,824 1 1 0 3 0 0 0 302 4,690,157,000
05 Bokeo 40 13,188 0 614 640 1 0 0 0 0 7,323,652,500
06 Luang Prabang 47 2,752 0 122 70 2 0 0 0 421 22,847,698,000
07 Huaphanh 13 5,470 0 0 7 1 0 0 644 435 5,816,298,270
08 Xayabury 102 5,612 8 137 1,327 108,660,518 1 0 2 0 3,396,547,150
09 Xiengkhuang 38 3,326 16 0 0 1 0 0 0 1,672 104,327,053,220
10 Vientiane 24 305 0 5 0 0 0 0 0 0 95,126,805,000
11 Borikhamxay 45 15,015 0 49 114 0 0 8 312 0 2,123,893,876,432
12 Khammuane 16 123,172 0 28 29,464 3 14 0 0 0 124,603,440
13 Savannakhet 30 111,580 2 102 17,447 0 5 0 0 69 20,155,653,000
14 Saravane 88 62,074 2 327 0 0 0 10,696 262,973 0 7,959,916,622
15 Sekong 43 131,335 4 243 424 38 11 1,169 1,522 10,480 52,195,747,035
16 Champasack 66 63,344 4 142 73 22 0 28 0 0 5,609,648,210
17 Attapeu 13 432 1 19 22 2 0 0 0 0 101,449,000
Total 693 550,415 38 1,869 49,588 108,660,652 32 11,914 265,453 13,697 2,495,688,775,878
Source: DesInventar 2012 (1993 – 2012)

Linkages between Poverty and Disaster Risk
33
Table 3.11 Impact of Rain on the Provinces of Lao PDR
Province No of Event Affected Death Houses Destroyed Education Damaged Roads Damaged Crops Losses in Kip
02 Phongsaly 10 0 0 0 3 0 808 21,800,000
03 Luangnamtha 32 0 0 0 0 322 0 1,888,634,300
04 Oudomxay 1 31 2 0 0 0 0 0
06 Luang Prabang 1 11 0 0 0 0 0 22,149,000
07 Huaphanh 1 2,488 0 0 0 0 106 895,310,000
08 Xayabury 2 11 0 1 0 0 0 102,004,700,000
09 Xiengkhuang 7 0 0 0 0 4,000 0 2,172,193,000
10 Vientiane 5 21 0 2 0 0 0 6,751,870,000
15 Sekong 1 63 0 15 0 0 0 12,400,000
Total 60 2,625 6 18 3 4,322 914 113,769,056,300
Source: DesInventar 2012 (1996 – 2011)
Table 3.12 Impact of Storms on the Provinces in Lao PDR
Province No of Events
Affected Death Houses Destroyed
Houses Damaged
Education Hospital Lost Cattle Damaged Crops in Ha. Damaged Roads in Mts.. Losses in Kip
01 Vientiane Mun. 24 1,917 0 1 0 0 0 12 0 0 23,658,021,500
02 Phongsaly 47 2,762 0 36 0 61 0 1 0 318 16,231,999,000
03 Luangnamtha 35 6,307 0 43 0 0 1 0 0 0 2,229,650,500
04 Oudomxay 22 1,824 1 1 0 3 0 0 0 302 4,690,157,000
05 Bokeo 40 13,188 0 614 640 1 0 0 0 0 7,323,652,500
06 Luang Prabang 47 2,752 0 122 70 2 0 0 0 421 22,847,698,000
07 Huaphanh 13 5,470 0 0 7 1 0 0 644 435 5,816,298,270
08 Xayabury 102 5,612 8 137 1,327 108,660,518 1 0 2 0 3,396,547,150
09 Xiengkhuang 38 3,326 16 0 0 1 0 0 0 1,672 104,327,053,220
10 Vientiane 24 305 0 5 0 0 0 0 0 0 95,126,805,000
11 Borikhamxay 45 15,015 0 49 114 0 0 8 312 0 2,123,893,876,432
12 Khammuane 16 123,172 0 28 29,464 3 14 0 0 0 124,603,440
13 Savannakhet 30 111,580 2 102 17,447 0 5 0 0 69 20,155,653,000
14 Saravane 88 62,074 2 327 0 0 0 10,696 262,973 0 7,959,916,622
15 Sekong 43 131,335 4 243 424 38 11 1,169 1,522 10,480 52,195,747,035
16 Champasack 66 63,344 4 142 73 22 0 28 0 0 5,609,648,210
17 Attapeu 13 432 1 19 22 2 0 0 0 0 101,449,000
Total 693 550,415 38 1,869 49,588 108,660,652 32 11,914 265,453 13,697 2,495,688,775,878
Source: DesInventar 2012 (1993 – 2012)

Lao PDR National Assessment Report on Disaster Risk Reduction
34
Rain
According to DesInventar, rain also belongs to the less frequent experienced disasters. Only half of the provinces in Lao PDR reported any disastrous rain events and more than 50% of all reported rains were experienced in Luangnamtha. However, even though Luangnamtha experienced the highest number of events, the impacts of these events were considerably low (see Table 3.11). Most of the events that have been reported in Luangnamtha can be accounted to the districts Long and Nale which were the worst hit district with 13 and 11 cases respectively. Another surprising finding is the high number of affected people in Huaphanh. Huaphanh reported only a single event, the number of affected however, accounts for more than other provinces reported the event.
Table 3.13 Impact of storms on the most affected districts in Lao PDR (more than 10 events reported)
Province District No of Events
No of Deaths
No of Affected
No of Houses Destroyed
No of Houses Damaged
No of Education Centers Affected
No of Hospitals Affected
No of Lost Cattle
Damaged Road in Mts.
Damages in Crops in Ha.
Losses in Kip
02 Phongsaly Gnot-Ou 20 0 2,097 36 0 38 0 1 0 0 343,760,000
03 Luangnamtha Sing 13 0 1,274 27 0 0 0 0 0 0 692,630,000
05 Bokeo Houayxay 15 0 602 0 158 0 0 0 0 0 1,605,056,500
Pha-Oudom 11 0 8,606 408 278 1 0 0 0 0 4,688,991,500
08 Xayabury Kenthao 17 0 1,446 23 347 4 0 0 0 0 536,317,250
Paklai 13 1 1,060 65 207 0 0 0 0 1.5 584,323,850
Xianghon 13 6 28 20 0 0 0 0 0 0 275,507,500
11 Borikhamxay Pakkading 14 0 3,657 2 0 0 0 0 0 0 2,091,380,000,000
Pakxan 11 0 2,173 9 30 0 0 0 0 0 9,157,932,508
14 Saravane Khongxedon 11 0 11,892 66 0 0 0 1,571 0 16,788 50,660
Lakhonpheng 11 0 1,679 8 0 0 0 0 0 0 835,474,800
Saravan 14 0 17,578 46 0 0 0 520 0 0 167,430,332
Ta-Oy 15 2 5,867 81 0 0 0 3,593 0 114,237 6,932,498,543
Vapi 11 0 7,184 25 0 0 0 2 0 12,024 4,229
15 Sekong Lamam 16 0 60,389 2 298 5 5 1,087 9,800 618.66 14,614,952,478
Thateng 12 0 8,330 161 0 8 0 0 232 0 6,311,658,000
16 Champasack Xanasomboun 11 0 2,439 7 2 2 0 0 0 0 1,354,091,800
Total 228 9 136,301 986 1,320 58 5 6,774 10,032 143,669.16 2,139,480,679,950
Source: DesInventar 2012 (1993 – 2012)

Linkages between Poverty and Disaster Risk
35
Storm /tropical storm (Typhoon)
Storm is defined as “rain accompanied by strong winds and/or electric discharges (lightning)” (DesInventar, n.d.). Tropical storms on the other hand are defined as storm/typhoon which establishes itself in the Pacific Ocean and reaches land. There are on average 2 to 3 tropical storms in Lao PDR per year. However, tropical storms hitting China or Vietnam can cause heavy rainfall in parts of Lao PDR. Furthermore, they can cause floods as well as flash floods and landslides especially in the northern part of Lao. At the end of rainy season in 2009 typhoon Ketsana hit the southern part of Lao PDR causing server damages in 3 provinces in the south, namely Saravane, Sekong and Attapeu (DMH, 2012).
According to DesInventar database, all provinces experienced storms, however not all the provinces experienced a high number of storms within the last 20 years. Storms are associated with a high number of destroyed roads as can be seen in Table 3.12. As can be seen in Table 3.13, several provinces are especially prone to storms.
Table 3.13 Impact of storms on the most affected districts in Lao PDR (more than 10 events reported)
Province District No of Events
No of Deaths
No of Affected
No of Houses Destroyed
No of Houses Damaged
No of Education Centers Affected
No of Hospitals Affected
No of Lost Cattle
Damaged Road in Mts.
Damages in Crops in Ha.
Losses in Kip
02 Phongsaly Gnot-Ou 20 0 2,097 36 0 38 0 1 0 0 343,760,000
03 Luangnamtha Sing 13 0 1,274 27 0 0 0 0 0 0 692,630,000
05 Bokeo Houayxay 15 0 602 0 158 0 0 0 0 0 1,605,056,500
Pha-Oudom 11 0 8,606 408 278 1 0 0 0 0 4,688,991,500
08 Xayabury Kenthao 17 0 1,446 23 347 4 0 0 0 0 536,317,250
Paklai 13 1 1,060 65 207 0 0 0 0 1.5 584,323,850
Xianghon 13 6 28 20 0 0 0 0 0 0 275,507,500
11 Borikhamxay Pakkading 14 0 3,657 2 0 0 0 0 0 0 2,091,380,000,000
Pakxan 11 0 2,173 9 30 0 0 0 0 0 9,157,932,508
14 Saravane Khongxedon 11 0 11,892 66 0 0 0 1,571 0 16,788 50,660
Lakhonpheng 11 0 1,679 8 0 0 0 0 0 0 835,474,800
Saravan 14 0 17,578 46 0 0 0 520 0 0 167,430,332
Ta-Oy 15 2 5,867 81 0 0 0 3,593 0 114,237 6,932,498,543
Vapi 11 0 7,184 25 0 0 0 2 0 12,024 4,229
15 Sekong Lamam 16 0 60,389 2 298 5 5 1,087 9,800 618.66 14,614,952,478
Thateng 12 0 8,330 161 0 8 0 0 232 0 6,311,658,000
16 Champasack Xanasomboun 11 0 2,439 7 2 2 0 0 0 0 1,354,091,800
Total 228 9 136,301 986 1,320 58 5 6,774 10,032 143,669.16 2,139,480,679,950
Source: DesInventar 2012 (1993 – 2012)

Lao PDR National Assessment Report on Disaster Risk Reduction
36
Thunderstorms
Thunderstorms are defined as “occurrence of atmospheric static discharges (lightning) with effects on people, cattle, domestic properties, infrastructure (power networks, for example, causing blackouts), and the environment”. Therefore, thunderstorms are different from “storms”, as thunderstorms are not accompanied by rain and gusty winds. The key differentiator is that damage is caused explicitly by lightning (DesInventar, n.d.).
In Lao PDR, only five different districts reported thunderstorms. The two districts in Sekong have experienced significantly more thunderstorms than all other districts. According to the DesInventar analysis, thunderstorms do not affect a lot of people but they do cause considerably high monetary losses and damaged/destroyed houses.
Table 3.14 Impacts of Thunderstorms on Districts in Lao PDR
Province District No of Events
Affected Death Houses Destroyed
Houses Damaged
Losses in Kip
05 Bokeo PhaOudom 1 30 0 0 0 0
06 Luangprabang Nan 4 60 0 0 0 122.000.000
08 Xayabury Xianghon 1 26 0 0 0 28.913.000
15 Sekong Dakchung 2 6 0 1 1 18.420.000
Thateng 2 126 1 15 15 24.400.000
Total 10 248 1 16 16 193.733.000
Source: DesInventar 2012 (2006-2012)
Wind Storms
Wind storms mostly happen between March to April and at the beginning of rainy season. DesInventar data indicates only 14 districts that reported disastrous wind storms within the last 4 years. However, all events were single events and only Xaisathen (Xayabury province) reported more than a single windstorm. According to the data available, wind storms are associated with considerably high losses.
Figure 3.11 Distribution of storm events in Lao PDR
Source: DesInventar 2012 (1993 – 2012)

Linkages between Poverty and Disaster Risk
37
Table 3.15 Impact of Wind Storms on the Districts in Lao PDR
Province District No of Events
Affected Houses Destroyed
Houses Damaged
Damaged Crops
Lost Cattle
Losses in Kip
01 Vientiane Mun. Pak-Ngum 1 40 0 0 0 0 31,964,000
Sangthong 1 135 0 0 0 0 44,611,000
Sikhottabong 1 5 0 0 0 0 25,000,000
Xaithani 1 0 0 0 0 0 858,125,000
07 Huaphanh Houamuang 1 2,488 0 0 63 3 895,310,000
08 Xayabury Xaisathen 3 129 0 0 0 0 40,680,000
13 Savannakhet Atsaphon 1 0 0 0 0 0 0
Songkhon 1 426 0 73 0 0 175,446,508
Thapangthong 1 0 0 0 0 0 25,400,000
16 Champasack Khong 1 8 0 1 0 0 124,870,000
17 Attapeu Sanxai 1 19 3 0 0 0 3,610,000
Xaisettha 1 9 1 0 0 0 7,180,000
Total 14 3,259 4 74 63 3 2,232,196,508
Source: DesInventar 2012 (2008 -2012)
Conclusion Hydro-Meteorological Hazards
Hydro-meteorological hazards are the most frequent hazards in Lao PDR. Besides, they are associated with severe impacts such as high number of affected people and severe damage to houses and public buildings. The exact data can be found in Table 3.16. Xayabury reported the highest number of hydro-meteorological disaster with 233 events in the last 15 years. Figure 3.13 shows the geographical distribution of hydro-meteorological disasters in Lao PDR. The map indicates that especially the south part of Lao PDR is prone to this kind of disaster as most of the provinces in the south experienced at least 150 events in the last years.
Figure 3.12 Comparison of the number of different hydro-meteorological hazards per province
Source: Own analysis based on DesInventar Data 2012

Lao PDR National Assessment Report on Disaster Risk Reduction
38
Floods are found to be the most frequently reported hydro-meteorological hazards in Lao PDR. Besides, floods affect the highest amount of people and they are also the costliest hydro-meteorological hazard. The hazards with the least severe consequences associated are thunderstorms. Furthermore, only floods and storms are experienced by all 17 provinces; flash floods, thunderstorms, windstorms and rains are only experienced by a few provinces in Lao PDR.
Table 3.16 Impact of Hydro-Meteorological Disaster on the Different Provinces
Province No of Event
No of Deaths
No of Affected
No of Houses Destroyed
No of Houses Damaged
No of Lost Cattle
No of Education Centers Affected
No of Hospitals Affected
Damaged Road in Mts.
Damages in Crops in Ha.
Losses in Kip
01 Vientiane Mun. 154 12 349,646 146 13,203 708 0 2 18,497 479,707 2,328,087,896,001
02 Phongsaly 108 1 59,255 66 108 69 66 0 1,257 2,458 574,005,470,700
03 Luangnamtha 107 0 67,032 1,412 13 0 0 3 505 4 21,512,551,200
04 Oudomxay 112 5 83,862 120 656 50 10 0 302 82,519 90,917,918,020
05 Bokeo 86 0 55,961 625 746 124 1 0 0 538 47,831,268,430
06 Luang Prabang 151 11 26,210 169 182 109 2 0 450 20,564 35,443,373,900
07 Huaphanh 74 6 362,017 28 4,588 21 1 0 435 44,532 12,226,862,260
08 Xayabury 233 43 41,867 1,925 2,621 142 153,660,530 2 2,217,549,171 21,432 246,514,616,763
09 Xiengkhuang 100 22 6,864 94 1 63 3 2 5,672 1,558 119,172,847,666
10 Vientiane 82 4 76,684 99 4,354 276 8 0 0 24,295 105,171,232,860
11 Borikhamxay 121 5 347,425 10,737 910 465 57 0 90 47,942 2,175,025,565,529
12 Khammuane 142 5 1,212,937 28 31,370 8,544 119 14 420 788,054 56,365,843.064
13 Savannakhet 100 6 478,848 141 41,685 7 0 5 102 28,619 23,981,219,508
14 Saravane 135 4 252,991 503 78 10,696 66 10 0 295,239 9,108,477,466
15 Sekong 74 23 158,754 1,040 4,489 1,805 38 11 10,480 1,920 690,026,649,035
16 Champasack 187 8 401,703 158 459 194 26 0 178 51,052 207,646,348,770
17 Attapeu 48 1 73,606 92 244 0 2 0 0 611 1,345,263,000
Total 2014 156 4,055,662 17,383 105,707 23,273 399 49 2,217,587,559 1,891,044 6,744,383,404,172
Source: DesInventar Data 2012
Figure 3.13 Distribution of hydro-meteorological events in Lao PDR
Source: Own analysis based on DesInventar Data 2012
Figure 3.14 Distribution of Fire Events in Lao PDR
Source: DesInventar 2012 (1990 -2012)

Linkages between Poverty and Disaster Risk
39
Man-Made Hazards
Fire
Fires are the most frequently reported hazard followed by floods. Again, all provinces reported incidents of fire with Sekong being the province with the highest number of fires. However, the number of affected people is moderate with on average 30 people being affected by each single fire event.
Table 3.16 Impact of Hydro-Meteorological Disaster on the Different Provinces
Province No of Event
No of Deaths
No of Affected
No of Houses Destroyed
No of Houses Damaged
No of Lost Cattle
No of Education Centers Affected
No of Hospitals Affected
Damaged Road in Mts.
Damages in Crops in Ha.
Losses in Kip
01 Vientiane Mun. 154 12 349,646 146 13,203 708 0 2 18,497 479,707 2,328,087,896,001
02 Phongsaly 108 1 59,255 66 108 69 66 0 1,257 2,458 574,005,470,700
03 Luangnamtha 107 0 67,032 1,412 13 0 0 3 505 4 21,512,551,200
04 Oudomxay 112 5 83,862 120 656 50 10 0 302 82,519 90,917,918,020
05 Bokeo 86 0 55,961 625 746 124 1 0 0 538 47,831,268,430
06 Luang Prabang 151 11 26,210 169 182 109 2 0 450 20,564 35,443,373,900
07 Huaphanh 74 6 362,017 28 4,588 21 1 0 435 44,532 12,226,862,260
08 Xayabury 233 43 41,867 1,925 2,621 142 153,660,530 2 2,217,549,171 21,432 246,514,616,763
09 Xiengkhuang 100 22 6,864 94 1 63 3 2 5,672 1,558 119,172,847,666
10 Vientiane 82 4 76,684 99 4,354 276 8 0 0 24,295 105,171,232,860
11 Borikhamxay 121 5 347,425 10,737 910 465 57 0 90 47,942 2,175,025,565,529
12 Khammuane 142 5 1,212,937 28 31,370 8,544 119 14 420 788,054 56,365,843.064
13 Savannakhet 100 6 478,848 141 41,685 7 0 5 102 28,619 23,981,219,508
14 Saravane 135 4 252,991 503 78 10,696 66 10 0 295,239 9,108,477,466
15 Sekong 74 23 158,754 1,040 4,489 1,805 38 11 10,480 1,920 690,026,649,035
16 Champasack 187 8 401,703 158 459 194 26 0 178 51,052 207,646,348,770
17 Attapeu 48 1 73,606 92 244 0 2 0 0 611 1,345,263,000
Total 2014 156 4,055,662 17,383 105,707 23,273 399 49 2,217,587,559 1,891,044 6,744,383,404,172
Source: DesInventar Data 2012

Lao PDR National Assessment Report on Disaster Risk Reduction
40
Existing National Disaster Management Strategies in Lao PDR
National Disaster Management Plan 2012-2015
The National Disaster Management Plan (2012 – 2015) follows the Hyogo Framework for Action (HFA) as the overall framework to guide the response of stakeholders in addressing the impact of disasters. The document emphasises the importance of strengthening sub-national capacities, particularly at the provincial and community level to fully support the government priority of poverty reduction as elaborated in national development plans and policies. At the national level, the Government has assigned a National Disaster Management Committee, composed of Minister’s and senior representatives of
Table 3.17 Impact of Fires on Lao PDR
Province No of Events Affected Death Houses Destroyed Houses Damaged Educational Centre Hospitals Damaged Crops Losses in Kip
01 Vientiane Mun. 97 1,676 0 1 22 0 0 0 30,593,842,642
02 Phongsaly 22 1,417 0 36 0 2 0 0 7,005,449,000
03 Luangnamtha 48 3,717 1 75 0 0 0 0 21,291,010,237
04 Oudomxay 164 4,497 5 173 95 1 0 0 9,543,521,050
05 Bokeo 218 8,897 5 99 189 3 0 88,794 7,283,573,539
06 Luang Prabang 215 3,721 2 335 36 4 0 0 21,872,235,217
07 Huaphanh 61 3,255 5 22 75 11 0 0 11,819,189,000
08 Xayabury 147 2,044 5 199 150 4 0 0 4,476,424,800
09 Xiengkhuang 33 4,510 10 10 0 0 1 0 1,652,633,000
10 Vientiane 95 671 0 56 0 0 0 0 3,155,342,875
11 Borikhamxay 69 1,214 0 93 2 0 1 0 5,668,948,024
12 Khammuane 11 335 0 6 1 0 0 0 121,374,600
13 Savannakhet 3 167 0 15 6 0 0 0 2,319,664,024
14 Saravane 50 1,314 5 31 0 0 0 76,730 33,980,942,464
15 Sekong 121 4,531 0 252 130 1 0 0 8,106,334,387
16 Champasack 92 1,571 0 19 42 0 0 0 42,760,651,800
17 Attapeu 102 1,350 0 175 4 0 0 0 1,120,433,100
Total 1,548 47,206 37 1,517 742 26 2 165,524 212,771,569,759
Source: DesInventar 2012 (1990 -2012)

Linkages between Poverty and Disaster Risk
41
Government bodies and chaired by the Vice Prime Minister, to institute a framework for disaster risk management. The framework developed by the Government of the Lao PDR is appropriately structured to identify and address the threats of hazards at the village, district, provincial, municipal and national levels of society. The following objectives of the National Disaster Management Plan stress the commitment of Lao PDR to disaster risk reduction:
• Alignthestrategicdirectionofdisastermanagementprogramswithnationalpriorities and international commitments.
• Articulatethevisionandgoalsfordisastermanagement
• Outlinethestrategicdirectionandprioritiestoguidethedesignandimplementationof disaster management policies and programs.
• Createacohesiveandwell-coordinatedprogrammingframeworkincorporatinggovernment, non-government and private sector.
• Ensurethatdisastermanagementhasacomprehensiveandall-hazardsfocuscomprising disaster risk reduction and emergency response.
Table 3.17 Impact of Fires on Lao PDR
Province No of Events Affected Death Houses Destroyed Houses Damaged Educational Centre Hospitals Damaged Crops Losses in Kip
01 Vientiane Mun. 97 1,676 0 1 22 0 0 0 30,593,842,642
02 Phongsaly 22 1,417 0 36 0 2 0 0 7,005,449,000
03 Luangnamtha 48 3,717 1 75 0 0 0 0 21,291,010,237
04 Oudomxay 164 4,497 5 173 95 1 0 0 9,543,521,050
05 Bokeo 218 8,897 5 99 189 3 0 88,794 7,283,573,539
06 Luang Prabang 215 3,721 2 335 36 4 0 0 21,872,235,217
07 Huaphanh 61 3,255 5 22 75 11 0 0 11,819,189,000
08 Xayabury 147 2,044 5 199 150 4 0 0 4,476,424,800
09 Xiengkhuang 33 4,510 10 10 0 0 1 0 1,652,633,000
10 Vientiane 95 671 0 56 0 0 0 0 3,155,342,875
11 Borikhamxay 69 1,214 0 93 2 0 1 0 5,668,948,024
12 Khammuane 11 335 0 6 1 0 0 0 121,374,600
13 Savannakhet 3 167 0 15 6 0 0 0 2,319,664,024
14 Saravane 50 1,314 5 31 0 0 0 76,730 33,980,942,464
15 Sekong 121 4,531 0 252 130 1 0 0 8,106,334,387
16 Champasack 92 1,571 0 19 42 0 0 0 42,760,651,800
17 Attapeu 102 1,350 0 175 4 0 0 0 1,120,433,100
Total 1,548 47,206 37 1,517 742 26 2 165,524 212,771,569,759
Source: DesInventar 2012 (1990 -2012)

Lao PDR National Assessment Report on Disaster Risk Reduction
42
• Illustratetootherministries,NGOs,civilsocietyandtheprivatesectorhowtheirworkcan contribute to the achievements of the strategic goals and government vision on disaster management.
National Adaptation Programme of Action to Climate Change
As mentioned before, Lao PDR is susceptible to the impacts of climate change especially from floods and droughts (severe adverse impacts on livelihoods and in particular, the livelihoods of the poorest and most vulnerable groups with the lowest adaptive capacity). The main objective of the NAPA is therefore to develop a country-driven program to address immediate and urgent needs related to current and projected adverse effects of climate change in key sectors. The key sectors for action identified by Lao PDR are agriculture, forestry, water and water resources, and human health. The NAPA is cross-cutting and includes issues already embedded in national development policies and strategies such as the National Growth Poverty Eradication Strategy (NGPES) as well as the Sixth National Socio-Economic Development Plan (NSEDP) from 2006-2010. The preparation of the NAPA is a significant contribution in terms of successful adaptation to climate change. It has been developed based on the urgent need for adapting to climate change and identifying measures that minimize the adverse impacts of climate change (flood and drought), based on past lessons learnt, the experiences of different sectors of Lao PDR, and an analysis of available technical information.
Example activities under the NAPA are: cooperation projects between the Lao National Mekong Committee, French NGOs and the National Disaster Management Office to prepare for flooding by providing communication equipment, computers and setting up water level measurement gauges at the community level in Champasack District of Champasack Province, projects to minimize risks associated with drought have also been supported by Concern Worldwide and are operating in Khammuane and Savannakhet Provinces; whereas Australian Oxfam is working in Saravane.
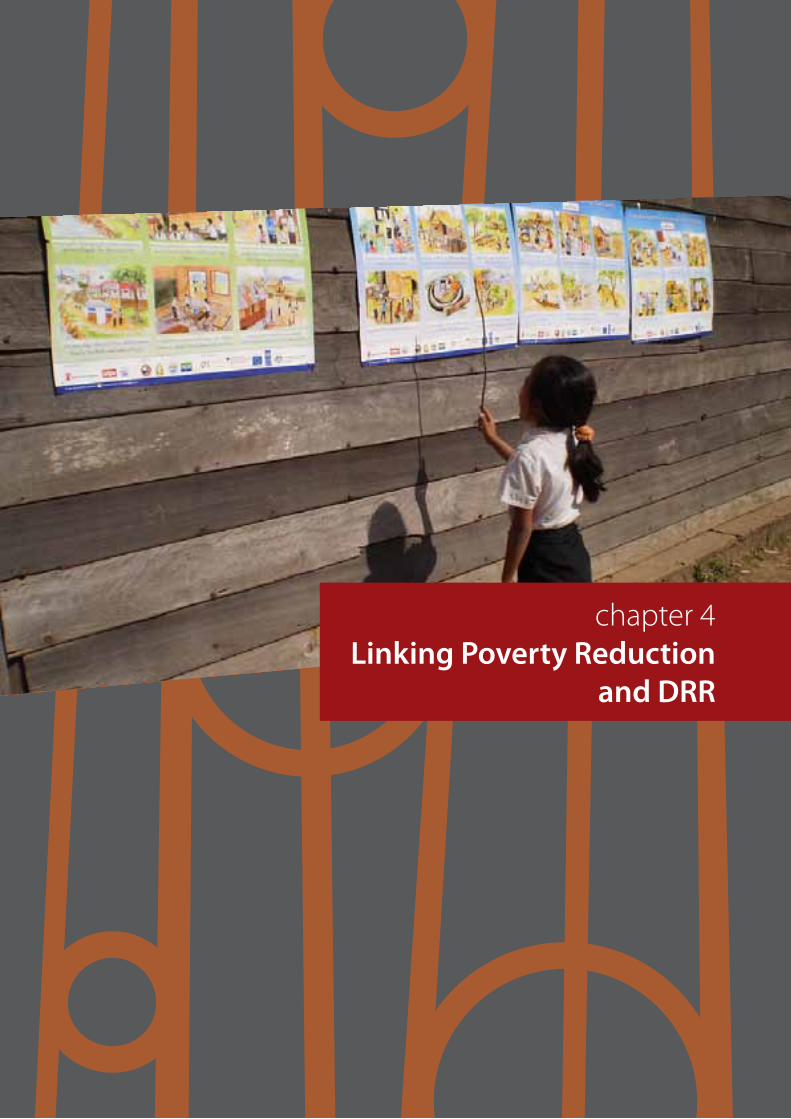
Linkages between Poverty and Disaster Risk
43
chapter 4Linking Poverty Reduction
and DRR

Lao PDR National Assessment Report on Disaster Risk Reduction
44
Introduction
Poverty reduction has been one of the main objectives of development programs in many developing countries for the last several decades. Over the years, the very definition of poverty has evolved from just looking at people’s income to taking a more holistic view of their well-being. This has led to increased emphasis on better integration of poverty reduction programs with other sectoral issues such as environmental management, gender development and public health.
In the recent decades the disaster management sector has also seen a paradigm shift. Disasters are no longer seen as extreme events created entirely by natural forces but as manifestations of unresolved problems of development. Therefore disaster management practices have evolved from largely a top-down relief and response approach to a more inter-sectoral risk management approach.
However, there are not many examples of systematic convergence of the two approaches and long-term integration of poverty reduction programs with disaster management, although there are enough of empirical evidences of the close nexus between disaster and poverty, particularly in the developing countries.
Disasters are not caused by natural hazards only; it is the vulnerabilities of people and their assets that transform hazards into disasters. Poverty is the worst and the generic form of all vulnerabilities. Poor people are often located in unsafe areas, their shelters are generally not constructed with safe designs and materials, and they do not always have the access to early warnings and the means to quickly move to safer place.

Linkages between Poverty and Disaster Risk
45
Therefore it is the poor people everywhere and especially in the developing countries that have always suffered the most in disasters. Successive slow onset disasters like drought create famine like conditions forcing the poor people to migrate in search of new livelihood. Various studies have documented how poor people have been further impoverished by disasters and how poor families rising above the conditions of poverty due to various poverty alleviation initiatives have again sunk below the poverty line after disasters.
While it is clear that the poor are often the most affected in a disaster, it is too simplistic to assume that there is always a direct and absolute correlation between poverty and vulnerability. All the poor may not suffer in disasters nor is it only the poor who suffer; the impact of hazards may well be a factor in creating newly impoverished people. Poverty, as an indicator of lack of access to resources and income opportunities, is only one of the several dimensions of vulnerability; there are also other dimensions such as class, ethnicity, community structure, community decision making processes and political issues that determine poor people’s vulnerability. A poor community may be economically vulnerable but at the same time may have social, cultural and political capacities to cope with disasters, which can be effectively utilized in designing risk reduction programmed for the poor.
Therefore there are no straightforward solutions for reducing the risks of the poor. Multi-dimensional approaches and innovative institutional arrangements are required to mainstream disaster risk reduction for poverty alleviation.
However, the Asia Pacific Disaster Report 2012, which was launched recently, has clearly established a linkage between disaster losses and people who largely pay for these losses. For example, after the 2009 Typhoon Ketsana in Lao PDR, which caused damages of USD 540 million, 55% of the losses were borne by small and marginal farmers. In the Philippines, the same Typhoon caused damages of USD 4.3 billion, and 90% of the losses were borne by poor urban households. In Pakistan, the 2010 floods caused USD 9.7 billion in losses, with 70% borne by poor households, and small and marginal farmers (UNESCAP & UNISDR, 2012).
The question on disaster losses and who pays for them also highlight the issue that economic and social vulnerabilities are closely linked. And disaster impacts are bidirectional in terms of aggravating economic and social vulnerability. It is of concern that as economies falter, it is these very social protection measures that come under threat, and even abolition, as countries are forced to balance budgets and reduce fiscal expenditures, thus increasing further, vulnerabilities to disasters and many other exogenous shocks.

Lao PDR National Assessment Report on Disaster Risk Reduction
46
Table 4.2 Poverty rates in the different regions
Region Area 2002/03 2007/08
Northern Region Total 37.9% 32.5%
Urban areas 30.6% 14.6%
Rural areas 39.1% 36.5%
Xayabury 25% 15.7%
Huaphanh 50.5%
Central Region Total 35.4% 29.8%
Urban areas 20.1% 22.2%
Rural areas 39.0% 33.5%
Borikhamxay 28.7% 21.5%
Khammuane 33.7% 31.4%
Southern region Total 32.6% 22.8%
Urban areas 12.8% 11.3%
Rural areas 35.5% 25.5%
Champasack 18.4% 10%
Sekong 51.8%
Vientiane Municipality Total 16.7% 15.2%
Source: MPI, 2011 - Seventh NSEDP
Table 4.1 Matrix of Poverty, Inequality, Poverty Intensity and Poverty Gaps in Society
Region Average Household Consumption/ month
Poverty Head Count
Poverty Gap Poverty Intensity
Inequality (GINI Index)
2002/ 2003
2007/ 2008
2002/ 2003
2007/ 2008
2002/ 2003
2007/ 2008
2002/ 2003
2007/ 2008
2002/ 2003
2007/ 2008
Lao PDR 1,089.40 2,170.70 33.50 27.60 8.00 6.50 2.80 2.30 32.60 35.40
Urban 1,703.00 2,950.20 19.70 17.40 4.10 3.40 1.30 1.10 34.80 36.30
Rural 854.30 1,826.10 37.70 31.70 9.20 7.70 3.20 2.80 30.30 33.40
North 762.50 1,258.60 37.90 32.50 9.40 7.70 3.30 2.70 30.70 35.20
Central 1,236.70 2,389.10 35.40 29.80 7.10 6.90 2.60 2.50 31.00 34.00
South 909.30 1,948.00 32.60 22.80 7.60 5.60 2.50 2.10 31.40 32.20
Source: LECS 3 & LECS 4

Linkages between Poverty and Disaster Risk
47
Facts and Figures: Poverty in Lao PDR
The most common indicator for monetary poverty is the poverty headcount. Lao PDR experienced a steady decline in the poverty headcount between 1992/93 to 2002/2003 at all levels (national, provincial and regional). Data about ownership also shows that the overall poverty situation in Lao PDR is less severe than several years ago. While in 2002/3 only 1% of the population owned a mobile phone, this number increased to 21% in 2007/08. A similar increased could be found for the ownership of tractors (7% vs. 23%) and ownership of motorbikes (7% in 2002/03 vs. 35% in 2007/08) (MPI, 2004 – LECS 3 & MPI, 2009 – LECS 4).
An additional indicator for monetary poverty is the poverty ratio as well as the poverty gap. The national poverty gap declined from 8% in 2002-2003 to 6.5% in 2007-2008, showing that the overall reduction in poverty did also reduce the depth of poverty in several cases. However, as can be seen in the table underneath, poverty rates as well as poverty intensity vary widely among the different regions.
Poverty figures in Lao PDR are highly related to different aspects such as: region, closeness to borders, altitude, and ethnicity. With regard to the different regions, it has been found that the Northern region has the highest poverty rates (32.5% in 2007/08) compared to Vientiane Municipality with the lowest poverty rates (15.2% in 2007/08).
However, even within the regions huge difference can be found between rural and urban areas. Areas close to the Vietnam border are also more prone to poverty. According to the report on the achievement of the implementation of NSEDP 2006-2010, the poverty rate at the border areas shared with Vietnam is 54.5%, while in the Mekong River border areas the poverty rate is as low as 16.1%. However, even at
Figure 4.1 Percentage of poor in the different provinces
Source: Lao National Leading Committee for Rural Development and Poverty Eradication, 2011

Lao PDR National Assessment Report on Disaster Risk Reduction
48
the eastern border area, poverty rate are lower than in the inland. Another aspect that influences poverty patterns is the altitude. Upland areas have a poverty rate of almost 43%, and make up 39% of the poor, while lowland areas only have a poverty rate of 20.4% (MPI, 2008). Altitude is also closely linked to ethnicity in the Lao PDR context. The Hmong-Lu Mien people who are found in the uplands and high mountains in the north have a considerably high poverty rate of 43.7, while the Lao-Tai people mainly living in the lowlands have a poverty rate of 18.4% (MPI, 2008). However, poverty patterns are not only linked to the different aspects mentioned above (region, altitude, ethnicity) but also depend on the combination of these which makes it difficult to identify populations particular at risk as several aspects plays a role.
Table 4.3 Matrix combining altitude with ethnicity and rural/urban areas
Urban Rural Total
Lao Tai
Non-Lao Tai
Total Lao Tai
Non-Lao Tai
Total Lao Tai
Non-Lao Tai
Total
Lowlands
Poverty headcount (%)
15.85 36.98 17.19 28.42 55.07 33.62 23.83 52.56 28.18
Poverty gap (%) 3.15 6.85 3.38 5.70 15.46 7.61 4.77 14.27 6.12
Poverty severity (%)
0.96 1.83 1.01 1.64 5.83 2.45 1.39 5.27 1.98
Midlands
Poverty headcount (%)
27.29 62.59 37.73 28.11 49.44 36.24 27.96 51.13 36.48
Poverty gap (%) 5.94 16.90 9.18 7.79 13.15 9.83 7.46 13.63 9.73
Poverty severity (%)
1.78 6.17 3.08 3.35 4.60 3.83 3.07 4.80 3.71
Highlands
Poverty headcount (%)
12.78 18.39 14.37 30.27 50.01 45.17 28.33 49.51 43.91
Poverty gap (%) 2.32 2.04 2.24 7.35 12.79 11.45 6.79 12.62 11.08
Poverty severity (%)
0.76 0.47 0.68 2.64 4.52 4.06 2.43 4.46 3.92
Total
Poverty headcount (%)
16.84 43.79 19.58 28.60 51.13 37.71 24.97 50.62 33.56
Poverty gap (%) 3.39 9.83 4.04 6.33 13.50 9.22 5.42 13.24 8.04
Poverty severity (%)
1.03 3.21 1.25 2.10 4.85 3.22 1.77 4.74 2.77
Source: LECS 3

Linkages between Poverty and Disaster Risk
49
State of EducationEducation is very important to reach the MDGs 1 and 2. Furthermore, education and poverty are highly interlinked and should be considered together. Education spending in Lao PDR is among the lowest in the region and account for 11% of the state budget. In 2002, Lao PDR had a relatively low literacy rate (77% for men, 61% for women), however, the quality and quantity of education in Lap PDR has been recently expanded. Especially in rural remote areas new schools have been constructed and schools, vocational training centers and community education center have been repaired and improved. The number of primary schools has for example been increased from 8,192 schools in 2000 to 8,968 schools in 2010 (MPI, 2011 - Seventh NSEDP). At the same time, the enrolment rate could be increased considerably. While the enrolment rate in primary school has been 79% in 2000, it could be increased to 92.7% by 2010.
State of Health and NutritionWith regard to health and nutrition, progress has been made in the last years with regard to several of the indicators. Even though Lao PDR is still below regional average regarding most health indicators, it is likely that this status is going to be changed in the coming years. Life expectancy in Lao PDR is currently 64.7 years and is slightly lower for male than for female (62.7 and 67.7 respectively). Furthermore, a lot of the indicators are also linked to the area studied. When comparing the data for births attended by skilled health personnel, it is obvious that the medical support is less accessible in rural areas. In rural areas skilled personnel have attended only 11% of all births, while the same figure is 68% in urban areas (WHO, 2012).
Existing National Disaster Management and Poverty Reduction Policies in Lao PDR
National Growth and Poverty Eradication Strategy (NGPES)
The NGPES is the strategic framework under which all of the Government’s future growth and poverty eradication programmes will be developed and implemented. The strategy is a result of a process that has started in 1996 when the 6th Party Congress defined the long-term development objective as freeing the country from the status of least-developed country (LDC) by 2020. The NGPES is designed to accelerate the positive trend in reducing poverty in the Lao PDR while emphasizing the promotion of sustainable growth, coupled with continuous social progress and equity. Furthermore, the strategy stresses the Lao PDR government’s commitment to sound macroeconomic policies to sustain growth. The three mains of the NGPES are: (i) fostering economic growth with equity; (ii) developing
Lao PDR National Assessment Report on Disaster Risk Reduction
50
and modernizing Lao P.D.R.’s social and economic infrastructure; and (iii) enhancing human resource development (IFM & IDA, 2004).
The Seventh National Socio-Economic Development Plan (2011-2015)
The Seventh National Socio-Economic Development Plan (2011 – 2015) (NSEDP) serves as the means to implement the Resolution of the Ninth Party Congress as well as the Socio-Economic Development Strategy with the goal to transform the country into a modern and industrial society. The NSEDP supports the graduation of Lao PDR from the Least-Developed Country (LDC) status by 2020, and creates opportunities for strengthened regional and international co-operation. Part of the long term goal of the country is the implementation of its policy of national development, achieve economic growth of at least 8% annually, reduce poverty, achieve the Millennium Development Goals by 2015 and construct basic infrastructure for industrialization and modernization in the times to come. The main targets and directions of the Five-Year Social-Economic Development Plan are as follows:
1. Ensure continuation of national economic growth with security, peace and stability, and ensure GDP growth rate of at least 8% annually and GDP per capita to be at least USD 1,700.
2. Achieve the Millennium Development Goals by 2015, and adopt appropriate technology, skills and create favorable conditions for graduating the country from LDC by 2020.
3. Ensure the sustainability of development by emphasizing economic development with, cultural and social progress, preserving natural resources and protecting the environment using DRR and CCA.
4. Ensure political stability, peace and an orderly society.
2010 MDG Acceleration Framework
The 2010 MDG Acceleration Framework builds on the findings and recommendations of the MDG Progress Report, the Mid-term Review of the 6th Plan, as well as consultations with various experts and officials of the Government of Lao PDR. The Framework builds on innovative initiatives and approaches to poverty reduction that has shown proven results internationally and locally and can be scaled up in Lao PDR. In order to reach the MDGs, six priority areas have been identified:
• ExpandingthereachoftheenablinginfrastructureforMDGachievement
• Sustainablepracticesforimprovedfoodsecurityandenvironmentalsustainability
• Universalaccesstobasiceducationandgenderequity
• Women’sequalparticipationandempowerment
• Improvedmaternalandchildhealth
• Safewatersupplyandimprovedsanitationforallruralareasandsmalltowns

Linkages between Poverty and Disaster Risk
51
Poverty and Disaster Linkages in Lao PDR
As pointed out in the introduction of chapter 4, there is various empirical evidence that poverty and disaster risk are influencing each other. In order to be able to estimated the impact of poverty and disaster risk on each other in the context of Lao PDR, an analysis of poverty and disaster data has been carried out. The analysis is based on two different sets of data. On the one hand, disaster data at provincial and district level has been used based on the DesInventar data. The following indicators have been used to define disaster:
I. No of hazard events (total per province and total per district)
II. No of affected people
III. No of deaths
IV. No of affected houses (destroyed and damaged)
V. Damaged Crops in Ha.
VI. Losses in Kip
The poverty data is based on the results of survey on poverty and development (LNLCRDPE, 2011) and the following indicators have been used:
I. province level:
1. Percentage of poor families/villages/districts
2. Percentage of developed families/villages/districts
II. district level:
1. Percentage of poor families/villages/Districts
2. Percentage of developed families/villages/Districts
3. Percentage of villages with no or with primary school more than 1 walking hour away
4. Percentage of villages with no or with health centre more than 2 walking hours away
5. Percentage of villages without access to clean water
6. Percentage of villages without all weather road access
The choice of the indicators for poverty is based on the definition of poverty in Lao PDR (LNLCRDPE, 2009). According to this document individual poverty is based on monthly per capita income regardless gender, age and taking the national currency as the measurement unit with the national average of 192,000 kip/month/person. A household is defined as poor when the household has an average monthly per capita income below

Lao PDR National Assessment Report on Disaster Risk Reduction
52
the individuals’ poverty criteria. Any village that lacks of the following conditions for development is considered a poor village:
• 51%ormoreofthehouseholdswithinthevillageareconsideredaspoor
• noprimaryschool,nextschoolismorethanonewalkinghouraway
• nohealthcarenetsuchasdrugrevolvingfund,drugstore:nearesthealthcentreorhospital is more than two walking hours away
• nocleanwateravailable
• noall-weatherroadaccess
A district is considered as poor when it has more than 51% of poor villages.
Constraints of the AnalysisAs mentioned before, the DesInventar database is still in its development phase. Therefore, some of the provinces and/or districts gathered less data than others which could influence the analysis of linkages between poverty and disaster in the Lao PDR context.
Poverty and Disaster Risk at Province Level
As a first step in analyzing the relationship between poverty and hazards, we look at the correlations among the different hazard impact indicators and poverty indicators using aggregate province level data. The results of the correlation analysis are presented in Table 4.4. As expected are the different poverty indicators (percentage of poor families/villages/district) positively and significantly associated with each other. The same holds for the development indicators (percentage of developed families and villages).
It is found that the number of events if significantly positive related to the percentage of developed villages. There is a possible explanation for this result: Developed villages are probably more likely to report disaster as they have more means to do so. However, that does not necessarily mean that there are actually more disaster events in the developed villages.
A second finding is that the percentage of poor villages is negatively related to all disaster indicators (the more poor districts there are in one province the less disasters have been reported, the lower the number of affected and death and the lower the number of affected houses, the lower the losses and the lower the area of damaged crops). This finding could partly be influenced by the fact that poor districts are probably more rural which means that there are less houses in total and therefore less affected houses. Furthermore, it is likely that poor districts have less things of high value that could be destroyed during a natural hazard which means that they experience lower monetary losses. However, there is no information about social and/or psychological impact of disasters on the different villages included in the analysis. It could be that poor villages are more likely to suffer more/longer from the consequences of a natural hazard, even though the actual losses are less severe for them.

Linkages between Poverty and Disaster Risk
53
The third major finding is that the percentage of developed villages is positively correlated with all disaster indicators besides number of affected and number of houses affected. The higher the percentage of developed villages in each province, the higher the number of events in general, the higher the number of deaths and the higher the number of destroyed crops (significant correlation) and the higher the monetary losses (not significant).
The lack of evidence between poverty indicators and disaster indicators could be caused by the highly aggregate nature of province level data. Disasters seldom affect whole provinces and they also cross province boundaries. A correlation analysis on district level is therefore more relevant.
Poverty and Disaster Risk at District Level
In the district on district level, several additional poverty indicators have been included to make the analysis more relevant. The following indicators have been used as poverty indicators:
1. Percentage of poor families/villages
2. Percentage of developed families/villages
3. Percentage of villages with primary school more than 1 walking hour away
4. Percentage of villages with health centre more than 2 walking hours away
5. Percentage of villages without access to clean water
6. Percentage of villages without all weather road access
As expected, the percentage of poor families/villages is positive correlated with all the other poverty indicators. Districts with a high percentage of poor families/villages are significantly more likely to have a primary school which is more than 1 walking hour away, a health centre which is more than 2 walking hours away, more villages without access to clean water and more villages without an all weather road access. However, when it comes to the linkage between disaster risk and poverty, it was again found that the percentage of poor families/villages is negatively correlated with all disaster indicators which support the idea that less data gathering has been carried out in poorer districts/villages.
Another finding is that villages without primary school have reported significant higher numbers of death and monetary losses and villages without health centre reported significantly higher numbers of death. It could therefore be possible that even though there has not yet been found a direct link between poverty and disaster risk in the context of Lao PDR that poverty does influence the risk of a high disaster impact via other factors such as lack of health centres etc. The data shows that poor villages are less likely to have a health centre or primary schools and less primary schools and health centres are related to higher number of deaths and monetary losses. It could be concluded, that poor villages are therefore more likely to experience these negative effects of disasters.

Lao PDR National Assessment Report on Disaster Risk Reduction
54
Table 4.4 Correlation of poverty and disaster indicators on provincial level
1 2 3 4 5 6 7 8 9 10 11
1. Percentage of Poor Families 1
2. Percentage of Poor Villages ,637** 1
3. Percentage of Poor Districts ,287 ,785** 1
4. Percentage of Developed Families -,744** -,570* -,434 1
5. Percentage of Developed Villages -,472 -,471 -,285 ,657** 1
6. No of Events -,155 -,342 -,121 ,273 ,553* 1
7. No of Affected -,170 -,318 -,320 -,231 -,067 -,225 1
8. No of Deaths -,285 -,359 -,313 ,390 ,624** ,660** -,189 1
9. No of Houses Affected -,164 -,326 -,356 -,096 -,092 -,373 ,666** -,082 1
10. Losses in Kip ,424 -,119 -,285 -,110 ,259 ,010 ,044 -,048 ,098 1
11. Damages in Crops in Ha. -,274 -,355 -,296 ,360 ,638** ,650** -,181 ,992** -,057 -,054 1
** correlation is significant at the 0,01 level (2-tailed)* correlation is significant at the 0,05 level (2-tailed)
Table 4.5 Correlation of poverty and disaster indicators on district level
1 2 3 4 5 6 7 8 9 10 11 12 13 14
1. Percentage of Poor Families 1
2. Percentage of Poor Villages ,882** 1
3. Percentage of developed families -,626** -,595** 1
4. Percentage of Developed Villages -,452** -,494** ,593** 1
5. Next Primary School > 1 walking hour away ,304 ,380* -,299 -,289 1
6. Next Health Center > 2 walking hours away ,377* ,492** -,337* -,265 ,873** 1
7. No clean water available ,458** ,539** -,223* -,154 ,441** ,442** 1
8. No all weather road access ,509** ,712** -,415** -,463** ,392* ,435** ,418** 1
9. No of Events -,099 -,264** ,113 ,168 -,061 -,188 -,097 -,175 1
10. No of Affected -,126 ,035 -,062 -,009 -,010 -,082 ,030 ,066 ,067 1
11. No of Deaths -,076 -,129 ,206* ,204* ,497** ,555** -,031 ,023 ,230** -,067 1
12. No of Houses Affected -,142 -,058 -,118 -,074 -,023 -,129 -,100 -,044 -,102 ,501** -,057 1
13. Losses in Kip -,088 -,009 ,162 ,312** ,501** -,027 ,005 ,007 ,129 ,093 -,022 ,016 1
14. Damages in Crops in Ha. -,047 -,116 ,123 ,043 ,180 ,061 ,069 -,038 ,140 -,046 ,812** -,033 -,017 1
** correlation is significant at the 0,01 level (2-tailed)* correlation is significant at the 0,05 level (2-tailed)

Linkages between Poverty and Disaster Risk
55
Table 4.4 Correlation of poverty and disaster indicators on provincial level
1 2 3 4 5 6 7 8 9 10 11
1. Percentage of Poor Families 1
2. Percentage of Poor Villages ,637** 1
3. Percentage of Poor Districts ,287 ,785** 1
4. Percentage of Developed Families -,744** -,570* -,434 1
5. Percentage of Developed Villages -,472 -,471 -,285 ,657** 1
6. No of Events -,155 -,342 -,121 ,273 ,553* 1
7. No of Affected -,170 -,318 -,320 -,231 -,067 -,225 1
8. No of Deaths -,285 -,359 -,313 ,390 ,624** ,660** -,189 1
9. No of Houses Affected -,164 -,326 -,356 -,096 -,092 -,373 ,666** -,082 1
10. Losses in Kip ,424 -,119 -,285 -,110 ,259 ,010 ,044 -,048 ,098 1
11. Damages in Crops in Ha. -,274 -,355 -,296 ,360 ,638** ,650** -,181 ,992** -,057 -,054 1
** correlation is significant at the 0,01 level (2-tailed)* correlation is significant at the 0,05 level (2-tailed)
Table 4.5 Correlation of poverty and disaster indicators on district level
1 2 3 4 5 6 7 8 9 10 11 12 13 14
1. Percentage of Poor Families 1
2. Percentage of Poor Villages ,882** 1
3. Percentage of developed families -,626** -,595** 1
4. Percentage of Developed Villages -,452** -,494** ,593** 1
5. Next Primary School > 1 walking hour away ,304 ,380* -,299 -,289 1
6. Next Health Center > 2 walking hours away ,377* ,492** -,337* -,265 ,873** 1
7. No clean water available ,458** ,539** -,223* -,154 ,441** ,442** 1
8. No all weather road access ,509** ,712** -,415** -,463** ,392* ,435** ,418** 1
9. No of Events -,099 -,264** ,113 ,168 -,061 -,188 -,097 -,175 1
10. No of Affected -,126 ,035 -,062 -,009 -,010 -,082 ,030 ,066 ,067 1
11. No of Deaths -,076 -,129 ,206* ,204* ,497** ,555** -,031 ,023 ,230** -,067 1
12. No of Houses Affected -,142 -,058 -,118 -,074 -,023 -,129 -,100 -,044 -,102 ,501** -,057 1
13. Losses in Kip -,088 -,009 ,162 ,312** ,501** -,027 ,005 ,007 ,129 ,093 -,022 ,016 1
14. Damages in Crops in Ha. -,047 -,116 ,123 ,043 ,180 ,061 ,069 -,038 ,140 -,046 ,812** -,033 -,017 1
** correlation is significant at the 0,01 level (2-tailed)* correlation is significant at the 0,05 level (2-tailed)

Lao PDR National Assessment Report on Disaster Risk Reduction
56
Disaster Risk Reduction to Support Poverty Reduction in Lao PDR
There is considerable evidence that there is a link between poverty and disaster risk. This linkage has been stressed in several publications of the last years as for example by the UNDP in their report “Reducing Disaster Risk: A Challenge for Development” (2004) and by the DFID in their paper “Reducing the Risk of Disaster – Helping to Achieve Sustainable Poverty Reduction in a Vulnerable World” (2006). However, even though it seems to be clear that there is an interaction between poverty and disaster risk, the exact way of interaction is not yet conclusive. Lao PDR has already recognized the importance of DRR for poverty reduction. The 7th NSEDP is a good example of the commitment of the government of Lao PDR to use disaster risk reduction measures as a means to alleviate poverty. The document stresses the importance of DRR for poverty reduction as can be seen in the following examples taken from the 7th NSEDP.
One of the goals of the NSEDP is to “secure the country from losses due to natural disasters, such as controlling forest fires, drought, flood, erosion of rivers, and denuding of mountains”. Furthermore, it expresses the commitment of the Lao PDR government to DRR activities such as:
• effortwillbemadetotakeprecautionarystepstomitigatetheimpactofcatastrophes like floods, bank erosions, droughts, and fire
• capacityandparticipationofentitiesregardedcentralandactivepointsindisastermanagement will be strengthen
• earlywarningsystemswillbeestablishedandthenumberofmeteorologyandhydrology stations in risk areas will be increased
• disasterriskreductionstrategyandadaptationtoclimatechangewillbeintegratedinto sector development plans
• disastereducationwillbeintegratedintonormalschoolcurriculumandschoolconstruction needs to take into account natural hazard risk
The 7th NSEDP shows that Lao PDR is on a good way to systematically integrate disaster risk reduction into development plans to reach sustainable economic growth. The development of the DesInventar database in Lao PDR is another example of the strong interest of the Lao PDR government to analyze the actual impacts of disasters on Lao PDR in a systematic way.

Linkages between Poverty and Disaster Risk
57
chapter 5Conclusion and
Recommendations

Lao PDR National Assessment Report on Disaster Risk Reduction
58
Over the last 3 decades, the Lao PDR has experienced economic growth resulting amongst other in a poverty reduction. However, disasters have continued to occur in higher frequency and greater magnitude resulting in great losses to human lives, properties, socio-economic gain and the environment. All the disasters are likely to have impacted the growth of socio-economic development, setback the achievements of MDG, and hindered the effort of poverty reduction and livelihood activities. Especially in the case of Lao PDR, this negative effect on the economy is disastrous. The recent 7th Asia-Europe Parliamentary Partnership Meeting (ASEP) held in Vientiane emphasized the importance of integrating disaster risk reduction and disaster management aspects in development and poverty reduction strategies. The ASEP Parliamentarians noted that hundreds of millions of poor people in Asia are extremely vulnerable to natural hazards which pose a risk to development. It is widely accepted among ASEP partners that collaborative action is needed to mitigate the effect of disasters on development efforts. The Lao PDR National Assessment Report (LNAR) for Disaster Risk Reduction is an attempt to create more awareness on the overall disaster risks in the country and the impact of the disaster risk on poverty. The importance of disaster risk reduction for Lao PDR when it comes to economic growth and especially the graduation from LDC status is also stressed by the UNDP. In a recent publication of the UNDP, disaster risk reduction/ disaster risk management is mentioned as an essential step to meet the third criterion for LCD graduation namely the economic vulnerability index (UNDP, 2012).
The recommendations can be divided in two parts. The first set of recommendations deals with the DesInventar database, while the other set of recommendations is more related to the long term development and general issues related to disaster management.
1. Improvement of DesInventar Database. The on-going efforts of Lao PDR to establish a national disaster loss database have been appreciated widely for its ownership by the National Government as well as involvement of provincial authorities. It provides basic data on last 30 years of disasters that help in analyzing disaster trends and help in making investments decision in disaster prevention measures by the national and local governments. The data will also help to perform cost-benefit analysis of disaster risk reduction. However, it is of utmost importance to a) improve the data collection further with regard to disastrous events in the past as well as b) keep the database up-to-date by including data of ongoing events on a regular basis.

Linkages between Poverty and Disaster Risk
59
2. Inclusion of Low Profile Hazards. Attention should be paid to natural hazards that are not yet disastrous. In the last years, several earthquakes have been reported in the north part of Lao PDR in areas that are not yet inhabited by huge amount of people. However, these kinds of natural hazards could be disastrous in the future, and should already be included in the DesInventar database nowadays.
3. Systematic Data Gathering. In addition to the general improvement of the DesInventar database, systematic ways to gather disaster data at district and village level should be put in place. So far, most of the information on village and district level is based on secondary literature. Gathering of first hand information in a timely manner would tremendously improve the quality of the database.
4. Institutional Strengthening for Comprehensive Risk Assessment. The preliminary analysis using the current database shows that the disasters resulting from natural hazards in Lao PDR are characterized by high numbers of affected people as well as severe economic consequences (e.g. high number of houses destroyed; high economic losses in general). Especially for already vulnerable groups, disasters pose therefore a severe risk for development. However, there is a need to improve the existing capacities for comprehensive risk assessment to ensure that data available is analyzed in the right way and can be used to inform policy development.
5. Capacity Building for Probabilistic Risk Assessment. Provincial authorities are using standardized templates for the collection of disaster data. However, especially with regard to probabilistic risk assessment, there is need to institutionalize standardized systems within the key ministries. NDMO is requested to adapt the globally accepted tool called CAPRA which is an information platform to enhance decision-making in risk management across various sectors, such as emergency management, sectoral planning, public investment and the financial sectors. Through the application of probabilistic risk assessment principles to threats like floods, typhoon, earthquakes, tsunamis and landslides, CAPRA allows to measure and compare different types of risks, and to develop sector-specific applications for risk management.
6. Mainstreaming Disaster Risk Reduction into Poverty Reduction Strategies in Lao PDR. The initial analysis of disaster and poverty data in Lao PDR showed that there is a linkage between disaster risk and poverty. About 73% of the Lao population still lives in rural area and the majority of the rural communities rely on agriculture for their livelihoods. These communities are very vulnerable to natural hazards and poverty reduction in these areas is therefore closely linked to disaster risk. Mainstreaming disaster risk reduction into poverty reduction programs and strategies is therefore of utmost importance. Poverty reduction programs and strategies should include risk reduction aspects such as awareness raising, capacity building and local level risk financing.

Lao PDR National Assessment Report on Disaster Risk Reduction
60
AnnexI. Agreement on the Establishment of the TWG
Lao People’s Democratic Republic
Peace Independence Democracy Unity Prosperity.------------------------
Ministry of LSW No. 2090/LSWVientiane Capital, Date 13/7/2012
Decree onEstablishment of
Technical Working Group------------------------
Based on:
• Agreementonapprovaltoimplementtheprojecton“Strengthen Institutional Capacity for Development of Lao National Assessment Report (LAR-2012) on Disaster Risk Reduction in Lao PDR” No. 003626, Dated 13 June 2012.
• AgreementofMinistriesconcernedontheestablishmentofTechnicalWorkingGroup(TWG)
• Workplanontheimplementationoftheproject“Strengthen Institutional Capacity for Development of Lao National Assessment Report (LAR-2012) on Disaster Risk Reduction in Lao PDR”

Linkages between Poverty and Disaster Risk
61
Ministry of Labour and Social Welfare, Vice president of NDPCC Agreed:
Article1: establish Technical Working Group (TWG) to collect disaster data in the whole country and participate in implementation of the “Strengthen Institutional Capacity for Development of Lao National Assessment Report (LAR-2012) on Disaster Risk Reduction in Lao PDR” detail as following:
1. Mr. Sompang Sirisak Office of Ministry of Public Work and Transport
2. Dr. Daovilay Banchongphanith Ministry of Public Health
3. Mr. Intong Bounmany Ministry of Planning and Investment, National Statistical Center, Social Statistic Division
4. Ms. Malaythip Virabouda Center for Statistics and Information, Ministry of Agriculture and Forestry
5. Ms. Souksamay Inthavongsa Ministry of Education and Sport
6. Mr. Southanou Bouthphomvihan Statistic division, MLSW
7. Ms. Vilaykhone Keobounthan Welfare and Development Division, MLSW
8. Ms. Bouasy Thammasack Data Information Unit, NDMO
9. Ms. Vimala Khounthalangsy Data Information Unit, NDMO
10. Mr. Phonesavanh Data Information Unit, NDMO
Article2: TOR of TWG
1. Review, comment and update standard format for data collection
2. Help in improving of disaster data at national and provincial level
3. Facilitation in the process, procedure of data collection to make the data collection format become the standard
4. Help NDMO to assess disaster risk, collect historical data at national and local level and help NDMO to manage and analyze disaster data
5. Coordinate with departments and concerned organizations related to disaster risk assessment and analysis
6. Participate in project implementation especially in consultation meetings, TWG meetings, report the results of assessment and provide necessary guidance in development of LNAR-2012 which is in line with the Global Assessment Report 2013
7. Present results of project implementation to NDPCC
Article3: Agencies, Ministries, departments, sectors, locals and every person who have been assigned have to know and effectively implement this agreement.

Lao PDR National Assessment Report on Disaster Risk Reduction
62
Article4: This agreement becomes effective upon signature.
Ministry of Labour and Social Welfare Vice Chairman of NDPCC
II. List of Participants Attending Data Collection at Provincial Level
No. Names Provinces
1. Ms. Oudaphone Sorsavanh Xiengkhuang
2. Mr. Xeuly Nortoualy Luang Prabang
3. Ms. Somphet Sengdala Oudomxay
4. Mr. Xaykengya Leuangvanna Luangnamtha
5. Mr. Phousy Lathanaphak Bokeo
6. Mr. Thongsavanh Livongkham Phongsaly
7. Mr. Souksavanh Louangyikhammatha Huaphanh
8. Mr. Bouthong Phimmachak Vientiane
9. Mr. Lathanongxay Vongkeo Khammuane
10. Mr. Soulideth Hiembouathong Savannakhet
11. Mr. Lamphone Thammavongkham Champasack
12. Mr. Phayvanh Phanthavong Sekong
13. Mr. Khamsouk Phommatham Saravane
14. Mr. Vikasan Syxanon Attapeu
15. Mr. Isoon Soukvilay Vientiane Capital
16. Mr. Kethsakoun Souksamlai Borikhamxay

Linkages between Poverty and Disaster Risk
63
III. List of Participants Engaged in the Revision of LNAR-2012
1. Dr. Daravone Kittiphanh Ministry of Education and Sport
2. Mr. Fongsamout Khamvalvongsa Ministry of Planning and Investment
3. Mr. Vanhdy Doungmala Department of Meteorology- Hydrology, MONRE
4. Mr. Phosavanh Thammavongxay Department of Social Welfare, MLSW
5. Mr. Viengxay Xayxanaphone Ministry of National Defense
6. Mr. Sengphaangkhane MONRE
7. Mr. Souphandone Voravong MONRE
8. Mr. Somphanh Vithaya Department of Meteorology and Hydrology, Ministry of Natural Resources and Environment
9. Mr. Kalakoth Vongsouthi Ministry of Agriculture and Forestry
10. Mr. Kaisone Thanthathep Department of Meteorology- Hydrology, MONRE
11. Mr. Bounyong Phommachak LRC
12. Ms. Toumkham Kanlaya Ministry of Education and Sport
13. Mr. Phetvixay Kaseumsouk Department of Industry , Ministry of Industry and Commerce
14. Mr. Oudom Vanthanouvong Lao National Radio, Ministry of Information and Culture and Tourism
15. Mr. Chanthavong Mass Media, Ministry of Information, Culture and Tourism
16. Mr. Bandith Soulayakham DOT, MPWT
17. Mr. Soulisack Simmanotai Department of Fire Prevention and Protection Police, Ministry of Public Security
IV. Team for Data Entry and DesInventar Database Updating
1. Ms. Bouasy Thammasack Data Information Unit, NDMO
2. Ms. Vimala Khounthalangsy Data Information Unit, NDMO
3. Mr. Phonesavanh Xaysompheng Data Information Unit, NDMO
4. Ms. Thitiphon Sinsupan ADPC
5. Ms. Somvath Keokhamphoui ADPC V. Team for Report Writing
1. Mr. Aslam Perwaiz ADPC
2. Mr. Thanongdeth Insixiengmai ADPC
3. Ms. Thitiphon Sinsupan ADPC
4. Ms. Somvath Keokhamphoui ADPC
5. Ms. Mareike Bentfeld ADPC

Lead Agency Technical Support