lao pdr expenditure and consumption survey (2002/03 … · 2002/3 and 2007/8 lao pdr expenditure...
TRANSCRIPT

Committee for Planning and Investment - Lao Statistics Bureau
FOOD SECURITY IN LAO PDR: A TREND ANALYSIS
LAO PDR EXPENDITURE AND CONSUMPTION SURVEY (2002/03 AND 2007/08 LECS)
VIENTIANE March 2012

This report has been produced with financial assistance from the European Union. The contents of this publication are the sole responsibility of the authors and can in no way be taken to reflect the views of the
European Union or of the Food and Agriculture Organization of the United Nations

= i =
Foreword
It is recognized by policymakers around the world that food security is most directly experienced by individuals at the household level. As a reflection of the importance of food security as a policy priority, the Lao People’s Democratic Republic continues to strive to meet the Millennium Development Goals by 2015, and graduate from Least Developed Country status by 2020. Attaining both of these goals will require progress on food security. With these goals in mind, it is with great pleasure that we present this report on food security trends in Lao People’s Democratic Republic, based on food consumption data from the 2002/3 and 2007/8 Lao Expenditure and Consumption Surveys (LECS). This represents the second such report produced by the Lao Statistics Bureau (LSB) with the collaboration of the Food and Agriculture Organization of the United Nations (FAO), and builds on the work begun in 2007 with the publication of the first Food Insecurity Assessment. This report highlights key food insecurity patterns and trends in terms of food expenditure and consumption patterns, and a host of other measures at both the national levels and sub-national levels by geographic and socio-economic factors. With more than 8,000 households in 518 villages nationwide involved, the Lao Expenditure and Consumption Survey is a key source of information for both government and its development partners alike. The datasets developed by the LECS provided our multi-agency Government of Lao PDR/FAO analytical team with extensive information pertinent to food security. This report represents the culmination of a collaborative process involving the LSB of the Ministry of Planning and Investment (MPI), the Ministry of Agriculture and Forestry (MAF), the Ministry of Industry and Commerce (MoIC), the Ministry of Health (MoH), the National Economics Research Institute (NERI), the UN World Food Programme (WFP) and FAO. We are grateful to the European Union and the regional EC-FAO Food Security Programme on Linking Information and Decision-Making to Improve Food Security, which provided the funding and technical support to undertake the analysis and report preparation in February 2012. We acknowledge additional technical support from the Thailand National Statistics Office. We welcome feedback on this report, which will no doubt serve to improve future planning and decision-making processes. Our sincere thanks to all who supported and participated in developing this report. Director General Lao Statistics Bureau Vientiane

= ii =
Acknowledgements
Special thanks are due to the Director General, Dr. Samaychanh Boupha and the Deputy Director, Ms. Phetsamone Sone of the Lao Statistics Bureau for their full support to this food security analysis activity, and to all the individuals who contributed to the development of this report. Using a collaborative approach, participants approached the work with a high degree of interest and commitment throughout the process. Thanks are due to the technical team, namely Vilaysook Sisoulath (LSB), as well as Vanpheng Phengsavath, Pangkham Thikeo, Souphaphone Sysavath, Chanthapany Mahathilath from LSB, Vivanh Souvannamethy, Hairkham Sisuvan and Xaybandith Thadavong from MAF, Sailomyenh Pheuysithiphone from NERI, Dr. Bounthom Phengdy from MoH, and Vilon Viphongxay from WFP. From FAO, the process was facilitated by Seeva Ramasawmy and Jannie Armstrong, supported by Sanonoi Buracharoen and Saowanee Thiput from the Thailand National Statistical Office, and Phouthasinh Khamvongsa from the EC-FAO Food Security Programme in Lao PDR. We are also grateful for the efforts of Bruce Isaacson at FAO RAP, who supported the process from the outset. Finally, the generous financial support of the European Union is gratefully acknowledged.

= iii =
Table of Contents
Foreword .................................................................................................................................................................... i
Acknowledgements ................................................................................................................................................... ii
Table of Contents...................................................................................................................................................... iii
List of Acronyms ........................................................................................................................................................ v
Executive Summary .................................................................................................................................................. vi
I. Introduction ........................................................................................................................................................... 1
II. The Lao PDR Expenditure and Consumption Survey ............................................................................................ 2
Scope of the LECS surveys ............................................................................................................................... 2
The sample ...................................................................................................................................................... 2
Methodology ................................................................................................................................................... 2
Food data collection ....................................................................................................................................... 2
Limitations of the food security trend analysis exercise ................................................................................ 3
III. Trend Analysis of Food Security Indicators .......................................................................................................... 5
Lao PDR food security indicators .................................................................................................................... 5
Minimum dietary energy requirement (MDER) .............................................................................................. 5
Food consumption and expenditure ............................................................................................................... 6
Macronutrients consumption ....................................................................................................................... 15
Inequality of food consumption.................................................................................................................... 16
IV. Key Observations ............................................................................................................................................... 17
V. Recommendations .............................................................................................................................................. 18
Agriculture .................................................................................................................................................... 18
Nutrition ........................................................................................................................................................ 18
Statistics and Methodology .......................................................................................................................... 18
References ............................................................................................................................................................... 19
Background Documentation .................................................................................................................................... 19
Glossary of Terms on Food Security ........................................................................................................................ 20
= iv =
List of Text Boxes
Text Box 1: The absence of food balance sheets in Lao PDR ..................................................................................... 4
Text Box 2: A Review of progress on undernutrition................................................................................................. 5
Text Box 3: National food consumption increased .................................................................................................... 6
Text Box 4: Average food expenditures increased .................................................................................................... 8
Text Box 5: Households spent a lower share of their income on food .................................................................... 10
Text Box 6: The share of rice in the average diet increased .................................................................................... 12
Text Box 7: Carbohydrate consumption increased, as protein and fat consumption dropped .............................. 15
Text Box 8: The equality of food consumption improved ....................................................................................... 16
List of Tables
Table 1: Sample size for the LECS (1992/93 to 2007/08) .......................................................................................... 2
Table 2: Food consumption, needs and undernourishment indicators, SOFI 2011 .................................................. 5
Table 3: Contribution of the major food commodity groups to average DEC ......................................................... 11
Table 4: Average rice consumption, quantity (gram/person/day) and DEC (kcal/person/day) .............................. 14
Table 5: Average rice consumption in urban and rural areas, quantity and DEC .................................................... 14
List of Figures
Figure 1: Minimum dietary energy requirement (MDER), kcal/person/day ............................................................. 6
Figure 2: Dietary energy consumption (DEC) kcal/person/day, by selected population groups .............................. 7
Figure 3: Share of food consumption (DEC), by food sources (%) ............................................................................. 7
Figure 4: Comparison of food consumption (DEC) by food source (%), for selected population groups .................. 8
Figure 5: Trend in average food expenditure, by selected population groups (Kip/person/day) ............................. 9
Figure 6: Trend in average food expenditure, by household size and age (Kip/person/day) ................................... 9
Figure 7: Percentage increase in real terms of food expenditure, by selected population groupings ................... 10
Figure 8: Trend of DEC and food expenditure, by gender head of household ........................................................ 10
Figure 9: Trend of food share, by selected population groups (%) ......................................................................... 11
Figure 10: Contribution to total DEC of major food commodity groups, excluding cereals (kcal/person/day) ...... 12
Figure 11: Rice consumption in Lao PDR, and in urban and rural areas (gram/person/day) .................................. 13
Figure 12: Rice consumption in Lao PDR, and in urban and rural areas (kcal/person/day) .................................... 13
Figure 13: Monthly average retail price of rice (Kip/kg), 2002 to 2008 .................................................................. 15
Figure 14: Average retail price of rice during the LECS period (Kip/kg), 2002 to 2008 ........................................... 15
Figure 15: Contribution of macronutrients consumption to total DEC (%), by selected population groupings ..... 16
Figure 16: Contribution of macronutrients to total DEC (%), based on WHO recommendation ............................ 16
Figure 17: Coefficient of Variation (CV) of DEC, as defined by FAO ........................................................................ 17

= v =
List of Acronyms
ASEAN Association of Southeast Asian Nations
CPI Consumer Price Index
CV Coefficient of Variation
DEC Dietary Energy Consumption
DES Dietary Energy Supply
FAO Food and Agricultural Organization of the United Nations
FBS Food Balance Sheets
FCT Food Composition Table
FDI Foreign Direct Investment
FMV Food Expenditure/Consumption in Monetary Value in Kips
FPI Food Price Index
FSSM Food Security Statistics Module
GDP Gross Domestic Product
LECS Lao PDR Expenditure and Consumption Survey
LSB Lao Statistics Bureau
MAF Ministry of Agriculture and Forestry
MDG Millennium Development Goals
MDER Minimum Dietary Energy Requirement
MoH Ministry of Health
MPI Ministry of Planning and Investment
NTFP Non Timber Forest Products
SOFI State of Food Insecurity in the world (FAO)
USDA United States Department of Agriculture
USD United States Dollars
WB World Bank
WFP World Food Programme
WFS World Food Summit
WHO World Health Organization

= vi =
Executive Summary
This report presents a trend analysis of food insecurity based on food consumption data derived from the 2002/3 and 2007/8 Lao PDR Expenditure and Consumption Surveys (LECS). Covering more than 8,000 households in 518 villages nationwide, the LECS is a key source of information for both government and its development partners alike. The report analyses the food security situation in Lao PDR based on food consumption statistics from the household level over a five year period (2002/3 to 2007/8). Using the Food Security Statistics Module (FSSM) developed by FAO, key trends in undernourishment, dietary energy deficit, inequality of access, dietary composition and macro-nutrient consumption are summarized. Data are presented by income quintiles, size of household, urban and rural areas, and for both male and female headed households, as applicable. Key findings are presented in text boxes at the beginning of each section. Since the publication of the 2008 Food Insecurity Report, the Lao People’s Democratic Republic has recorded sustained economic growth rates of six to eight percent, with 8.1 percent growth recorded in 2010. GDP per capita stands at 1,176 USD in 2010 up from 326 USD a decade earlier (World Bank Development Indicators 2012). Nevertheless, food deprivation remains a national policy issue, with 22 percent of the population consuming less than their minimum dietary energy requirements in 2006-2008 (FAO, SOFI 2011). The poverty rate, that is the population living on less than 1.25 USD per day was 33.9 percent in 2008. The country is ranked 138th on the United Nations 2011 Human Development Index. The overall population of the country stands at 6.25 million in 2010 (LSB 2012), of which about 77 percent live in rural areas. The present report is unable to improve upon on the results presented for Lao PDR in the FAO 2011 State of Food Insecurity in the World (SOFI 2011). While the food security analytical results are reported in the present document, a revised undernourishment indicator is not included. The reason for this is the absence of up-to-date Food Balance Sheets for Lao PDR. As a result, an estimate of Dietary Energy Supply (DES) is not available for Lao PDR. Participants in the reporting process from LSB, MAF and FAO concurred on the need to rectify this data shortfall, and recommended that this be followed up by MAF and FAO as a matter of priority. From the outset, it should be understood that findings in this report should not be taken on an individual basis, but in the context of all results presented. Individual data may indicate one aspect of the food security situation, but a fuller analysis can only be reached by considering the overall findings. For instance, although overall expenditure (expressed in Kip) has increased significantly, food expenditure as a share of overall household income has dropped, suggesting that net increases in household income have been offset by the increased costs of food purchases. It should be further highlighted that the most recent data used in this analysis are from 2007/8. Results should therefore be considered as indicative of the period during which they were collected, not as a profile of Lao PDR’s food security in 2012. Current consumption patterns and food security conditions would have been influenced by subsequent policy decisions, external events and continued GDP growth. According to data from the LECS surveys, from 2002/3 to 2007/8, daily dietary energy consumption (DEC) in Lao PDR has risen by from 2,090 to 2,260 kcal, or eight percent overall. Among urban populations, DEC has dropped from 2,350 to 2,090 kcal. This reverses the situation recorded in 2002/3, rendering urban DEC some 10 percent lower than rural DEC. The major share of food consumed by the Lao PDR population was sourced from household’s own production, representing about 60 percent of total food consumed in 2002/03, with purchases constituting a further 36 percent. This trend was further accentuated in 2007/08, with own production increasing to 72 percent, while the proportion of purchased food fell to 24 percent. This increased reliance on own production may be a result of higher food prices and competing demands from non-food expenditures on household incomes. This is supported by data on food expenditure. Average daily food expenditure increased more than twofold, from 2,959 Kip in 2002/03 to 6,134 Kip in 2007/08 while food prices increased by about 39 percent during that period. Overall, food expenditure increased by 49 percent at the national level, with increased expenditure

= vii =
among rural populations to reach 62 percent, compared to a 26 percent increase observed in urban regions. Increases among rural population expenditures may also reflect greater market access over the review period, thereby supporting increased expenditures. Increased food expenditure may also be a result of increased household incomes overall. As a share of total household income, food costs dropped to 41 percent of the total household expenditure in 2007/8, down from 52 percent in 2002/3. In terms of dietary composition, the share of cereals, essentially rice, increased in kilocalorie terms from an average daily consumption of 1,508 kcal in 2002/03 to 1,831 kcal in 2007/08. Consumption of glutinous rice, the basic staple of the Lao diet, increased from 398 to 491 grams per person per day at the national level, largely as a result of rural consumption which increased by 35 percent over the reporting period, even as urban consumption dropped by seven percent. In terms of dietary energy, increased rice consumption supported an increase in dietary energy at the national and rural level of 23 and 35 percent respectively, while overall dietary energy in urban areas declined by 12 percent. Increases in rice consumption (73 to 79 percent) contributed to overall dietary imbalance, as fats and protein intake predominantly from meats and fish was offset by high carbohydrate consumption. Already low consumption of protein fell from 11.5 to 10 percent of the overall diet, as did fats, from 15.9 to 11 percent. Both figures are at or below WHO minimum recommendation dietary requirements. This imbalance is confirmed by the findings of other surveys, such as the 2006 WFP Comprehensive Food Security and Vulnerability Assessment (CFSVA). Equality of food consumption, as measured by the coefficient of variation of dietary energy, improved during the five year period of study. The coefficient of variation fell from 29.9 to 21.7 at national level. Similar decreases were noted in both rural and urban areas. The report concludes by making recommendations related to agriculture, nutrition and statistical methodology.
Agriculture: It is recommended that FAO and MAF collaborate on developing a coordinated approach to prepare food balance sheets in the immediate term so that LAO PDR can better assess their progress towards meeting hunger reduction goals by 2015. Analysts considered that many of the findings were influenced by changes in market access, such as improved road networks, communications, electrification, and market infrastructure, and recommend additional research into the impact of expanding market access in Lao PDR on food security and household consumption in both rural and urban contexts. Nutrition: It is recommended that future food security policymaking and programming take into account the need to rebalance the Lao diet in line with WHO recommendations (less carbohydrates, more proteins and fats), in order to support renewed progress on food security and undernourishment. The results of the micronutrient analysis need to be further analyzed by FAO, LSB and MoH to develop a separate report on micronutrient consumption. Efforts should also be made to cross reference LECS data with other food utilization data gathered as part of the Lao Social Indicators Survey (LSIS), slated for completion in 2012. There is an urgent need to develop a Lao Food Composition Table to enhance future food security and nutrition analysis. The anthropometric data of LECS should be extended to include the collection of height data of all individuals to better estimate the dietary energy needs of the population. Statistical methodology: Methodological limitations identified in this report should be addressed in LECS 5. This includes clear differentiation of consumption and production of rice coming from own production (including stocks), analysis of more detailed food items instead of broad food commodity groups, provincial level disaggregation, and the need to further differentiate the term ‘own production’ into more meaningful sub-categories. Analysis of LECS 5 data should be planned and conducted in a timely manner so that the results can guide future food security and nutrition plans and decisions. Additional efforts should be made to understand the profile of urban food insecurity in Lao PDR.

= 1 =
I. Introduction
Since the publication of the 2008 Food Insecurity Report, the Lao People’s Democratic Republic has recorded sustained economic growth, supported by significant levels of Foreign Direct Investment (FDI) notably in hydropower, mining, timber, and commercial agriculture. Economic growth rates have been sustained at six to eight percent, with 8.1 percent growth in 2010. GDP per capita stands at 1,176 USD in 2010 up from 326 USD a decade earlier (World Bank Development Indicators 2012). Poverty remains a national policy issue, with 33 percent of the population living on less than 1.25 USD per day. The country is ranked 138th on the United Nations 2011 Human Development Index. The overall population of the country stands at 6.25 million in 2010 (LSB 2012), of which about 77 percent live in rural areas. Agriculture remains both an important driver of economic growth and a key livelihood. During the period 2008 to 2010, Lao PDR registered an average annual growth rate of about seven percent. Rice continues to be the key staple food and the most important crop in Lao PDR, with more than three million tonnes harvested in 2010/11. Subsistence agriculture, dominated by rice cultivation in lowland areas, continues to account for 30 percent of GDP and 75 percent of total employment. Crops grown for export, including maize, sugar cane and rubber, are of increasing value and importance, driven by high market prices and strong regional demand. The prevalence of undernourishment, a key indicator for the Millennium Development Goal (MDG) Priority 1, stood at 22 percent in 2006-08 (SOFI 2011) compared to the reference level of 31 percent in 1990-92. Malnutrition, especially chronic malnutrition is an ongoing challenge for Lao PDR, with 37 percent of children under five classified as underweight (MICS 2006). Progress on malnutrition has been limited, with little to no change in rates for over a decade. Wasting (or acute malnutrition) levels stand at seven percent, although increased rates of wasting have been recorded following disasters, as in the case of Attapeu province following Typhoon Ketsana in 2009. Exposure to disasters and shocks is a continual risk factor for vulnerable populations, as regions and districts of Lao PDR experience extreme weather events on an annual basis. The data contained in this report, derived from the Lao PDR Expenditure and Consumption Survey (LECS) 2007-8, were collected during a period of global financial crisis, with fuel and food prices increasing at unprecedented rates. At the macroeconomic level Lao PDR was largely insulated from the crisis due to limited exposure to global financial markets, although knock-on effects resulting from commodity prices and reduced international tourism were expected to have an impact on overall economic performance (ADB 2010). Overall, Lao PDR was able to maintain GDP growth rates at 6-8 percent throughout the global crisis period. However, as this report illustrates, the price of rice increased over the period 2002/3 to 2007/8, which has had implications on how households source their food, and on their overall food expenditure. This report provides an overview of key food security information in Lao PDR and its provinces based on food consumption statistics derived from LECS3 and LECS4, conducted in 2002/3 and 2007/8 respectively. Using the FAO Food Security Statistics Module (FSSM), this report summarizes key trends in food consumption and food needs, inequality of food access, and macronutrient consumption in terms of energy, monetary and macronutrient values, as applicable. Results are presented at national level and for population groups related to rural and urban, income and gender of head households. The findings indicate important shifts in the Lao diet for both urban and rural populations since 2003. The report is intended to provide policymakers within the Government of Lao PDR and the development sector with a concise set of working food security indicators to better inform efforts to reduce food insecurity and undernutrition across the country, with the intention of maintaining progress towards the MDG hunger indicator 1.9.

= 2 =
II. The Lao PDR Expenditure and Consumption Survey
Scope of the LECS surveys
Conducted every five years, the fourth national expenditure and consumption survey (LECS 4) gathered socio-economic information at the household level across all districts and provinces of the country. Data collection for LECS 4 was undertaken for a period of 12 months from April 2007 to March 2008, with results published in May 2009. The next exercise, LECS 5, began in March 2012. For all LECS exercises, the Department of Statistics (known as the Lao Statistics Bureau) of the Ministry of Planning and Investment is the lead agency for all aspects of the process. LECS 2007/8 collected data on sources of household income, land use at the village level, access to community and social services (such as roads, electricity, water, markets, schools and health facilities), as well as extensive data on consumption patterns and agricultural activities. Data from LECS is routinely applied to a number of key development indicators for Lao PDR, including Gross Domestic Product estimates, poverty lines, income distribution and inequality, and labour patterns. The analysis in the present report is limited to LECS data pertinent to food security and food consumption patterns.
The sample
The LECS 4 sample consisted of 8,304 households in 518 villages in both rural and urban areas. To the extent possible, villages selected for LECS 4 were those included in LECS 3, so as to support trend analysis over time. In terms of overall coverage, total sample size was consistent with LECS 3 and LECS 2 (see Table 1). Within each village, 16 households were selected. Field work for LECS 4 was conducted for a period of 12 months starting from April 1, 2007 to March 31, 2008, with enumerators spending a month in each village.
Table 1: Sample size for the LECS (1992/93 to 2007/08)
Target LECS 1 (92/93) LECS 2 (97/98) LECS 3
(02/03) LECS 4
(07/08)
Villages 147 450 540 518
Households 2,937 8,882 8,092 8,304
Methodology
Data on household expenditure (food and non-food) and income were collected from all participating households over a one month reference period with data recorded on a daily basis. All transactions were captured in a diary and classified by type of household consumption, as a result of agricultural production or other livelihoods. Data on household expenditures on assets, such as furniture, television, automobile, motorcycle and others durables, were recorded over a 12 month recall period. Diaries and household questionnaires were supplemented by village level questionnaires and market information covering 92 basic goods and services.
Food data collection
LECS 4 contained a range of information on the characteristics of households and their members, food and non-food consumption expenditures and income. Quantities and monetary values of food acquired by households were collected through diary questionnaires over a period of one month by source of acquisition, such as: purchased, received as gift or from stocks and own-production. Food consumed away from home was also identified by specific food items codes.

= 3 =
Limitations of the food security trend analysis exercise
LECS 4 food data
LECS 4 collected quantity and monetary values for a list of 154 food items , including seven item codes related to food consumed outside the home (food shops, bars and restaurants, etc). However, some broad categories such as wild meat, vegetables, fish, were not sufficiently precise to ascribe nutrient values. To address this, the nutrient values for the most common food item within a given category (i.e. pork within meat) were applied. Types of food acquisition, such as purchased, own-production, or in-kind were also identified in the diaries. Units of quantity measurement for the food items recorded included 18 different measurement units such as cup, bag, packet, tins, bundle, etc. No metric conversions were available for most of these units. Metric estimates are required in order to convert food quantities into gram equivalents for further conversion to macronutrients values in order to be included in the comprehensive analysis. For LECS 5, it will be necessary for enumeration teams to collect consistent quantity units of measurements and have the corresponding metric conversion factors for all local units of quantity measurement, as local units of measurement vary with food items and among villages. During the course of LECS 4, some field teams were able to provide metric conversions factors for a limited number of local units. For those units for which metric equivalents were not recorded, metric values were derived from the reported monetary values. The median unit gram price of each food item was estimated at the area, province, income level and month using those available metric and monetary values for the different food items. The monetary value for each food item for which the metric quantity value was missing, was divided by the corresponding estimated median unit gram value at the area, province, income level and month. This process was repeated but at one level higher level, discarding the month, for those food items for which metric equivalents were still missing. This process was repeated until all missing metric quantities of food items were estimated. Consumption of food items derived from own production remains the single most important source of food at household levels, with about 60 percent of food sourced from own production. However, this category was overbroad, and resulted in data indicating consumption well beyond the possible range of normal consumption. For those outlying data which were more than two standard deviations beyond the mean value of the area, provincial, quintile and month value, the corresponding median quantity value was used. It was also noted that the difference between own production and own consumption of food was not always well elaborated, and as a result, depending on when fieldwork was conducted, household data on own consumption may be a reflection of gross total production or anticipated harvest yields. Equally, households’ estimates of imputed monetary values for own production food items were in some cases in excess of market retail prices. LECS 4 was not designed to weigh food items acquired or consumed, which may have resulted in overestimation or underestimation of production and monetary value.
Nutrient values and sub-national analysis
As Lao PDR does not possess a national food composition table to derive the nutrient values of each food item included in LECS 4, the ASEAN food composition table was used, complemented by the Thailand food composition table and that of USDA. In addition, many food items were not well specified (meat, fruits, wild meat, other cereals, etc.) for which the exact nutrient values had to be estimated. Food items consumed away from home, i.e. on the streets, in restaurants, food shops, etc., were largely collected in monetary values only, as such consumption usually consists of combinations of food for which quantities are not easy to extrapolate. Nutrients values for such food items were estimated at the household level by the corresponding household unit nutrient values for equivalent combinations of foods. Between LECS 3 and LECS 4, the level of geographic disaggregation was increased from region (i.e. north, central, southern) to provincial level. While this is an important development in the availability of disaggregated data for Lao PDR, because provincial data was not available for LECS3, trend analysis at the provincial level was

= 4 =
not possible. Similarly, differences in provincial level sample size also limited the basis for inter–provincial comparison. With these limitations in mind, this report contains little inter-provincial analysis. For LECS 4, data on rural populations was divided into ‘rural without road’ and ‘rural with road’. In some instances, this report has provided an aggregate value for ‘rural’ from LECS 4, so as to support comparison with LECS 3 data. Finally, it is recognized that food sourced from the wild, including animal, fish and vegetable matter (included in the category Non-Timber Forest Products (NTFP)) are a key source of food for Lao PDR, comprising up to 20 percent of consumption (World Bank 2010a). However, LECS 4 does not differentiate between cultivated and wild sources of food, all of which is grouped under ‘own production’, which does not support disaggregation within that category.
Text Box 1: The absence of food balance sheets in Lao PDR
The MDG hunger goal 1.9, ‘Proportion of population below minimum level of dietary energy consumption’ as estimated and disseminated by FAO through its annual global State of Food Insecurity (SOFI) report, is based on three specific parameters:
Dietary energy supply (DES) derived on an annual basis from country food balance sheets (FBS);
Minimum dietary energy requirement (MDER) using country age-sex population structure; and
Coefficient of variation (CV) of dietary energy consumption (DEC) derived from household survey data (in the case of Lao PDR, LECS).
Despite the analysis of data on MDER and the coefficient of variation of dietary energy consumption, the present report is unable to improve upon on the data presented for Lao PDR in the FAO 2011 State of Food Insecurity in the World Report. While these data can be reported, a revised undernourishment indicator is not included in this report. The reason for this is the absence of Food Balance Sheets for Lao PDR. As a result, dietary energy supply (DES) is not available for Lao PDR. DES represents the global standard reference for overall food availability at the national level, and is usually produced on an annual basis by Ministries of Agriculture using agricultural and food data pertaining to production, trade, utilization and losses. When analyzed with the MDER, this generates information on undernourishment, indicating, in essence, how overall food supply corresponds to overall food requirements in a given population. While DES indicates the total amount of food available for human consumption for both private households and public institutions of a country, the DEC (dietary energy consumption) indicates the amount of food consumed by households. In Lao PDR, working with existing data, the DEC derived from LECS 4 indicated that food consumption was greater than food availability (DES) as estimated by FAO. This is a paradoxical finding which does not support further analysis. Although external to the scope of the LECS exercise, the absence of viable food balance sheets limits the utility to which the LECS data can be applied. Participants in the drafting process from LSB, MAF and FAO concurred on the need to rectify this data shortfall, and a recommendation to that effect has been included in the Recommendations section below, to be followed up by MAF and FAO.

= 5 =
III. Trend Analysis of Food Security Indicators
Lao PDR food security indicators
Table 2: Food consumption, needs and undernourishment indicators, SOFI 2011
Lao PDR Food Security Indicators 1990-92 2006-08 % Change
Population (Mil.) 4.3 6.1 41.9
Proportion of Undernourished Population (%) 31 22 -29
Number of Undernourished Population (Mil.) 1.3 1.4 7.7
Food Needs (kcal/person/day)
Minimum Dietary Energy Requirement – MDER 1,650 1,700 3
Average Dietary Energy Requirement - ADER 2,040 2,130 4.4
Intensity of Food Deprivation (kcal/p/d) 280 260 -7.1
Food Consumption
DES (kcal/p/d) 2,010 2,240 11.4
Protein (gm/p/d) 49 61 24.5
Fats (gm/p/d) 22 32 45.5
Source: FAO Food Security Statistics Webpage: http://www.fao.org/fileadmin/templates/ess/documents/food_security_statistics/country_profiles/eng/LaoPDR_E.pdf
Text Box 2: A Review of progress on undernutrition
Minimum dietary energy requirement (MDER)
It is standard practice for food security reports based on national socio-economic data to present information on the dietary energy needs of the population which are usually measured in terms of the Minimum Dietary Energy Requirement (MDER) and Average Dietary Energy Requirement (ADER). The MDER is the weighted average of the minimum calorie requirements of specific sex and age group across the population. MDER is estimated by identifying the lowest acceptable weight-for-height for each demographic category and minimum levels of physical activity, equivalent to a sedentary lifestyle. The ADER refers to the average values in terms of acceptable weight-for-height and physical activity levels. MDER is used as the cut-off point for estimating the prevalence of food deprivation (FAO, 1996). This in turn is used to calculate the depth of hunger that is the degree of shortfall in food consumption.
The DES in Lao PDR has increased by about 11 percent from 2,010 kcal/person/day in 1990-92 to 2,240 kcal/person/day in 2006-08. The average population requirement, MDER, also increased from 1,650 to 1,700 kcal/person/day during the same reference period. The data from FAO SOFI 2011 indicated a continued downward trend in the overall proportion of undernourishment in the Lao population, from 31 percent in 1990-92 to 22 percent in 2006-8.
Similarly, the food deficit of undernourished population (that is, the gap between the MDER and average dietary energy consumption among the undernourished population) has also been reduced, indicating improvements in the overall depth of hunger measurement, and some progress towards MDG 1.9.
Conversely, the overall number of undernourished people has increased slightly, indicating limited progress against the 1996 World Food Summit which aimed to halve (from 1990 levels) the overall number of undernourished people by 2015. This 7.7 percent increase was due to the increases in the total Lao population which went up by 41.9 percent during the period of reference.
A fuller elaboration of the data summarized here in included in FAO SOFI 2011 Country Profile, included here as Annex I.

= 6 =
Figure 1: Minimum dietary energy requirement (MDER), kcal/person/day
From 2002/03 to 2007/08, there has been an increase in the dietary needs within Lao’s population (Figure 1). In this context, MDER is influenced by two components: height data and the sex-age structure of the population. As national height data is not available for Lao, reference height data from James & Schofield (1990) were used for both LECS exercises. Changes to the sex-age structure of the population have resulted in a four percent increase of MDER. The MDER was 1,709 kcal per person per day in Lao PDR in 2007/08 which was four percent higher than the value of 1,638 kcal in 2002/03. This increase was due to a change in the sex-age structure of the population. Urban populations had comparatively higher MDER than the rural populations, as urban populations had a sex-age structure with higher numbers of adults, which may be due to urban migration among rural adults in search of better livelihoods or even for higher education.
Food consumption and expenditure Dietary energy consumption (DEC)
Text Box 3: National food consumption increased
In Lao PDR, dietary energy consumption increased at the national level and across income quintiles 1-4 between 2002/3 and 2007/8 (Figure 2, below). At the national level, an increase of eight percent was registered while a reduction of 490 kcal or 17 percent was recorded in quintile 5. Substantial increases in consumption were recorded at the rural level, where DEC increased by 16.5 percent. These data also indicate a drop of 260 calories among urban populations, suggesting that DEC is decreasing for populations more reliant on markets.
1,638
1,741
1,611
1,709
1,761
1,688
1000
1100
1200
1300
1400
1500
1600
1700
1800
Lao PDR Urban Rural
2002/03 LECS 2007/08 LECS
According to data from the LECS surveys, from 2002/3 to 2007/8, the daily dietary energy consumption (DEC)in Lao PDR has risen by from 2,090 to 2,260 kcal , or 8 percent overall. Among urban populations, DEC has dropped from 2,350 to 2,090 kcal. This reverses the situation recorded in 2002/3, rendering urban DEC some 10 percent lower than rural DEC.

= 7 =
Figure 2: Dietary energy consumption (DEC) kcal/person/day, by selected population groups
Share of food consumption from different sources in total consumption
The most important source of food for all populations in Lao PDR was own production, an umbrella term used to refer to all food from non-market sources, including agricultural activity, NTFP, barter, and gifts. The share of DEC derived from own production increased for all categories between LECS 3 and LECS 4 (Figures 3 and 4). At the national level, food from own production increased by 11.4 percentage points from 60.4 percent in 2002/03 to 71.8 percent in 2007/08. This shift indicates an increased reliance on own production, which may be due to increases of staple foods costs, and competing non-food demands on household incomes, which increased reliance on own-production as a low cost means to meet basic requirements.
Figure 3: Share of food consumption (DEC), by food sources (%)
Households living in rural areas saw levels of food consumption from own production increase from 73 to 83 percent in 2007/08. Own production food increased for urban and male headed households, however households headed by women did not show any significant changes in the pattern of dietary energy consumption. Female headed households had a comparatively high level of food consumed away from home (9 percent). Even so, the set of data on meals eaten away from home indicated that as a source of dietary energy, meals eaten away from home remain of limited importance, not exceeding ten percent for any population, with that figure as low as two percent for rural areas.
0
500
1000
1500
2000
2500
3000
3500
2002/03 LECS 2007/08 LECS

= 8 =
Figure 4: Comparison of food consumption (DEC) by food source (%), for selected population groups
Food expenditure
Text Box 4: Average food expenditures increased
Figures 5 and 6 show increases in food expenditure in Lao PDR and among households of different population groups between 2003/4 and 2007/8. During this period, food prices increased by an average of 38.8 percent across the country. Possible factors influencing this rise are numerous and may include general inflation, shifting consumption patterns, imputed monetary-equivalent values for own production, etc. Whatever the case, it is notable that the rate of increase is proportionate across population groups (as are overall increases in spending levels). This suggests that there is no commensurate rise in inequality as a result of this increase, as it is recorded across all levels of Lao society. This is also consistent with data in Figure 5, which shows increases in expenditure across all categories of households, regardless of the head of household’s age and the size of the household1.
1 The report Poverty in Lao PDR (MPI and WB, 2010), includes an analysis of food poverty based on LECS 4 data. Food poverty is defined as households with inadequate incomes (including own production) to purchase food sufficient to provide 2100 calories per person per day. The study found that food poverty increased to 24.6 percent since 2003/4, but that overall poverty rates had dropped over the same period. However, the report also suggests that this does not necessarily correspond to a rise in food deprivation. Users of data contained in this report are encouraged to refer to that document as well.
0 20 40 60 80 100 120
Urban (LECS 3)
Urban (LECS 4)
Rural (LECS 3)
Rural (LECS 4)
Male HH(LECS 3)
Male HH (LECS 4)
Female HH (LECS 4)
Female HH (LECS 4)
Heads'age less than 35 years (LECS …
Heads'age less than 35 years (LECS …
Heads' age between 35 & 44 years …
Heads' age between 35 & 44 years …
Heads'age between 45 & 54 …
Heads'age between 45 & 54 …
Heads' age 55 years and over …
Heads' age 55 years and over …
Purchased
Own-production
Away from home
Other
Average daily food expenditure increased more than twofold, from 2,959 Kip in 2002/03 to 6,134 Kip in 2007/08 while food prices increased by about 39 percent during the same period. Overall, food expenditure increased by 49 percent at the national level, with increased expenditure among rural populations up by 62 percent, compared to a 26 percent increase observed in urban regions. Increases among rural population expenditures may also reflect greater market access over the review period, thereby supporting increased expenditures. Increased food expenditure may also be a result of increased household incomes overall. As a share of total household income, food costs dropped to 41 percent of the total household expenditure in 2007/8, down from 52 percent in 2002/3.

= 9 =
Figure 5: Trend in average food expenditure, by selected population groups (Kip/person/day)
Figure 6: Trend in average food expenditure, by household size and age (Kip/person/day)
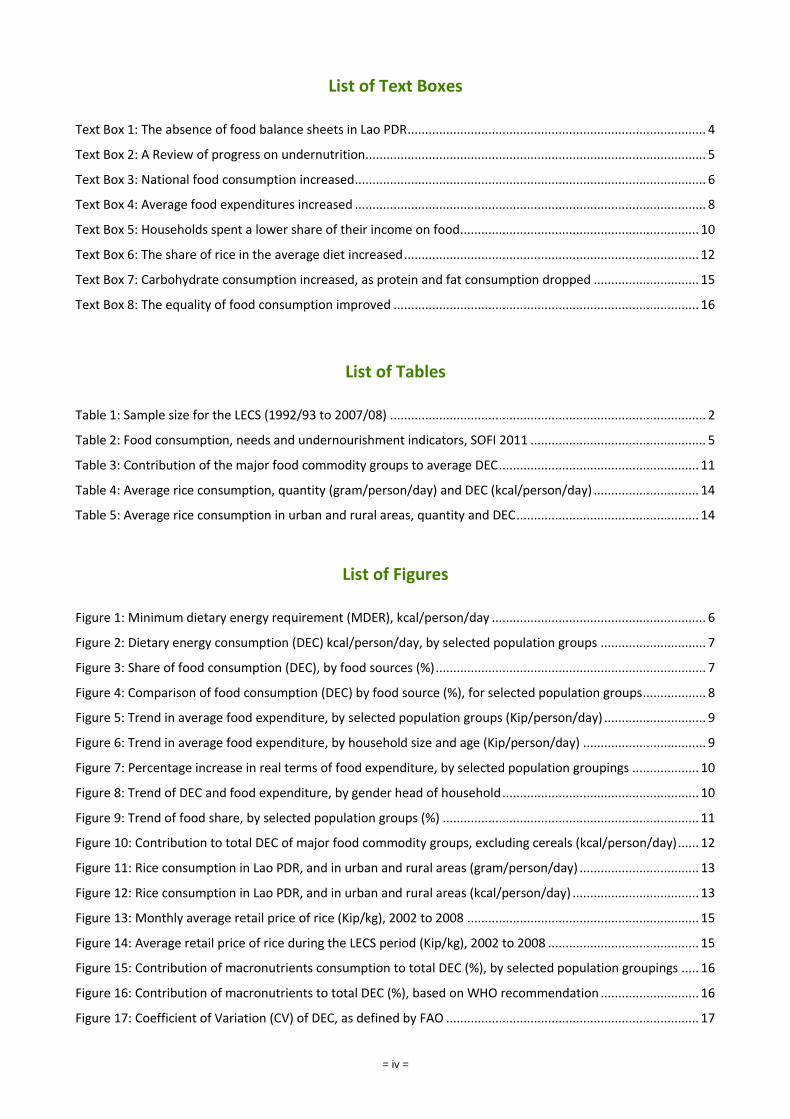
Average daily food expenditure per capita has increased by 49 percent in Lao PDR. This increase was significantly high (62 percent) among rural households as compared to 25.6 percent for those in urban areas (Figure 7). The increase in real terms of food expenditure was highest (around 66%) among low income households and those living in rural areas. The increases in food expenditure for most population quintiles, (except for the fifth quintile and urban populations), outstripped increases of 38.8 percent recorded for food prices from 2002/03 to 2007/08.
0
2000
4000
6000
8000
10000
12000
2002/03 LECS 3 2007/08 LECS 4
0
2000
4000
6000
8000
10000
12000
One to three
members
Four to five
members
Six to seven
members
Eight members and more
Less than 35 years
Between 35 and 44
years
Between 45 and 54
years
More than 54 years
2002/03 LECS 3 2007/08 LECS 4
= 10 =
Figure 7: Percentage increase in real terms of food expenditure, by selected population groupings
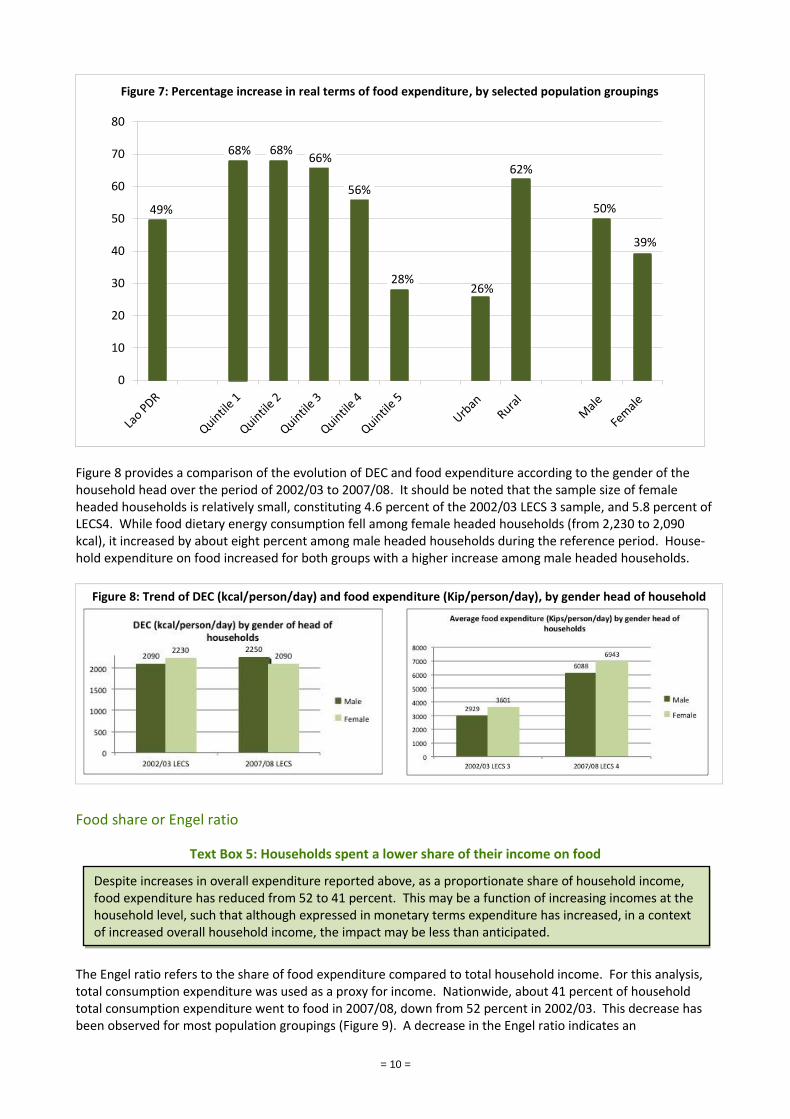
Figure 8 provides a comparison of the evolution of DEC and food expenditure according to the gender of the household head over the period of 2002/03 to 2007/08. It should be noted that the sample size of female headed households is relatively small, constituting 4.6 percent of the 2002/03 LECS 3 sample, and 5.8 percent of LECS4. While food dietary energy consumption fell among female headed households (from 2,230 to 2,090 kcal), it increased by about eight percent among male headed households during the reference period. House-hold expenditure on food increased for both groups with a higher increase among male headed households.
Figure 8: Trend of DEC (kcal/person/day) and food expenditure (Kip/person/day), by gender head of household
Food share or Engel ratio
Text Box 5: Households spent a lower share of their income on food
The Engel ratio refers to the share of food expenditure compared to total household income. For this analysis, total consumption expenditure was used as a proxy for income. Nationwide, about 41 percent of household total consumption expenditure went to food in 2007/08, down from 52 percent in 2002/03. This decrease has been observed for most population groupings (Figure 9). A decrease in the Engel ratio indicates an
49%
68% 68% 66%
56%
28% 26%
62%
50%
39%
0
10
20
30
40
50
60
70
80
Despite increases in overall expenditure reported above, as a proportionate share of household income, food expenditure has reduced from 52 to 41 percent. This may be a function of increasing incomes at the household level, such that although expressed in monetary terms expenditure has increased, in a context of increased overall household income, the impact may be less than anticipated.

= 11 =
improvement in well-being among the population as its spending on food decreases, allowing for an increase of spending on non-food items. Even the rural households registered an 8.5 point decrease. Only in larger households with eight or more members did the food share increase marginally, as these households must acquire large quantities of food. It is worth explaining the Engel ratio in the context of the data presented in Figures 5, 6 and 7, which indicated increases in food expenditure expressed in Kip for all income quintiles and household sizes, and as a percentage increase over the 2002/3 base rate. In contrast, the Engel ratio, expressing food expenditure as a percentage of overall household expenditure, indicates that as a proportionate share of household’s overall expense, food expenditure has dropped.
Figure 9: Trend of food share, by selected population groups (%)
Dietary composition
Dietary composition of food items consumed was categorized according to FAO standard classifications, incorporating 19 major food commodity groups2. The Lao dietary composition consists of food from seven major food commodity groups out of the nineteen FAO groups equivalent to 97 percent of the average DEC (Table 3).
Table 3: Contribution of the major food commodity groups to average DEC
Commodity groups
2002/03 LECS 2007/08 LECS
DEC (kcal/p/d) % Contribution
to total DEC DEC (kcal/p/d)
% Contribution to total DEC
Cereals 1,508 72.2 1,831 81.0
Meat 231 11.1 113 5.0
Vegetables 71 3.4 38 1.7
Sugars 52 2.5 34 1.5
Fish 44 2.1 34 1.5
Oils and fats 17 0.8 31 1.4
Food consumed outside the home 99 4.7 116 5.1
2 FAO classifies food items into 19 major food commodity groups as follows: cereals and products; roots, tubers and products;
sugars and syrups; pulses; tree nuts; oil crops; vegetables and products; fruits and products; stimulants; spices; alcoholic beverages; meat; eggs; fish and fisheries products; milk and cheese; oils and fats (vegetable oils); oils and fats (animal oils); non-alcoholic beverages and miscellaneous, referred to in this report as food consumed outside the home.
52%
46%
56% 56% 54% 51%
49% 52% 51%
41%
33%
47%
35% 36%
45%
51%
40%
49%
0
10
20
30
40
50
60
2002/03 LECS 2007/08 LECS

= 12 =
It is worth noting that the contribution of food items in the cereals food group, mainly rice, increased from 72.2 percent in 2002/03 to 81 percent in 2007/08 while there has been some decreases in the contribution of food items of the other major food groups, particularly meat. Excluding cereals, trends across the six remaining food commodity groups were constant for all households (Figure 10). Food consumption away from home contributed a growing share of the average total DEC, increasing by 17 percent from 2002/03 to 2007/08. Besides the 20 percent increase in dietary energy coming from rice over the reference period, miscellaneous foods, oils and fats are also being consumed in greater quantities, while contribution to DEC of meat, vegetables, sugars and fish dropped.
Figure 10: Contribution to total DEC of major food commodity groups, excluding cereals (kcal/person/day)
Rice consumption in Lao PDR
Text Box 6: The share of rice in the average diet increased
Rice is the essential staple food of the Lao population, particularly in rural areas where it is the dominant crop, comprising up to 70 percent of total agricultural production. Some 85 percent of the rice grown in Lao PDR is glutinous rice which covers about 870,000 hectares with an average annual rice production of around three million metric tonnes. The results of LECS showed an average increase in rice consumption from 398 to 491 grams per person per day from 2002/03 to 2007/08, and in terms of yearly per capita consumption from 145 to 179 kilograms (Figure 11).
99
231
71
52 44
17
116 113
38 34 34 31
0
50
100
150
200
250
Misc. food, incl.away food
Meat Vegetables Sugars Fish Oils and fats
2002/03 LECS 2007/08 LECS
DEC derived from rice in rural areas represents about 83 percent of the average total DEC. Nationwide, rice alone contributes about 77 percent of the Laotian average daily person DEC of 2,260 kcal in 2007/08, up from 67 percent, in 2002/3. This high consumption of rice affects the overall diversity of the diet. Within the periods under study, 2002/03 to 2007/08, rice prices have more than doubled. In 2002/3, the average was 2,225 Kip per kilogram increasing to 4,605 Kip per kilogram in 2007/08.

= 13 =
Figure 11: Rice consumption in Lao PDR, and in urban and rural areas (gram/person/day)
In urban areas, rice consumption has decreased by seven percent from 383 to 356 grams per person per day during the reference period. In contrast, rural areas of registered an increase of 35 percent, from 403 to 545 grams. In terms of dietary energy, similar patterns have been observed, as illustrated in Figure 12.
Figure 12: Rice consumption in Lao PDR, and in urban and rural areas (kcal/person/day)
DEC derived from rice in rural areas represents about 83 percent of the average total DEC of rural populations. This high dependency on rice affects the overall diversity of the diet. However, data on rice should be considered with the following caveat. It is possible that reported quantities of rice consumption were reflective of total production, rather than actual consumption. Therefore, it is possible that quantities of rice reported here include physical stocks held at the household level. There is need for further study to determine stronger correlation between rice production and household consumption.
398
491
383 356
403
545
0
100
200
300
400
500
600
Lao PDR (2002/03)
Lao PDR (2007/08)
Urban (2002/03)
Urban (2007/08)
Rural (2002/03)
Rural (2007/08)
1,413
1,743
1,360 1,265
1,432
1,937
0
500
1000
1500
2000
2500
Lao PDR (2002/03)
Lao PDR (2007/08)
Urban (2002/03)
Urban (2007/08)
Rural (2002/03)
Rural (2007/08)

= 14 =
Table 4 shows the trend of the daily quantity of rice consumed in grams and in dietary energy (kcal) per person for the two reference periods by types of rice and source of acquisition. Glutinous rice represents more than 80 percent of total rice consumption out of which 86 percent came from own production. Rice alone contributes about 77 percent of the Laotian average daily DEC of 2,260 kcal in 2007/08, up from 67 percent, in 2002/3.
Table 4: Average rice consumption, quantity (gram/person/day) and DEC (kcal/person/day)
Type of rice (acquisition)
Quantity Consumed (g/person/day)
DEC (kcal/person/day)
2002/03 LECS 2007/08 LECS 2002/03 LECS 2007/08 LECS
Glutinous rice (Own production)
229 368 812 1,307
Glutinous rice (purchased)
97 55 344 194
Ordinary rice (Own production)
57 61 205 218
Ordinary rice (Purchased)
15 7 52 24
RICE (total) 398 491 1,413 1,743
Table 5 breaks down the above national averages according for urban and rural populations. In urban areas, glutinous rice represented more than 90 percent of rice consumption and a marginal increase of 2 percent was noted from 2002/03 to 3007/08. However, in rural areas, glutinous rice constituted about 81 percent of total rice consumption in 2002/03 and increased to 93 percent in 2007/08. Own production of rice in urban areas increased from 54 percent to 68 percent while in rural areas, the already high level of 79 percent increased to 84 percent from 2002/03 to 2007/08.
Table 5: Average rice consumption in urban and rural areas, quantity and DEC
Type of rice (acquisition)
Urban (2002/03)
Urban (2007/08)
Rural (2002/03)
Rural (2007/08)
Quantity Consumed (g/p/day)
DEC (kcal/per/
day)
Quantity Consumed (g/p/day)
DEC (kcal/per/
day)
Quantity Consumed (g/p/day)
DEC (kcal/per/
day)
Quantity Consumed (g/p/day)
DEC (kcal/per/
day)
Glutinous rice (Own production)
182 646 228 810 252 894 425 1,507
Glutinous rice (purchased)
164 581 106 376 74 264 83 297
Ordinary rice (Own production)
25 92 16 55 66 236 34 121
Ordinary rice (Purchased)
11 41 6 23 11 39 3 12
RICE (total) 383 1,360 356 1,265 403 1,432 545 1,937
Monthly retail prices of rice for the period from 2002 to 2008 are presented in Figure 13. Between the two periods under study, 2002/03 to 2007/08, rice prices more than doubled as illustrated in Figure 14. In 2002/3, the average was 2,225 Kip per kg increasing to 4,605 Kip per kg in 2007/08. The increase in rice prices, particularly during the year 2006, is likely to have had an influence on rural households increasing consumption of their own rice production to meet their basic needs.

= 15 =
Figure 13: Monthly average retail price of rice (Kip/kg), 2002 to 2008
Figure 14: Average retail price of rice during the LECS period (Kip/kg), 2002 to 2008
Macronutrients consumption
Text Box 7: Carbohydrate consumption increased, as protein and fat consumption dropped
The macronutrient composition of the Lao diet shifted between 2002/03 and 2007/08 (Figure 15). Increases in carbohydrate consumption from 379 to 442 grams were accompanied by reductions in protein (83 to 62 grams) and fats (27 to 26 grams). In percentage terms, a 17 percent increase in carbohydrates was matched by reductions of 25 and 2 percent in proteins and fats respectively. This pattern was observed consistently among rural and urban populations and male and female headed households alike. In urban areas, the 11 percent fall in DEC resulted in respective decreases in protein, carbohydrates and fats by 18, 11 and 7.5 percent respectively. In rural areas the 16.5 percent increase of DEC was mainly caused by a 29 percent increase in carbohydrates as protein consumption dropped by 28 percent.
0
1000
2000
3000
4000
5000
6000
2002
2003
2004
2005
2006
2008
0
1000
2000
3000
4000
5000
2002/03
2003/04
2004/05
2005/06
2006/07
2007/08
Increases in carbohydrate consumption from 379 to 442 grams were accompanied by reduction in protein and fats. In percentage terms, a 17 percent increase in carbohydrates was accompanied by reductions of 25 and 2 percent in proteins and fats respectively. This pattern was observed consistently among rural and urban populations and male and female headed households alike.

= 16 =
Figure 15: Contribution of macronutrients consumption to total DEC (%), by selected population groupings
Figure 16 shows the imbalance of the average Lao diet as compared to the WHO norms over the period of reference. WHO recommends a maximum carbohydrate consumption of 75 percent of total diet. Carbohydrate consumption in the average Lao diet exceeded WHO standards. In 2007/08, some 79 percent of the diet came from carbohydrates, consistent with data in Table 4 on rice consumption. Protein remains at the low end of the acceptable range at 10 percent, which is the minimum threshold. Fat intake, at 11 percent, is below the recommended minimum of 15 percent, having dropped from 15.9 percent in 2002/03. The increase in carbohydrate consumption, at the expense of proteins and fats, would suggest the need to reduce rice consumption and increase consumption of meat, milk products, fish, fats and oils.
Figure 16: Contribution of macronutrients to total DEC (%), based on WHO recommendation
Inequality of food consumption
Text Box 8: The equality of food consumption improved
0
20
40
60
80
100
120 Fats Proteins Carbohydrate
0
10
20
30
40
50
60
70
80
90
Carbohydrate Proteins Fats
WHO Min. Level
2002/03
2007/08
WHO Max. Level
Equality of food consumption, as measured by the coefficient of variation of dietary energy, improved during the five year period of study. The coefficient of variation fell from 29.9 to 21.7 at national level. Similar decreases were noted in both rural and urban areas.

= 17 =
Inequality in food consumption is a measure of access to food by different population groups. It is estimated by the coefficient of variation (CV) of the dietary energy consumption distribution from the national mean, and is one of the key parameters in estimating the prevalence of food deprivation using the FAO methodological framework. A high value of CV reflects wide variability in the dietary energy distribution among the population, while a low value of CV points to a more homogenous food dietary energy consumption among the population. The CVs derived tends to be somewhat inelastic as there is a minimum and maximum threshold limit to food consumption: human bodies can only consume so much and cannot function without meeting the minimum base requirement. CV of DEC is highly sensitive to data quality. FAO estimates the CV of DEC as the aggregation of the variation of DEC due to income level and the variation of DEC due to energy requirement among sex and age population groups in the total population. Using this definition, the LECS analysis shows a reduction in the inequality of food consumption in both rural and urban areas and for male and female headed households alike. This is likely attributable to the increase in rice consumption, and the increased reliance on own production as a food source due to limited livelihoods.
Figure 17: Coefficient of Variation (CV) of DEC, as defined by FAO
IV. Key Observations
It must be highlighted that LECS 4 data were collected in 2007/8, a full five years prior to data analysis and the writing of this report. With the lag between data collection and dissemination of this report, it is wholly possible that subsequent policy decisions, external events and continued GDP growth may have already influenced food consumption patterns and the results presented in this report. Results should therefore be considered as indicative of the period during which they were collected, not as a profile of Lao PDR’s food security in 2012. The trend of indicators contained in this report, including dietary energy consumption, show positive gains in Lao PDR’s efforts to improve food security. However, the report also contains indications that food consumption in urban areas is undergoing significant shifts in terms of overall energy consumption (kcal), household expenditure, and diet composition, which could adversely affect nutritional status. Findings show that important shifts in the overall food security context have resulted in elevated consumption of rice, which has had an adverse impact on protein and fats consumption. Although the proportion of food expenditure as part of household expenditure has reduced, the cost of food and household reliance on markets has increased for both rural and urban populations. Increased reliance on own production of rice can be seen as a response to high market prices.
0.0
5.0
10.0
15.0
20.0
25.0
30.0
35.0
Lao PDR Urban Rural Male Female
2002/03 LECS 2007/08 LECS

= 18 =
V. Recommendations
Agriculture
This analysis highlights a prevailing need to establish food balance sheets for Lao PDR. In their absence, the analysis contained in this report can only be considered partial, and updating progress on hunger reduction related to MDG 1.9 cannot be proposed. It is recommended that FAO and MAF collaborate on developing a coordinated approach to prepare food balance sheets in the immediate term so that LAO PDR can better assess their progress towards meeting hunger reduction goals by 2015. By the time the LECS 5 survey is complete, food balance sheets should be in place, produced and updated with regularity. During the analysis and preparation of this report, it was speculated by participants that many of the findings were influenced by changes in market access (taken to include road networks, improved communications, electrification, as well as market infrastructure). Although beyond the scope of this paper to explore, it is recommended that additional research be conducted into the impact of expanding market access in Lao PDR, specifically how this influences food security and household consumption in both rural and urban contexts.
Nutrition
While overall dietary energy consumption has shown steady improvement, diet composition remains of concern. Protein and fat consumption fall below international standards, while carbohydrate consumption exceeds recommended levels. It is proposed that future food security policymaking and programming take into account the need to rebalance the Lao diet, in order to support renewed progress on food security and undernourishment. Micronutrient deficiency in Lao PDR is known to be a important component of malnutrition with 45 percent of children under five and 23 percent of women (ages 12-49) suffering from Vitamin A deficiency, and 41 percent of children under five and 63 percent of children under two being anaemic. Many more examples could be added to this list. As part of the current analysis, extensive data on micronutrient consumption was generated from the LECS 4 data, including information on Vitamin A, B complex, C, calcium, iron and amino acids. It is recommended that these data be further analyzed by FAO, LSB and MoH to develop a separate report on micronutrient consumption, and that future food security reports derived from LECS 5 should include expanded information on micronutrients. Efforts should also be made to cross reference LECS data with other food utilization data gathered as part of the Lao Social Indicators Survey (LSIS), slated for completion in 2012.
There is an urgent need to collaborate with the Ministry of Health to prepare a Lao Food Composition Table. This will enhance future food security analysis and other nutrient analysis for the diagnostic of micronutrients deficiencies in the population. The anthropometric data of LECS should be extended to include the collection of height data of all individuals to better estimate the dietary energy needs of the population.
Statistics and Methodology
With LECS 5 in progress in 2012, all efforts should be made by LSB and FAO to ensure that the follow-on food security analysis of LECS 5 data addresses the methodological limitations identified in this report. This includes in particular, clear differentiation of consumption and production of rice coming from own production (stock could be also included in the questionnaire), analysis of more detailed food items instead of broad food commodities, provincial level disaggregation, and the need to further differentiate the term ‘own production’ into more meaningful sub-categories, particularly the consumption of wild food. Most importantly, LECS 5 implementation plans should include drafting the third food security report from the outset, so that the results are available in a more timely manner so they may guide future food security and nutrition plans and decisions. With the bulk of previous research focused on rural Lao populations, it is recommended that additional efforts be made to understand the profile of urban food insecurity in Lao PDR.

= 19 =
References
ADB (2011) Lao People's Democratic Republic: Country Strategy and Program Midterm Review (2007-2011). Avalable: http://www.adb.org/documents/CSPs/LAO/2007-2011/CSP-LAO-2007-2011.pdf
FAO (2011) State of Food Insecurity in the World 2011. Rome: FAO.
Ministry of Health (2009) National Nutrition Strategy and Plan of Action. Vientiane: MoH.
Ministry of Planning and Investment, Department of Statistics (2009) The Household of Lao PDR, Social and Economic Indicators. Vientiane: LSB.
Ministry of Planning and Investment (2010) Poverty in Lao PDR. Vientiane: MPI.
WFP (2008) Comprehensive Food Security and Vulnerability Analysis, Lao PDR. Rome: WFP.
World Bank (2012) Lao PDR Data. Available: http://data.worldbank.org/country/lao-pdr
Background Documentation
FAO (2003a) Measurement and assessment of food deprivation and undernutrition: Proceedings of the International Scientific Symposium. Rome, 26-28 June 2002. Rome, FIVIMS, FAO. Available at www.fivims.net/static.jspx?lang=en&page=iss.
FAO (2003b) Methodology for the measurement of food deprivation. Rome, Statistics Division, Food Security Statistics. Available as metadata at www.fao.org/faostat/foodsecurity/index_en.htm.
FAO (2004) Human Energy Requirements - Report of a Joint FAO/WHO/UNU Expert Consultation. Rome, 17-24 Oct. 2001. FAO Food and Nutrition Technical Report Series No. 1. Rome. Available at www.fao.org/docrep/007/y5686e/y5686e00.htm
FAO (2006) Step 1 - Processing user manual, Step 2 - Analysis user manual and Step 3 - Reports user manual in Food Security Statistics Module. Rome.
FAO, (2008) Deriving food security information from National Household Budget Survey - Experience, achievements and challenges. Edited by Ricardo Sibrian. Rome. Available at http://www.fao.org/docrep/011/i0430e/i0430e00.htm
James, W.P.T., & Schofield, E.C., (1990); “Human energy requirements”. Oxford, Oxford University Press. http://www.fao.org/docrep/007/y5686e/y5686e04.htm
Sibrián, R (2009) ‘Indicators for monitoring hunger at global and sub-national levels’ Nutrition Reviews, 67(Suppl. 1):S17–S20. Special Issue: I World Congress of Public Health Nutrition. Available at http://www.fao.org/faostat/foodsecurity/files/wp013e.pdf
Sibrián, R., Naiken, L. & Mernies, J. (2007) The FAO parametric versus the IFPRI nonparametric approach to estimating the prevalence of undernourishment: Issues relating to the use of household level data from national household surveys. FAO Statistics Division Working Paper Series No.ESS/ESSG/012e. Available at http://www.fao.org/faostat/foodsecurity/files/wp012e.pdf
Sibrián, R., Ramasawmy, S. & Mernies, J. (2007) Measuring hunger at sub national levels from household surveys using the FAO approach: Manual. FAO Statistics Division Working Paper Series No. ESS/ESSA/005e. http://www.fao.org/faostat/foodsecurity/files/wp005e.pdf
USDA (2007) Food Composition Table. USDA Agricultural Research Service. United States. Available at http://www.nal.usda.gov/fnic/foodcomp/search/
WHO (2003). Report of a Joint WHO/FAO Expert Consultation on Diet, Nutrition and the Prevention of Chronic Diseases. WHO Technical Report Series No. 916. Geneva. Available at http://www.fao.org/wairdocs/who/ac911e/ac911e00.htm.
WHO (2007) World Health Organization Global Database on Child Growth and Malnutrition. Geneva, WHO Department of Nutrition for Health and Development.

= 20 =
Glossary of Terms on Food Security
Average dietary energy requirement The average dietary energy requirement (ADER) refers to the amount of energy considered adequate to meet the energy needs for normative average acceptable weight for attained height while performing moderate physical activity in good health. Balanced diet The food consumption pattern is balanced when the contribution of energy-yielding nutrients to total energy is within acceptable ranges as follows: proteins from 10% to 15%, fats from 15% to 30% and carbohydrates from 55% to 75%. Critical food poverty The prevalence of critical food poverty (pCFP), refers to the proportion of persons critically food poor in the population at national and sub-national levels, i.e. living on less than the cost of the minimum dietary energy requirement (MDER) as acquired by the first income quintile consuming the most balanced diet. Degree of food deprivation A measure of the overall food insecurity situation in a country, based on a classification system that combines prevalence of undernourishment, i.e. proportion of the total population suffering from dietary energy deficit, and depth of undernourishment, i.e. magnitude of the dietary energy deficit of the undernourished population. Dietary energy unit cost The dietary energy unit cost is the monetary value of 1,000 kcals of edible food. Dietary energy deficit (depth of hunger) The difference between the average daily dietary energy intake of an undernourished population and the national average minimum energy requirement. Dietary energy (DEI) The energy content of food consumed. Dietary energy requirement The amount of dietary energy required by an individual to maintain body functions, health and normal activity. Dietary energy supply (DES) Food available for human consumption, expressed in kilocalories per person per day (kcal/person/day). At country level, it is calculated as the food remaining for human use after deduction of all non-food consumption (exports, animal feed, industrial use, seed and wastage). This food energy supply is for both private and public consumption. Food balance sheets The food balance sheets (FBS) are derived for each commodity using data on food production and imports and opening-year food stocks after deduction of food export and end-year food stocks and all non-food consumption (animal feed, industrial use, seed, wastage and other non-food use); this estimate refers to both private and public food consumption. Food consumption distribution Food consumption distribution refers to the variation of consumption within a population. It reflects both the disparities due to socioeconomic factors and differences due to biological factors, such as sex, age, body weight and physical activity levels. Food deprivation Food deprivation refers to the condition of people whose food consumption is continuously below body

= 21 =
needs. FAO’s measure of food deprivation is based on the distribution of food consumption expressed in terms of dietary energy. Food expenditure share The food expenditure ratio corresponds to the share of food consumption expenditure (Food in Monetary Value-FMV) in monetary terms in total consumption expenditure (TCEXP) also known as Engel ratio. Food insecurity A situation when people lack secure access to sufficient amounts of safe and nutritious food for normal growth and development and an active and healthy life. It may be caused by the unavailability of food, insufficient purchasing power or inappropriate distribution. Food insecurity may be chronic, seasonal or transitory. Food security A situation that exists when all people, at all time, have physical, social and economic access to sufficient,safe and nutritious food that meets their dietary needs and food preferences for an active and healthy life. Gini Coefficient The Gini coefficient is the ratio of the area between the equality line and the Lorenz curve to the area below the equality line. The Gini coefficient ranges from 0 (perfect equality) to 1 (perfect inequality). The Gini coefficient may refer to the overall inequality, for example when depicting income (%) and income receiving units (%). However, when it depicts dietary energy consumption (%) and income receiving units (%), it refers to the inequality of energy consumption due to income. Household consumption expenditure Total household consumption expenditure as defined in the United Nations guidelines is the sum of all monetary value or expenditure on goods and services intended for consumption, goods produced and consumed from own production or own-business stocks, including the imputed rent of owner-occupied housing, and goods and services received in kind. Household food consumption expenditure Household food consumption expenditure refers to the total household spending on food consumed by all members during a specified period, at home and outside the home, e.g. for example, at restaurants, bars, work place, school, etc. It includes food from all sources, purchased or from garden or farm. Deductions should be made to allow for wastage and losses occurring from acquisition to cooking and plate and kitchen wastage. Household non-consumption expenditure It refers to income taxes, other direct taxes, pension and social security contributions, remittances, gifts and similar transfers made by the household in monetary terms or in kind, including food such as given away raw or ready to eat. Household expenditure Consumption plus non-consumption expenditure made by the household, including food. Household income Income is the sum of all receipts, in money or in kind, which as a rule are received regularly and are of recurring nature, including food. Income elasticity of food demand The income elasticity of food demand (quantity, monetary or nutrient terms) measures the responsiveness of the quantity demanded of a good (quantity, monetary or nutrient terms) to a unit change of income. Income inequality Inequality refers to disparities in the distribution of income.

= 22 =
Inequality in food consumption due to income The inequality refers to the variation of the food consumption level within a population due to disparities in the income distribution. Inequality measure of access to food – coefficient of variation The coefficient of variation of dietary energy consumption (CVx), as defined by FAO, comprises two main components; one reflecting the inequality of food consumption associated with socioeconomic levels (CV(x/v) ) and the other associated with biological (CV(x/r ) factors(sex, age, body weight and physical activity) as follows: CV (x) = CV 2 (x | v) +CV 2 (x | r) Kilocalorie (kcl) A unit of measurement of energy. One kilocalorie equals 1,000 calories. In the International System of Units (ISU), the universal unit of energy is the joule(j). One kilocalorie=4.184 kilojoules (kj). Macronutrients The proteins, carbohydrates and fats that are required by the body in large amounts and, available to be used for energy. They are measured in grams. Micronutrients The vitamins, minerals and certain other substances that are required by the body in small amounts. They are measured in milligrams or micrograms. Minimum dietary energy requirement In a specified age/sex category, the amount of dietary energy per person that is considered adequate to meet the energy needs for light activity and good health. For an entire population, the minimum energy requirements of the different age/sex groups in the population. It is expressed as kilocalories per person per day. Nutritional status The physiological state of an individual that results from the relationship between nutrient intake and requirements and from the body’s ability to digest, absorb and use these nutrients. Overnourishment Food intake that is in excess of dietary energy requirements continuously. Undernourishment Food intake that is insufficient to meet dietary energy requirement continuously. Undernutrition The result of undernourishment, poor absorption and/or poor biological use of nutrients consumed.