language characteristics and academic achievement: a look at
TRANSCRIPT

ED 343 971
AUTHORTITLE
INSTITUTION
REPORT NOPUB DATENOTEAVAILABLE FROM
PUB TYPE
EDRS PRICEDESCRIPTORS
DOCUMENT RESUME
UD 028 588
Bradby, Denise; And OthersLanguage Characteristics and Academic Achievement: ALook at Asian and Hispanic Eighth Graders in NELS:88.Statistical Analysis Report.MPR Associates, Berkeley, CA.; National Center forEducation Statistics (ED), Washington, DC.ISBN-0-16-036115-X; NCES-92-479Feb 92197p.U.S. Government Printing Office, Superintendent ofDocuments, Mail Stop: SSOP, Washington, DC20402-9328.Statistical Data (110) -- Reports -Research/Technical (143)
MF01/PC08 Plus Postage.Academic Aspiration; *Asian Americans; Demography;English (Second Language); *Grade 8; *HispanicAmericans; Junior High Schools; *Junior High SchoolStudents; *Language Proficiency; Limited EnglishSpeaking; Mathemai:ics Achievement; ReadingComprehension; Second Language Learning; SocialCharacteristics; Spanish Speaking; StudentCharacteristics
IDENTIFIERS *Language Minorities; *National EducationLongitudinal Study 1988
ABSTRACTThis report examines the demographic and language
characteristics and educational aspirations of Asian American andHispanic American eighth graders and relates that information totheir mathematical ability and reading comprehension as measured byan achievement test. Special attention is paid to students who comefrom homes in which a non-English language is spoken. The report usesinformation selected from the National Education Longitudinal Studyof 1988 (NELS:88). The NELS:88 administered questionnaires and teststo a national sample of 25,000 eighth grade students in over 1,000public and private schools in spring 1988. A second data collectionwas conducted in spring 1990. Of the 1,505 Asian American studentsevaluated, 73 percent were reported as language minorities (LMs),while 77 percent of the 3,129 Hispanic American students evaluatedwere LMs. Of the LM students, 66 percent of the Asian Americans hadhigh English proficiency as compared to 64 percent of the LM HispanicAmericans. Both Asian American and Hispanic American groups had 4percent of LM students showing low English proficiency. Overall, thestudy found many similarities betv2en the two groups. However,differences are apparent when data are divided along languageproficiency, mathematics achievement, aspiration, and other measures.Statistical data are provided in 33 tables and 44 graphs. Appendicespresent selected survey questions, technical notes and methodology,and 109 standard error tables. (JB)

NATIONAL CENTER FOR EDUCATION STATISTICS
Statistical Analysis Report February 1992
Language Characteristicsand Academic Achievement:A Look at Asian andHispanic Eighth Gradersin NELS:88
isAcHeips
aNELS
zAlt, 88 441
schoot.Si.
Denise BradbyMPR Associates, Inc.1995 University Ave., Suitc 225Berkeley, CA 94704
Jeffrey OwingsPcggy QuinnProject OfficersNational Center for Education Statistics
U.S. Department of EducationOffice of Educational Research and Improvement NCES 92-479

U.S. Department of EducationLamar AlexanderSecretary
Office of Educational Research and ImprovementDiane RavitchAssistant Secretary
National Center for Education StatisticsEmerson J. ElliottActing Commissioner
National Center for Education Statistics
"The purpose of the Center shall be to collect, and analyze,and disseminate statistics and other data related toeducation in the United States and in othernations."Section 406(b) of the General EducationProvisions Act, as amended (20 U.S.C. 1221e-1).
February 1992
ContactPegg iinn(202) ....9-1743
lor h the V.S. (ovemthent Prinithy OlhueSupoithendeth or Dip:moil,. Mail Slop: SSOP, WastliVon, DC' 204)2-4328
ISBN 0-16-036115X
4

Foreword
This report examines the demographic and language characteristics and educationalaspirations of Asian and Hispanic eighth graders and relates that information to their mathematicalability and reading comprehension as measured by an achievement test. Special attention is paid tostudents who come from homes in which a non-English language is spoken. The report usesinformation selected from the National Education Longitudinal Study of 1988 (NELS:88).
The National Education Longitudinal Study of 1988 is a large-scale study designed andsponsored by the National Center for Education Statistics (NCES), with support from the Officeof Bilingual Education and Minority Language Affairs (OBEMLA) and the National ScienceFoundation (NSF). NELS:88 provides a variety of data about the 1988 eighth graders as theymove through the U.S. school system and into the many and varied activities of early adulthood.The study began with the administration of questionnaires and teats to a nationally representativesample of 25,000 eighth graders in more than 1,000 public arid private schools in the spring of1988. Data were also collected from the student's parents, teachers, and school principals.NELS:88 has continued with a second collection of information from the 1988 eighth graders inthe spring of 1990. A third data collection, along with the collection of high school transcripts,will take place in 1992.
The NELS:88 data supply an incredibly rich source of info nation about factors thatcontribute to a student's academic performance and social development. We hope that this reporton Hispanic and Asian eighth graders will inspire other researchers to use these data to pursuetheir own interests and concerns.
Paul Planchon, Associate CommissionerElementary/Secondary Education Statistics Division
Jeffrey Owings, Branch ChiefLongitudinal and Household Studies Branch
1115

Acknowledgments
The author wishes to thank the many individuals who contributed to the production of thisreport. Eva Eagle wrote the original analysis plan with valuable advice from Dr. Carmen Simich-
Dudgeon at the Office of Bilingual Education and Minority Language Affairs. Dr. Guadelupe
Valdes of the University of California, Berkeley, provided excellent insight into the subjectmatter. Anne Hafner of the National Center for Education Statistics (NCES) also made substantialcontributions in shaping the final plan.
Ellen Liebman created the analysis file, ran exploratory analyses, and produced the manytables that form the basis of this report. I cannot thank her enough for her patience, attention, andassistance through the many changes in definitions and categories that were made to create thefinal tables. I also wish to thank Laura Horn for her valuable advice and support during theanalysis and construction of the report. Sharlene Mulder, Melinda Hobbs, and Elliot Wilenprovided computer, spreadsheet, and graphic assistance in producing the tables and figures.
Chuck Byce, Gary Hoachlander, Andrea Livingston, and Brett Threlkeld mad variousversions of this report, and I thank them for their numerous editorial contributions. MariaPennock-Roman of the Educational Testing Service, Jorge del Pinal of the Bureau of the Census,Esther Yao of the Office of Bilingual Education and Minority Language Affairs, John Burkett ofthe Office of Educational Research and Improvement, and David Moguel and James English of theOffice of Planning aid Budget Evaluation read the report and helped revise it. Finally, I wish tothank Edie McArthur, Raul Garza, Jeff Owings, Marilyn McMillen, Bob Burton, Sue Ahmed,and particularly Peggy Quinn of NCES for their many thoughtful comments.
f;
iv

Highlights
This study of Asian and Hispanic eighth graders trports on the differences and similaritiesamong the students, with an emphasis on their language skills. Basic demographic information,such al students' ethnicity, nativity, and socioeconomic status (SES) are compared, as well ashow students se x. themselves in terms of their language skills and educational plans. Students whoindicate they are from homes in which a second language is spoken att termed Language Minority(LM), and for those students, a language proficiency measure was developedfor both Englishand the students' home languageaccording to student self-assessments. In addition, all studentsare defined by their teachers as being LM and/or Limited English Proficient (LEP), the latter termreferring to those students who would derive little benefit from school instruction conducted onlyin English.
Asian/Pacific Islander Student Population
The students' ethnicity
The Asian students represent a multitude of ethnic peoples. Approximately one-fifth (17percent) are Chinese; another one-fifth (20 percent) are Filipino. More than one-tenth (13percent) are Southeast Asian, and another one-tenth (11 percent) Ire Korean. The nextlargest ethnic groups are the Pacific Islanders and the South Asians (9 percent each),followed by the Japanese, who make up 6 percent of the student population. Theremaining students (15 percent) make up an "other" category and include West Asians,Middle Easterners, and other ethnic groups.
Their language skills
Almost three-fourths of the Asian student population come from bilingual families.However, the majority of the Asian LM students indicate that they are not very proficientin their home language. Fifty-nine percent indicate that they have a low proficiency intheir home language, and only 12 percent indicate a high proficiency.
Among Asian students from bilingual homes, 66 percent have a high English languageproficiency, 29 percent have a moderate proficiency, and 4 percent a low proficiency.
Asian LM students with a high SES background are more likely to have a higher Englishproficiency than those from a low SES background. While 78 percent of Asian LMstudents of high SES have a high English proficiency, only 50 percent of low SESstudents have such a proficiency.
How they are seen by their teachers
,Although 73 percent of the Asian students come from bilingual homes, only 27 percentare identified by at least one of their teachers as LM students. Frequently, teachers areunaware that a second language is spoken in an I,M student's home and define the studentas non-LM (47 percent) Less frequently, a student is identified by a teacher as LM, butstates that only English is spoken in the home (1 percent).
7

Their aspirations
Asian LM students with a low English proficiency are less likely than those with greaterproficiency to plan on enrolling in an academic program while in high school (24 percentversus 46 percent, after adjusting to control for SES). Rather than having chosen anothertype of program, they are more likely than the more proficient to indicate that they areunsure of their intentions or that they have other plans (57 percent versus 27 percent, afterSES adjustment). These students are also less likely than those who are more highlyproficient co express a high degree of confidence that they will eventually graduate fromhigh school (60 percent versus 83 percent, after SES adjustment).
Asian LM students are more likely than Asian ron-LM students to intend to pursue anadvanced degree after college graduation (39 percent versus 28 percent, after adjusting tocontrol for SES). In addition, they are less likely than non-LM students to have no plansfor further education after their high school graduation (4 percent versus 12 percent, afterSES adjustment).
Their achievement
In general, Asian students of low SES backgrounds failed to achieve the basic readingand math performance levels at a higher rate than did Asian students of high SES: 38percent of low SES students failed to achieve the basic reading level, compared with 12percent of high SES students. On the math test, 39 percent of low SES students failed toachieve the basic level, as opposed to 14 percent of high SES students.
Similar percentages of Asian non-LM and LM students were unable to achieve the basiclevel in reading (23 percent and 24 percent, respectively) and in math (27 percent and 23percent, respectively). Among Asian LM students, English proficiency is related toachievMg the basic reading level, but not to achieving the basic math level.
Overall, Asian students with no aspirations for further education after high school failedto achieve basic achievement levels at higher rates than did students with plans forcollege. Forty-five percent and 51 ?ercent of students with no further educational plansfailed to achieve the basic levels on the reading and math tests. Although smallerpercentages of students with plans for a college degree failed to achieve the basic levels,these percentages are still substantial. Twenty-one percent and 22 percent of Asianstudents intending to graduate from college were unable to achieve the basic reading andmath levels, respectively.
Hispanic Student Population
The students' ethnicity
About two-thirds (62 percent) of the Hispanic student population are Mexican orMexican -American. Eleven percent are Puerto Rican, while 4 percent are Cuban. Twenty-three percent of the Hispanic students described themselves as "other Hispanic."
Their language skills
About three-fourths of the Hispanic student population come from bilingual homes.However, the majority of Hispanic LM students indicate that they are not very proficientin their home language. Only 16 percent indicate they have a high proficiency in theirhome language, while 84 percent indicate only a low or moderate proficiency.
vi

Among Hispanic LM eighth graders, SES is directly related to English proficiency. While83 percent of high SES students have a high Eng'ish proficiency, only 56 percent of lowSES students have such a proficiency.
Among Hispanic LM students, 64 percent have a high English language proficiency, 32percent have a moderate proficiency, and 4 percent have a low proficiency.
How they are seen by their teachers
Although 76 percent of Hispanic students indicate that a second language is spoken in thehome, only 39 percent are identified by at least one of their teachers as LM r/trdents.Frequently, teachers are unaware that a second language is spoken in the home and definethe students from bilingual homes as non-LM (41 percent). Less frequently, a studentwho indicates only English is spoken at home is defined as LM (4 percent).
Their aspirations
Hispanic LM students with a high English proficiency are more likely than those with alow proficiency to plan on enrolling in an academic program while in high school (25percent versus 12 percent, after adjusting to concrol for SES). They are less likely thanmoderately proficient students to indicate that they are unsure of their intentions or thatthey have other plans (36 percent versus 42 percent, after SES adjustment).
About 38 percent of the Hispanic LM students with a low English proficiency have noplans for further education after high school and 9 percent intend to continue theireducation after college. By contrast, only 14 percent of the highly English proficient haveno plans after high school, and 24 percent intend to continue their etlucation after college.(These figures have been adjusted to control for differences in SES.)
Their achievement
Similar percentages of Hispanic non-LM and LM eighth graders failed to achieve thebasic levels of performance on the reading (30 percent and 31 percent, respectively) andmath (36 percent and 37 percent, respectively) achievement tests. Among LM students,those with low proficiency in English failed to achieve at a much higher rate than didstudents with high proficiency.
In general, Hispanic students of low SES backgrounds failed to achieve the basic readingand math performance levels at a higher rate than did students of high SES: 37 percent oflow SES students failed to achieve the basic reading level, compared with 19 percent ofhigh SES students. On the math test, 42 percent of low SES students failed to achieve thebasic level, compared with 22 percent of high SES students.
Overall, Hispanic students with no aspirations for further education after high schoolfailed to achieve basic achievement levels at higher rates than did students with plans forcollege. For example. 43 percent and 52 percent of stude:;ts with no further plans failedto achieve the basic levels on the reading and math tests, respectively, while 24 percentand 29 percent of students who planned to graduate from college were unable to achievethose same levels.

The following chart presents a few of the findings from both the Asian and Hispanic eighth-gradepopulations, in order to illustrate the similarities and differences between the two groups. Chapter4 presents a more detailed and thorough comparison betwezn the two populations.
Asian eighth gaders Hispanic eighth graders
LM statuy. .;tudent reportedLM 73% 77%
27 23
LM students' English proficiencyHigh 66 64Moderate 29 32Low 4 4
Proportions of students failing toachieve the basic test levels
Reading achievement test
High SES 12% 19%Middle SES 27 27Low SES 38 37
Non-LM students 23 30LM students 24 31
High English proficiency 19 28Moderate proficiency 33 34Low English proficiency 63 69
Math achievement test
High SES 14 22Middle SES 25 34Low SES 39 41
Non-LM students 27 36LM students 23 37
High English proficiency 22 35MGderate proficiency 25 37Low English proficiency 24 58
Table of Contents
Foreword iii
Acknowledgments iv
HighlightsList of Tables xi
List of Figures xiv
Introduction 1
Purpose of the Study 1
General Approach 4Organization of the Report 5
Chapter 1: Measures and Definitions 7Language Proficiency Measures 7Language Status and Usage Definitions 9Ethnic Subgroups 10Adjustment Procedure 12Achievement Tests and Peiformance Levels 12
Chapter 2: Profile and Findings Asian/Pacific IslanderEighth Graders 15
Asian Ethnic Groups 15Language Skills of Asian Eighth Graders 18Relationship of Asian Underachievement to Ethnicity and Language
Proficiency 28Teacher Identification of Asian Eighth Graders 32Relationship of Asian Underachievement to Language Status and
Bilingual Education 39Educational Aspirations of Asian Eighth Graders 40Relationship of Asian Underachievement to Educational
Aspirations 47Review 51
Chapter 3: Profile and FindingsHispanic Eighth Graders 53Hispanic Ethnic Groups 53Languacre Skills of Hispanic Eighth Graders 56Relatior 'lip of Hispanic Underachievement to Lhnicity and
Language Proficiency 66Teacher Identification of Hispanic Eighth Graders 69Relationship of Hispanic Underachievement to Language Status and
Bilingual Education 76Educational Aspirations of Hispanic Eighth Graders 77Relationship of Hispanic Underachievement to Educational
Aspirations 85Review 88

Chapter 4: Summary 91Language Skills 91Relationship Between Language and Reading Underachievement 91Reladonship Between Language and Math Underachievement 92Educational Outlook and Aspiration 92Relationship Between Educational Plans and Underachievement 93
AppendicesA. Selected Survey Questions 95B. Technical Notes and Methodology , 105
Standard Errors 120Adjustment Procedure 120Statistical Procedures 122
C. Standard Error Tables 123

List of Tables
Table Page
1.1 Percentage of 1988 language minority eighth graders, by self-reported English language and home language proficiency 9
1.2 Percentage of 1988 Asian and Hispanic eighth graders, by ethnicity 11
2.1 Adjusted percentage of 1988 native- and foreign-born Asian eighthgraders, by ethnicity 17
2.2 Percentage of 1988 Asian eighth graders, by generation 18
2.3 Unadjusted and adjusted percentage of 1988 Asian non-LM and LMeighth graders, by nativity and ethnicity 19
2.4 Adjusted percentage of 1988 Asian LM eighth graders with variouslevels of self-reported home language proficiency, by ethnicity 22
2.5 Adjusted and unadjusted percentage of 1988 Asian LM eighth graderswith various levels of seif-reported English language proficiency, byethnicity and self-reported home language proficiency 24
2.6 Adjusted percentage of 1988 Asian LM eighth graders with low andmoderate self-reported home language proficiency, by length of U.S.re3idence 27
2,7 Adjusted percentage of 1988 Asian LM eighth graders with variouslevels of self-reported English language proficiency, by respondingparent's self-reported English language proficiency 28
2.8 Adjusted percentage of 1988 Asian LM eighth graders unable toachieve the basic reading and math achievement levels, by ethnicityand self-reported English language proficiency 29
2_9 Percentage of 1988 Asian LM eighth graders with various SESunable to achieve the basic reading and math achievement levels, byself-reported English language proficiency
2.10 Unadjusted and adjusted percentage of 1988 Asian LM eighth gradersreceiving instruction in a non-English language during first 2 years ofAmerican schooling, by SES and LM status 36
2.11 Unadjusted and adjusted percentage of 1988 Asian LM eighth gradersenrolled in a language assistance program, by SES, LM and NETILstatus, and self-reported English language proficiency 38

Table Page
2.12 Percentage of 1988 Asian LM eighth graders unable to achieve thebasic reading achievement level, by LM and NEM, status 39
2.13 Unadjusted and adjusted percentage of 1988 Asian eighth gradersplanning to enroll in various high school Tograms, by SES,ethnicity, and self-reported English language proficiency 41
2.14 Unadjusted and adjusted pe zentage of 1988 Asian eighth graderswith various levels of confidence in their HS graduation, by SES,ethnicity, self-reported English language proficiency, and NETILstatus 43
2.1D Unadjusted and adjusted percentage of 1988 Asian eighth graderswith plans to attain an advanced degree or with no educational plansafter HS, by SES, ethnicity, and LM status 45
2.16 Unadjusted and adjusted percentage of 1988 Asian eighth gradersexpected by their parents to attain various levels of education, by SESand LM status 47
3.1 Percentage of 1988 Hispanic eighth graders, by generation 55
3.2 Unadjusted and adjusted percentage of 1988 non-LM and LMHispanic eighth graders, by nativity and ethnicity 56
3.3 Percentage of 1988 Hispanic LA eighth graders with various levelsof self-reported English language proficiency, by self-reported homelanguage proficiency 60
3.4 Adjusted percentage of 1988 Hispanic LM eighth graders withvarious levels of self-reported home language proficiency, byethnicity and U.S. residence 61
3.5 Percentage of 1988 Hispanic LM eighth graders with various levelsof self-reported English and home language proficiency, by SES 62
3.6 Adjusted percentage of 1988 Hispanic LM eighth graders withvarious levels of self-reported English language proficiency, byresponding parent's self-reported English language proficiency 65
3.7 Adjusted percentage of 1988 Hispanic non-LM and LM eighthgraders unable to achieve the basic reading and math achievementlevels, by ethnicity 66
3.8 Percentage of 1988 Hispanic LM eighth graders with various SESlevels unable to achieve the basic reading and math achievementlevels, by self-reported English language proficiency 68
xii 1 4

Table Page
3.9 Unadjusted and adjusted percentage of 1988 Hispanic LM eighthgraders receiving instruction in a non-English language during first 2years of American schooling, by SES, nativity, LM status, and self-reported English proficiency 73
3.10 Unadjusted and adjusted percentage of 1988 Hispanic LM eighthgraders enrolled in a language assistance program, by SES, LM andNETIL status, and self-reported English language proficiency 75
3.11 Adjusted percentage of 1988 Hispanic eighth graders unable toachieve the basic reading and math achievement levels, by LM status 76
3.12 Unadjusted and adjusted percentage of 1988 Hispanic eighth gradersplanning to enroll in various HS programs, by SES and self-reportedEnglish proficiency 79
3.13 Unadjusted and adjusted percentage of 1988 Hispanic eighth graderswith various levels of confidence in their HS graduation, by SES,NETIL status, and self-reported English language proficiency 80
3.14 Unadjusted and adjusted percentage of 1988 Hispanic eighth graderswith various future educational plans, by SES, NETIL status, andself-reported English proficiency 82
3.15 Percentage of 1988 Hispanic eighth graders expected by their parentsto attain various levels of education, by SES 84

List of Figures
Figure Page
2.1 Percentage of 1988 Asian eighth graders, by ethnicity 15
2.2 Percentage of 1988 Asian eighth graders with various SES levels,by ethnicity 16
2.3 Percentage of 1988 Asian LM eighth graders, by level of self-reported home language proficiency 20
2.4 Percentage of 1988 Asian LM eighth graders, by frequency of homelanguage usage 21
2.5 Adjusted percentage of 1988 Asian LM eighth graders with variouslevels of self-reported home language proficiency, by frequency ofusage 21
2.6 Percentage of 1988 Asian LM eighth graders, by self-reportedEnglish language proficiency 23
2.7 Percentage of 1988 Asian LM eighth graders with vrsious levels ofself-reported English language proficiency, by SES 23
2.8 Adjusted percentage of 1988 Asian LM eighth graders with variouslevels of self-reported English language proficiency, by nativity 26
2.9 Adjusted percentage of 1988 Asian LM eighth graders indicating ahigh English language proficiency, by length of U.S. residence 27
2.10 Percentage of 1988 Asian eighth graders unable to achieve the basicreading and math achievement levels, by LM status 30
2.11 Percentage of 1988 Asian eighth graders unable to achieve the basicreading and math achievement levels, by SES 31
2.12 Percentage of 1988 Asian eighth graders, by teacher- and student-reported LM status 33
2.13 Percentage of 1988 Asian LM eighth graders with various levels ofself-reported English language proficiency, by LM recognition 34
2.14 Percentage of 1988 Asian LM eighth graders with various levels ofself-reported English language proficiency, by NETIL status 35
2.15 Percentage of 1988 Asian gtighth graders, by intended high schoolprogram 40
xiv 16

Figure Page
2.16 Percentage of 1988 Asian eighth graders, by confidence in highschool graduation 42
2.17 Percentage of 1988 Asian eighth graders, by plans for furthereducation 44
2.18 Percentage of 1988 Asian eighth graders unable to achieve the basicreading and math achievement levels, by intended high schoolprogram 48
2.19 Percentage of 1988 Asian eighth graders unable to achieve the basicreading and math achievement levels, by confidence in high schoolgraduation 49
2.20 Percentage of 1988 Asian eighth graders unable to achieve the basicreading and math achievement levels, by students' plans for furthereducation 50
2.21 Percentage of 1988 Asian eighth graders unable to achieve the basicreading and math achievement levels, by parental expectation ofstudents' future education 51
3.1 Percentage of 1988 Hispanic eighth graders, by ethnicity 53
3.2 Percentage of 1988 Hispanic eighth graders with various SES levels,by ethnicity 54
3.3 Percentage of 1988 Hispanic eighth graders, by nadvity 55
3.4 Percentage of 1988 Hispanic LM eighth graders, by level of self-reported home language proficiency 57
3.5 Percentage of 1988 Hispanic LM eighth graders, by frequency ofhome language usage 58
3.6 Adjusted percentage of 1988 Hispanic LM eighth graders withvarious levels of self-reported home language proficiency, byfrequency of usage 58
3.7 Percentage of 1988 Hispanic LM eighth graders, by level of self-reported English language proficiency 59
3.8 Adjusted percentage of 1988 Hispanic LM eighth graders withvarious levels of self-reported English language proficiency, bynativity 63
3.9 Adjusted percentage of 1988 Hispanic LM eighth gaders indicating ahigh English language proficiency, by length of U.S. residence 64
3.10 Adjusted percentage of 1988 Hispanic LM eighth graders withvarious levels of self-reported home language proficiency, by nativity 64
XV
17

Figure Pa ge
3.11 Adjusted percentage of 1988 Hispanic LM eighth graders unable toachieve the basic reading and math achievement levels, by self-reported English language proficiency 67
3.12 Percentage of 1988 Hispanic eighth graders unable to achieve thebasic reading and math achievement levels, by SES 68
3.13 Percentage of 1988 Hispanic eighth graders, by teacher- and student-reported LM status 70
3.14 Percentage of 1988 Hispanic LM eighth graders with various levelsof self-reported English language proficiency, by LM recognition 71
3.15 Percentage of 1988 Hispanic LM eighth graders with various levelsof self-reported English language proficiency, by NETIL status 72
3.16 Percentage of 1988 Hispanic eighth graders, by intended high schoolprogram 77
3.17 Percentage of 1988 Hispanic eighth gTaders, by confidence in highschool graduation 78
3.18 Percentage of 1988 Hispanic eighth graders, by plans for furthereducation 81
3.19 Adjusted percentage of 1988 Hispanic LM eighth graders whoseparents expect college graduation or an advanced degree, by students'self-reported English language proficiency 85
3.20 Percentage of 1988 Hispanic eighth graders unable to achieve thebasic reading and math achievement levels, by intended HS program 86
3.21 Percentage of 1988 Hispanic eighth graders unable to achieve thebasic reading and math achievement levels, by confidence in HSgraduation 86
3.22 Percentage of 1938 Hispanic eighth graders unable to achieve thebasic reading and math achievement levels, by students' plans forfurther education 87
3.23 Percentage of 1988 Hispanic eighth graders unable to achieve thebasic reading and math achievement levels, by parental expectationsof the students' future education 88
xviI S

Introduction
Purpose of the Study
The challenge of educating students with limited English language skills is not a new one forAmerican educators. In a society with a population that contains mostly immigrant peoples fromdiverse cultural and linguistic backgrounds, historically, the school has played a major role innaturalization. Many immigrant children first learned English by hearing teachers and classmatesuse it in the classroom, by studying their textbooks, and by participating to whatever extent theycould in both the instructional lessons conducted within school and in extracurricular and socialactivities occurring outside the classroom. However, acquisition of the English language did notcome easily to all immigrant children.
In recent years, educators have become increasingly concerned that during the crucial periodthat students are beginning to learn and understand the English language, they are not able toadequately comprehend the lessons that are more readily understood by their English-speakingpeers. However, learning the English language is only one of many complex problems facingimmigrant children. High dropout rates and low academic achievement, persistent major societalproblems, are widespread among language minority students. Indeed, both educators and thecourts have identified language and related cultural differences as key factors contributing to theeducational failure of minority students.1
As different methods and programs have been proposed to teach English skills to childrenwho use languages other than English, a number of terms have been used to classify thesechildren. Two of these terms are Language Minority (LM) and Limited English Proficient (LEP).Language minority refers to children who come from homes in which a non-English language isspoken. The English lant,uage skills of language minority children range from not being able tospeak English at all to being very fluent in English. Since those who study language acquisitionare still debating about definitions, Limited English Proficient has several definitions;conceptually, however, LEP means that the children have sufficient difficulty with English thatthey are at a disadvantage in classes taught entirely in English.
During recent decades, a series of events have called particular attention to the problem oflow achievement among language minority students. First, growth in the immigration of familiesand children from countries in Latin America and Asia, coupled with the now famous (and largelyAnglo) "baby bust" of the 1970s, has led to larger proportions of language minority childrenenrolled in our nation's schools. Furthermore, as the international economy has become morecompetitive and technologically sophisticated, the quality of the U.S. work force has been morecarefully scrutinized. Finally, because fewer new jobs are available to poorly educated workers,educational failurewhatever the causeis a growing problem. These developments haveprompted educators and policymakers to intensify their efforts to enhance the educationalachievement of all studentsespecially that of language minority students.
1A.H. Leibowitz, Federal Recognition of the Rights of Minority Language Groups (National Clearinghouse forBilingual Education, 1982).

In addiessing the problems of this rapidly growing segment of the U.S. population, muchresearch has been conducted on the educational experiences of language minority students. Anumber of related studies have concentrated on the educational experiences of ethnic minoritiesoverall, a group that includes language minority students. The findings of many of these studieshave shown that Hispanics have lower high school achievement, higher dropout rates, and lowercollege attendance than whites. Because Hispanics are the fastest growing minority group in theUnited States, this is a matter of grave concern.2 Asians, on the other hand, have oftendemonstrated high achievement, particularly in mathematics, but researchers point out that someAsian ethnic subgroups, such as Filipinos and Pacific Islanders, have not been as academicallysuccessful. They also note the importance of separating the more recent waves of immigrationfrom previous ones to differentiate upper class students from those of other backgrounds. Finally,researchers have been somewhat concerned that Asian students do not develop their languagepotential because their high achievement in math and science makes schools reluctant to allocateresources toward improving their other talents and pow,. al5.3
Some research has focused on isolating the factors in school achievement. Much of thisresearch indicates that socioeconomic status, English language ability, and place of nativityspecifically affect Hispanic students' achievement in school. For instance, Hispanic high schoolstudents have indicated more often than white, non-Hispanic students that their school progresshas been thwarted by financial problems, family obligations, parental disinterest, and lack of astudy space at home.4 Finally, other research points to inadequacies in the schools that Hispanicstudents often attend and reports that they are underfinanced, overcrowded, and lacking inbilingual staff.5
Despite the recent attention these issues have received, few studies have been conducted onthe academic achievement of language minority youth using nationally representative samples,especially those that include students with limited English proficiency. However, a recent studyconducted by the National Assessment of Educational Progress (NAEP) does use a nationallyrepresentative sample of language minority students. In a supplement to its regular assessment,NAEP conducted a special study of the reading and mathematics performance of languageminority children. This study confirmed somewhat the importance of English languagecompetence, particularly in the educational attainment of Hispanics, although other factors werefound to influence language competencyparental education and aspirations, language use,socioeconomic status, nativity, locus of control, and school characteristics.6 Nevertheless, thisstudy had several weaknesses: its most serious shortcoming was that Limited English Proficient(LEP) students were not included.
The purpose of this study is to build upon research that has already been conducted,exploring some of the factors that influence the achievements of Asian and Hispanic students inthis country using data from the National Education Longitudinal Study of 1988 (NELS:88).Because it contains suitably large numbers of students of various ethnicities as well as LEPstudents who have been excluded from previous longitudinal surveys, the NELS:88 survey isparticularly suited to exploring a variety of questions about students' ethnicity and language skills.This particular report establishes a basic understanding of the backgrounds, language skills, and
2National Education Association, Hispanic Concerns (1986).3National Education Association, Asian and Pacific Islander Concerns (1986),4R.P. Duran, Hispanics' Education and Background: Predictors of College Achievement (New York: CollegeEntrance Examination Board, 1983), 44.5NEA, Hispanic Concerns, 8-9.6Joan Baratz-Snowden, Donald Rock, Judith Pollack, and Gita Wilder, The Educational Progress of LanguageMinority Children: Findings from the NAEP 1985-86 Special Study (National Assessment of EducationalProgress/Educational Testing Services, May 1988).
2 20

academic abilities of the 1988 Asian and Hispanic eighth graders, providing an initial level ofinformation to which changes measured during the follow-up surveys of 1990 and 1992 can becompared.
NELS:88 asked each of the students and one of their parents in-depth questions about theirnativity and length of residence in the United States; their communication skills in English and intheir home language, if applicable; and their expectations of the student's future education. Inaddition to providing more information on language usage and skills than previously available datasets, NELS:88 oversampled Asian and Hispanic students with funds from the Office of BilingualEducation and Minority Language Affairs (OBEMLA). Of the approximately 25,000 eighth-gradestudents sampled for NELS:88, about 3,000 are Hispanic and about 1,500 are Asian or PacificIslanders.1 For each student participating in the base-year survey, data were collected from twoeighth-grade teachers, a school administrator, and a parent of the student. Several procedureswere instituted to ensure a high response rate from parents of Hispanic and Asian students. First,when necessary, the contractors provided a parent questionnaire in Spanish. In addition, Spanish-speaking interviewers contacted parents to encourage them to complete the survey and oftenadministered it over the telephone. Finally, although parent questionnaires were not available inany Asian language, letters urging parents to complete the survey and to seek help with translafionif needed were sent to non-English-speaking Asian parents who were identified by the schools.
Out of the 25,000 students who participated in the NELS:88 survey, approximately 1.5percent (107 Asian and 220 Hispanic students) were identified by their teachers as LEP. Missingfrom this percentage, how- ,er, are those students whom principals excluded from the studybecause of language difficulties. The NELS:88 survey excluded certain kinds of students:specifically, mentally handicapped students and those not proficient in English, for whom theNELS:88 tests would be unsuitable, and students having physical or emotional problems thatwould make participation in the survey unwise or unduly difficult. Seven ineligibility categorieswere employed at the time of the student sample selection; school coordinators at each sampleschool were given student rosters on which to mark the eligible and ineligible students. One of theseven categories pertained to language, and referred to students who do not have English as themother tongue and who have insufficient command of English to complete the NELS:88questionnaires and tests. It was up to the schools to define who they thought would be incapableof completing the instruments in English. The decision was to be made on an individual basis, andLEPs were NOT to be excluded categorically.
Among the total number of eighth-grade students enrolled in the 1,000 participating schools(202,966 students), 1.9 percent (3,831 students) were declared ineligible for the survey becausethe principals felt that language limitations would cause these students to have difficultycompleting questionnaires and/or cognitive tests. If these students (those with languagelimitations) had not been excluded from the sampling frame, it is estimated that the number ofadditional students who may have been classified as LEP by their teachers may have increased byapproximately 460 (12 percent sampling ratio times 3,831 excluded) students. This 12 percentsampling ratio was used to create the original sample of 25,000 students from a total number of202,966 eighth-grade students who were enrolled in the 1,000 participating schools. Becausethese students were excluded from the survey, there is a potential for bias in the base-year data.Thus, the base-year NELS:88 sample is clearly not representative of all eighth-grade languageminority students. For the purposes of this report, the population being studied are those Asianand Hispanic students (4,500) whom the principals felt could complete the survey instruments.Although the sample of LEP students included in the base year of NELS:88 is smaller than itwould have been if excluded 3tudents had been sampled, sufficient numbers are available (327) to
7The specific ethnic subgroups included in these categories will be outlined in chapter 1. It is important to notethzt throughout the report "Asian" refers to both Asians and Pacific Islanders; the term "Asian" is used in theinterest of readability.

produce the selected LEP analyses presented in this report.8 To examine the sample sizes used forthe different analyses in this report, see tables 7 through 10 in appendix B. No imputation wasperformed on any of the analysis files received from NCES.
General Approach
This study capitalizes on the oversampling of ethnic minority students, the inclusion of asufficient number of teacher-identified LEP students, and the lessons learned from previousstudies. Four considerations figured into the design of this analysis: the unique characteristics ofeach of the two populations, the diversity within each population, the importance of finding bettermeasures of language background and ability, and the need to compare student performance withbehavioral standards, rather than attempting intergroup comparisons.
First, the Asian Kid Hispanic students weft always analyzed separately. Given the culturaldifferences of these goups and their individual histories in this country, it did not seem useful tocombine these groups for an overall analysis, nor to use one group as a standard by which tomeasure the other. At the end of the report, however, differences and similarities between theAsian and Hispanic populations are noted.
Second, because of the diversity within the Hispanic and Asian student populations,whenever possible, the analysis focused on subgroups of similar students. One traditionalapproach has been to focus on ethnic subgroups within the Asian and Hispanic populations,which is based on the perception that there are important differences among Hispanic students ofdifferent ethnic descents (for example, Cubans versus Mexican-Americans) and among studentsof different Asian descents (for .txample, Chinese versus Southeast Asians). When possible, thisdistinction has been made in this study. Another approach focuses on distinguishing natives fromnon natives and on differentiating students who have been living in the United States for a brieftime from those who have resided here for several years.9 Recent work suggests that for Asiansand Hispanics, as for wl:ite non-Hispanics, differences in socioeconomic status are moreimportant than variations in ethnic background. In analyzing the results of the tabulations, all thesefactors were considered.
The third principle, the importance of finding better measures of language background andability, reinforces the fact that language minority (LM) students and students with limited Englishproficiency (LEP) are not homogeneous populations in terms of their language proficiency orlanguage use. In this analysis, students were analyzed according to their LM and LEP status, asidentified by their teachers, and also with regard to how they themselves assessed their Englishskills.
Finally, when analyzing academic achievement, Asians were not ;ompared to Hispanics norwere either group compared with the white non-Hispanic populatioo. Instead, the languagepatterns of students in these two racialethnic groups were described as accurately as possible,with the objective of determining both how these patterns relate to other background
8Given the potential for undercoverage bias, NCES has taken steps to correct this situation in future NELS:88followups and reports by subsampling students who were excluded during the base year. During the spring of 1991,approximately 600 base-year ineligible students were resurveyed to determine status (e.g., dropout) and eligibility tocomplete modified questionnaires. As an additional measure to reduce potential bias, at the request of OBEMLA,NCES has freshened the first follow-up sample with tenth-grade LEP students who probably would have beenexcluded from the base-year survey. These students (e.g., base-year ineligible and freshened) will be added to follow-up files. All future NELS:88 language minority and LEP reports will utilize these corrected files.90ther approaches include distinguishing refugees from non-refugees, or one wave of immigrants from another.However, the NELS:88 data do not provide this information.
4

characteristics and how their language usage and ability affect their academic achievement. TheNELS:88 test battery scorts, converted into behaviorally anchored levels of performance, providean objective comparison measure when relating background and language characteristics toachievement. These performance levels are described in further detail in chapter 1.
Organization of the Report
This report is divided into four chapters. The first chapter, Measures and Definitions,discusses the issues and definitions of the language variables used to categorize students in theanalysis, describes an adjustment procedure that is used to control for the influence ofsocioeconomic status, and presents the measures of academic achievementthe achievement teststhe students took when partiapating in the NELS:88 Survey. This chapter also defines key termsthat are used throughout the report.
The next two chapters of the report discuss the major findings of the research and are verysimilar to one another in format. Chapter 2 presents a profile of the Asian eighth graders, whilechapter 3 is devoted to the Hispanic eighth graders. Each chapter contains three sect:ons, witheach section describing a particular facet of the bilingual student population such as ethnicity,language proficiency, nativity and residency; teachers' perspectives; and the students' educationalexperiences and aspirations. Occasionally, the characteristics of ihe entire Asian or Hispanicstudent population are described, but the focus is on the language minority students. Each of thethree sections concludes with an investigation of the differences among the students who were notable to achieve the basic level of performance on the reading and math achievement tests.° At theend of both chapter 2 and chapter 3 is a brief review of the general findings and the backgroundfactors most strongly related to underachievement.
The report concludes with a chapter that briefly compares the findings from the Asian andHispanic student populations. Finally, there are several appendices that explain the variables usedin this study, describe the survey methodology used for NELS:88 and the various proceduresused for this analysis, and present the standard errors for the estimates reported within the text.
101411 comparisons cited have been tested for statistical significance using Bonferroni adjustments and am significantat the p 5 .05 level unless otherwise noted. The regular alpha is adjusted, based on the number of possiblecomparisons. See appendix B for a discussion of the Bonferroni procedure.
5
23

Chapter 1
Measures and Definitions
Throughout this report, students and parents axe described as having low, moderate, or highlanguage proficiency and are also referred to as being frequent, moderate, or infrequent users oftheir home language. The following section briefly summarizes how these categories were createdand applied. Students were also divided into subgroups on the basis of ethnicity; the peoples ornationalities that comprise the Asian and If spanic groups are discussed below. This chapterconcludes by describing the achievement tests taken by the students and the interpretationunderlying the possible levels of achievement.
Language Proficiency Measures
A number of questions in the NELS:88 survey explore the students' language history, use,and abilities. Students who responded that a non-English language was spoken in the home wereasked for more detail about their use of both languagesEnglish and the non-English languageused most often by the student.11 Throughout this report, the non-English language has beencalled the students' home language. The term home language, however, ought to be interpretedwith caution; it often conveys the idea that this is the language the student learned first, speaksmost often, or most often uses at home. However, in response to the follow-up question, "Whatlanguage do the people in your home usually speak?" (survey emphasis), 30 percent of both theAsian and Hispanic students with two languages spoken in the home responded "English."
Two series of questions in the NELS:88 survey asked students to assess their ability tocommunicate with others; each series contained four items. Only language minority studentsthose who reported that a language other than English was spoken in their home--had theopportunity to respond to these sets of questions. The four items contained in the first languageassessment series requested the students to determine how well they understood spoken English,as well as how well they spoke, read, and wrote English. The second language series askedstudents to assess these same four skills in their hom:.'! language. Two similar series of questionson the parent questionnaire asked about the parent's English and home language communicationskills.
One problem in interpreting the students' responses to the language ability questions is thedifficulty of determining what point of reference students used for comparison when answeringthe question. For example, when assessing their English speaking skills, students could respondto the question "How well do you speak English?" in four possible ways: (a) very well, (b) prettywell, (c) well, or (d) not very well.12 Given such subjective responses, students whose firstlanguage was other than English might be comparing their English abilities to monolingualEnglish speakers, to their siblings, or perhaps to their parents, with each different reference pointpresumably affecting their response. For example, if a student's first language is Vietnamese, butshe has been speaking English for some time, she might compare her present ability to her originallanguage skills when just beginning to learn the language. Or perhaps she might compare herEnglish-speaking skills to her Vietnamese skills. It is also possible that students with low self-
I1The screening question was worded "Is any language other than English spoken in your home?" Studentsresponded either "yes" or "no."

esteem might assess themselves at a lower level than an equally skilled person with greater self-esteem.
Another limitation of the study was the exclusion of many Limited English Proficient (LEP)students from the sample. The base-year NELS:88 sampling procedures instructed principals toexclude eighth graders who they thought were not suffic;ently proficient in English to completethe questionnaire, which resulted in the elimination of 3,831 students (1.9 percent) from theeighth-gade sample population. Among the students who were included in the survey, only 327were identified as LEP by their teachers; thus, those included are the most proficient of the LEPstudents. To call attention to the fact that these students may not be representative of all LEPeighth graders, they are identified throughout the report as non-excluded teacher-identified LEPs,abbreviated as NET/Ls.
Despite the limitations of the data, answers to the four questions within each languageassessment series were used to construct a single language proficiency measure.13 Students'answers were averaged into a mean score. The higher the combined score, the higher the studentshad assessed their ability to perform these four skills. Next, this measure was converted into"low," "medium," and "high" proficiency. If a student had a score of four (meaning they hadanswered "very well" to every skill assessment), they were defined as being highly proficient.Students with scores equal to and below two (meaning that they had responded "not very well" or"well" to at least two skill assessments) were determined to have a low proficiency. The remainingstudents (whose mean score fell between two and four) were placed into a moderately proficientcategory. This scaling procedure was also used to determine the students' home languageproficiency, and the parent's English and home language proficiency. Table 1.1 presents thepercentages of Asian and Hispanic students with various English language and home languageproficiency levels. It bears repeating that only those students who are language minority havemeasurable English language and home language roficiency levels; students from monolinguall'omes were not asked to assess their communication abilities.
12There were five possiblf.: responses for the home language skill assessment including those mentioned above and"not at all."13Appendix A duplicates tne survey questions used to construct the language proficiency measures. Factor andreliability analyses were conducted on this measure of proficiency to determine the propriety of combining theseindividual questions into a single measure. The technical notes (appendix B) contain further details about the resultsof these analyses.
8 9 '5

Table 1.1 Percentage of 1988 language minority eighth graders, by self-re rted English language and home lan ua e -rof:Lyic
Eighth graders
Asian total
English language proficiencyLowModerateHigh
Home language proficiencyLowModerateHigh
Percent
100.0%
4.229.366.5
58.629.611.7
Hispanic total 100.0%
English language proficiencyLow 3.9Moderate 31.8High 64.3
Home language proficiencyLow 40.8Moderate 42.8High 16.4
SOURCE: U.S. Department of Education, National Center for Education Statistics, National EducationLongitudinal Study of 1988, "Base-Year Student" survey.
Language Status and Usage Definitions
In addition to reporting on their own language skills, students were also evaluated by theirteachers as to whether or not they were language minority and/or limited English proficient. Foreach student participating in the survey, two of the student's teachers were also selected toparticipate. Among other questions, teachers were asked to evaluate each student as LanguageMinority (LM) and as Limited English Proficient (LEP). Teachers were asked to base theirevaluations on the following definitions:
Language Minority (LM): A studeiit in whose home a non-English language istypically spoken. Such students may inciude those whose English is fluent enoughto benefit from instruction in academic subjects offered in English as well asstudents whose English proficiency is limited.
f9c

Limited English Proficient (LEP): A student whose native language is other thanEnglish and whose skills in listening to, speaking, reading, or writing English aresuch that he/she derives little benefit from school instruction in English."
Students were placed in categories of LEP or non-LEP solely according to their teachers'assessments: if at least one teacher defined the student as LEP, the student waLs defined as LEP.Two different methods were used to describe the students' language minority status. In the first,students were termed LM or non-LM solely according to their own response regarding whether ornot a non-English language is spoken in their home. Throughout this report, when referring to thestudents' LM status, this first method is the definition most often applied. However, for certainsections, a second method of defining LM status was used. For this second method, which usesrecognized and nonrecognized before LM and non-LM, teacher responses were combined withstudent responses. If at least one teacher defmed the student as LM and the student indicated that anon-English language was spoken in the home, the student was defined as recognized LM.Conversely, if neither teacher defined the student as LM and the student indicated that the homewas monolingual, the student was defined as recognized non-LM. However, in a number ofcases, neither teacher defined the student as LM, yet the student indicated that a second languagewas spoken in the home. These students were placed in a nonrecognized LM status category. In asmaller number of cases, at least one teacher defined the student as language minority but thestudent indicated that no language other than English was spoken in the home. These studentswere also placed in the nolirecognized LM status category. These categorizations are discussed inmore detail in chapters 2 and 3.
One other measure that relates to the students' linguistic ability and performance is that oflanguage usage. Students who responded that they came from a bilingual home were asked howoften the non-English language was spoken in several situations. Among the situations presentedwere "How often do you speak that language to your father? How often does your father speakthat language to you? How often do your brothers or sisters speak that language to you? Howoften do you speak that language with your best friends in your neighborhood?" For eachsituation, the student was asked to respond in one of five ways: "always or most of the time,about half the timc, sometimes, never, or does not apply." The answers to eight of thesesituational questions were combined into a mean score, and students were assigned to either alow-, moderate-, or high-usage frequency category.°
Because some variables (such as ethnicity or educational expectations) correspond to ailHispanic or Asian students, and others (such as language proficiency or usage) correspond onlyto the Hispanic or Asian language minority students, the sample sizes upon which the statistics arebased may change within a table. Appendix B contains tables that display the sample sizes andresponse rates of the various subgroups of students for selected variables.
Ethnic Subgroups
After defining themselves as Asians or Hispanics, students were asked which specific ethnicgroup best categorized their background. Students were first asked to identify which racialcategory best described them (choosing from Asian or Pacific Islander; Hispanic, regardless ofrace; Black, not of Hispanic origin; White, not of Hispanic origin; or American Indian or AlaskanNative). If Asian or Pacific Islander were chosen, the student was then directed to the nextquestionnaire item that asked them to specify their background, choosing from the various
14U.S. Department of Education, National Center for Education Statistics, National Education Longitudinal Studyof 1988, "Base-Year Teacher" survey.1.5To examine the exact wording of the questions, see appendix A. For a more detailed explanation of thiscomposite, see appendix B.
10 2 7

subcategories listed in Table 1.2. Similarly, if Hispanic were chosen by the student as the bestdescription, the student was then directed to choose from more specific backgroundsubcategories. While the set of Asian subclassifications are different from current Office ofManagement and Budget (OMB) standards, they are consistent with past longitudinal studies. Theexact wording and choices presented to the students are duplicated in appendix A.
Table 1.2Percentage of 1988 Asian and His anic eighth graders, by ethnicit
Unweighted Weightedrcent
Asian Total 1,505 100.0%
Chinese 309 17.4Filipino 288 20.2Japanese 92 6.0Korean 188 11.0Southeast Asian 240 12.7
(Viemamese, Laotian,Cambodian/Kampuchean, Thai, etc.)
Pacific Islander 99 8.8(Somoan, Guamanian, etc.)
South Asian 126 8.7(Asian Indian, Pakistani, Bangladeshi,Sri Lankan, etc.)
Other Asian* 163 15.3West Asian (Iranian, Afghan, Turkish, etc.)Middle Eastern (Iraqi, Israeli, Lebanese, etc.)Other Asian
Hispanic Total 3,129 100.0%
Mexican, Mexican-American, Chicano 1,945 62.2Cuban 131 3.7Puerto Rican 373 11.2Other Hispanic 680 22.9
* West Asians and Middle Easterners were included with "other" Asians in this study because of the small numberof students in these categories.
SOURCE: U.S. Department of Education, National Center for Education Statistics, National EducationLongitudinal Study of 1988, "Base-Year Student" survey.
The socioeconomic status (SES) among ethnic subgroups sometimes varied. For example,while only 7 percent of the Koreans were in the lowest 25 percent of socioeconomic status, 40percent of the Southeast Asians fell within that quartile. Throughout this report, the estimates forall ethnic subgroups have been adjusted for socioeconomic status; consequently, the differencesamong the ethnic subgroups are not attributable to differences in socioeconomic status.
61S

Adjustment Procedure
An initial examination of the data led to the finding that socioeconomic status bore arelationship to many of the other variables of interest as well. Because this study is based onbivariate analyses, it was important to try to control, or adjust, for the effects of socioeconomicstatus when looking at relationships between two other variables (such as ethnicity and thestudent's English proficiency) so that the relationships found were not confounded by theunderlying differences in socioeconomic status. The adjustment procedure uses the socioeconomicdistribution for each variable being studied, factoring out the differences attributable tosocioeconomic status.
The adjustment procedure is best described using real data; this example is an estimate usedin chapter 3. Of the Hispanic eighth graders in 1988, 64.30 percent had a high self-assessedEnglish proficiency. One question of interest is whether differences exist between Mexican,Cuban, and Puerto Rican students' English proficiencies. Having looked at how differences insocioeconomic status affect students' assessments of their English language skills, and havingobserved Mexican, Cuban, and Puerto Rican students' dissimilar SES backgrounds, an additionalquestion arises of whether the socioeconomic backgrounds of the students might obscure (orexaggerate) the relationship between ethnicity and English proficiency. To remove the differencesdue to socioeconomic status in order to look more simply at the relationship between ethnicity andEnglish proficiency, the estimates are subjected to an adjustment procedure.
Before adjusting for SES, 62.51 percent of the Mexican students, 65.82 percent of theCuban students, and 69.33 percent of the Puerto Rican students had a high self-assessed Englishproficiency. Examining proficiency by socioeconomic status yields the following: 55.60 percentof low SES students had a high English proficiency; 72.61 percent of middle SES students had ahigh English proficiency; and 83.33 percent of high SES students had a high English proficiency.After adjusting for SES, the estimates of highly English proficient students by ethnicity changesomewhat: 64.20 percent of Mexican students, 59.13 percent of Cuban students, and 68.73percent of Puerto Rican students had a high self-assessed English proficiency. The effect of theadjustment procedure is to remove all the variation attributable to differences in die mean values ofthe adjustment variable (SES). The proportion of highly proficient Cuban students is exaggeratedbecause the Cuban students, on average, have a higher socioeconomic status than the other twostudent populations. The adjustment procedure places a statistical control for familysocioeconomic status and makes it easier to consider the ethnicity variable without forming deeplystratified tables by SES.
Achievement Tests and Performance Levels
Each student participating in the study was also asked to complete a battery of achievementtests, which included the subject areas of mathematics, reading comprehension, science, and U.S.history/citizenship. Only the results of the mathematics and reading comprehension tests wereused for this report. The tests were developed by the Educational Testing Service (ETS)specifically for the NELS:88 survey. The ETS report, Psychometric Report for the NELS:88Base-Year Test Battery (1989), discusses the properties of the test battery and item reliabilities.This report can be obtained from NCES.
The items and scores on the math and reading tests are behaviorally anchored. That is, thcywere designed so that the test result, in addition to being reported as a simple number that could becompared with other students' scores, could also be reported as a performance level, indicating astudent's proficiency at performing particular skills.
12

For the reading comprehension test, students could score within three possible performancelevels: basic, advanced, or below basic. At the basic reading level, students are able to recalldetails and identify the author's main thought. At the advanced reading level, students havemastered the basic skills, can make further inferences about the reading material, and canunderstand or evaluate relatively abstract concepts. Students who perform below the basic readinglevel are not able to accomplish any of the reading comprehension tasks in the higher two levels.
Similarly, the mathematics test results were categorized into four performance levels: basic,intermediate, advanced, and below basic. At the basic math level, a student can perform arithmeticoperations (addition, subtraction, multiplication, and division) on whoie numbers. At theintermediate level, a student can also carry out operations with decimals, fractions, percentages,and roots. At the advanced level, students are capable of performing these intermediate tasks andcan also perform problem-solving tasks, including geometry and simple equations. Studentspetforming below the basic level have not mastered any of the skills in the previous three levels.
When examining the relationship between background and language characteristics andachievement, the profiled students are those who were not able to perform at the basic readingand/or math levels. These students are of grave concern because they are most at risk of futureeducational failure.
13
30

Chapter 2
Profile and FindingsAsian/Pacific Islander Eighth Graders
Asian Ethnic Groups
The Asian students in NELS:88 represent a wide spectrum of ethnic peoples. About one-fifth (17 percent) are Chinese and another one-fifth (20 percent) are Filipino (figure 2.1). Slightlymore than one-tenth (13 percent) are Southeast Asian, and another one-tenth (11 percent) areKorean. Pacific Islanders and the South Asians represent the next largest ethnic groups, with 9percent each, followed by the Japanese, who make up 6 percent of the eighth-grade population.The rest of the students (15 percent) make up an "other" category that includes West Asian andMiddle Eastern students.
Fi ure 2.1Po.Gcmtas.uf.191aAsiEuir2jL_...ithgraders, b ethnicit
8.8
'1412.7
1 1
20.2
6
Chinese
1.3 Filipino
1111 Japanese
III Korean
Southeast Asian
El Pacific Islander
III South Asian
El Other Asian
SOURCE: U.S. Department of Education, National Center for Education Statistics, National EducationLongitudinal Study of 1988: "Base-Year Student" survey.

The various ethnic groups within the 1988 Asian eighth-grade student population havedifferent distributions in terms of socioeconomic status. Forty percent of the Southeast Asianstudents are in the lowest socioeconomic quartile, while only 12 percent are in the highest quartile(figure 2.2). The majority of the South Asian students, by contrast, are of high socioeconomicstatus, with 69 percent of the students in the highest SES quartile. Because of the differences insocioeconomic status among the different ethnic groups, the estimates for ethnic groupsthroughout this report have been adjusted to control for SES. In addition, some variables otherthan ethnicity have been adjusted for SES, and the reader will be alerted when these adjustedestimates are used.16
Figure 2.2Percentage of 1988 Asian eighth graders with various SESlevels, b ethnicit
EDO 41.1
50.3 38.6
tag& 41.6
46.7 46
60.3
68.7
42.6N';Z.J...
Low SES Ei Middle SES in High SES
Chinese
Filipino
Japanese
Korean
Southeast Asian
Pacific Islander
South Asian
Other Asian
SOURCE: U.S. Department of Education, National Center for Education Statistics, National EducationLongitudinal Study of 1988: "Base-Year Student" survey,
16The effect of the adjustment procedure is simply that differences among students of different ethnic groups (or theappropriate adjusted variable) are not attributable to differences in SES. A briefdescription of the process has beenincluded in chapter 1 and in appendix B.
160 r)I) 4,

Asian eighth graders are no more likely to be native-born than they are to be foreign-born.Fifty-two percent of these students were born in the United States, while 48 percent were bornoutside of the country (table 2.1). When breaking down the Asian population by ethnicity, thePacific Islander students are more likely than students of all other ethnic groups (with theexception of the Japanese) to be native-born (86 percent of the Pacific Islander students are U.S.nath e;4), dhile Southeast Asian students are far more likely to have been foreign-born (85percent).0
Table 2.1Adjusted percentage of 1988 native- and foreign-born Asian eighth...graders, b ethnicit *
Native-born Forei n-born
Total 52.4 47.6
Ethnic subgroups(adjusted for SES)
Pacific Islander 85.6 14.6Japanese 69.1 31 0Other Asian 67.0 31: .1Chinese 54.3 45.9Filipino 52.0 48.2South Asian 45.5 54.6Korean 35.1 65.0Southeast Asian 15.3 84.9
* Classification estimates have been adjusted for SES.
SOURCE: U.S. Department of Education, National Center for Education Statistics, National EducationLongitudinal Study of 1988: "Base-Year Student and Parent" surveys.
Although the eighth-grade students could not be disaggregated into genealogical generations,an attempt was made to divide students into generations using the students' and parents' places ofbirth. In this scheme, first generation refers to a student who was born in another country andwho then immigrated to the United States. On the other hand, a second generation student is onewho was born in the United States, but who has one or both parents who are foreign-born. Thirdgeneration students are U.S.-born, from U.S.-born parents. These definitions, of course, mayinclude many genealogical generations within the third generation. As displayed in table 2.2,almost one-half (48 percent) of Asian eighth graders are first generation, while slightly less thanone-third (31 percent) are second generation.
17The differences in percentages of native-born Pa:jfic Islander and Japanese students, although large, are notstatistically significant.
17
33

Table 2.2 Perc.mitaranitim Asian eighth graders, b en er att.)
Percent
Total 100.0
First generationSecond generationThird generation or higher
48.130.721.2
SOURCE: U.S. Department of Education, National Center for Education Statistics, National EducationLongitudinal Study of 1988: "Base-Year Parent" survey.
Language Skills of Asian Eighth Graders
Home language proficiency
About 73 percent of the Asian eighth graders come from homes in which a non-Englishlanguage is spoken, and who are therefore described as language minority (LM).18 A significantmajority (84 percent) of the foreign-born Asian students are LM, and more than one-half (60percent) of the native-born Asian students are LM as well (table 2.3). The Pacific Islanderstudents are less likely to be LM than students of other ethnicities.19 Only 39 percent of the PacificIslander students come from a home where a non-English language is spoken.20
18Students were asked "Is any language other than English spoken in your home?" Although their ability to speakin the non-English language may be quite limited, exposure to this language has, at the very least, made thesestudents more bilingual than those who come from monolingual households.19As seen in the table, the percentage of "Other Asian" students who are LM falls between the percentages ofPacific Islander and Japanese students who are LM. However, the small number of these students prevents thedifference between them and students of other ethnicities from being statistically significant.20The lifference between the percentages of Japanese and Korean students who are LM is not statisticallysignificant.
183 4

Table 2.3 Unadjusted and adjusted percentage of 1988 Asian non-LM and LMei hth raders, IL..1.....2x.21natilitLJL_,..L._..dethnicit *
Total
Student's nativity(unadjusted)
Native-bornForeign-born
Ethnic subgroups(adjusted for SES)
Southeast AsianChineseFilipinoSouth AsianKoreanJapaneseOther AsianPacific Islander
Non-LM I.111
27.2 72.8
40.5 59.515.9 84.1
12.5 87.514.3 85.716.6 83.417.7 82.327.8 72.236.9 63.145.0 55.061.0 39.0
* Estimates for the indicated classification have been adjusted for SES.
SOURCE: U.S. Department of Education, National Center for Education Statistics, National EducationLongitudinal Study of 1988: "Base-Year Student and Parent" surveys.
Even though most Asian students are language minorities, the majority of these studentsindicate that they are not very proficient in their home language. Only 12 percent indicate that theyare highly proficient in that language, while 88 percent indicate that they have only a low ormoderate proficiency (figure 2.3).

Figure 2.3Percentage of 1988 Asian LM eighth graders, by level of self-_sledhome lan ua e proficitLylc
III Low home language proficiency
ral Moderate home language
proficiency
N High home language
proficiency
SOURCE: U.S. Department of Education, National Center for Education Statistics, National EducationLongitudinal Study of 1988: "Base-Year Student" survey.
The majority (51 percent) of the Asian students use their home language with only moderatefrequency, and only 14 percent indicate that they frequently use their home language (figure 2.4).Students who use their home language more frequently indicate a higher home languageproficiency; however, even among the most frequent users of a non-English language, less thanone-third report that they possess a high proficiency (figure 2.5). This relationship holds evenafter controlling for SES. Some researchers have found that bilingual children consistentlyunderrate their ability to communicate in their home language, because they have been frequentlycorrected by their parents as to the proper form and style of their language.21 Part of the problemarises when students attempt to translate English words that have no literal equivalent in theirhome language. Even though students may use this "made up" word in a grammatically correctmanner, their elders may interpret this usage as improper.
21Personai conversation with Dr. Guadelupe Valdes, Professor of Education at University of California, Berkeley.
203 E;

Figure 2.4Percentage of 1988 Asian LM eighth graders, by frequency uf homeIan ua e usa e
Infirquent use
a Moderate use
Frequent use
SOURCE: U.S. Department of Education, National Center for Education Statistics, National Education Study of1988: "Base-Year Student" survey.
Figure 2.5Adjusted percentage of 1988 Asian LM eighth graders with variouslevels of self-reported home language proficiency, by frequency ofusage*
8.5
29.1
Low home language El Moderate home language High home languageproficiency proficiency proficiency
Estimates have been adjusted for SES.AINOMIMSO
Infrequent users
Moderate users
Frequent users
SOURCE: U.S. Department of Education, National Center for Education Statistics, National EducationLongitudinal Study of 1988: "Base-Year Student" survey.

The Filipino students are more likely to report that they are highly proficient in their homelanguage, when compared to Southeast Asian, Chinese, and South Asian students. Nineteenpercent of the Filipino students indicate a high home language proficiency (table 2.4). By contrast,8 percent of the Southeast Asian, 7 percent of the Chinese, and 3 percent of the South Asianstudents report a high home language proficiency. The percentage of students of other ethnicitieswho report a high home language proficiency fall in between these extremes, and are notsignificantly different from each other or from the five ethnic groups mentioned above.
Table 2.4Adjusted percentage of 1988 Asian LM eighth graders with variouslevels of self-re ortal home Ian ua e roficienc b ethnicit *
Home language proficiencv
Low Moderate Hi h
Total 58.6 29.7 11.7
Ethnic subgroups(adjusted for SES)
Japanese 41.6 35.3 23.1Filipino 53.3 27.7 19.0Other Asian 50.7 33.5 15.9Pacific Islander 57.1 28.8 14.0Korean 61.9 28.3 9.8Southeast Asian 65.0 27.4 7.6Chinese 61.0 32.2 6.8South Asian 73.8 22.4 3.8
* Classification estimates have been adjusted for SES.
SOURCE: U.S. Department of Education, National Center for Education Statistics, National EducationLongitudinal Study of 1988: "Base-Year Student" survey.
English language proficiency
Regardless of thzir ethnicity, the majority of the Asian LM students (66 percent) indicate thatthey have a relatively high English proficiency (figure 2.6). Additionally, 29 percent report amoderate English proficiency, while only 4 percent indicate a low English proficiency.
Socioeconomic status appears to be directly related to English language proficiency. That is,as SES increases, the percentage of Asian LM students with a higher English proficiencyincreases as well. For instance, 78 percent of high SES students report a high Englishproficiency, while only 50 percent of the low SES students indicate being highly Englishproficient (figure 2.7). Similarly, while 2 percent of the high SES students indicate a low Englishproficiency, about 10 percent of the low SES students report a low proficiency. Among Asianstudents, there is no evidence of a relationship between SES and home language proficiency.
22

Figure 2.6Percentage of 1988 Asian LM eighth graders, by self-reportedEn lish Ian ua e roficienc
1111 Low English proficiency
13 Moderate English proficiency
11 High English proficiency
SOURCE: U.S. Department of Education, National Center fer Education Statistics, National EducationLongitudinal Study of 1988: "Base-Year Student" survey.
Figure 2.7Percentage of 1988 Asian LM eighth graders with various levels ofself-re orted En lish Ian ua e roficienc b SES
9.8 40.6 49.5
\ 64.8
Low SES
Middle SES
High SES
III Low English proficiency Moderate English proficiency II High English proficiency
*SOURCE: U.S. Department of Education, National Center for Education Statistics, National EducationLongitudinal Study of 1988: "Base-Year Student" survey.
23
3 9

Even after adjusting for socioeconomic status, Asian LM students from the various ethnicgroups have different assessments of their English language proficiency. The Korean and SouthAsian students are more likely to indicate a high proficiency while Chinese and Southeast Asianstudents are less likely to do so. Specifically, 75 percem of the Korean students and 78 percent ofthe South Asian students indicate a high English proficiency (table 2.5). By contrast, only 59percent of the Chinese and 56 percent of the Southeast Asian students report a high Englishproficiency. Fifty-eight percent of the Japanese students leport a high English proficiency, but toofew weir sampled to establish a statistically significant difference. Students of other ethnicities fallin between these extremes and the differences in their percentages are not statistically significant,no matter with whom they are compared.
Table 2.5-Adjusted and unadjusted percentage of 1988 Asian LM eighthgraders with various levels of self-reported English languageproficiency, by ethnicity and self-reported home languageroficienc *
English language proficiency
Low Moderate Hi h1Total 4.2 29.3 66.5
Ethnic subgroups(adjusted for SES)
South Asian 1.4 20.4 78.1Korean 3.0 21.7 75.3Pacific Islander 2.0 24.8 73.2Other Asian 1.9 25.4 72.7Filipino 1.0 31.2 68.0Chinese 6.6 34.2 59.2Japanese 8.9 32.6 58.5Southeast Asian 8.8 34.7 56.5
Home language proficiency(unadjusted)
Low 3.0 26.4 70.6Moderate 6.3 37.7 56.0High 5.1 22.2 72.7
7Estimates for the indicated classification have been adjusted for SES.
SOURCE: U.S. Department of Education, National Center for Education Statistics, National EducationLongitudinal Study of 1988: "Base-Year Student" survey.

Relationship between English and home language proficiency
Asian students with a low home language proficiency assess their English proficiencysimilarly to those with a high home language proficiency. Almost tlute-fourths of these studentsindicate a high English proficiency, and about one-fourth indicate a moderate English proficiency(table 2.5). On the other hand, Asian students who are moderately proficient in their homelanguage are less likely than those with a high or low proficiency to assess their Englishproficiency at the highest level. In particular, 56 percent of the students with a moderate homelanguage proficiency have a high English proficiency, and 38 percent of these students indicate amoderate English proficiency. However, 71 percent of the students with a low home languageproficiency and 73 percent with a high home language proficiency report being highly proficient inEnglish. The differences among those students with varying home language proficiencies whohave a low English proficiency are not statistically significant.
Although the relationship between English and home language proficiency at first glanceseems a bit unusual, it has been noticed elsewhere. As debate on the subject continues, manyexperts of linguistics ascribe to theories of additive and subtractive bilingua1ism.22 An cxample ofadditive bilingualism would be the learning of a second language by a person already proficient inthe culturally dominant language. However, subtractive bilingualism is more often experienced byethnic minorities when their home language is replaced by the more "prestigious" nationallanguage of their host country. Cummins has also suggested a threshold hypothesis for languagelearning that distinguishes between proficient, partial, and limited bilinguals. He theorizes thatproficient bilinguals have reached proficiency in both languages; partial bilinguals are in theprocess of adding, replacing, or subtracting a language and are proficient in one language whilelimited in another; and limited bilinguals lose proficiency in one language before gainingproficiency in another. Furthermore, Cummins theorizes that limited bilinguals, like Lambert'ssubtractive bilinguals, may never become proficient in either language.
elationship between language proficiency, birthplace, and residence in the United States
Asian students who are natives of the United States, not surprisingly, are more highlyproficient in English than their foreign-born peers. For example, 80 percent of the native-bornstudents report a high English proficiency, compared with 58 percent of the foreign-born students(figure 2.8). However, as the length of students' residency increases, the percentage indicating ahigh English proficiency rises as well. Only 31 percent of the Asian students who have resided inthe United States for less than six years were highly English proficient, as opposed to about two-thirds of the students who have been here for more than 9 years (figure 2.9). In fact, thepercentage of foreign-born students who have resided in the United States for more than 9 yearsand who are highly proficient in English is not significantly different from the percentage ofnative-born students with a high English proficiency. (Because of the relationship betweenEnglish proficiency and SES, the estimates in this sectionthose conveying the relationshipsbetween proficiency and residencyhave been adjusted to control for the effects of SES.)
22The theories of Lambert and Tucker (1972), Skutnabb-Kangas and Toukomaa (1979), and Cummins (1976, 1978)are reviewed by D.P. Dolson in "Bilingualism and Scholastic Performance: The Literature Revisited," NABEJournal X (1985):1-35.

Figure 2.8Adjusted percentage of 1988 Asian LM eighth graders with variouslevels of self-re orted En lish Ian ua e proficienc nativite_
58.3
Native-born
Foreign-born
Low English proficiency El Moderate English proficiency 111 High English proficiency
* Estimates have been adjusted for SES.
SOURCE: U.S. Department of Education, National Center for Education Statistics, National EducationLongitudinal Study of 1988: "Base-Year Student and Parent" surveys.
A relationship also exists between the home language proficiency of Asian eighth gradersand the length of the students' ttsidence in the country. More than 60 percent of both the nativeand foreign-born Asian LM students have a low home language proficiency, with the exception offoreign-born students who have recently arrived (table 2.6). Only 34 percent of the Asian LMstudents living in the country for less than six years indicate that they have a low home languageproficiency, while one-half report a moderate proficiency. By contrast, more than 60 percent offoreign-born Asian LM students who have resided in the United States longer than six years havea low proficiency, and only 25 percent have a moderate home language proficiency.
26 42
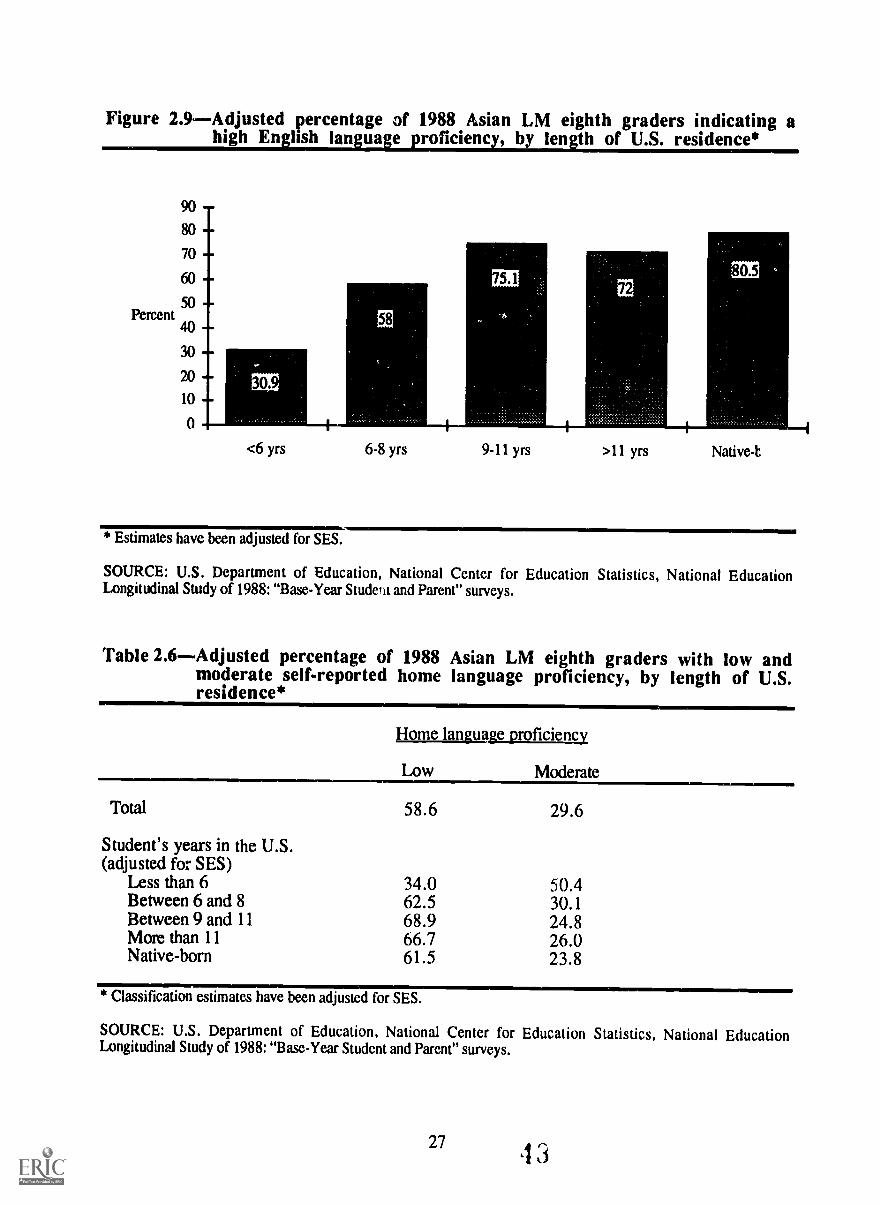
Figure 2.9Adjusted percentage of 1988 Asian LM eighth graders indicating ahigh English language proficiency, by length of U.S. residence*
<6 yrs 6-8 yrs 9-11 yrs >11 yrs Native-t
* Estimates have been adjusted for SES.
SOURCE: U.S. Department of Education, National Center for Education Statistics, National EducationLongitudinal Study of 1988: "Base-Year Student and Parent" surveys.
Table 2.6Adjusted percentage of 1988 Asian LM eighth graders with low andmoderate self-reported home language proficiency, by length of U.S.residence*
Home language proficiency
ModerateLow
Total 58.6 29.6
Student's years in the U.S.(adjusted for SES)
Less than 6 34.0 50.4Between 6 and 8 62.5 30.1Between 9 and 11 68.9 24.8More than 11 66.7 26.0Native-born 61.5 23.8
* Classification estimates have been adjusted for SES.
SOURCE: U.S. Department of Education, National Center for Education Statistics, National EducationLongitudinal Study of 1988: "Base-Year Student and Parent" surveys.
271 3

Relationship between parent' s and student' s language proficiency
A relationship exists between Asian student's and parent's English proficiency, with parentswho are more proficient in the English language being more likely to have children who are alsohighly proficient. For instance, 75 percent of the Asian LM students with a highly proficientparent are also highly proficient in English, compared with 54 percent of the children who have ahigh proficiency, but whose parents have a low proficiency (table 2.7). Similarly, 24 percent ofthe students with highly proficient parents have a moderate English proficiency, compared to 36percent of the students with parents of low proficiency. (These estimates have been adjusted tocontrol for SES.)
Table 2.7 Adjusted percentage of 1988 Asian LM eighth graders with variouslevels of self-reported English language proficiency, by respondingarent's self-re orted English language proficiency*
Low
English lanauage proficiency
Moderate High
Total 4.2 29.3 66.5
Parent's Englishlanguage proficiency(adjusted for SES)
Low 9.4 36.2 54.4Moderate 2.7 28.8 68.5High 1.6 23.5 74.9
* Classification estimates have been adjusted for SES.
SOURCE: U.S. Department of Education, National Center for Education Statistics, National EducationLongitudinal Study of 1988: "Base-Year Student and Parent" surveys.
Relationship of Asian Underachievement to Ethnicity and Language Proficiency
Ethnicity
No significant differences could be discerned among the LM students of various Asianethnic subgroups on the reading or math achievement tests. Although the percentage of studentswho could not achieve the basic reading level varied from a high of 38 percent for PacificIslanders to a low of 16 percent for the South Asians, due to small samples, these differenceswere not significant (table 2.8).
In math achievement, almost half (43 percent) of the Pacific Islander LM students wereunable to achieve the basic math level, while South Asian and Southeast Asian LM students hadthe lowest percentages of their populations unable to achieve the basic math level (16 percent and15 percent, respectively). Again, however, due to small sample sizes, these differences were notstatistically significant.
28
4 4

Table 2.8Adjusted percentage of 1988 Asian LM eighth graders unable toachieve the basic reading and math achievement levels, by ethnicityand self-re orted English Ian ua e roficienc *
Readin achievement Math achievement
Total 24.4 22.8
Ethnicity(adjusted for SES)
Pacific Islander 37.5 43.1Other Asian 30.3 24.2Filipino 28.2 29.3Japanese 25.2 20.6Chinese 22.5 21.3Southeast Asian 20.9 14.7Korean 19.5 17.6South Asian 15.9 16.0
English proficiency(adjusted for SES)
Low 63.1 24.3Moderate 32.7 24.9High 18.8 21.8
* Classification estimates have been adjusted for SES.
SOURCE: U.S. Department of Education, National Center for Education Statistics, National EducationLongitudinal Study of 1988: "Base-Year Student" survey.
Language use and proficiency
Overall, the same percentage of Asian non-LM and LM students were unable to achieve thebasic level in reading (23 percent and 24 percent, respectively) and in math (27 percent and 23percent). Eve') when controlling for socioeconomic status and nativity, this similarity remains(figure 2.10).
However, English proficiency among LM students is related to reading achievement. AsEnglish proficiency among the Asian LM students increased, the percentage of those under-achieving in reading decreased. Sixty-three percent of the least proficient students failed to reachthe basic level of the reading test, while only 19 percent of the highly proficient students wereunable to reach that level (table 2.8). The relationship between English proficiency and a failure toachieve the basic math achievement level was not significant among Asian LM students.(Estimates of the relationships between proficiency and underachievement have been adjusted tocontrol for SES.)
294 5

Figure 2.14Percentage of 1988 Asian eighth graders unable to achieve thebasic readin and math achievement levels, b LM status
Reading achievement Math achievement
Non-LM
SOURCE: U.S. Department of Education, National Center for Education Statistics, National EducationLorOtudinai Study of 1988: "Base-Year Student" survey.
Socioeconomic status
Greater proportions of Asian students with higher SES achieved above the basic levels onboth testF those with lower SES. Although 12 percent of high SES students could notachieve the basic reading level, more than three times that percentage of low SES students (38percent) could not reach the basic level (figure 2.11). A similar pattern emerged on the math test:14 percent of the Asian students with high SES did not achieve the basic level, compared with 39percent of those with low SES.
The relationship between SES and reading achievement prevails for Asian students evenwhen controlling for English proficiency. In particular, among LM eighth graders with moderateEnglish proficiency, 43 percent of the low SES students failed to achieve the basic reading level,in contrast to 24 percent of high SES students (table 2.9). The same pattern exists for mathachievement, where SES has a strong relationship to achievement.
4f;
30

Figure 2.11Percentage of 1988 Asian eighth graders unable to achieve thebasic readin and math achievement levels, bz ja
40
35 --
30
25
Percent 20
15
10
5
0
39.2
Reading achievement Math achievement
0 Low SES El Middle SES 1111 High SES
SOURCE: U.S. Department of Education, National Center for Education Statistics, National EducationLongitudinal Study of 1988: "Base-Year Student" survey.
31 4 7

Table 2.9 Percentage of 1988 Asian LM eighth graders with various SES unableto achieve the basic reading and math achievement levels, by self-
orted Enel
Reading achievement
Socioeconomic...a/Am
Math achievement
Sirdoeconomic saws
Low Middle High Low Middle High
Total* 38.3 27.2 12.3 39.2 25.4 14.2
English languageproficiency
Low Low-N Low-N Low-N Low-N Low-N Low-NModerate 42.7 38.1 23.9 37.5 29.7 13.3High 30.3 20.5 9.7 38.3 21.6 13.0
* Total estimates incorporate both LM and non-LM students, while estimates in the classification "Englishlanguage proficiency" apply only to LM students.
SOURCE: U.S. Department of Education, National Center for Education Statistics, National EducationLongitudinal Study of 1988: "Base-Year Student" survey.
Teacher Identification of Asian Eighth Graders
Two teachers for each eighth grader included in NELS:88 were also surveyed. Each teacherwas asked to indicate whether or not the student was a language minority student (LM) and alsowhether or not the student had limited English proficiency (LEP).23 This study combined the twoteachers' responses into one "teacher identification"; students were teacher-identified as LM if oneof the following occurred: (a) both teachers indicated that a student is LM, (b) only one teacherresponded to the question and indicated that the student is LM, or (c) one teacher indicated that thestudent is LM and the other teacher did not. Thus, if at least one teacher identified the student asLM, the student was teacher-identified as LM. The same processes determined the teacheridentification of LEP: if at least one teacher indicated that the student was LEP the student wasteacher-identified as LEP; the description used in this report is non-excluded teacher-identifiedLEP (NETIL),24
In this section, the teachers' evaluations of the eighth grader's LM and LEP status arecompared with the students' report of whether or not a second language was spoken in the homeand the students' self-reported English language proficiency. The results indicate that teachers andstudents often have different views of the LM and LEP status of the students.
23As explained in the first chapter, in the NELS:88 Base-Year survey, students were excluded if they were thoughtto not have enough English skills to fill out the survey forms and tests. Therefore, the most limited Englishproficient students were not included.24See appendix B for further information about these two variables.
32s

Recognized and nonrecognized language minority students
Approximately 73 percent of Asian students indicate that a non-English language is spokenin the home. However, only 27 percent of Asian students were teacher-identified as beinglanguage minority, indicating that many more students are from bilingual homes than teachers areaware (figure 2.12). Most, but not all, of the Asian students who are from monolingual homeswere identified by their teachers as not being LM: about 28 percent of Asian students indicate thatonly English is spoken at home, and all but 1 percent of these students weir identified by teachersas not being language minority. For this analysis, when students and teachers have a differentassessment of whether or not the student is LM, no matter the nature of the disparity, thosestudents were called nonrecognized language minority in order to relate a disparity between thestudent and teacher responses.
Overall, 52 percent of the Asian students were in agmement with their teachers about thestudent's language minority status (26 percent LM and 26 percent non-LM), while 48 percentdisagreed (47 percent were from bilingual homes and teacher-identified as non-LM and 1 percentwere from English-only homes and teacher-identified as LM). In order to distinguish between the73 percent of Asian students who are LM and the 26 percent of Asian students who are not onlyLM but also teacher-identified as such, the term recognized LM is used. Similarly, recognizednon-LM denotes those non-LM students who were teacher-identified as non-language minority.The remaining students, as noted above, are termed nonrecognized LM.
Figure 2.12Percentage of 1988 Asia eighth graders, by teacher- and student-remrted LM status
Bilingual home
identified as non-LM
Bilingual home
identified as LM
El Monolingual homeidentified as LM
Monolingual home
identified as non-LM
SOURCE: U.S. Department of Education, National Center for Education Statistics, National EducationLongitudinal Study of 1988: "Base-Year Student and Teacher" surveys.

The English language proficiency of the recognized LM Asian students was compared with
the proficiency of the nonrecognized LM students. In general, the nonr cognized LM students are
more proficient in English than the recognized LM students. For example, 77 percent of thenonrecognized LM students indicate having a high English proficiency, while 51 percent of the
recognized LM students report the same proficiency level (figure 2.13). Similarly, only 2 percent
of the nonrecognized LM students indicate a low proficiency, as opposed to 8 percent of the
recognized LM students.25
Figure 2.13Percentage of 1988 Asian LM eighth graders with various levels ofself-re orted En lish Ian ua e proficienc b LM reco nition
50.7 Recognized LM
Nonrecognized LM
Low English proficiency 121 Moderate English proficiency MI High English proficiency
SOURCE°: U.S. Department of Education, National Center for Education Statistics, National EducationLongitudinal Study of 1988: "Base-Year Student and Teacher" surveys.
Non-excluded teacher-identified limited English proficient students
About 6 percent of the Asian student body included in the survey were defined by at leastone of their teachers as having limited English proficiency. Nevertheless, among these students,33 percent indicate that they are highly Enflish proficient, and 46 percent indicate a moderateproficiency level (figure 2.14). By comparison, among language minority non-NETIL students,70 percent consider themselves highly proficient, and 28 percent moderately proficient.
25Students who responded that only English was spoken in the home were not asked to assess their language skills.
In this instance, therefore, the nomrcognized LM category does not include the 4 percent of students who stated that
they came from a monolingual home and whose teachers defined them as LM.
345 0
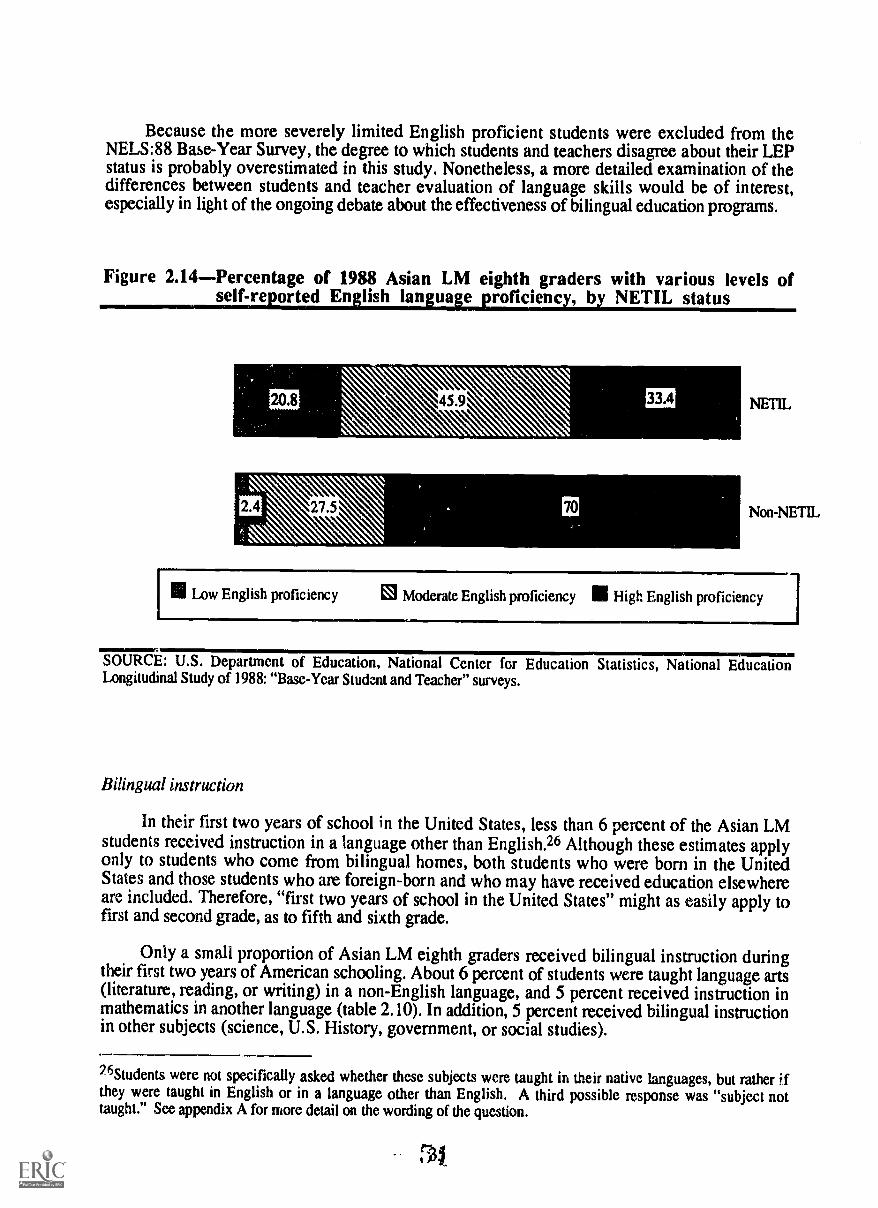
Because the more severely limited English proficient students were excluded from theNELS:88 Base-Year Survey, the degree to which students and teachers disagree about their LEPstatus is probably overestimated in this study. Nonetheless, a more detailed examination of thedifferences between students and teacher evaluation of language skills would be of interest,especially in light of the ongoing debate about the effectiveness of bilingual education programs.
Figure 2.14Percentage of 1988 Asian LM eighth graders with various levels ofself-reported English language proficiency, by NET1L status
.\\NET1L
Non-NETIL
III Low English proficiency a Moderate English proficiency 111 High English proficiency
SOURCE: U.S. Department of Education, National Center for Education Statistics, National EducationLongitudinal Study of 1988: "Base-Year Student and Teacher" surveys.
Bilingual instruction
In their first two years of school in the United States, less than 6 percent of the Asian LMstudents received instruction in a language other than English.26 Although these estimates applyonly to students who come from bilingual homes, both students who were born in the UnitedStates and those students who am foreign-born and who may have received education elsewhereare included. Therefore, "first two years of school in the United States" might as easily apply tofirst and second grade, as to fifth and sixth grade.
Only a small proportion of Asian LM eighth graders received bilingual instruction duringtheir first two years of American schooling. About 6 percent of students were taught language arts(literature, reading, or writing) in a non-English language, and 5 percent received instruction inmathematics in another language (table 2.10). In addition, 5 percent received bilingual instructionin other subjects (science, U.S. History, government, or social studies).
76Students were not specifically asked whether these subjects were taught in their native languages, but rather ifthey were taught in English or in a language other than English. A third possible response was "subject nottaught." See appendix A for more detail on the wording of the question.

Among Asian eighth graders, socioeconomic status is related to bilingual instruction inlanguage arts, but is not related to math or other subject instruction. Thirteen percent of the LMstudents with low SES itceived bilingual language arts, compared with 4 percent of high SES LMstudents. Although only language arts instruction seemed related to SES, all subsequent estimatesin this section have been adjusted for SES.
Recognized language minority students were more likely than nonrecognized LM students tohave received bilingual instruction in math courses. Eight percent of the Asian recognized LMstudents received bilingual math instruction, whereas 4 percent of the Asian nonrecognized LMstudents received this instruction. No significant differences could be discerned between the AsianNETIL st.t.lents and non-NETIL students in relation to bilingual instruction. After adjusting forsocioeconomic status, there were no variations among the proportions of students receivingbilingual instruction who had different levels of English proficiency.
Table 2.10Unadjusted and adjusted percentage of 1988 Asian LM eighthgraders receiving instruction in a non-English language during first2 ears of American schoolin , b SES and LM status*
a t_aubjecia_u_gitilLanol_gg_z_I-Enlish lan ua
Readin Math Other sub'ects
Total 5.9 5.5 4.6
Socioeconomic status(unadjusted)
Low 12.8 8.7 8.3Medium 4.8 4.4 3.3High 3.5 4.9 4.2
LM status(adjusted for SES)
Nonrecognized LM 4.5 3.6 2.9Recognized LM 4.9 8.0 6.7
* Estimates for the indicated classification have been adjusted for SES.
SOURCE: U.S. Department of Education, National Center for Education Statisfics, National EducationLongitudinal Study of 1988: "Base-Year Student and Teacher" surveys.
36 r5 2

Language minority students' involvement in language assistance programs
LM students were also asked if they had ever been enrolled in an Er.glish languageassistance program.27 Twenty-four percent of the Asian LM students responled that they hadbeen enrolled in such a program. Of those enrolled in these programs, a large proportion (69percent) had been enrolled in the first, second, or third grades; 40 percent had been enrolled in thefourth, fifth, or sixth grades; and 20 percent had been enr3lled in the seventh or eighth grades(table 2.11). Asian LM students with low SES were more likely to have been enrolled in anassistance program than high SES Asian LM students. Specifically, 36 percent of low SESstudents had been enrolled in such a program, compared with 15 percent of high SES students.Because of this relationship, all subsequent estimates in this section have been adjusted to controlfor the effect of SES.
Among Asian eighth graders, recognized LM students were more likely to have beenenrolled in a language assistance program than nonrecognized LM students (31 percent versus 18percent). Similarly, Asian NETIL students were more likely than Asian non-NETIL students tohave been enrolled in an assistance program (41 percent versus 21 percent). The differencesamong these groups with regard to when they were enrolled in the programs, although large, arenot significant.
As Asian LM students' English proficiency increases, the likelihood of their having attendeda language assistance program decreases. For example, 58 percent of the students with a lowEnglish proficiency had been enrolled in an assistance program, whereas 36 percent ofi, themoderately proficient and 16 percent of the highly English proficient students had been enrolled.In addition, students with a high English proficiency are more likely than those with a moderateproficiency to have been enrolled in the program during their primary grades. Specifically, 86percent of the students with high proficiency who attended an assistance program had beenenrolled in first, second or third grade, while only 10 percent were emohed in seventh or eighthgrade. By contrast, 59 percent of the students with moderate proficiency had been enrolled in thefirst through third grades, and 22 percent had been enrolled during the seventh or eighth.
27To examine the exact wording of the question, sec appendix A.
3753

Table 2.11-Unadjusted and adjusted percentage of 1988 Asian LM eighthgraders enrolled in a language assistance program, by SES, LM andNETIL status, and self-re orted En lish Ian ua roficienc *
Ever enrolledin languageprogam
Enrolled in1st, 2nd, 3rd grd
Enrolled in4th, 5th, 6th grd
Enrolled in7th, 8th grd
Total 23.6 68.8 40.7 20.0
Socioeconomic status(unadjusted)
Low 36.4 82.2 43.2 17.1
Medium 25.3 61.9 42.3 23.8High 14.6 63.9 34.1 16.3
LM status(adjusted for SES)
Recognized LM 31.0 66.0 44.8 16.9
Nonrecognized LM 18.4 71.0 32.6 22.7
NETIL status(adjusted for SES)
NETIL 41.4 54.4 57.0 23.1
Non-NETIL 21.5 71.2 36.8 18.8
English languageproficiency(adjusted for SES)
Low 57.6 Low-N Low-N Low-NModerate 35.6 59.1 50.2 21.6High 16.3 85.9 22.0 9.5
* Estimates for the indicated classifications have been adjusted for SES.
SOURCE: U.S. Department of Education, National Center for Education Statistics, National EducationLongitudinal Study of 1988: "Base-Year Student and Teacher" surveys.

Relationship of Asian Underachievement to Language Status and BilingualEducation
Language idennfication
For Asian students, both language minority and limited English proficiency teacher-identification is related to reading achievement. Not surprisingly, the same pattern that wasobserved between language minority status and student-reported English proficiency is also seenbetween teacher-identified LM status and reading achievement; that is, those students who arerecognized as being LM are less proficient in English than those who are LM but who are notrecognized as such. On the reading achievement test, Asian recognized LM students failed toachieve the basic reading level at a higher rate (30 percent) than Asian LM students who were notrecognized as LM (17 percent). After adjusting for SES, this relationship no longer holds (table2.12). This relationship is not evident for math achievement.
As expected, Asian NETIL students had a higher rate of underachievement on the readingtest (37 percent) than language minority non-NETIL students (20 percent), even after adjusting forSES. The diffuences between NET1L and non-NETIL students on the math achievement testwere not significant.
Table 2.12Perceqtage of 1988 Asian LM eighth graders unable to achieve thebasic reading achievement level, by LM and NIPTIL status
Reading achievementbefore SES ad'ustment
Reading achievementafter SES ad'ustment
Total 24.4 24.4
LM statusRecognized LM 30.4 26.7Nonrecognized LM 17.4 19.6
NETIL ,,tawsNETIL 41.9 37.3Non-NETIL 19.8 20.4
SOURCE: U.S. Department of Education, National Center for Education Statistics, National EducationLongitudinal Study of 1988: "Base-Year Student and Teacher" surveys.
Bilingual education
As mentioned earlier, very few Asian students ieceived bilingual education during their firsttwo years of American schooling (6 percent), Comparing achievement rates of students whoreceived bilingual education with those who did not would be inappropriate because the numbersare too small to make these comparisons while holding English proficiency constant.
39

Educational Aspirations of Asian Eighth Graders
High school plans
Thirty-eight percent of Asian eighth graders plan to enroll in an academic program duringtheir high school years, while 17 percent plan to enroll in a vocational program (figure 2.15). Tenpercent of the students indicate that they will enroll in a general program whereas 4 percent lookforward to attending a specialized high school (such as a fine arts school). The remainingproportion (31 percent) do not know what type of high school program they will enter or haveother plans.
Figure 2.15Percentage of 1988 Asian eighth graders, by intended high schoolro ram
College prep/academic program
Ea Vocational, technical, or
business program
El General high school program
El Specialized high school
El Other/unknown
SOURCE: U.S. Department of Education, National Center for Education Statistics, National EducationLongitudinal Study of 1988: "Base-Year Student" survey.
Socioeconomic status bears a relationship to the Asian students' choice of high schoolprogram. For example, 48 percent of high SES students intend to enroll in an academic program,as opposed to 25 percent of low SES students (table 2.13). In addition, a smaller percentage ofhigh SES students (27 percent) are unsure of what type of program they will select in high school(or have other plans) than low SES students (38 percent).
Even after adjusting for SES, there are some differences among the percentages of studentsof different ethnic groups intending to enroll in an academic program. Filipino and Pacific Islandev
idents are less likely to intend to enroll in an academic program when compared to South Asianstudents. For example, about 30 percent of the Filipino and 26 percent of the Pacific Islander
40

students intend to take college preparatory courses, compared with about 50 percent of the SouthAsian students. Although a similar proportion of Japanese students (48 percent) as South Asianstudents intend to enroll in an academic program, too few Japanese students were included toestablish statistical significance. The percentages of students of other ethnicides intending to enrollin an academic program fall between the high and low extremes, with no statistically significantdifferences.
Table 2.13-Unadjusted and adjusted percentage of 1988 Asian eighth gradersplanning to enroll in various high school programs, by SES,ethnicity, and self-reported English language proficiency*
Plan to enroll in ljnicnown or other plansAcademicprogram
Vocationalprogram
General Specializedprogram program
Total 37.6 17.4 9.9 4.1 31.1
Socioeconomic status(unadjusted)
Low 24.9 25.9 8.1 3.5 37.7Middle 34.4 19.6 9.3 5.1 31.5High 48.3 10.2 11.2 3.2 27.0
Ethnic groups(adjusted for SES)
Korean 49.4 11.6 17.0 6.0 22.5Japanese 48.0 11.2 8.7 7.9 24.9South Asian 46.8 20.4 7.1 2.2 23.1Southeast Asian 43.1 14.5 4.0 2.3 35.8Chinese 40.5 18.1 8.5 3.9 29.0Other Asian 29.9 17.4 13.4 4.4 32.7Filipino 29.8 22.8 9.7 3.4 34.1Pacific Islander 26.4 16.8 13.7 3.1 41.8
English proficiency(adjusted for SES)
Low 24.4 6.1 3.5 4.5 56.5Moderate 32.5 19.6 13.7 2.3 33.0High 44.5 15.4 8.9 4.1 27.4
* Estimates for the indicated classifications have been adjusted for SES.
SOURCE: U.S. Department of Education, National Center for Education Statistics, National EducationLongitudinal Study of 1988: "Base-Year Student" survey.
4157

Socloeconomic status, in addition to being related to intended high school program, is alsorelated to the Asian students' confidence in their graduating from high school. Overall, themajority of the Asian students (78 percent) are "very sure I'll graduate" from high school (figum2.16). Twenty-one percent indicate "I'll probably graduate" and one percent report they probablyor surely will not graduate from high school.28 Although the majority of all three socioeconomicclasses are very sure of their graduation, the size of that majority increases as SES increases. Forinstance, while 68 percent of low SES students are very sure of their graduation, 76 percent ofmedium SES and 86 percent of high SES students believe similarly (table 2.14).
Figure 2.16Percentage of 1988 Asian eighth graders, by confidence in highschool graduation
-T117255111
20.8
78
Very sure will graduate
Probably sure will graduate
El Probably or surely will notgraduate
SOURCE: U.S. Department of Education, National Center for Education Statistics, National EducationLongitudinal Study of 1988: "Base-Year Student" survey.
The South and Southeast Asians are very sure of their graduation from high school,particularly in comparison with Filipino and Pacific Islander students. Specifically, 88 percent and87 percent, respectively, of South and Southeast Asian students feel very sure of their graduation,while 72 percent and 67 percent, respectively, of Filipino and Pacific Islander students are thatconfident of their high school graduation. Although the percentage of Japanese students who arevery confident of their graduation (72 percent) is similar to the percentage of Filipino and PacificIslander students, too few Japanese students were sampled to establish statistical significance.Students of other ethnicities fall within those percentages and their differences are not statisticallysignificant.
28To examine the exact wording of questions used in this section, see appendix A.
42

Table 2.14-Unadjusted and adjusted percentage of 1988 Asian eighth graderswith various levels of confidence in their HS graduation, by SES,ethnicity, self-reported English language proficiency, and NETILstatus*
Very surewill graduate
Probably surewill graduate
Total 78.1 20.8
Socioeconomic status(unadjusted)
Low 67.5 29.1Medium 76.4 22.9High 85.8 13.7
Ethnic groups(adjusted for SES)
South Asian 88.5 11.1Southeast Asian 86.7 13.6Korean 86.2 13.5Other Asian 79.5 20.5Chinese 75.6 20.6Filipino 72.0 27.2Japanese 71.7 27.8Pacific Islander 67.4 30.6
English language proficiency(adjusted for SES)
Low 60.1 30.2Moderate 68.7 30.5High 83.2 15.8
SEM status(adjusted for SES)
NETIL 59.9 36.2Non-NETIL 79.2 19.8
* Estimates for the indicated classifications have been adjusted for SES.
SOURCE: U.S. Department of Education, National Center for Education Statistics, National EducationLongitudinal Study of 1988: "Base-Year Student and Teacher" surveys.
F-ture educational plans
Eighty-eight percent of Asian eighth graders plan to attend college (figure 2.17). Within thisgroup, nearly equal proportions plan on stopping after attaining a bachelor's degree versuscontinuing on to graduate school (39 percent versus 38 percent of Asian eighth graders). Inaddition, 5 percent plan to attend a vocational or business school after high school. Only 7 percent
43 59

of the students intend to graduate from high school with no pl,..ns for post-secondary education.29Socioeconomic status, again, is related to Asian students' cs.dlIcational plans. For example, 56percent of high SES students intend to pursue an advanced degree after college, while only 2percent have no plans for further education after high school (table 2.15). By contrast, only 19percent of low SES students intend to pursue an advanced degree, and 13 percent have noeducational plans after their high school graduation. Because SES is related to student's highschool plans, confidence in high school graduation and future educational plans, all subsequentestimates in this section have been adjusted to control for SES.
Figure 2.17Percentage of 1988 Asian eighth graders, by plans for furthereducation
III Graduate school
College vaduation
IS College attendance
O Postsecondary vocational school
M No plans after high schoolgraduation
SOURCE: U.S. Department Owf Education, National Center for Education Statistics, National EducationLongitudinal Study of 1988: "Base-Year Student" survey.
Even after controlling for SES, some differences appear between the various Asian ethnicgroups. Filipino and Pacific Islander students are less likely than students of most other ethnicitiesto plan on attaining an advanced degree (28 percent and 21 percent, respectively).30 In sharpcontrast, for example, the majority of the Korean students (56 percent) have an advanced degreeas their goal. The Pacific Islander students are more likely than students of all other ethnicities todiscontinue their education after high school (22 percent have no educational plans for after highschool); however, the difference between the Pacific Islander and Japanese students is notstatistically significant.
29Students were asked, "As things stand now, how far in school do you think you will get?"30The percentages of Filipino and Pacific Islander students planning to aztain an advanced degree is statisticallydifferent from those of the Korean, South Asian, Southeast Asian, and Chinese students. but not different fromthose of Japanese and Other Asian students.
44 Gu

Table 2.15-Unadjusted and adjusted percentage of 1988 Asian eighth graderswith plans to attain an advanced degree or with no educational plansafter HS, b SES, ethnicit , and LM status*
Plan to attain anadvanced degree
No plans for furthereducation after HS
Total 38.7 6.9
Socioeconomic status(unadjusted)
Low 19.0 12.7Medium 32.9 8.2High 56.3 2.1
Ethnic groups(adjusted for SES)
Korean 55.9 2.2South Asian 52.5 3.2Southeast Asian 42.2 5.2Chinese 45.8 5.1Other Asian 36.2 6.0Japanese 32.5 11.1Filipino 27.6 7.2Pacific Islander 21.1 22.2
LM status(adjusted for SES)
Recognized LM 38.7 3.5Nonrecognized LM 44.9 5.8Recognized non-LM 28.1 11.9
* Estimates for the indicated classifications have been adjusted for SES.
SOURCE: U.S. Department of Education, National Center for Education Statistics, National EducationLongitudinal study of 1988: "Base-Year Student and Teacher" surveys.
High school plans of LM students
English language proficien, y is related to students' decisions regarding high school evenafter controlling for SES. Asian students with high English proficiency are more likely than Asianstudents with lower proficiencies to plan on an academic program and less likely to have "other"or unknown plans. For example, 45 percent of the highly English proficient LM students intend toenroll in an academic program, while 27 percent have unknown or other plans (table 2.13). Bycontrast, only 24 percent of the LM students with a low English proficiency intend to enroll in anacademic program, while 57 percent have unknown or other plans.
45 61.

LM students' confidence in high school graduation
The most highly English proficient Asian students are also more confident of theirgraduation from high school, compared with Asian students with moderate proficiency. In fact,83 percent of the LM students with high proficiency are very sure that they will graduate, and 16percent are probably sure (table 2.14). By contrast, 69 percent of the moderately proficient LMstudents are very sure, while 31 percent are probably sure. A similar pattern held for NETIL andnon-NETIL Asian students. While 80 percent of the non-NETIL students are very confident oftheir high school graduation, 60 percent of the NETIL students are as confident.
Future educational plans of LM students
Interestingly, although a similar percentage of recognized and nonrecognized LM Asianstudents (39 percent and 45 percent, respectively) intend to pursue an advanced degree aftergraduation from college, a smaller percentage of recognized non-LM Asian students (28 percent)have the same intentions (table 2.15). A greater percentage of those Asian students who are notlanguage minority (that is, monolingual) than both the recognized and nonrecognized L I Asianstudents have no plans for further education after high school graduation. Specifically, 12 percentof the recognized non-LM students have no post-secondary educational plans, compared with 6percent of the nonrecognized LM students and 4 percent of the recognized LM students.
Parent' s aspirations for their children' s education
Parental expectations for their children have been hypothesized to have an effect on thescholastic achievement of the students.31 In this study, the majority of the Asian parents expecttheir children to receive a college degree (35 percent) or an advanced degree (42 percent). Only 8percent of the students have parents who expect less than college attendance (table 2.16).Moreover, some relationship between SES and parental expectations is found among Asianfamilies, with high SES parents more likely than those of low SES to expect their children toreceive an advanced degree. For example, 59 percent of the high SES students have parents whoexpect them to attain an advanced degree, compared with 25 percent of low SES students.Similarly, only 2 percent of high SES students have parents who expect them to receive only ahigh school diploma, in contrast to 15 percent of low SES stuwnts. (Because of the differingparental expectations of students with different SES, the estimates that follow have been adjustedfor SES.)
Comparisons betikeen the parents of recognized LM, nonrecognized LM, and recognizednon-LM students revealed few significant differences except for their expectations for theirchildren attaining advanced degrees. The parents of almost one-quarter (23 percei.t) of themonolingual Asian students expect their children to receive advanced degrees. By contrast, 49percent of both the recognized and nonrecognized LM Asian students have parents who expectthem to attain that level of education. This finding parallels the monolingual students' ownexpectations.
31For a review of some of the research on this subject, see R. Seginer, "Parents' Educational Expectations andChiHren's Academic Achievements: A Literature Review," Merrill-Palmer Quarterly, 29:1-23.
4664,0

Table 2.16-Unadjusted and adjusted percentage of 1988 Asian eighth gradersexpected by their parents to attain various levels o education, bySES and LM status*
jluera_e_m_cx tations:No HSdiploma
HSdiploma
Vocational Someschool college
College Advancedgraduation degiee
Total 0.1 7.4 3.6 12.0 34.9 42.0
Socioeconomic status(unadjusted)
Low 0.2 15.4 5.3 23.5 30.4 25.1Medium 0.1 9.0 5.0 13.4 39.0 34.4High 0.0 1.7 1.2 4.6 33.6 58.9
LM status(adjustc For SES)
Recubnized LM 0.2 4.2 1.8 11.6 33.6 48.7Nonrecognized LM 0.0 9.0 2.1 7.0 33.2 49.0Recognized non-LM 0.2 9.2 9.4 18.1 39.7 23.4
* Estimates for the indicated classifications have been adjusted for SES.
SOURCE: U.S. Department of Education, National Center for Education Statistics, National EducationLongitudinal Study of 1988: "Base-Year Student, Parent, and Teacher" surveys.
Relationship of Asian Underachievement to Educational Aspirations
In general, Asian students planning to enroll in an academie program fared better on both thereading and math achievement tests than those who had unknown or other plans regarding theirhigh school program. Among students intending to take academic coursework, 17 percent failedto achieve the basic reading level, and 17 percent the basic math level. In contrast, 32 percent ofthose with other or unknown plans did not achieve the basic reading level, and 28 percent thebasic math level (figure 2.18).
A relationship also existed between confidence in high school graduation and achievement.In both subject areas, the more confident Asian students performed better than the less confidentones. In particular, among the students who are very sure that they would graduate, 21 percentwere unable to achieve the basic reading level, and 20 percent the bag:c math level (figure 2.19).By contrast, 34 percent of those who were probably sure they wopy te failed to achieve thebasic reading level, and 37 percent the basic math level.
47 63

111 Academic coursework la Other/unknown plans,=1116
Figure 2.18Percentage of 1988 Asian eighth graders unable to achieve thebasic reading and math achievement levels, by intended highschool program
Patent
Reading achievement Math achievement
SOURCE: U.S. Department of Education, National Center for Education Statistics, National EducationLongitudinal Study of MR: "Base-Year Student" survey.
6.1
48

Figure 2.19Percentage of 1988 Asian eighth graders unable to achieve thebasic reading and math achievement levels, by confidence in highschool raduation
40
35
30
25
Percent 20
15
10
5
0
Reading whievement Math achievement
III Very sure will graduate la Probably sure will graduate
SOURCE: U.S. Department of Education, National Center for Education Statistics, National EducationLongitudinal Study of 1988: "Base-Year Student" survey.
Asian students who have no plans for further education after high school were more likelythan those who plan to attend college to fail to achieve the basic reading and math levels. On thereading test, 45 percent of those with no future educational plans were unable to achieve the basiclevel (figure 2.20). By contrast, about 21 percent or less of those envisioning a college educationor an advanced degree failed to achieve the basic reading level. On the math test, 51 percent of thestudents with no plans for education after high school failed to attain the basic level, as opposed toless than 23 percent of those planning to attain a college degree or an advanced degree.
Parental expectations for their children's education are directly related to the students'achievement. Asian students whose parents expect them to graduate college or receive anadvanced degree are much more likely to achieve the basic reading level than students whoseparents have lower expectations. Specifically, only 10 percent of the students whose parentsexpect them to attain a college degree and 6 percent of those whose parents expect them to receivea graduate degree failed to achieve the basic reading level (figure 2.21). On the other hand, 29percent of the students whose parents expected them to only graduate from high school did notattain the basic level of reading performance.

Figure 2.20Percentage of 1988 Asian eighth graders unable to achieve thebasic reading and math achievement levels, by students' plans forfurther education
60
50 --
40
Percent 30
20
10
Reading achievement Math achievement
All M.
No plans after high school III Plan to attain college degree III Plan to attain advanced degree
graduation
SOURCE: U.S. Department of Education, National Center for Education Statistics, National EducationLongitudinal Study of 1988: "Base-Year Student" survey.
50

Figure 2.21Percentage of 1988 Asian eighth graders unable to achieve thebasic reading and math achievement levels, by parental expectationof students' future education
Reading achievement Math achievement
Expect HS diploma only
O Expect vocational school
III Expect college degree
III Expect advanced degree
SOURCE: U.S. Department of Education, National Center for Education Statistics, National EducationLongitudinal Study of 1988: 'Base-Year Student and Parent" surveys.
On the math test the pattern was similar. Thirty-three percent of the Asian students whoseparents expect only high school graduation failed to achieve the basic math level, while 6percentof the Asian students whose parents expect them to attain a graduate degree did not achieve thatlevel.
Review
Almost three-fourths of the Asian eighth graders of 1988 come from a bilingual home.However, only slightly more than one-quarter are identified by at least one of their teachers asbeing Language Minority. About 6 percent of the non-excluded Asian student body are defined byat least one of their teachers as being Limited English Proficient. Only 6 percent of Asian studentshad received bilingual education during their first two years of American schooling; eout one-quaner of the Asian students had been involved in a language assistance program.
Only a small proportion of the Asian LM students indicate that they have a high proficiencyin their ethnic language. On the other hand, the majority of Asian LM students feel that they have ahigh English proficiency. Even among the Asian NETIL students, about one-third indicate thatthey have a high English proficiency.
About the same proportion , Asian eighth graders were born in the United States as wereborn in another country. Not surprisingly, most of the foreign-born Asian students (84 percent)are LM. However, a significant proportion of native-born Asian students (60 percent) are LM aswell. Native-born students have the advantage of being more proficient than the foreign-born, but
51
; 7

foreign-born students living in the United States for longer pefods of time are more likely to havegreater proficiency than those with shorter residzacies.
Asian LM students with a low English proficiency are less likely to plan on enrolling in anacademic high school program and are more likely to have no or "other" plans than their moreproficient counterparts. They are also less likely to be very confident of their graduation from highschool. In general, Asian students with intentions for an academic program in high school have alower failure rate on both the reading and math tests than those with unknown plans. Those with ahigh confidence in giaduation also tend to perform better on the tests.
As a whole, Asian LM students are more likely than Asian non-LM students to have the goalof pursuing an advanced degree after college and are less likely to have no plans for furthereducation after their high school graduation. Overall, Asian students with no aspirations forfurther education after high school failed to achieve basic achievement levels at higher rates thanAsian students with plans for college.
Socioeconomic status played a large role in many of the characteristics examined. Forexample, among Asian eighth graders, socioeconomic status is positively related to Englishproficiency, high aspirations for further education, confidence in high school graduation, highparental expectations for the students' further education, and achievement on the standardizedtests.
Simply coming from a bilingual home does not affect achievement for Asian students, asnon-LM and LM students had basically the same failure rate on both the reading comprehensionand math tests. Even after controlling for socioeconomic status and nativity, this similarityremains. English proficiency, however, is positively related to achievement on the reading test,with the more proficient students having a lower failure rate. English proficiency is not related toachievement on the math test.

Chapter 3
Profile and FindingsHispanic Eighth Graders
Hispanic Ethnic Groups
The majority of the Hispanic eighth graders in the United States are of Mexican or Mexican-American descent. Sixty-two percent of the NELS:88 Hispanic students describe themselves asMexican, Mexican-American, or Chicano, while 11 percent state they are Puerto Rican (figure3.1). Four percent of the students respond that they are Cuban. Almost 23 percent of the Hispanicstudents do not describe themselves according to any of these three categories and identifythemselves as "other."
!hue 3.1Percentage of 1988 His alic eighth graders, by ethnicity
Mexican/Mexican-American
El Cuban
ig Puerto Rican
IS Or 1r Hispanic
SOURCE: U.S. Department of Education, National Center for Education Statistics, National EducationLongitudinal Study of 1988: "Base-Year Studcnt" survey.

Among the four ethnic groups, Mexican-American and Puerto Rican students have thelowest socioeconomic status. Fifty-seven percent of the Mexican-American students and 47percent of the Puerto Rican students are in the lowest SES quartile (figure 3.2). Cubans and"other" Hispanics, by contrast, are primarily of middle or high socioeconomic status. Slightlymore than 20 percent of both the Cuban and "other" Hispanic students are in the highest SESquartile. Because of the differences in socioeconomic status among the various ethnic groups, theestimates for ethnic groups throughout this report have been adjusted to control for SES. Somevariables other than ethnicity have also been adjusted for SES, and when these adjusted estimatesare used, the reader will be alerted.32
Figure 3.2--Percentage of 1988 Hispanic eighth graders with various SESlevels, b ethnicit
21.8
6
33.9 20.5
i---. Low SES ESI Middle SES 1111 High SES
Mexican
Cuban
Pueito Rican
Other
SOURCE: U.S. Department of Education, National Center for Education Statistics, National EducationLongitudinal Study of 1988: "Base-Year Student" survey.
A large majority (83 percent) of the Hispanic students were born in the United States (figure3.3). Although the eighth-grade students could not be disaggregated into genealogical generations,an attempt was made to divide students into generations using the students' and parents' places ofbirth. In this scheme, first generation refers to a student who was born in another country andwho then immigrated to the United States. A second generation student is one who was um inthe United States, but who has one or both parents who were foreign-born. Third generationstudents will be U.S.-born, and they will have U.S.-born parents. This definition, of course, mayinclude many genealogical generations within the third generation. As displayed in table 3.1, only17 percent of the Hispanic eighth graders are first generation, v:hile about 41 percent are secondgeneration, and another 42 percent are third generation.
32'The adjustment removes the differences among students of different ethnic groups (or the appropriate adjustedvariable) attributable to differences in SES. See the technical appendix for a description of the adjustmentprocedure.
54 70

Fi ure 3 3Percenta e of 1988 His s anic ei hth raders, b nativit
0 Native-born
111 Foreign-born
SOURCE: U.S. Department of Education, National Center for Education Statistics, National EducationLongitudinal Study of 1988: "Base-Year Student and Parent" surveys.
I 1101111M1
Table 3.1Pi=ttErzeor 1988 tlisyanic ei eiLsi raders, b
Percent
Total 100.0
First generation 17.5Second generation 40.9Third generation or higher 41.6
SOURCE: U.S. Department of Education, National Center for Education Statistics, National EducationLongitudinal Study of 1988: "Base-Year Parent" survey.
55 71

Language Skills of Hispanic Eighth Graders
Home language proficiency
About three-fourths (77 percent) of the Hispanic eighth graders are language minorities(LM), that is, they come from homes in which a non-English language is spoken (tableAlmost all (92 percent) of the foreign-born students are LM, whiL 74 percent of the native-bornstudents are LM. There are more LM students (92 percent) among the Cuban eighth graders andfewer (67 percent) among those classified as "other" Hispanic.
Table 3.2Unadjusted and adjusted percentage of 1988 noa-LM and LMHis anic ei hth raders, b nativit and ethnicit *
Non-LM LM
Total 22.6 77.4
Nativity(unadjusted)
Native-born 26.3 73.7Foreign-born 8.3 91.7
Ethnicity(adjusted for SES)
Mexican 19.6 80.4Cuban 7.9 92.1Puerto Rican 17.6 82.4Other Hispanic 33.0 67.0
* Estimates for the indicated classification have been adjusted for SES.
SOURCE: U.S. Department of Education, National Center for Education Statistics, National EducationLongitudinal Study of 1988: "Base-Yem Student and Parent" surveys.
Even though most Hispanic eighth graders come from homes in which a non-Englishlanguage is spoken, the majority of these students do not indicate that they are very proficient intheir home !anguage. Only 16 percent of LM students indicate that they are highly proficient,while 43 percent and 41 percent indicate moderate and low home language proficiency,respectively (figure 3.4).
33Students were asked "Is any language other than English spoken in your home?" Although their ability to speakin a non-English language may be quite limited, exposure to this language has, at the very least, made thesestudents more bilingual than those who come from monolingual households.
56 7')

Most of the Hispanic I M students use their home language with only moderate frequency;less than 25 percent indicate a high use of their home language (figure 3.5). Even so, the findingthat most Hispanic LM eighth graders use their home language a moderate to high proportion ofthe time and that they do so with a moderate to high proficiency, raises questions about thestudents' bicultural experiences and their impact on the students' learning. More frequent usersindicate a higher home language proficiency; however, even among the most frequent users of anon-English language, about one-half of the students indicate that they have only a moderateproficiency (figure 3.6). This relationship remains even after controlling for SES. Someresearchers have found that bilingual children consistently underrate their ability to communicatein their home language, because they are frequently corrected by their parents as to the properform and style of their home language.34 Part of the problem arises when students attempt totranslate English words that have no equivalent in their home language. Even though students mayuse this "made up" word in a grammatically correct manner, their elders may interpret this usageas improper.
Figure 3.4--Percentage of 1988 Hispanic LM eighth graders, by level of self-re orted home lan ua e roficienc
M Low home languageproficiency
El Moderate home language
proficiency
High home language
proficiency
SOURCE: U.S. Department of Education, National Center for Education Statistics, National EducationLongitudinal Study of 1988: "Base-Year Student" survey.
34Personal conversation with Dr. Guadelupe Valdes, Professor of Education at the University of California,Berkeley.

Figure 3.5Percentage of 1988 Hispanic LM eighth graders, by frequency ofhome Ian ua e usa e
111 Infrequent usage
IN Moderate usage
111 Frequent usage
SOURCE: U.S. Department of Education, National Center for Education Statistics, National EducationLongkudinal Study of 1988: "Base-Year Student" survey.
Figure 3.6Adjusted percentage of 1988 Hispanic LM eighth graders withvarious levels of self-reported home language proficiency, by
uenc of usa e*
...........................
Infrequent users
Moderate users
Frequent users
IN Low home language El Moderate home language III High home language
proficiency proficiency proficiency
* Estimates have been adjusted for SES.
SOURCE: U.S. Department of Education, National Center for Education Statistics, National EducationLongitudinal Study of 1983: "Base-Year Student" survey.

English language proficiency
Regardless of their particular Hispanic ethnic group, most (64 percent) of the LM studentsreport that they are highly proficient in the English language. Thirty-two percent report moderateproficiency, whereas only 4 percent indicate a low English proficiency (figure 3.7).
Relationship between English and home language proficiency
Hispanic LM students with a low home language proficiency assess their Englishproficiency similarly to those with a high home language proficiency (table 3.3). More than two-thirds of these students indicate a high English proficiency, and one-fourth report a moderateEnglish proficiency. On the other hand, Hispanic LM students who are moderately proficient intheir home language are more likely than those with a low or high proficiency to assess theirEnglish proficiency at a lower level. For instance, 58 percent of the students with a moderatehome language proficiency report a high English proficiency, and 41 percent report a moderateEnglish proficiency. However, 69 percent of those qudents with either a low or high homelanguage proficiency indicate that they are highly proficient in English.
Figure 3.7 Percentage of 1988 Hispanic LM eighth graders, by level of self-re i orted En lish Ian ua e roficienc
Ell Low English proficiency
El Moderate English proficiency
III High English proficiency
SOURCE: U.S. Department of Education, National Center for Education Statistics, National EducationLongitudinal Study of 1988: "Base-Year Student" survey.
59 75

Table 3.3 Percentage of 1988 Hispanic LM eighth graders with various levelsof self-reported English language proficiency, by self-reported homeIan s ua e roficienc
English language proficiency.
Low Moderate High
Total 3.9 31.8 64,3
Home language proficiencyLow 6.0 25.3 68.7Moderate 1.4 40.6 58.0High 4.9 26.0 69.2
SOURCE: U.S. Department of Education, National Center for Education Statistics, National EducationLongitudinal Study of 1988: "Base-Year Student" snrvey.
Although this relationship between English and home language proficiency at first glanceseems a bit unusual, it has been noticed elsewhere. As debate on the subject continues, many
experts of linguistics ascribe to theories of additive and subtractive bilingualism.35 An example oft.:dditive bilingualism would be the learning of a second language by a person already proficient inthe culturally dominant language. However, subtractive bilingualism is more often experienced byethnic minorities when their home language is replaced by the more "prestigious" nationallanguage of their host country. Cummins has also suggested a threshold hypothesis for languagelearning that distinguishes between proficient, partial, and limited bilinguals. He reports thatproficient bilinguals have reached proficiency in both languages; partial bilinguals are in theprocess of adding, replacing, or subtracting a language and are proficient in one language whilelimited in another; and limited bilinguals lose proficiency in one language before gainingproficiency in another. Furthermore, Cummins theorizes that limited bilinguals, like Lambert'ssubtractive bilinguals, may never become proficient in either language.
Although there are no differences noted among ethnic groups in lylw students assess theirEnglish language proficiency, when comparing Mexican and Cuban students some slightdifferences in home language proficiency are apparent. F'or example, about 14 percent of bothethnic groups indicate a high home language proficiency (table 3.4). However, Cubans are morelikely than Mexicans to indicate that they are moderately proficient iii their home language (57percent versus 41 percent).36
35The theories of Lambert and Tucker (1972), Skutnabb-Kangas and Toukomaa (1979), and Cummins (1976,1978)are reviewed by D.P. Dolson in "Bilingualism and Scholastic Performance: The Literature Revisited," NABEJournal, X (1985):1-35.36The difference in the percentages of Cuban and Other Hispanic students indicating a moderate home languageproficiency is also statistically significant.

Relationship between language proficiency and socioeconomic status
Socioeconomic status is found to be strongly related to English proficiency among HispanicLM students. That is, as SES increases, the percentage of LM students having a higher Englishproficiency increases as well. For instance, 83 percent of high SES Hispanic LM students have ahigh English proficiency, while only 56 percent of the low SES Hispanic LM students indicatebeing highly proficient in English (table 3.5). Likewise, less than 1 percent of high SES studentsindicate a low English proficiency, while 5 percent of the low SES students report this sameEnglish proficiency.
Home language proficiency, on the other hand, decreases with increasing socioeconomicstatus among Hispanic LM students. However, the differences are not as great as they are forEnglish proficiency. For example, 19 percent of low SES students indicate they are highlyproficient in their home language, compared with 11 percent of high SES students. Thirty-sixpercent of low SES students have low proficiency in their home language, while 48 percent ofhigh SES students indicate this same level of proficiency.
Table 3.4-Adjusted percentage of 1988 Hispanic LM eighth graders withvarious levels of self-reported home language proficiency, byethnicity and U.S. residence*
Home language proficiency
Low Moderate High
Total 40.8 42.8 16.4
Ethnic groups(adjusted for SES)
Mexican 43.7 41.4 15.0Cuban 29.0 56.9 14.1Puerto Rican 35.2 45.2 19.7Other Hispanic 37.1 43.7 19.2
Student's U.S. residence(adjusted for SES)
Native-born 44.8 40.6 14.5<6 years 20.9 37.9 41.26-8 years 18.8 52.2 29.09-11 years 26.7 56.5 16.8>11 years 36.2 47.0 16.7
* Classification estimates have been adjusted for SES.
SOURCE: U.S. Department of Education, National Center for Education Statistics, National EducationLongitudinal Study of 1988: "Base-Year Student and Parent" surveys.
61 77

Table 3.5Percentage of 1988 Hispanic LM eighth graders with various levelsof self-re orted En lish and home Ian ua e roficienc b SES
English language proficiency Home language proficiency
Low Moderate High Low Moderate High
Total 3.9 31.8 64.3 40.8 42.8 16.4
Socioeconomic statusLow 5.4 39.1 55.6 35.5 45.1 19.4Middle 2.7 24.7 72.6 46.8 40.0 13.2High 0.1 16.6 83.3 48.2 40.3 11.5
SOURCE: U.S. Department of Education, National Center for Education Statistics, National EducationLongitudinal Study of 1988: "Base-Year Student" survey.
Relationship between language proficiency, birthplace, and residence in the United States
Hispanic LM students who are natives of the United States, not surprisingly, are moreproficient in English than their foreign-born peers. Specifically, 70 percent of the native-bornHispanic LM students have a high English proficiency, as opposed to 46 percent of the foreign-born Hispanic LM students (figure 3.8). However, as the length of students' residency increases,the percentage indicating a high English proficiency rises as well. In fact, the percentage offoreign-born students who have resided in the United States for more than 11 years and who arehighly English proficient is not significantly different from that of native-born students with a highEnglish proficiency (figure 3.9). (Because of the relationship between SES and English languageproficiency, the estimates in the preceding and following paragraphs have been adjusted to controlfor SES.)

Figure 3.8Adjusted percentage of 1988 Hispanic LM eighth graders withvarious levels of self-reported English language proficiency, bynativit * AMI
Native-born
Foreign-born
LII Low English proficiency . Moderate English proficiency III High English proficiency
* Estimates have been adjusted for SES.
SOURCE: U. Department of Education, National Center for Education Statistics, National EducationLongitudinal Study of 1988: "Base-Year Student and Parent" surveys.
The student's place of birth is also related to home language proficiency. The majority ofU.S. native-born Hispanic LM students have a low (45 percent) or moderate (41 percent) homelanguage proficiency (figure 3.10). By contrast, almost one-half (49 percent) of the foreign-bornHispanic LM students have a moderate home language proficiency, while 25 percent indicatebeing highly proficient.
63 7`')
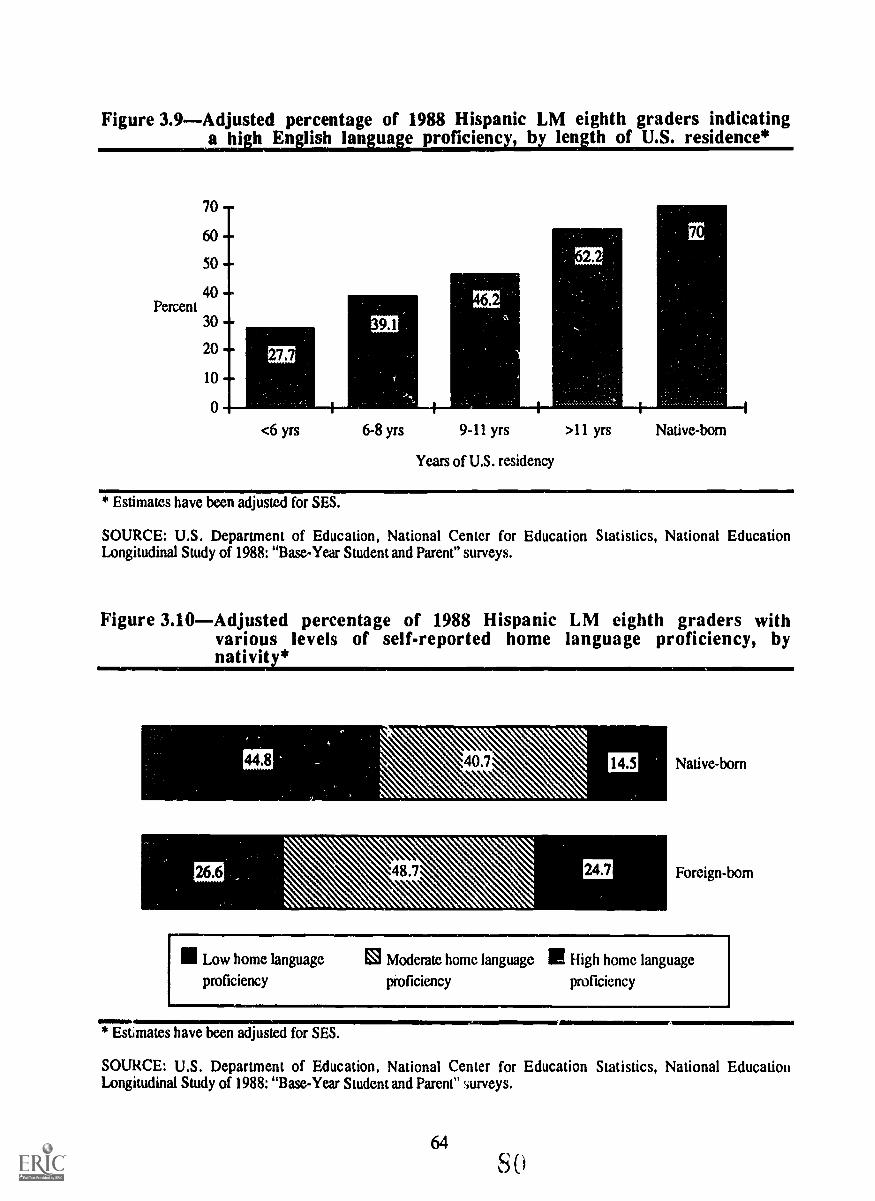
Figure 3.9Adjusted percentage of 1988 Hispanic LM eighth graders indicatinga hi h English language proficiency, by length of U.S. residence*
70
60
50
40Percent
30 --
20
10
0
<6 yrs 6-8 yrs 9-11 yrs >11 yrs
Years of U.S. residency
Native-born
* Estimates have been adjusted for SES.
SOURCE: U.S. Department of Education, National Center for Education Statistics, National EducationLongitudinal Study of 1988: "Base-Year Student and Parent" surveys.
Figure 3.10Adjusted percentage of 1988 Hispanic LM eighth graders withvarious levels of self-reported home language proficiency, bynativit *
44.8
26.6
[--Low home language la Moderate home language 111 High home language
Native-born
Foreign-born
proficiency proficiency
* Est:rnates have been adjusted for SES.
proficiency
+1==IF
SOURCE: U.S. Department of Education, National Center for Education Statistics, National EducationLongitudinal Study of 1988: "Base-Year Student and Parent" surveys.
64
s

As Jength of residency increases, home language proficiency appears to decrease. Inparticular, 41 percent of the Hispanic LM students who have resided in the United States for lessthan 6 years indicate a high home language proficiency, whereas only 17 percent of the HispanicLM students who have been living here for more than 9 years indicate this same proficiency (table3.4). The percentage of foreign-born LM students who have resided in the United States for momthan 6 years and who are highly proficient in their home language is not significantly differentfrom the percentage of highly proficient native-born LM students.
Relationship between parent' s and student' s language proficiency
Student's and parent's English proficiency levels are directly related, with parents who aremore proficient in English being more likely to have children who are also highly Englishproficient. In fact, 73 percent of the Hispanic LM students with highly English proficient parentsare also highly proficient in English, whereas 54 percent of the Hispanic LM children ofparentswith a low English proficiency are highly proficient (table 3.6). Similarly, 24 percent of thestudents with highly proficient parents have a moderate English proficiency, compared with 39percent of the students whose parents have low proficiency. (These estimates have been adjustedto control for SES.)
Table 3.6Adjusted percentage of 1988 Hispanic LM eighth graders withvarious levels of self-reported English language proficiency, byres onding parent's ua e roficim *
EngEstlangnage
Low Moderate H h
Total 3.9 31.8 64.3
Parent's Englishlanguage proficiency(adjusted for SES)
Low 7.4 38.5 54.1Moderate 0.9 36.0 63.1High 2.0 24.3 73.7
* Classification estimates have been adjusted for SES.
SOURCE: U.S. Department of Education, National Center for Education Statistics, National EducationLongitudinal Study of 1988: "Base-Year Student and Parent" surveys.
65 S

Relationship of Hispanic Underachievement to Ethnicity and LanguageProficiency
Ethnicity
Similar percentages of Mexican and Cuban LM students were unable to attain the basicreading level (28 percent and 31 percent, respectively). The percentage of Puerto Rican LMstudents who were also unable to reach this reading level was higher (41 percent); however, theonly difference that is statistically significant exists between the Mexican and Puerto Ricanstudents (table 3.7). The relationship between the ethnicity of the LM students and theirachievement on the math test is not significant.
Table 3.7Adjusted percentage of 1988 Hispanic non-LM and LM eighthgraders unable to achieve the basic reading and math achievementlevels, b ethnicit *
Reading achievement Math achievement
Non-LM LIVI Non-LM LM
Total 30.2 31.0 16.1 36.6
Ethnic groups(adjusted for SES)
Mexican 29.4 28.1 39.7 35.4Cuban Low-N 30.6 Low-N 33.8Puerto Rican 37,5 41.1 48.0 42.4Other Hispanic 26.2 35.3 25.3 37.4
* Classification estimates have been adjusted for SES.
SOURCE: U.S. Department of Education, National Center for Education Statistics, National EducationLongitudinal Study of 1988: "Base-Year Student" survey.
Language use and proficiency
Overall, the same percentage of Hispanic LM and non-LM students were unable to achievethe basic level in reading (about 30 percent) and in math (about 36 percent). Even whencontrolling for socioeconomic status and nativity, this similarity remains.

However, proficiency in the English language among Hispanic LM students was stronglyrelated to reading and math achievement. As English proficiency increased, the percentage ofthose who failed to achieve the basic levels decreased. Sixty-nine percent of the low Englishproficient Hispanic students failed to reach the basic level on the reading test, compared with 34percent of the moderately proficient and 28 percent of the highly proficient. On the math test, 58percent of the low English proficient Hispanic students failed to achieve the basic level, comparedwith 37 percent of the moderately proficient and 35 percent of the highly proficient (figure 3.11).(Estimates of the relationships between English proficiency and underachievement have beenadjusted to control for SES).
Figure 3.11Adjusted percentage of 1988 Hispanic LM eighth graders unable VIachieve the basic reading and math achievement levels, by self-reyorted English language proficiency*
Percent
70
60
50 --
40 --
30 -
20
10
68.9
'EMEN3=
Reading achievement Math achievement
111 Low English proficiency 10 Medium English proficiency El High English proficiency
* Estimates have been adjusted for SES.110MIlt
SOURCE: U.S. Department of Education, National Center for Education Statistics, National EducationLongitudinal Study of 1988: "Base-Year Student" survey.
Socioeconomic status
Greater proportions of Hispanic students with higher SES achieved above the basic levelson both tests than those with lower SES. Although 19 percent of high SES students could notachieve the basic reading level, almost twice that percentage of low SES students (37 percent)could not reach this ,evel (figure 3.12). A similar pattern emerged on the math test: 22 percent ofthe high SES students did not achieve the basic level, compared with 42 percent of those with lowS ES .
67 83

1
11 Low SES ta Middle SES 11 High SES
The relationship between SES and achievement persisted among Hispanic students even
when English proficiency was held constant. For example, among the LM eighth graders with
high English proficiency, 32 percent of the low SES students failed to achieve the basic reading
level, compared with only 16 percent of the high SES students (table 3.8). The same was true for
math achievement. Low SES LM students with high English proficiency failed to achieve at the
basic math level at a higher rate (40 percent) than those LM students with high SES (24 percent).
Figure 3.12Percentage of 1938 Hispanic eighth graders unable to achieve thebasic readin and math achievement levels, b SES
Percent
45
40
35 .30
25
20
15 .-10
5
Reading achievement Math achievement
SOURCE: U.S. Department of Education, National Center for Education Statistics, National Education
Longitudinal Study of 1988: "Base-Year Student" survey.
Table 3.8--Percentage of 1988 Hispanic LM eighth graders with various SESlevels unable to achieve the basic reading and math achievementlevels, b self-re oiled Er. lan
Reading achievement
Socioeconomic status
Math achievement
Socioeconomic status
Low Middle High Low* Middle Hi h
Total 36.8 26.6 18.8 41.8 33.9 22.0
English proficiencyLow 70.4 Low-N Low-N 56.6 Low-N Low-N
Moderate 39.2 25.9 35.6 39.6 37.0 30.8
High 32.0 24.0 5.8 40.4 30.6 23.6
* Although the differences seem large, the estimates in this column are not statistically different from each other.
SOURCE: U.S. Department of Education, Ndtional Center for Education Statistics, National EducationLongitudinal Study of 1988: "Base-Year Student" survey.
68

Teacher Identification of Hispanic Eighth Graders
Two teachers fPr each eighth grader included in the NELS:88 study were also surveyed.Each teacher was asked to indicate whether the student was language minority (LM) and alsowhether the student had limited English proficiency (LEP). This ster'j combined the two teachers'responses into one "teacher identification"; students were teacher-identified as LM ifone of thefollowing occurred: (a) both teachers indicated that the student was LM; (b) only one teacherresponded to the question and indicated that the student was LM; or (c) one teacher indicated thatthe student was LM and the other teacher did not. Thus, if at least one teacher identified thestudent as LM, the student was teacher-identified as LM. The same process determined the teacheridentification of LEP: if at least one teacher indicated that the student was LEP, the student wasteacher-identified as LEP. The description used in this report is non-excluded teacher-identifiedLEP (NETIL).37
In this section, the teachers' evaluations of the eighth grader's LM and LEP status arecompared with the students' reports of whether or not a second language is spoken in the homeand the students' self-reported English language proficiency. The results indicate that teachers andstudents often have different views of the LM and LEP status of the students.
Recognized and nonrecognized language minority students
Among Hispanic eighth graders, 76 percent indicate that a second language is spoken in thehome. However, only 39 percent of Hispanic students are teacher-identified as being languageminority (figure 3.13). The majority of Hispanic students who are from monolingual homes areidentified by their teachers as not being LM: 24 percent Hispanic students indicate that onlyEnglish is spoken in the home, and all but 4 percent of these students are identified by teachers asnot being language minority. For this analysis, when students and teachers have a differentassessment of whether or not the student is LM, regardless of the nature of the disparity, thosestudents are called nonrecognized language minority in order to relate the disparity between thestudent and teacher responses.
Overall, 55 percent of the Hispanic students agree with their teachers about the students'language minority status (35 percent LM and 20 percent non-LM), while 45 percent disagree (41percent are from bilingual homes and teacher-identified as non-LM, and 4 percent from English-only homes and teacher-identified as LM). In order to distinguish between the 76 percent ofHispanic students who are LM and the 35 percent of Hispanic students who are not only LM butalso teacher-identified as such, the term recognized LM is used for the latter group. Similarly,recognized non-LA lenotes those non-LM students who are teacher-identified as non-languageminority. The third category, mentioned 0 _we and called nonrecognized LM, denotes studentswhose answers regarding their LM status do not match their teacher's identification. Most of thestudents within this category are LM and identified as non-LM, but a small minority are non-LMand identified as LM.
37As explained in the first chapter, student:1 were excluded from the base-year survey if they we,re thought to haveinsufficient English skills to fill out thc survey forms and tests. Therehre, die most limited English proficientstudents were not included. See appendix B for further information about Om LM and NET1L variables.
69 c,0 0

Figure 3.13Percentage of 1988 Hispanic eighth graders, by teacher- andstudent-re orted LM status
3.6
20.2
35.4
40.8
III Bilingual homeidentified as non-LM
Bilingual home
identified as LM
O Monolingual home
identified as LM
III Monolingual homeidentified as non-LM
SOURCE: U.S. Department of Education, National Center for Education Statistics, National EducationLongitudinal Study of 1988: "Base-Year Student and Teacher" surveys.
The English language proficiency of the recognized LM Hispanic eighth graders wascompared with the proficiency of the nonrecognized LM students. In general, the nonrecognizedLM students are more proficient in English than the recognized LM students. For example, 74percent of the Hispanic nonrecognized LM students are highly proficient in English, as opposed toonly 56 percent of the Hispanic recognized LM students (figure 3.14). Similarly, only 1 percentof the nonrecognized LM eighth graders have a low English proficiency, compared with 6 percent
of the recognized LM students.38
These results indicate that if the language minority status of studentY is determined solely bytheir teachers, a significant proportion of students who are from bilingual homes are not beingevaluated as language minority. Furthermore, incluaing these nonrecognized I,M students withteacher-identified language minority students would significantly change an evaluation of theEnglish proficiency level of language minority students.
38Students who responded that only English was spoken in the home were not asked to assess their language skills.In this instance, thcrefoic, the nonrecognized LM category does not include the 4 percent of students who stated thatthey came from a monolingual home and whose teachers defined them as languageminority.
70S 6

Figure 3.14Percentage of 1988 Hispanic LM eighth graders with variouslevels of self-reported English language proficiency, by LMreco nition
55.9
L., Low English proficiency El Moderate English proficiency 111 High English proficiency
Recognized LM
Nonrecognized LM
SOURCE: U.S. Department of Education, National Center for Education Statistics, National EducationLongitudinal Study of 1988: "Base-Year Student and Teacher" surveys.
Non-excluded teacher-identified limited English proficient students
About 8 percent of the Hispanic eighth graders included in the sample are identified by atleast one of their teachers as having limited English proficiency. However, among these students,more than one-third (36 percent) report that they have relatively high English proficiency, while45 percent indicate moderate proficiency. By comparison, among Hispanic language minoritynon-NETIL students, 68 percent indicate they are highly proficient, and 30 peicent reportmoderate proficiency (figure 1.15).
Because the more severely limited English proficient students were excluded from theNELS:88 Base-Year survey, the degree tc which students and teachers disagree about thestudent's LEP status is probably overestimated in this sty -wever, a more detailedexamination of the differences between student and teacher eval.,;, Ith; anguage skills would beof interest, particularly in light of the ongoing debate about the eti .s of bilingual educationprograms.

Figure 3.15 Percentage of 1988 Hispanic LM eighth graders with variouslevels of self-reported English language proficiency, by NET1Lstatus
68.2 Non-NETIL
M Low English proficiency El Moderate English proficiency 1111 High English proficicncy
SOURCE: U.S. Department of Education, National Center for Education Statistics, National EducationLongitudinal Study of 1988: "Base-Year Student and Teacher" surveys.
Bilingual instruction
During their first 2 years in school in the United States, less than 10 percent of the HispanicLM students received instruction in a language other than English (table 3.9).39 Although theseestimates apply only to students who come from bilingual homes, both students who were born inthe United States and those who welt: foreign-born are included. Therefore, "first 2 years ofschool in the United States" might as easily apply to first and second grade as to fifth and sixthgrade.
A small proportion of Hispanic LM eighth graders reuived bilingual instruction in their first2 years of American schooling. About 8 percent of e Hispanic students weie taught languagearts (United States literature, reading, or writing) in a non-English language, and 8 percentreceived instruction in mathematics in another language. Six percent received bilingual instructionin other subjects (science, United States history, government, or social studies). A clearrelationship exists between socioeconomic status and whether or not students received bilingualinstruction. About 10 percent of the low SES Hispanic LM students received bilingual instruction,in comparison with less than 3 percent of the high SES Hispanic LM students. Because of therelationship between SES and bilingual instruction, estimates in the rest of this section have beenadjusted to control for SES.
39Students wcrc not sp, ;fically asked whether these subjects were taught in their native languages, but rather ifthey were taught in Ern c r in a language othe,.. than English. A third possible response was "subject nottaught." See appendix A more detail on the wording of thc question.
72S S

Table 3.9-Unadjusted and adjusted percentage of 1988 Hispanic LM eighthgraders receiving instruction in a non-English language during first 2years of American schooling, by SES, nativity, LM status, and self-reported En -fish roficienc *
h language
Language Arts Mathematics Other subjects
Total 8.5 8.0 6.5
Socioeconomic status(unadjusted)
Low 11.8 10.5 9.2Middle 5.1 5.7 3.8High 2.2 2.0 1.6
Student's nativity(adjusted for SES)
Native-born 6.7 5.4 4.6Foreign-born 12.2 16.4 11.3
LM status(adjusted for SES)
Recognized LM 7.5 9.0 6.4Nonrecognized LM 7.8 5.5 5.5
English proficiency(adjusted for SES)
Low 16.8 37.6 31.4Moderate 13.0 11.4 8.9High 5.7 4.4 3.8
* Estimates for the indicated classifications have been adjusted for SES.
SOURCE: U.S. Department of Education, National Center for Education Statistics, National EducationLongitudinal Study of 1988: "Base-Year Student, Parent, and Teacher" surveys.
Native-born students were less likely to have been instructed in a non- ',nglish language thanforeign-born students. Specifically, 7 percent of native-born Hispanic LM students were taughtlanguage arts in a non-English language, and 5 percent were taught math in a non-Englishlanguage (table 3.9). By contrast, 12 percent of the foreign-born Hispanic LM students wereinstructed in language arts, and 16 percent were taught math in a non-English language.
73 S

Among Hispanic eighth grauers, recognized LM students were more likely thannonrecognized students to have received math instruction in a non-English language (9 percentversus 6 percent). However, similar differences for langtrge arts instruction and other subjectscould not be discerned. After adjusting for SES, no differences could be observed betweenHispanic NETIL and non-NETIL students in bilingual instruction.
Hispanic LM students with a higher self-reported English proficiency were less likely thanthose with a moderate or low proficiency to have received English or math instruction in a non-English language. For instance, 6 percent of the highly English proficient students receivedbilingual language arts instruction, compared with 13 percent of the students with a moderateEnglish proficiency. Likewise, 4 percent of the highly English proficient students receivedbilingual math instruction, as opposed to 12 percent of the students with moderate proficiency and38 percent of the students with low proficiency.
Language minority students' involvement in language assistance programs
LM students were also asked if they had ever been enrolled in an English languageassistance program.'" Twenty percent of the Hispanic LM students responded that they had beenenrolled in such a program (table 3.10). Again, LM students with low SES were more likely tohave been enrolled in an assistance program than LM students with moderate or high SES.Specifically, 25 percent of low SES Hispanic students had taken advantage of such a program, incomparison with 12 percent of high SES Hispanic students. In general, a large proportion (66percent) were enrolled in the first, second or third grades. Almost one-half (45 percent) wereenrolled in the fourth, fifth oi sixth grades, and 19 percent were enrolled in the seventh or eighthgrades. !Because of the relationship between SES and enroilment in language assistanceprograms, the following estimates have been adjusted to control for SES.)
Hispanic recognized LM students were more likely to have been enrolled in a languageassistance program than Hispanic non:ecognized LM students (26 percent versus 14 percent).Similarly, NET1L students were more likely than non-NETIL students to have been enrolled in anassistance program (43 percent versus 17 percent). In addition, NETIL students' nvoivement insuch programs tended to be more recent than non-NETIL students. Among the Hispanic NETILstudents who had participated in an assistance program, 46 percent were enrolled in the firstthrough third grade and 38 percent in the fourth through sixth grade. By contrast, 74 percent ofthe Hispanic non-NETIL students who participated in a language program had been involved,.during the first through third grade and 39 percent during the fourth through sixth grade.
Again, as students' English proficiency increases, the likelihood of their having attended alanguage assistance program decreases. For example, one-half of those Hispanic eighth graderswith low English proficiency had been enrolled in a language assistance program, in comparisonwith 14 percent of those who are highly proficient.
40To examine the exact wording of the question, see appendix A.
74 9 0

Table 3.10-Unadjusted and adjusted percentage of 1988 Hispanic LM eighthgraders enrolled in a language assistance program, by SES, LM andNET1L status, and self-re cu. ua e roficienc *
Ever enrolledin language
ro 'amEnrolled in
1st, 2nd, 3rd grdEnrolled in
4th, 5th, 6th grdEnrolled in7th, 8th d
Total 20.1 66.4 45.1 18.9
Socioeconomic status(unadjusted)
Low 24.7 69.5 4.5.1 14.3Medium 15.4 59.4 46.6 27.8High 11.9 Low-N Low-N Low-N
LM status(adjusted for SES)
Recognized LM 25.6 65.8 45.0 16.0Nonrecognized LM 13.8 70.3 40.3 20.2
NETIL status(adjusted for SES)
NETIL 42.8 45.9 57.6 29.3Non-NETIL 17.2 74.1 38.9 14.1
English proficiency(adjusted for SEr))
Low 50.1 33.9 52.7 33.6Moderate 29.1 65.2 49.3 21.0High 13.7 76.3 38.3 12.0
* Estimates for the indicated classifications have been adjusted for SES.
SOURCE: U.S. Department of Education, National Center for EducationLongitudinal Study of 1988: "Base-Year Student and Teacher" surveys.
75 91
Statistics, National Education

Relationship c.1' Hispanic Underachievement to Language Status and BilingualEducation
Language minority status
After adjusting for SES, LM students who weie not recognized as language minority failedthe reading and math tests in similar proportions as those LM students who were recognized aslanguage minority (tabie 3.11). On the reading test, 27 percent of the nonrecognized LM studentsfailed to achieve the basic level, crnvared with 33 percent of the recognized LM students. On themath test, 33 percent of the nonn.cognized LM students failed to reach the basic level, while 37percent of the recognized LM students did the same. It is interesting to note that the reading failurerates between nonrecognized LM students and non-LM students did not differ significantly.
Hispanic eighth graders who came from homes where only English was spoken (non-LM)but who were identified as language minority (nonrecognized LM) were more apt to fail to achievethe basic math level (45 percent) than those students who were LM but who were not recognizedas sucii (33 percent). The same pattern was not observed, however, for reading achievement.41
Table 3.11Adjusted percentage of 1988 Hispanic eighth graders una:)!e toachieve the basic reading and math achievement 1..:ve:3, by LAI.status*
Reading achievement Math achievement
Non-LM LM Non-LM LM
Total 30.2 31.0 36.1 36.6
LM status(adjusted for SES)
Recognized LM 33.0 36.8Nonrecognized LM 27.3 26.9 44.9 32.7Recognized non-LM 28.2 34.0
These cells are empty. Non-LM stv.lents are either rexgnized non-LM or nonrecognized LM; LM students Ineither recognized LM or nonrecognized LM. Placement depends upon teacher descriptions. See pap 69.
* Classification est'mates have been adjusted for SES.
SOURCE: U.S. Department of Education, Natk Aal Center for Education Statistics, National EducationLongitudinal Study of 1988: "Base-Year Student and 'reacher" surveys.
41Return to page 69 for the definition of nonrocognized LM students.
750 0k.)

Bilingual education
After adjusting for SES and holding English Ivroilciency constant, the differences observedin reading and math failure rates between Hispanic LM students who rec dived bilingual instructionin their first 2 years of American schoohl!g and those who did not were not significant.
Educational Aspirations of Hispanic Eighth Graders
High school plans
Twenty-three percent of the Hispanic eighth graders plan to enroll in an academic programduring their high school years, and a similar proportion of students (22 percent) plan to enroll in avocational program. Eleven percent of the Hispanic students indicate they will participate in ageneral program, while 5 percent look forward to attending a specialized high school (such as afine arts school). The remaining proportion of students do not know which high school programthey will enter (figure 3A6).42
Figure 3.16Percentage of 1988 Hispanic eighth graders, by intended high
College prep/academic program
El Vocational, technical, orbusiness program
0 General high school program
la Specialized high school
0 Other/unhown
SOURCE: U.S. Department of Education, National Center for Education Statistics, National EducationLongitudinal Study of 1988: "Base-Year Student" survey.
42This percentage also includes students who reported having "other" plans. To examine the exact wording of allquestions used in the following sections, see appendix A.
77

Most Hispanic studInts (71 percent) are very sure that they will graduate from high school.Twenty-six percent report that they will probably graduate, while 3 percent reply that theyprobably or surely will not graduate from high schooi (figure 3.17).
Among Hispanic eighth graders, these aspiration patterns remain similar regardless ofethnicity. However, socioeconomic status is related to both the students' choices of high schoolprogram and their confidence in their eventual high school graduation. For example, far more highSES Hispanic students intend to enroll in an academic program (39 percent) than middle SESstudents (25 percent) or low SES students (17 percent) (table 3.12). In addition, low SESstudents are more likely than high SES students to be planning a vocational program (24 percentversus 15 percent). Finally, a larger percentage of low SES Hispanic students (44 percent) areunsure of their intended program in high school (or have made other plans) than either middle orhigh SES students (36 percent and 30 percent, respectively).
Figure 3.17Percentage of 1988 Hispanic eighth graders, by confidence in highschool graduation
-Kgr---1111001.-
3.5
25.8\\\70.7
Very sure will graduate
MI Probably sure will graduate
El Probably or surely will not
graduate
SOURCE: U.S. Department of Education, National Center fcr Education Statistics, National EducationLongitudinal Study of 1988: "Base-Year Student" survey.
78

Table 3.12 Unadjusted and adjusted percentage of 1988 Hispanic eighthgraders planning to enroll in various HS programs, by SES and self-reported En lish profkiency*
r planjAcademicprogram
Vocationalprogram
Generalprogram
Specializedprogram
Total 22.5 22.3 10,6 5,2 39.4
Socioeconomicstatus(unadjusted)
Low 17.2 24.0 9.9 4.8 44.1
Medium 24.7 22.1 11.4 5.8 36.0High 38.9 15.5 11.3 4.4 30.0
English proficiency(adjusted for SES)
Low 11.5 30.4 7.1 2.5 48.5
Moderate 20.3 23.4 10.0 3.3 42.5High 24.6 22.3 10.6 6.2 36.4
* Estimates for the indicated classification have been adjusted for SES.
SOURCE: U.S. Department of Education, National Center for Education Statistics, National EducationLongitudinal Study of 1988: "Base-Year Student" survey.
Although the majority of Hispanic eighth graders from all socioeconomic levels are verysure they will graduate, the size of that majority grows as SES increases. For example, 62 percentof low SES students are very sure that they will graduate, and 77 percent of middle SES studentsand 88 percent of high Si.'S students believe similarly (table 3,13). On the other hand, 5 percent oflow SES students believe they probably or surely will not graduate. In contrast, only 2 percent ofthe middle SES students think they might not gyaduate, and not graduating is an idea that occurs toless than 1 percent of the high SES students.
79

Table 3.13Unadjusted and adjusted percentage of 1988 Hispanic eighthgraders with various levels of confidence in their HS graduation, bySES, NETIL status, and self-reported English language proficiency*
Very surewill graduate
Probably surewill graduate
Pu.lbab1y/surelywill rlot graduate
Total 70.7 25.8 3.5
Socioeconomic status(unadjusted)
Low 61.7 33.0 5.3Medium 77.3 20.7 2.0High 87.7 11.6 0.7
NETIL status(adjusted for SES)
NETIL 56.1 36.4 7.5Non-NETIL 72.7 24.4 2.9
English language proficiency(adjusted for SES)
Low 55.1 35.4 9.5Moderate 62.6 34.0 3.3High 75.1 22.4 2.5
* Estimates for the indicated classifications have been adjusted for SES.
SOURCE: U.S. Department of Education, National Centcr for Education Statistics, National EducationLongitudinal Study of 1988: "Base-Year Student and Teacher" surveys.
Future educational plans
With regard to educational plans after high school, 21 percent of the Hispanic eighth gradersplan to continue their education after college; 33 percent plan to graduate from college; 17 percentplan to at least attend college; and 11 percent plan to attend a vocational or business school afterhigh school g aduation (figure 3.18). About 18 percent of the Hispanic students intend to graduatefrom high school and have no intentions to pursue any further education.43
43Students were asked "As things stand now, how far in school do you think you will get?"
80

Figure 3.18Percentage of 1988 Hispanic eighth graders, by plans for furthereducation
III Graduate school
El College graduation
College attendance
O Post-secondary vocational school
111 No plans after HS graduation
SOURCE: U.S. Department of Education, National Center for Education Statistics, National EducationLongitudinal Study of 1988: "Base-Year Student" survey.
Among Hispanic eighth graders, SES is related to students' further aspirations after highschool. About 40 percent of high SES Hispanic students intend to attain a college degree, and 45percent plan to continue their education after college (table 3.14). By contrast, less than one-third(28 percent) of the low SES Hispanic students plan to receive a college degree, and only 16percent intend to continue their education after college. Similarly, only 3 percent of high SESstudents have no plans for further education after high school, while 23 percent of low SESstudents do not intend to continue their education after high school. Because students' high schooleducation plans, confidence in high school graduation, and plans for further education are allrelated to their socioeconomic status, estimates in the following sections have beer adjusted tocontrol for SES.
High school plans of LM students
English proficiency, as measured by Hispanic LM students' self-assessment, is slightlyrelated to intended high school program, after taking socioeconomic status into account. Forexample, Hispanic LM eighth graders with a low English proficiency are less likely than thosewith a high proficiency to plan on an academic program (table 3.12). Specifically, 25 percent ofthe highl proficient students plan on an academic program, in comparison with 12 percent of thelow proficient students. In addition, highly proficient students are less likely to hne "other" orunknown plans than students with a moderate proficiency (36 percent versus 42 percent).
819 7

Table 3.14-Unadjusted and adjusted percentage of 1988 Hispanic eighthgraders with various future educational plans, by SES, NETILstatus, and self-re orted En lish proficienc *
Attain Graduate Attend Attend Have no
advanced from some vocational educ. plans
ciim_:Ie ccilgle e college school after HS
Total 21.5 33.2 17.1 10.7 17.5
Socioeconomicstatus(unadjusted)
Low 15.8 28.4 18.7 13.7 23.4
Medium 22.1 37.5 16.8 9.4 14.1
High 45.2 39.3 10.5 1.9 3.0
NETIL status(adjusted for SES)
NETIL 18.7 23.8 13.6 13.8 30.1
Non-NETIL 21.8 33.8 17.3 10.8 16.4
English proficiency(adjusted for SES)
Low 9.0 23.2 11.0 18.7 38.2
Moderate 21.3 32.6 17.4 10.3 18.4
High 23.9 33.1 18.6 10.0 14.4
* Ectimates for the indicated classifications have been adjusted for SES.
SOURCE: U.S. Department of Education, National Center for Education Statistics, National Education
Longitudinal Study of 1988: "Base-Year Student andTeacher" surveys.
LM students' confidence in high school graduation
NETIL students and those with a moderate English proficiency are less confident that they
w:11 graduate from high school than Hispanic eighth graders who are more proficient in English.
Among Hispanic NETIL students, only 56 percent are very sure of graduation, and 36 percent are
probably sure (table 3.13). Among Hispanic non-NETIL students, on the other hand, 73 percent
are very sure of their graduation, and 24 percent are probably sure. The confidence levels of the
low and moderately proficient students mirror those of the NETIL students, while the highly
English proficient students' feelings are similar to those of the non-NETIL students. Seventy-five
percent of the highly proficient Hispanic students are very sure that they will graduate, and 22
percent are probably sure. In comparison, 62 percent of the moderately proficient Hispanicstudents are very sure that they will graduate, and 34 percent are probably sure. The differences
among LM students with varying proficiencies who think they might not graduate from high
school are not significant.
82

Future educational plans of LM students
Although similar percentages of NETIL and non-NETIL Hispanic eighth graders plan toattain a graduate degree, a smaller percentage of the NETIL students intend to attain a collegedegree. For example, 19 percent of the NETIL students intend to receive an advanced degree, and24 percent plan to receive a college degree (table 3.14). Among the non-NETIL students, 22percent intend to get an advanced degree, while 34 percent plan to receive a college degree. Themost dramatic difference between Hispanic NETIL and non-NETIL students, however, is in thepercentage of students who have no plans to continue their education aftc high school graduation.The NETIL students are twice as likely as non-NETIL students to hale made this choice (30percent versus 16 percent).
The same pattern exists between low and highly English proficient students. While 9 percentof the Hispanic students with a low English proficiency intend to continue their education aftercollege graduation, 38 percent have no plans for further education after high school graduation. Incontrast, 24 percent of the highly English proficient Hispanic students intend to pursue educationafter college, and only 14 percent have no educational plans after high school.
Parental aspirations for their children' s education
Parental aspirations for their children have been hypothesized to affect the scholasticachievement of their children." In this study, about one-quarter of Hispanic parents do not expecttheir children to attend college. A similar proportion (26 percent) expect their children to attendsome college; 27 percent expect college graduation; and 23 percent expect their children to attainan advanced degree (table 3.15). Socioeconomic status is related to parental aspirations, withparents of high SES having greater ambitions for their children. For example, almost one-half (47percent) of the Hispanic children with high SES are expected by their parents to achieve anadvanced degree, compared with 15 percent of low SES Hispanic students. By contrast, 3 percentof high SES students are expected to only graduate from high school, as opposed to 25 percent oflow SES students.
"For a review of some of the research on this subject, see R. Seginer, "Parents' Educational Expectations andChildren's Academic Achievements: A Literature Review," Merrill-Palmer Quarterly, 29:1-23.
83
9 9

Table 3.15 Percentage of 1988 Hispanic eighth graders expected by theirparents to attain various levels of education, b SES
No HS HS Vocational Some College Advanceddiploma diploma school college graduation deg,ee
Total 0.9 15.8 8.0 25.8 26.7 22.8
Socioeconomic statusLow 1.6 24.6 9.2 29.9 19.9 14.8Middle 0.3 8.8 8.3 26.4 30.5 25.8High 0.0 3.4 1.4 5.3 42.8 47.1
SOURCE: U.S. Department of Education, National Center for Education Statistics, National EducationLongitudinal Study of 1988: "Base-Year Student and Parent" surveys.
After adjusting for SES, comparisons between the parents of NETIL and non-NETILstudents, and among the parents of recognized LM, nonrecognized LM, and recognized non-LMstudents reveal very few significant differences. However, English proficiency is slightly relatedto parental expectations for postsecondary education. A smaller percentage of parents with lowEnglish proficient children than those with highly proficient children expect their children tograduate from college or attain an advanced degree. For example, 27 percent of the parents ofhighly English proficient Hispanic LM students expect their children to obtain a college degree,and an additional 26 percent expect them to receive a higher degree (figure 3.19). By contrast,only 15 percent of the parents of Hispanic LM students with a low English proficiency expecttheir children to graduate from college; another 16 percent expect a higher degree. Because of thesmall number of students described by this category (students of low proficiency whose parentsexpect an advanced degree), the difference between students of low and high proficiency who areexpected to receive a higher degree is not statistically significant. However, the difference betweenstudents of moderate and high proficiency whose parents expect an advanced degree (20 percentversus 26 percent) is statistically significant.
84100

Figure 3.19Adjusted percentage of 1988 Hispanic LM eighth graders whoseparents expect college graduation or an advanced degree, bystudents' self-reported En lish Ian uage roficienc *
30
25
20
Percent 15
10
5
IIIt26.1
Parents expect college degree Parents expect advanced degree
111 Low English proficiency El Moderate English proficiency 111 High English proficiency
Estimates have been adjusted for SES.
SOURCE: U.S. Department of Education, National Center for Education Statistics, National EducationLongitudinal Study of 1988: "Base-Year Student and Parent" surveys.
Relationship of Hispanic Underachievement to Educational Aspirations
Students planning to enroll in an academic program fared better on both the reading andmath achievement tests than those who did not know which high school program they wouldenroll in or who had plans other than the choices given. Among Hispanic students who plannedfuture academic coursework, 24 percent failed to achieve the basic reading level, and 26 percentthe basic math level. In contrast, 35 percent of those with "other" or unknown plans did notachieve the basic reading level, and 40 percent the t math level (figure 3.20).
Among Hispanic eighth graders, confidence in high school graduation and achievement onboth tests were also related. For both reading and math, the more confident students performedbetter than the less confident students. For example, among Hispanic students who were verysure f their graduation, 26 percent were unable to achieve the basic reading level and 31 percentwere unable to achieve the basic math level (figure 3.21). Forty percent and 45 percent of thosewho were probably sure of their graduation did not achieve the basic reading and math level,respectively. In sharp contrast to both of those groups, 62 percent of the Hispanic students whostated they probably or surely would not graduate failed to achieve the basic reading level, and 68percent failed to achieve the basic math level.

Figure 3.20Percentage of 1988 Hispanic eighth graders unable to achieve thebasic readin and math achievement levels, b intended HS ro ram
40
35
30
25
Percent 20
15
10
5
Reading achievementMefirwmAIMINIAIGY
Math achievement
Li Academic pmgram 0 Other/unknown plans
MINLMMIIVIIMIRIenwOMPINIMAAAIMMINIIIMININ
SOURCE: U.S. Department of Education, National Center for Education Statistics, National EducationLongitudinal Study of 1988: "Base-Year Student" suivey.
Figure 3.21---4?ercentage of 1988 Hispanic eighth graders unable to achieve thebasic reading and math achievement levels, by confidence in HSraduation
WSINIMIRSTIRENINIMMINIFI
Percent
70
60
50
40
30
20
10
Reading achievement Math achievement
II Very sure will graduate 0 Probably sure will graduate !I Probably/surely will notgraduate
SOURCE: U.S. Department of Education, National Center for Education Statistics, National EducationLongitudinal Study of 1988: "Base-Year Student" survey.
86

Hispanic students with no plans for further education after high school were also more likelythan those with plans to attend college to be unable to achieve the basic reading and math levels.On the reading test, 43 percent of those with no future educational plans failed to achieve the basiclevel. In comparison, no more than 30 per,:ent of those envisioning a college degree or anadvanced degree failed to achieve the basic reading level (figure 3.22). On the math test, 52petcent of the students with no plans for education after high school failed to attain the basic level.In contrast, 29 percent of those planning to obtain a college degree or higher failed to attain thebasic math level.
Figure 3.22Percentage of 1988 Hispanic eighth graders unable to achieve thebasic reading and math achievement levels, by students' plans forfurther education
60
Reading achievement Math achievement
04,,s
No plans after high school
M Plan to attend vocational school
EZI Plan to attend college
II Plan to attain college degree
al Plan to attain advanced degree
SOURCE: U.S. Department of Education, National Center for Education Statistics, National EducationLongitudinal Study of 1988: "Base-Year Student" survey.
Parental aspirations for their children's education have an even stronger relationship to thestudents' achievement than do students' aspirations. Hispanic students whose parents expect themto graduate college or attain a higher degree were much more likely to achieve the basic readinglevel than Hispanic students whose parents have lower expectations. Specifically, only 15 percentof the Hispanic eighth giaders whose parents expect them to receive a college degree and 12percent whose parents expect a graduate degree failed to achieve the basic reading level (figure3.23). In contrast, 31 percent of the students whose parents expect only high school graduationdid not attain the basic level of performance.
On the math test, the pattern was similar. Thirty-nine percent of the Hispanic students whoseparents expect only high school graduation failed to achieve the basic math level, while 23 percentof the Hispanic students whose parents expect a college degree and 16 percent of those whoseparents expect an advanced degree did not achieve that level.

Figure 3.23Percentage of 1988 Hispanic eighth graders unable to achieve thebasic reading and math achievement levels, by parental expectationsof the students' future education
40.0
35.0
30.0
25.0
20.0
15.0
10.0
5.0
0.0
Reading achievement Math achievement
xpect HS diploma only
O Expect vocational school
Expect college deg=
111 Expect advanced deg=
SOURCE: U.S. Department of Education, National Center for Education Statistics, National EducationLongitudinal Study of 1988: "Base-Year Student and Parent" surveys.
Review
About three-fourths of the Hispanic student population come from bilingual families. Evenso, only 39 percent are identified by at lezst one of their teachers as Language Minority students.About 8 percent of the non-excluded F:spanic student body are defined by at least one of theirteachers as being Limited English Proficient. Less than 10 percent of the Hispanic studentsreceived instruction in a non-English language during their first 2 years of American schooling;about 20 percent were enrolled in a language assistance program.
The majority of Hispanic LM students indicate that they are not very proficient in their homelanguage. Even among the most frequent users of their home language, about one-half of theHispanic students indicate only a moderate proficiency in that language. Conversely, the majorityof the Hispanic LM students (64 percent) state that they have a high English language proficiency.Interestingly, about one-third of the Hispanic students identified as LEP students by their teachersindicate that they havc a high English proficiency.
Most of the Hispanic eighth graders (83 percent) were born in the United States. Almost all(92 percent) of the fottign-born Hispanic students are LM; about three-fourths of the native-bornHispanic students are LM. Not surprisingly, nativity is related to English proficiency. Almostthree-fourths of the native-born Hispanic LM students are highly proficient in English, whereasless than one-half of the foreign-born Hispanic LM students are highly proficient. However,students living in the United States for longer periods are more likely to have greater Englishproficiency than those with shorter residencies.
88

Similar percentages of LM and non-LM Hispanic eighth graders failed to achieve the basiclevels of performance on the reading and math tests. A ineng Hispanic LM students, those withlow proficiency in English failed to achieve at a much higher rate than did students with highproficiency.
Socioeconomic status is positively related to English proficiency, with Hispanic LMstudents from high SES backgrounds being more likely to have a higher English proficiency thanthose from low SES backgrounds. For Hispanic students, socioeconomic status is also related tohigh aspirations for high school and further education, greater confidence in high schoolgraduation, and high parental expectations of the students' further education. Irk addition,Hispanic students of high SES backgrounds failed to achieve the basic reading and mathperformance levels at a lower rate than did students of low SES.
Hispanic LM students with a high English proficiency are more likely than those vt a lowproficiency to plan on enrolling in an academic program while in high schoo'_ and Lid moreconfident of their graduation from high school. They are also more likely to indicate that theyintend to continue their education after college graduation and are less likely to have no educationalplans after high school graduation than their less proficient peers.
Overall, confidence in high school graduation was related to reading and math achievement,with the more confident Hispanic students having a lower rate of failure on the tests. Hispanicstudents with no specific plans for their high school program failed to achieve the basicachievement levels at higher rates than did Hispanic students with plans to enroll in an academicprogram. Likewise, Hispanic students with no plans for further education after their high schooleducation failed to achieve the basic levels in both tests at a higher rate than those Hispanicstudents who planned to go on to college after high school. Finally, Hispanic students whoseparents expected more education after high school graduation also fared better on both the readingand math tests.
891(15

Chapter 4
Summary
The re,li:.*s of the study of 1988 Asian and Hispanic eighth graders as conveyed in thisreport have, ._101 now, remained focused on the two separate ethnic groups; the analysis was notdesigned to cr.rdlpare one group to the other. However, such comparisons are perhaps inevitable,especially when the results are presented in one document. In addition, some might argue thatcomparisons in this case are informative, useful, and important. The following summary presentsseveral of the major findings and points out the similarities and differences between the twogroups.
Language Skills
Given the diverse backgrounds and cultural histories of the Asian and Hispanic childrenwho are now educated in American schools, it is interesting and perhaps surprising to find that somany similarities exist between the two groups. Although the similarities undoubtedly stem fromdifferent causes, the Asian and Hispanic eighth-grade populations display a number of strikinglysimilar patterns. For example, although the proportion of native-born Asian students is far lessthan the proportion of native-born Hispanic students (52 percent versus 83 percent), the twopopulations reveal very similar language patterns. About three-quarters of all the Hispanic andAsian eighth graders are language minorities (73 percent of Asian students are LM; 77 percent ofHispanic students are LM) and the proportions of each group reporting a high, moderate, and lowEnglish proficiency are quite similar. In particular, about two-thirds of the students report a highEnglish proficiency (Asians: 66 percent; Hispanics: 64 percent), not quite one-third report amoderate proficiency (Asians: 29 percent; Hispanics: 32 percent), and a small percent report a lowEnglish proficiency (Asians and Hispanics: 4 percent).
The patterns of agreement between teachers and students when asked to indicate thestudents' language minority status are, again, quite similar when comparing the Asian andHispanic populations. For over one-half of the students, teacher identification of the students' LMstatus match that of the students' (52 percent of Asian students agree with the teacher report of LMstatus; 55 percent of Hispanic students agree). Slightly less than half of the Asian students (47permit) state they are LM but teacher reports of LM status do not match their statements; 41percent of the Hispanics student population have the same type of mismatch.
Relationship Between Language and Reading Underachievement
With these similarities as a backdrop, it is all the more interesting to note the similarities anddifferences between the two groups when looking at the proportions of students who failed toreach the basic levels on the reading and math achievement tests. Particularly on the reading test,far fewer differences exist between the Asian and Hispanic students than might be expected giventhe prevailing images of the two student populations.
When divided according to socioeconomic status, the patterns of underachievement on thereading test for both the Asian and Hispanic student populations are very similar. Almost 40percent of low SES students fail to reach the basic reading level (Asians: 38 percent; Hispanics: 37percent), and 27 percent of middle SES students fail to reach that level (Asians and Hispanics: 27

percent). Asian and Hispanic students of hien SES are slightly different: 12 percent of high SESAsian students fail to achieve the basic reading level, while 19 percent of high SES Hispanicstudents fail to do so.
When dividing students according to language minority status, differences between theAsian and Hispanic students are revealed: 23 percent and 24 percent of Asian non-LM and LMstudents, respectively, failed to achieve the basic reading level, while 30 percent and 31 percent ofHispanic non-LM and LM students failed to achieve the basic reading level. When looking only atLM students and dividing them according to their English language proficiency, the similaritiesreturn. Almost two-thirds of LM students with a low English proficiency fai! to achiew the basicreading level (Asians: 63 percent; Hispanics: 69 percent); almost one-third of LM students withmoderate English proficiency fail to do so (Asian: 33 percent; Hispanics: 34 percent). Asian LMstudents with a high English proficiency, however, do have a lower failure rate than Hispanic LMstudents with a high English proficiency (19 percent versus 28 percent).
Relationship Between Language and Math Underachievement
Differences between the two populations become more apparent when comparing .Asian andHispanic underachievement on the math test. Greater proportions of Asian students reach the basicmath level than do Hispanic students, whether divided by SES, LM status, or English languageproficiency. The difference between Asian and Hisparic students of low SES is the onlycomparison which is not statistically significant (39 percert.. versus 42 percent). Asian students ofmiddle SES had a lower failure rate on the math test than did Hispanic students of middle SES (25percent versus 34 percent); the same is tnie of high SES students (Asians: 14 percent; Hispanics:22 percent).
Twenty-three percent of Asian LM students failed to achieve the basic math level, comparedto 37 percent of Hispanic LM students, and English language proficiency did not help to even outthe difference. About one-quarter (24 percent) of Asian LM students with low English proficiencyfailed to achieve the basic math level; 58 percent of Hispanic LM students with low proficiencyfailed to do so. Although Hispanic students with greater proficiencies improved upon the failurerate, their rates still did not match those of similar Asian LM students: 25 percent and 22 percentof Asian LM students with moderate and high English proficiency, respectively, failed to achievethe basic math rate, compared to 37 percent and 35 percent of Hispanic LM students withmoderate and high English proficiency.
Educational Outlook and Aspiration
Asian students and Hispanic students are different from each other when reviewing theireducational outlook and aspirations. Thirty-eight percent of Asian students plan to enroll in anacademic program in high school, while 31 percent are unsure of their plans. In comparison, 23percent of Hispanic students plan to enroll in an academic high school program, while 39 percentare unsure. Th differences narrow, but are still statLiically significant, when the students areasked to indicate their confidence in their high school graduation. Seventy-eight percent of Asianstudents are very sure they will graduate, compared to 71 percent of Hispanic students. Twenty-one percent of Asian students indicate they probably will graduate, compared to 26 percent ofHispanic students. When indicating their plans for future education, 39 percent of Asian studentsstate they will enter graduate school and an additional 38 percent say they will graduate fromcollege. In contrast, 22 percent of Hispanic students state they will enter graduate school, and anadditional 33 percent state they will graduate from college.
92

Relationship Between Educational Plans and Underachievement
As rates of achievement of the basic test levels are compared, differences between the Asianand Hispanic student populations continne to be revealed. For example, 17 percent of Asianstudents intending to enroll in an academic HS program failed to achieve the basic reading level,while 24 percent of Hispanic students with the same intention failed tr ii,:hieve that level. Twenty-one percent of Asian students who believe they definitely will gradua e from high school failed toachieve the basic reading level, compared with 26 percent of Hispanic students with the samebelief. Eighteen percent of Asian students planning to attend graduate school failed to achieve mebasic reading level, while 28 percent of Hispanic students with similar plans failed to achieve thebasic level. Differences between Asians and Hispanics in the other categories (mentioned in thepirvious paragraph) are nut statistically significant: those who are unsure about their HS program(32 percent of Asians versus 35 percent of Hispanics failed to achieve the basic reading level),those who were probably sure they would graduate (34 percent of Asians versus 40 percent ofHispanics), and those who planned to graduate from college (21 percent of Asians versus 24percent of Hispanics).
Turning to the math whievement test, Asian students continue to have a lower failure ratethan Hispanic students. While 17 percent of the Asians who intend to enroll in an academic HSprogram failed to achieve the basic math level, 26 percent of Hispanic students intending anacademic program failed to achieve that level. The difference was larger for those students withunknown HS plans: 28 percent of the Asian students and 40 percent of the Hispanic students withunknown plans failed to achieve the basic math level. Twenty percent of Asian students,compared to 31 percent of Hispanic students, who believe they definitely will graduate from HSfailed to achieve the basic math level. Finally, 17 percent of Asian students planning to attain anadl Aced degree and 22 percent of Asian students planning to graduate from college fisiled toachieve the basic math level. In comparison, 29 percent of Hispanic students planning to attain anadvanced degree and 29 percent who plan to graduate from college failed to achieve that samebasic math level.

Appendix A
Selected Survey Questions
This appendix duplicates the wordingof some select items from the
student and parent questionnaires.The items were either used to makecomposite variables or are provided
solely for the reader's interest.

Questions used to specify the student's race and ethnicity:
31. Next we would like to ask you some background information.
31A. Which best describes you?
Asian or Pacific Islander 0Hispanic, regardless of race 0Black, not of Hispanic origin 0White, not of Hispanic origin 0American Indian or Alaskan Native 0
31B. Which of these best categorizes your background?
ASIAN OR PACIFIC ISLANDER
(MARK ONE)Chinese 0Filipino 0Japanese 0Korean 0Southeast Asian (Vietnamese, Laotian,
Cambodian/Kampuchean, Thai, etc.) 0Pacific Islander (Samoan, Guamanian, etc.) 0South Asian (Asian Indian, Pakistani, Bangladeshi,
Sri Lankan, etc.) 0West Asian (Iranian, Afghan, Turkish, etc.) 0Middle Eastern (Iraqi, Israeli, Lebanese, etc.) 0Other Asian 0
Now GO ON TO QUESTION 32
31C. Which of these best categorizes your background?
HISPANIC
Mexican, Mexican-American, ChicanoCubanPuerto RicanOther Hispanic
(MARK ONE)0000

Questions used by the survey instrument to screen students for follow-upquestions:
21. Is any language other than English spoken in your home?
Yes 0No 0
24. What language, other than English, do you currently use most often?
(MARK ONE)Spanish 0
Chinese 0
Japanese 0
Korean 0
A Filipino language 0Italian 0French 0German 0
Greek 0Polish 0
Portuguese 0Not applicable: I use only English 0
Other 0
Questions used to construct the student's home language proficiency measure:
QUESTIONS 25 AND 26 ARE ABOUT THE USE OF THE LANGUAGE YOU ANSWEREDIN QUESTION 24
25. With regard to THAT LANGUAGE, how well do you do the following?
How well do you... (MARK ONE ON EACH LINE)
Very Pretty Not Very NotWell Well Well Well At All
a. Understand that languagewhen people speak it
b. Speak that language
c. Read that language
d. Write that language
o o o
o o o
o o o
o o o
98

Questions used by the survey instrument to screen parents fok follow-up
questions:
22A. Is any language other than English spoken in your home?
Yes 0No 0
22C. What languages otherthan English are spokenin your home?
22D. Of these languages,which is most oftenspoken in your home?
(MARK ALLTHAT APPLY) (MARK ONE)
Spanish 0 0
Chinese 0 0
Japanese . 0 0
Korean 0 0
A Filipino language 0 0
Italian 0 0
French 0 0
German 0 0
Greek 0 0
Polish 0 0
Portuguese 0 0
Other 0 0
Questions used to construct the parent's home language proficiency measure:
25. With regard to the language that you marked in Question 22D, how well do you do each of
the following?
How well do you...
a. Understand that languagewhen people speak it
b. Speak that language
c. Read that language
d. Write that language
(MARK ONE ON EACH LINE)Very Pretty Not Very NotWell Well Well Well At All

Questions used to construct the student's home language usage measure:
26. How often is THAT LANGUAOE spoken in each situation listed below?
(lF YOU DO NOT SEE THAT PERSON OFTEN, PLEASE MARK "Does Not Apply")
How often do (does): (MARK ONE ON EACH LINE)
Always or About Doesmost of half the Notthe time time Sometimes Never Apply
a. YOU speak that language to yourmother (or female guardian)
b. Your MOTHER (or female guardian)speak that language to you
c. YOU speak that language to youfather (or male guardian)
d. Your EAMEE (or male guardian)speak that language to you
(e. was not used to construct the variable)
f. Your GRANDPARENTS speak thatlanguage to you
g. Your DROTURS OR SISTERSspeak that language to you
h. YOU speak that language with yourbest friends in your neighborhood
i. you speak that language with yourbest friends in school
0 0 0 0 0
0 0 0 0 0
0 0 0 0 0
0 0 0 0 0
0 0 0 0 0
0 0 0 0 0
0 0 0 0 0
0 0 0 0 0

Questions used to construct the English language proficiency measure:
(student questionnaire:)
27. How well do you do the following?
How well do you...
a. Understand spoken English
b. Speak English
c. Read English
d. W .) English
(MARK ONE ON EACH LINE)VeryWell
PrettyWell Well
Not VeryWell
0 0 0 0
0 0 0 0
0 0 0 0
0 0 0 0
(parent questionnaire:)
26. With regard to English, how well do you do the following?
How well do you...
a. Understand someonespeaking English
b. Speak English
c. Read English
d. Write English
(MARK ONE ON EACH LINE)Very Pretty Not Very Not AtWell Well Well Well All Well
01! ti

Questions asked of students regarding bilingual instruction and languageassistance programs.
28. During your first two years in school in the United States, were any of the following subjectstaught to you in a language other than English? Do not include regular foreign languageclasses.
IF THIS IS YOUR FIRST YEAR IN THE UNITED STATES, ANSWER FOR THISYEAR ONLY.
(MARK AT LEAST ONE ON EACH LINE)Subject Subject Subject
Taught in Taught in NotEnglish Other Language Taught
a. Math 0 0 0
b. Science 0 0 0
c. United States literature or languagesuch as reading or writing
d. United States history, governmentor social studies
0
0
0
0
29. Were you ever enrolled in an English language/language assistance program, that is, aprogram for students whose native language is not English?
Yes 0No 0
1 5
102

Questions asked of students regarding their educational aspirations and level ofconfidence in educational success.
49. In which program do you expect to enroll in high school?
College prep, academic, ot specializedacademic (such as Science or Math) 0
Vocational, technical or business and career 0General high school program 0Other specialized high school (such as Fine Arts) 0OtherI don't know
45. As things stand now, how far in school do you think you will get?
Won't finish high school 0Will graduate from high school, but
won't go any further 0Will go to vocational, trade, or business
school after high school 0Will attend college 0Will graduate from college 0Will attend a higher level of school
after graduating from college 0
46. How sure are you that you will graduate from high school?
Very sure I'll graduateI'll probably graduateI probably won't graduateVery sure I won't graduate
0000
101

Questions asked of teachers regarding each student's language status:
ANSWER FOREACH STUDENT IF YES TO QUESTION 1: PLEASE INDICATE WHETHER THIS STUDENT:
Student 11. Is a Language 12. Is a Limited EnglishNumber Minority (LM) student?* Proficiency (LEP) student?*
Yes No DK Yes No DK
ee intr I I ucnon page or e ininon.
Note from introduction page:
Reference is made to Language-Minority (LM) and Limited-English-Proficient (LEP) students aswell as English-as-a-Second Language (ESL) programs throughout this questionnaire. For thisstudy, the following defir 'ions apply:
Lang= -e_.:1_,4in _andelut : A student in whose home a non-English language istypically spoken. Such students may include those whose English is fluent enough tobenefit from instruction in academic subjects offered in English as well as students whoseEnglish proficiency is limited.
Limited-English-Proficient (LEP) Students: A student whose native language is other thanEnglish and whose skills in listening to, speaking, reading, or writing English are suchthat he/she derives little benefit from school instruction in English.

Appendix B
Technical Notes and Methodology
105 PS

Technical Notes and Methodology
Estimates in this tabulation were based on the National Education Longitudinal Studyof 1988 eighth graders (NELS:88). All data were drawn from the base-year survey, fromthe student, parent, and teacher components. All estimates for this sample were calculatedusing BYQWT, restricting the analysis to students who were self-identified asAsian/Pacific Islander or as Hispanic. The unit of analysis was always the student orstudent-parent or student-teacher pairs, thereby making the use of the student weightBYQWT appropriate. For more information on the NELS:88 surveys, interested readersshould consult Inge ls, et al., National Educational Longitudinal Study of 1988 Base-Year:Student Component Data File Users' Manual (Chicago: National Opinion Research Center,1989).
Row variables were selected to describe student characteristics such as raceethnicity,SES, and nativity of the student and his/her parents. Most of these variables were takendirectly from the student or parent data files. One notable exception is the socioeconomicstatus variable, which was a composite created by NCES, averaging the non-missingvalues of five standardized components: father's and mother':-; educational levels, father'sand mother's occupations, and family income. The parent questionnaire was the primarysource of these components; for students without parent data (8.1 percent), student datawas substituted.
There were a number of nativity and residency composites as well as several languageproficiency and usage scale composites created from variables taken from the student andparent files. Language status composites were created from variables taken from the studentand teacher files. Scales were created by combining responses to several items asked of thestudents and parents. The following tables show the composites created and the inputvariables and values used for each. For each of the language proficiency and usage scalecomposites, a factor analysis and a reliability analysis were performed to determine thefeasibility of combining the items into a scale. Cronbach's alpha, shown in the upper rightcorner of the scale items' tables, is a measure of the internal consistency of a scale and isbased on the average correlation of items within the scale; Cronbach's alpha has a possiblerange of zero to one. Following each composite or scale description is the unweightedfrequency distribution for the Asian and Hispanic NELS:88 eighth graders.
TABLE 1 Comv6msfti / ResidencSource
BYP17
Composite Composite name and values
If BYP17 = 1If BYP17 = 2 or 3
Native-bornForeign-born
Student's nativity knative
Asian ad.ralia
631692
1 - native-born2 - foreign-born
Hispanic students
2,185441
107

TABLE 1 Composites for Student Nadvi / Residenc Continued
Source
BYP17BYP18
Composite Composite name and values
Student's nativity/residency knatres
If BYP17 =1If BYP17 = 2, 3 AND
BYP18 = 1, 2, 3, 7BYP18 = 4BYPi8 = 5BYP18 = 6
Native-bornIn U.S. < 6 yearsIn U.S. 6-8 yearsIn U.S. 9-11 yearsIn U.S. >11 years
A iat_i_unients
631163179183169
1 - born in U.S.
2 - in U.S. less than 6 years3 - in U.S. 6-8 years4 - in U.S. 9-11 years5 - in U.S. more than 11 yrs
Hispanic students
2,18592
122115117
TABLE 2 Com osites for Parental Nativit / Residenc
Source
BYP11
If BYP11 = 1If BYP11 = 2 or 3
Composite
Mother's nativity
Aaiannuipai
Native-born mother 228Foreign-born mother 1,066
Composite name and values
mnative
1 - native-born2 - foreign-born
1,3531,221

TABLE 2 Composites for parental Nativity / ResidencyContinued
Source Composite Composite name and values
BYP11 Mother's nativity/residency mnatesBYP12
If BYP11 = 1If BYP11 = 2 or 3 AND
BYP12 = 1, 2, or 8BYP12 = 3BYP12 = 4BYP12 = 5
1 - born in U.S.
2 - in U.S. less than 5 years3 - in U.S. 6-10 years4 - in U.S. 11-15 years5 - in U.S. more than 15 years
&bp students
Mother native-born 228 1,353Mother in U.S. < 5 years 134 63Mother in U.S. 6-10 years 287 219Mother in U.S. 11-15 years 256 252Mother in U.S. >15 years 351 706
BYP14
If BYP14 = 1If BYP14 = 2 or 3
Native-born father
Father's nativity dnative
Asian students
331Foreign-born father 966
1 native-born2 - foreign-born
Hispanic students
1,2281,276
BYP14BYP15
Father's nativity/residency dnatres
If BYPI4 = 1If BYP14 = 2 or 3 AND
BYP15 = 1, 2, or 8BYP15 = 3BYP15 = 4BYP15 = 5
1 - born in U.S.
2 - in U.S. less than 5 years3 - in U.S. 6-10 years4 in U.S. 11-15 years5 in U.S. more than 15 years
Hispanic students
Father native-born 331 1,228Father in U.S. < 5 years 126 52Father in U.S. 6-10 years 245 180Father in U.S. 11-15 years 188 205Father in U.S. >15 years 359 775
109121

TA.B.2... Composites for it's Language Proficienc
Source Scale Alpha statistic
B YS27ABY5273BY527CBYS27D
Original codes:
Student's English proficiency .9104 (Hsp).9372 (API)
How well do you understand spoken EnglishHow well do you speak EnglishHow well do you read EnglishHow well do you write English
Very well=1Pretty well=2Well=3Not very well=4
The items were reverie-coded for the composite so thathigh scores indicate high proficiency.
low proficiency:medium proficiency:high proficiency:
score < 22 <= score < 4score = 4
Asian students ffiwzanic students
Low English proficiency 47Moderate English proficiency 357High English proficiency 798
76729
1,681
110 1 '

TABLE 3 Composites for Student's Lan a e PrEa.oticiencyContinued
Source Scale Alpha statistic
Student s home language proficiency .9019 (Hsp).8593 (API)
BYS25A
BYS25BBYS25CBYS25D
How well do you understand that language whenpeople speak it to you
How well do you speak that languageHow well do you read that languageHow well do you write that language
Original codes: Very well=1Pretty well=2Well=3Not very well=4Not at all=5
The items were reverse-coded for the composite so thathigh scores indicate high proficiency.
low proficiency:medium proficiency:high proficiency:
score < 22 <= score < 4score = 4
AliAtilLALlunt itudents
Low home language proficiency 696 1,055Moderate home language proficiency 359 1,063
High home language proficiency 140 359
111 1 '):3

TABLE 4 Com I 1 sites for Student's Home lan uage Usa eStudent's home language usage .8789 (Hsp)
.8746 (AP1)
BYS26A How often do you speak that language to your motherBYS26B How often does your mother speak that language to youBYS26C How often do you speak tuat language to you fatherBYS26D How often does your father speak that language to youBYS26F How often do your grandparents speak that language to youBYS26G How often do your [siblings] speak that language to youBYS26H How often do you speak that language with your best
friends in the neighborhoodBYS26I How often do you speak that language with your best
friends in school
Original codes: Always or most if the time=1About half the time=2Sometimes=3Never=4Does not apply=5
Items were reverse-coded for the composite so thathigh scores indicate frequent use.
low: score <= 2medium: 2 < score <= 3.3high: 3.3 < score
Asian students Hispanic students
Low frequency usage 386Medium frequency usage 630High frequency usage 178
6981,287
486

TABLE 5 Cong.esfor Parent's Langua e Proficiency
Source Scale Alpha statistic
BYP26ABYP26BBYP26CBYP26D
Original codes:
Parent's English proficiency .9753 (Hsp).9706 (API)
How well do you understand someone speaking EnglishHow well do you speak EnglishHow well do you read EnglishHow well do you write English
Very well=1Pretty well=2Well=3Not very well=4Not at all well=5
All items were reverse-coded for the composite so thathigh scores indicate high proficiency.
low:medium:high:
score < 22 <= score < 4score = 4
Parent - low English proficiencyParent - moderate English proficiencyParent - high English proficiency
Asian students Hispanic students
326326391
737453881
113 ? 5
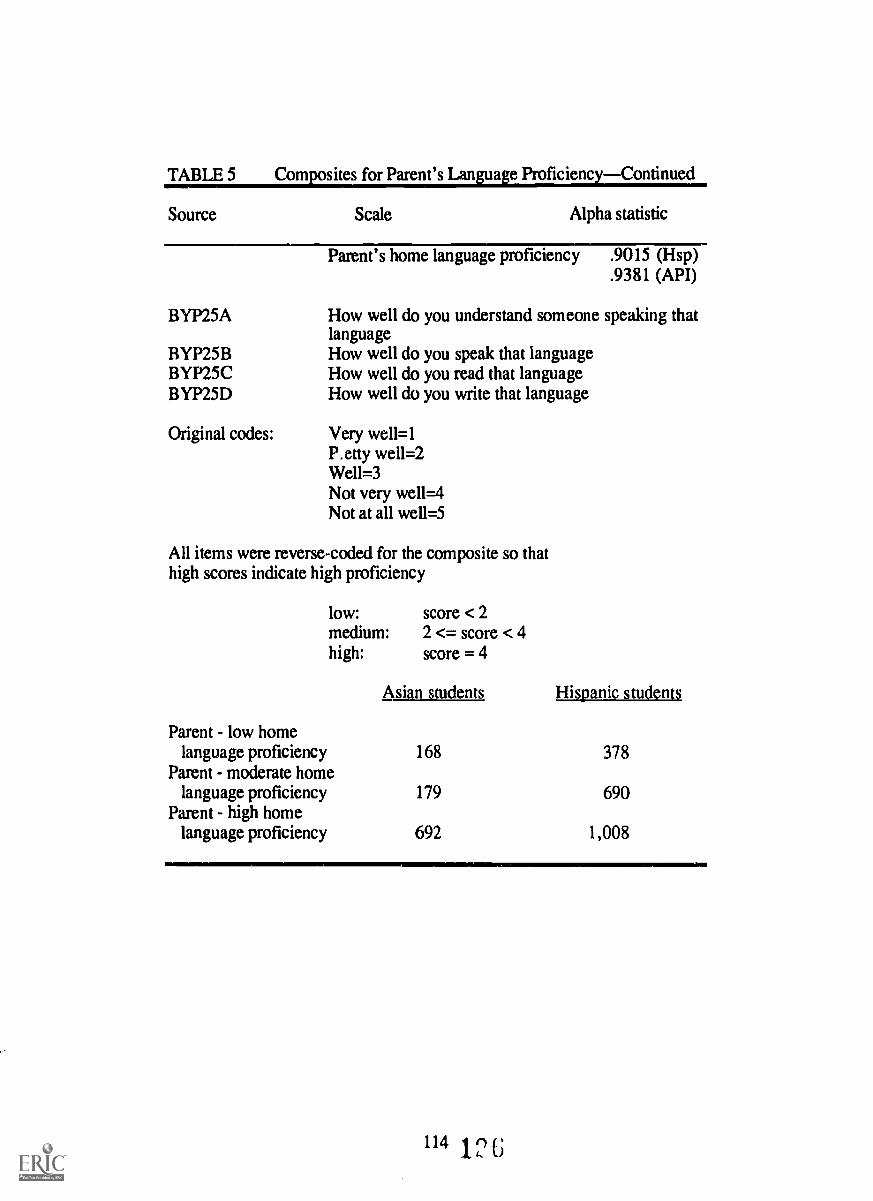
TABLE 5 Composites for Parent's Language ProficiencyContinued
Source Scale Alpha statistic
Parent's home language proficiency .9015 (Hsp).9381 (API)
BYP25A How well do you understand someone speaking thatlanguage
BYP25B How well do you speak that languageBYP25C How well do you read that languageBYP25D How well do you write that language
Original codes: Very well=1P.etty well=2We 11=3
Not very well=4Not at all well=5
All items were reverse-coded for the composite so thathigh scores indicate high proficiency
low: score < 2medium: 2 <= score < 4high: score = 4
Parent - low home
Asian students Hispanic students
language proficiency 168 378Parent - moderate home
language proficiency 179 690Parent - high home
language proficiency 692 1,008
114

TABLE 6 ....02.nzsizIfor. Student's Laneage Status
Source Composite Composite name and value
BYS21BYT11
1: neitherstudent
home
2: neitherstudent
homeOR
at leaststudent
home
3: at leaststudent
home
Language Minority Status IM
teacher defined student as language minority ANDindicated that no second language was spoken in the
teacher defined student as language minority BUTindicated that a second language was spoken in the
one teacher defined student as language minority BUTindicated that no second language was spoken in the
one teacher defined student as language minority ANDindicated that a second language was spoken in the
Recognized LMNonrecognized LMRecognized non-LM
Asian students Hiseanic students
260655429
4931,256
974
BYT12 Limited English Proficiency Status LEP
1: at least one teacher defined student as limited English proficient2: neither teacher defined student as limited English proficient
LEPNot LEP
Asian studenta
1071,263
Hispani_e_sipleuai
2202,569
Response Ra tes
The following four tables display the iesponse rates and sample sizes for selectedvariables used in the analyses. No imputation was performed on the analysis files receivedfrom NCES. The rates for the entire Hispanic student sample is followed by response ratesand sample sizes of the Hispanic LM students, NETIL students, and LM but not NETILstudents. Response rates and sample sizes for the corresponding Asian student samplefollow the Hispanic student tables.
115
127

Table 7 NELS:88 Hiss anic ei hth aders res # nse rates for selected variables
All Hispanic students
Valid Responseresponses rate
(N) ( rcent)
Total 3,171
Ethnicity 3,129 98.68
SES 3,168 99.91
Student's nativity 2,626 82.81
Student's Englishlanguage proficiency 2,486 78.40
Student's homelanguage proficiency 2,477 78.11
Student's homelanguage usage 2,471 77.92
Parent's Englishlanguage proficiency 2,071 65.31
Student's responsere LM status 3,170 99.97
Teacher responsere student's LM status 2,724 85.90
Teacher responsere student's LEP status 2,789 87.95
Student's educationalplans 3,119 98.36
Confidence inHS graduation 3,113 98.17
Parental expectation ofstudent's education 2,715 85.62
Valid mathproficiency level 2,438 76.88
Valid readingproficiency level 2,510 79.15
116

NELS:88 His anic LM ei hth graders' response rates for selected variables
LM students NETIL studentsLM, non-NETIL
students
Valid Responseresponses rate
Validresponses
N)
Responserate
Validresponses
(N)
Responseratercem)
Total 2,513 220 1,994
Ethnicity 2,496 99 32 218 99.09 1,981 99.35
SES 2,510 99.88 220 100.00 1,992 99.90
Student's nativity 2,063 82.09 174 79.09 1,697 85.11
Student's Englishlanguage prof. 2,485 98.89 189 85.91 1,974 99.00
Student's homelanguage prof. 2,476 98.53 194 88.18 1,962 98.40
Student's homelanguage usage 2,470 98.29 188 85.45 1,960 98.29
Parent's Englishlanguage prof. 1,898 75.53 164 74.55 1,547 77.58
Student's responsere LM status 2,513 100.00 220 100.00 1,994 100.00
Teacher response restudent's LM status 2,128 84.68 214 97.27 1,926 96.59
Teacher response restudent's LEP status 2,189 87.11 220 100.00 1,994 100.00
Student's educationalplans 2,464 98.05 215 97.73 1,963 98.45
Confidence inHS graduation 2,439 97.85 213 96.82 1,961 98.35
Parental expectation ofstudent's education 2,142 85.24 176 80.00 1,762 88.37
Valid mathproficiency level 1,916 '/6.24 151 68.64 1,598 80.14
Valid readingproficiency level 1,976 78.63 155 70.45 1,649 82.70
117 1 2 9

TABLE 9 NELS:88 AAian eighth aders' res II nse rates for selected variables
All Asian students
Validresponses
(N)
Responserate
(percent)
Total 1,527
Ethnicity 1,505 98.56
SES 1,526 99.93
Student's nativity 1,323 86.64
Student's Englishlanguage proficiency 1,202 78.72
Student's homelanguage proficiency 1,195 78.26
Student's homelanguage usage 1,194 78.19
Parent's Englishproficiency 1,043 68.30
Student responsere LM status 1,524 99.80
Teacher responsere student's LM status 1,344 88.02
Teacher responsere student's LEP status 1,370 89.72
Student's educationalplans 1,515 99.21
Confidence inHS graduation 1,508 98.76
Parental expectation ofstudent's education 1,350 88.41
Valid mathproficiency level 1,234 80.81
Valid readingproficiency level 1,269 83.10
118130

Table 10 NEL28.8 Asian LM eighth graders' response rates for selected variables
LM studentsLM, non-NETIL
Unid.§DikeLti_l __..iusisenis____
Validresponses
(N)
Responserate
(percent)
Validresponses
(N)
Responserate
( rcent)
Validresponses
(N)
Responserate
(percent)
Total 1,207 107 981
Ethnicity 1,197 99.17 89 83.18 975 99.39
SES 1,207 100.00 107 100.00 981 100.00
Student's nativity 1,033 85.58 86 80.37 876 89.30
Student's Englishlanguage prof. 1,200 99.42 99 92.52 976 99.49
Student's homelanguage prof. 1,193 98.84 99 92.52 968 98.67
Student's homelanguage usage 1,192 98.76 99 92.52 967 98.57
Parent's Englishlanguage prof. 986 81.69 84 78.50 830 84.61
Student's responsere LM status 1,207 100.00 106 99.07 981 100.00
Teacher response restudent's LM status 1,061 87.90 105 98.13 951 96.94
Teacher response restudent's LEP status 1,079 89.40 107 100.00 981 100.00
Student's educationalplans 1,199 99.34 105 98.13 976 99.49
Confidence inI-IS graduation 1,193 98.84 103 96.26 973 99.18
Parental expectation ofstudent's education 1,058 87.66 87 81.31 894 91,13
Valid mathprofiziency level 971 80.45 80 74.77 826 84.20
Valid readingproficiency level 998 82.68 84 78.50 845 86.14
119 1 3 1

Standard Errors
The NELS:88 sample, while representative and statistically accurate, was not a simplerandom sample. Students were initially selected within schools grouped within strata.Sampling rates for schools within different strata varied, resulting in better data for policypurposes, but at a cost to statistical efficiency. Hence, simple random techniques for theestimation of standard errors frequently underestimate the true standard errors for someestimates. To overcome this problem, standard errors for all estimates in this tabulationwere calculated using the STRATTAB program, which uses a Taylor series approximationto calculate standard errors based upon complex survey designs.45 A version of thisprogram is available from NCES upon request. The standard errors reported take intoaccount the clustering in the sampling procedure; they are generally higher than standarderrors calculated under the assumptions of simple random sampling.
To compare estimates for separate subgroups, or to understand the quality of theestimates, standard errors are needed. Each estimate has an associated standard error andthe standard errors vary in size as a function of sample size and the sample design. Hence,the standaid errors of the estimates for some small groups (e.g., Pacific Islander students)may be so large that the estimates should not be used. (While the estimates based on 30 orfewer cases were suppressed, the computer automatically produced estimates forsubgroups with 31 or more cases.) The standard errors for all estimates used in this reporthave been reported in appendix C.
Adjustment Procedure
An initial examination of the data led to the finding that socioeconomic status bore arelationship to many of the other variables of interest as well. Because this study is basedon bivariate analyses, it was important to try to control for the effects of socioeconomicstatus when looking at relationships between two other variables (such as ethnicity and thestudent's English proficiency) so that the relationships found were not confounded by theunderlying differences in socioeconomic status. The procedure used was developed byDennis Carroll at the National Center for Education Statistics and uses the socioeconomicdistribution for each variable being studied, factoring out the differences attributable tosocioeconomic status (SES).
The adjustment procedure is best described using real data; this example is an estimateused in chapter 3. Of the Hispanic eighth graders in 1988, 64.30 percent had a high self-assessed English proficiency. One question of interest is if differences exist betweenMexican, Cuban, and Puerto Rican students' English proficiencies. Having looked at howdifferences in socioeconomic status affect students' assessments of their English languageskills, and having observed Mexican, Cuban, and Puerto Rican students' dissimilar SESbackgrounds, an additional question arises of whether the socioeconomic backgrounds ofthe students might obscure (or exaggerate) the relationship between ethnicity and Englishproficiency. To remove the differences due to socioeconomic status in order to look moresimply at the relationship between ethnicity and English proficiency, the estimates aresubjected to an adjustment procedure.
45C. Ogden, "StratTab User's Guide," MPR Associates (1989).
120
13

Examining proficiency by socioeconomic status yields the following: 55.60 percentof low SES students had a high English proficiency; 72.61 percent of middle (25-75%)SES students had a high English proficiency; and 83.33 percent of high SES students had ahigh English proficiency. Each student has a variable (Y) representing whether or not theyhad a high self-assessed English proficiency; this variable Y has three possible values:missing, zero, and 100. A new variable (A) was constructed from Y to reflect anadjustment of Y by the socioeconomic distribution of Y as follows:
if Y = missing then A = missing;otherwise,If SES = low then A = Y + 64.30 - 55.60;If SES = middle (25-75%) then A = Y + 64.30 - 72.61;If SES = hign then A = Y + 64.30 - 83.33.
The adjusted variable A was used to construct the classifications of "Ethnicsubgroups -- adjusted for SES." As an example, before adjusting for SES, 62.51 percentof the Mexican students, 65.82 percent of the Cuban students, and 69.33 percent of thePuerto Rican students had a high English proficiency. After adjusting for SES, the estimateof highly English proficient Mexican students is 64.20 percent, of highly proficient Cubanstudents is 59.13 percent, and of Puerto Rican students is 68.73 percent. The effect of theadjustment procedure is to !move all the variation attributable to differences in the meanvalues of the adjustment variable (SES). The proportion of highly proficient Cubanstudents had been exaggerated because the Cuban students, on average, have a highersocioeconomic status than the other two student populations.
Use of the adjustment procedure places a statistical control for family socioeconomicstatus and makes it easier to consider the ethnicity variable without forming deeply stratifiedtables by SES. This approach also enhances the power of the estimates by enabling the useof larger groups (group size would be reduced if the sample were further stratified).Finally, this approach removes all the variation attributable to differences in the adjustmentvariable's means rather than only the linear component (as is true with regressionapproaches). The procedure slightly affects the standard errors of the estimates withincategories, but does not affect the standard errors of the totals.
This adjustment procedure is slightly problematic in that it is possible to obtain out-of-range estimates. In a number of cases within these tables, the adjusted values were lessthan zero. Of course, it is impossible to have a negative percentage of students, but theadjustment procedure itself resulted in negative estimates. With one exception, theunadjusted estimates and/or the sample size were fairly small. In the one exception wherethe estimate was not small, the unadjusted estimate was 100 percent and the adjustedestimate was slightly over 100 percent.
This adjustment procedure was developed by Dennis Carroll of the National Centerfor Education Statistics, Longitudinal Studies Branch. Interested readers with furtherquestions regarding the procedure should direct their queries to him at 555 New JerseyAvenue, NW, Washington, DC 20208-5652 (phone 202-219-1774).
121 133

Statistical Procedures
The statistical comparisons in this report were based on the t statistic. Generally,whether the statistical test is considered significant or not is determined by calculating a tvalue for the difference between a pair of means or proportions and comparing this value topublished tables of values at certain critical levels, called alpha levels. The alpha level is ana priori statement of the probability of inferring that a difference exists when in fact it doesnot.
In order to make proper inferences and interpretations from the statistics a number ofissues must be kept in mind. First, comparisons resulting in large t statistics may appear tomerit special attention. This is somewhat misleading, since the size of the t statisticdepends not only on the observed differences in means or percentage being compared butalso on the number of respondents in the categories used for comparison, and on the degreeof variability among respondents within categories. A small difference comparedacross alarge number of respondents could result in a large t statistic. Second, when multiplestatistical comparisons are made on the same data it becomes increasingly likely that anindication of a population difference will be erroneously given. Even when there is nodifference in the population, at an alpha-level of .05 there is still a 5 percent chance ofdeclaring that an observed t value representing one comparison in the sample is largeenough to be statistically significant. As the number of comparisons increases, the risk ofmaking such an error in inference also increases.
To guard against errors of inference based upon multiple comparisons, theBonferroni procedure to correct significance tests for multiple contrast was used. Thismethod corrects the significance (or alpha) level for the total number of contrasts made witha particular classification variable. For each classification variable, there are (K*(K-1)/2)possible contrasts (or nonredundant pairwise comparisons), where K is the number ofcategories. For example, since Hispanic ethnicity has four categories, K=4, and there are(4*3)/2=6 possible comparisons between the categories. The Bonferroni procedure dividesthe alpha-level for a single t test (for example, .05) by the number of possible pairwisecomparisons, to give a new alpha that is corrected for the fact that multiple contrasts arebeing made.
122 13 4

Appendix C
Standard Error Tables
This appendix presents the standarderrors of all the estimates reported.
For tables and figures in the report thatincluded estimates adjusted for
socioeconomic status, the standard error tableis followed by a table presenting the
unadjusted estimates and standard errors.
123 1. 3 5
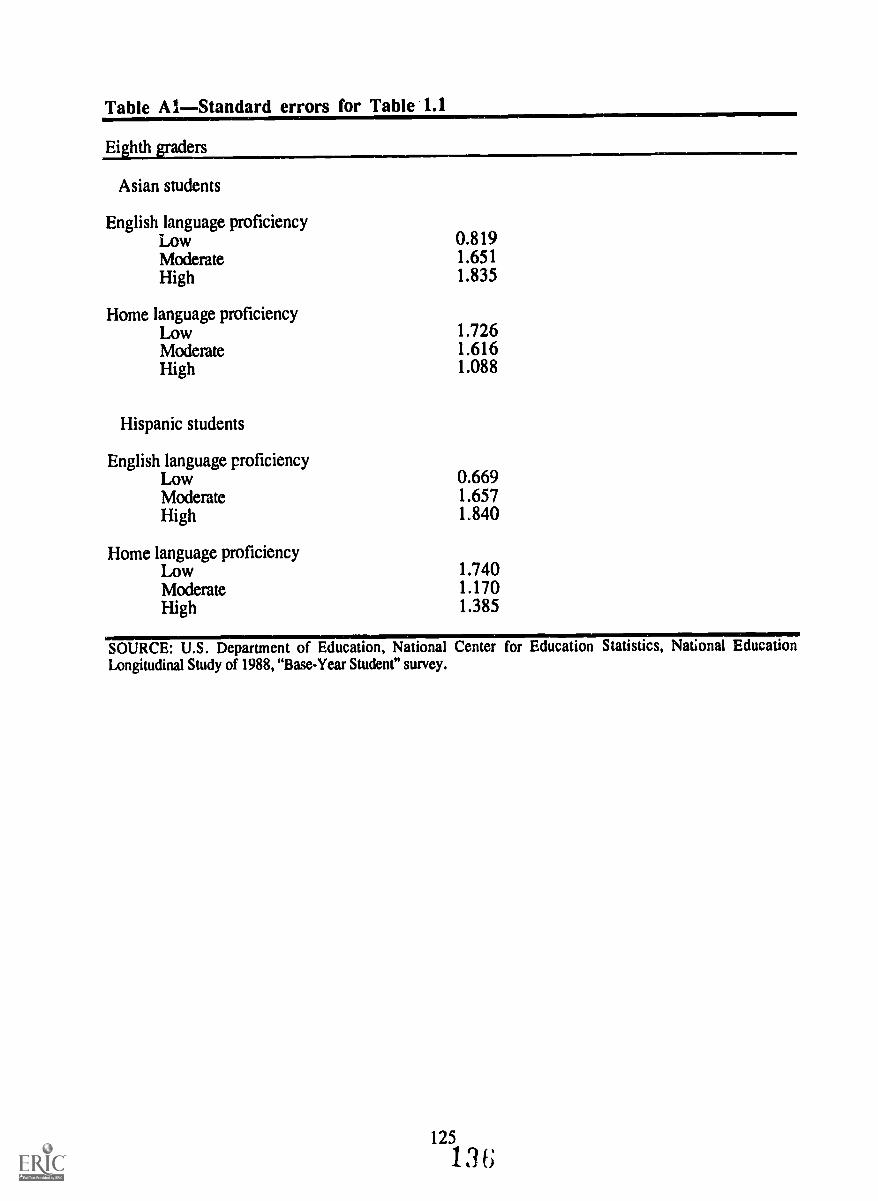
Table Al Standard errors for Table 1.1
Eighth graders
Asian students
English language proficiencyLowModerateHigh
Home language proficiencyLow 1.726Moderate 1.616High 1.088
0.8191.6511.835
Hispanic students
English language proficiencyLowModerateHigh
Home language proficiencyLowModerateHigh
0.6691.6571.840
1.7401.1701.385
SOURCE: U.S. Department of Education, National Center for Education Statistics, National EducationLongitudinal Study of 1988, "Base-Year Student" survey.
125
136

Table A2Standard errors for Table 1.2
Ethnicity
Asian students
ChineseFilipinoJapaneseKoreanSoutheast AsianPacific IslanderSouth AsianOther Asian*
Hispanic Total
Mexican, Mexican-American, ChicanoCubanPuerto RicanOther Hispanic
1.5251.9341.0281.1231.3121.3671.1311.395
2.2380.9411.2611.336
* West Asians and Middle Easterners were included withof students in these categories.
SOURCE: U.S. Department of Educatior., NationalLongitudinal Study of 1988, "Base-Year Student" survey
"other" Asians in this study because of the small number
Center for Education Statistics, National Education
Table A3Standard errors for Fi ure 2.1
Chinese Filipino Japanese Korean Southeast Pacific South OtherAsian Islander Asian Asian
Total 1.525 1.934 1.028 1.123 1.312 1.367 1.131 1.395
SOURCE: U.S. Department of Education, National Center for Education Statistics, National EducationLongitudinal Study of 1988, "Base-Year Student" survey.
126 137

Table A4-Standard errors for Fi ure 2 2
Socioeconomic statusLow Medium High
Total 1.524 1.712 1.891
EthnicityChinese 3.998 3.459 3.835
Filipino 2.164 3.695 3.768
Japanese 2.811 5.971 6.013
Korean 2.620 4.446 4.538
Southeast Asian 4.021 3.624 2.320
Pacific Islander 4.641 5.422 4.766
South Asian 3.579 5.644 6.143
Other 3.998 4.724 4.230
SOURCE: U.S. Department of Education, National Center for Education Statistics, National Education
Longitudinal Study of 1988, "Base-Year Student" survey.
Table AS-Standard errors for Table 2.1
,..Native-born Forei n-born
Total 1.999 1.999
Ethnic subgroups(adjusted for SES)
Pacific Islander 4.192 4.191
Japanese 6.834 6.829Other Asian 4.447 4.446Chinese 3.622 3.622Filipino 4.575 4.572South Asian 6.042 6.045
Korean 4.122 4.124Southeast Asian 3.080 3.081
SOURCE: U.S. Department of Education, National Center for Education Statistics, National Education
Longitudinal Study of 1988, "Base-Year Student and Parent" surveys.

Table A6Unadjusted data and standard errors for Table 2.1
Native-born Forei n-born
(percentages)
Total 52.35 47.65
Ethnic subgroupsPacific Islander 84.18 15.82Japanese 72.45 27.55Other Asian 66.86 33.14Chinese 53.36 46.64Filipino 53.40 46.60South Asian 49.15 50.85Korean 37.21 62.79Southeast Asian 10.51 89.49
(standard errors)
Total 1.999 1.999
Ethnic subgroupsPacific Islander 4.180 4.180Japanese 6.911 6.911Other Asian 4.370 4.370Chinese 3.789 3.789Filipino 4.523 4.523South Asian 6.246 6.246Korean 4.213 4.213Southeast Asian 3.021 3.021
SOURCE: U.S. Department of Education, National Center for Education Statistics, National EducationLongitudinal Study of 1988, "Base-Year Studentand Parent" surveys.
Table A7Standard errors for Table 2.2
First leneration Second eneration Third eneration
Total 1.965 1.624 2.197
SOURCE: U.S. Department of Education, National Center for Education Statistics, National EducationLongitudinal Study of 1988, "Base-Year Parent" survey.
128

Table ASStandard errors for Table 2.3
Non-LM LM
Total 2.022 2.022
Student's nativity(unadjusted)
Native-born 2.956 2.956Foreign-born 1.849 1.849
Ethnic subgroups(adjusted for SES)
Southeast Asian 2.967 2.967Chinese 2.346 2.346Filipino 3.840 3.840South Asian 3.595 3.595Korean 4.243 4.243Japanese 5.812 5.812Other Asian 4.503 4.503Pacific Islander 6.165 6.165
SOURCE: U.S. Department of Education, National Center for Education Statistics, National EducationLongitudinal Study of 1988, "Base-Year Student and Parent" surveys.
1 4 (1129

Table A9Unad usted data and standard errors for Table 2.3
Non-LM LM
(percentages)
Total 27.17 72.83
Ethnic subgroupsSoutheast Asian 12.35 87.65Chinese 13.86 86.14Filipino 17.21 82.79South Asian 16.30 83.70Korean 28.12 71.88Japanese 36.99 63.01Other Asian 44.77 55.23Pacific Islander 62.13 37.87
(standard errors)
Total 2.022 2.022
Ethnic subgroupsSoutheast Asian 2.982 2.982Chinese 2.385 2.385Filipino 3.818 3.818South Asian 3.731 3.731Korean 4.302 4.302Japanese 5.883 5.883Other Asian 4.552 4.552Pacific Islander 6.065 6.065
SOURCE: U.S. Department of Education, National Center for Education Statistics, National EducationLongitudinal Study of 1988, "Base-Year Student" survey.
Table A1OStandard errors for Fipre 2.3
Home languake proficiencyLow Moderate High
Total 1.726 1.616 1.088
SOURCE: U.S. Department of Education, National Center for Education Statistics, National EducationLongitudinal Study of 1988, "Base-Year Student" survey.
130
141

Table All Standard errors for Fi ure 2.4
Home language_usageLow frequenc Moderate frequenc Hi h f uenc
Total 2.169 2.019 1.257
SOURCE: U.S. Department of Education, National Center for Education Statistics, National EducationLongitudinal Study of 1988, "Base-Year Student" survey.
Table Al2Standard errors for Fi ure 2.5
Home nahutwafisiersy_____Low Moderate High
Total 1.726 1.616 1.088
Home language usage(adjusted for SES)
Infrequent 2.492 2.181 1.690Moderate 2.393 2.289 1.420Frequent 4.383 4.649 3.871
SOURCE: U.S. Department of Education, National Center for Education Statistics, National EducationLongitudinal Study of 1988, "Base-Year Student" survey.
131 142

Table A13-Unadjusted data and standard errors for Fi ure 2.5
HilmtianguagrangicituyLow Moderate High
(percentages)
Total 58.61 29.65 11.74
Home language usageInfrequent 77.74 13.85 8.31Moderate 56.13 35.42 8.46Frequent 25.60 45.27 29.13
(standard errors)
Total 1.726 1.616 1.088
Home language usageInfrequent 2.497 2.183 1.687Moderate 2.387 2.286 1.420Frequent 4.361 4.640 3.873
SOURCE: U.S. Department of Education, National Center for Education Statistics, National EducationLongitudinal Study of 1988, "Base-Year Student" survey.
Table A14-Standard errors for Table 2.4
Home language proficiencyLow Moderate High
Total 1.726 1.616' 1.088
Ethnicity(adjusted for SES)
Japanese 7.895 6.733 4.974Filipino 3.781 3.498 2.672Other Asian 5.979 5.868 4.153Pacific Islander 8.936 8.032 6.730Korean 4.666 4.602 3.336Southeas1 Asian 4.334 3.955 2.057Chinese 3.472 3.339 1.866South Asian 5.670 4.899 1.035
SOURCE: U.S. Department of Education, National Center for Education Statistics. National EducationLongitudinal Study of 1988, "Base-Year Student" survey.
132 1 I
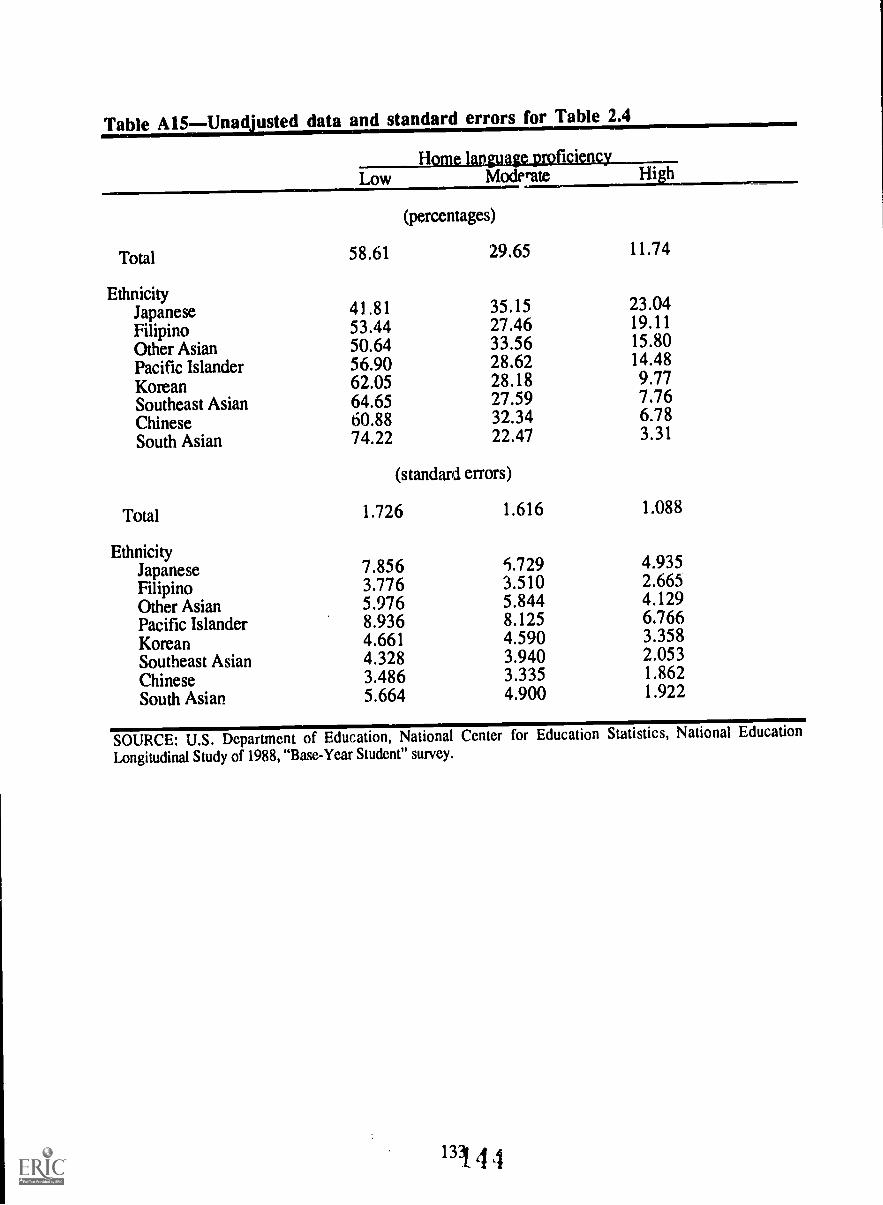
Table A15Unad usted data and standard errors for Table 2.4
Home jusuage,zaficangy______Low Moderate High
(percentages)
Total 58.61 29.65 11.74
EthnicityJapanese 41.81 35.15 23.04
Filipino 53.44 27.46 19.11
Other Asian 50.64 33.56 15.80
Pacific Islander 56.90 28.62 14.48
Korean 62.05 28.18 9.77
Southeast Asian 64.65 27.59 7.76Chinese 60.88 32.34 6.78
South Asian 74.22 22.47 3.31
(standard errors)
Total 1.726 1.616 1.088
EthnicityJapanese 7.856 5.729 4.935
Filipino 3.776 3.510 2.665
Other Asian 5.976 5.844 4.129
Pacific Islander 8.936 8.125 6.766
Korean 4.661 4.590 3.358
Southeast Asian 4328 3.940 2.053
Chinese 3.486 3.335 1.862
South Asian 5.664 4.900 1.922
SOURCE: U.S. Department of Education, National Center for Education Statistics, National Education
Longitudinal Study of 1988, "Base-Year Student" survey.
13314 4

Table A16--Standard errors for Fi ure 2.6
Low
Total 0.819
English language proficiencyModerate High
1.651 1.835
SOURCE: U.S. Department of Education, National Center for Education Statistics, National EducationLongitudinal Study of 1988, "Base-Year Student" survey.
Table A17 Standard errors for Figure 2.7
LowEnglish language proficiency
Moderate Hi h
Total 0.819 1.651 1.835
SESLow 2.575 3.775 3.761Medium 1.152 2.237 2.377High 0.987 2.593 2.757
SOURCE: U.S. Department of Education, National Center for Education Statistics, National EducationLongitudinal Study of 1988, "Base-Year Student" survey.
134 1 .1 5

Table A18-Standard errors for Table 2.5
LowEnglish language profick cy
Moderate High
Total 0.819 1.651 1.835
Ethnicity(adjusted for SES)
South Asian 0,301 4.346 4.416
Korean 1.276 4.441 4.573
Pacific Islander 1.956 7.630 7.842
Other Asian 1.713 5.318 5.582
Filipino 0.241 3.953 3.946
Chinese 1.796 3.445 3.346
Japanese 6.387 6.128 9.392
Southeast Asian 2.974 3.957 4.387
Home language proficiency(unadjusted)
Low 0.897 2.132 2.416
Moderate 1.651 3.024 3.222
High 2.029 4.477 4.663
SOURCE: U.S. Department of Education, National Center for Education Statistics, National Education
Longitudinal Study of 1988, "Base-Year Student" survey.
135146

Table A19Unad'usted data and standard errors for Table 2.5
LowEnglish language proficiency
Moderate High
(percentages)
Total 4.21 29.32 66.47
EthnicitySouth Asian 0.00 14.99 85.01Korean 2.12 19.57 78.31Pacific Islander 2.72 28.41 68.88Other Asian 2.16 25.60 72.24Filipino 0.18 29.53 70.29Chinese 7.08 35.41 57.51Japanese 7.81 29.86 62.33Southeast Asian 10.45 39.44 50.12
(standard errors)
Total 0.819 1.651 1.835
EthnicitySouth Asian 0.000 4.309 4.309Korean 1.268 4.680 4.904Pacific Islander 1.941 7.505 7.742Other Asian 1.752 5.014 5.210Filipino 0.183 3.894 3.875Chinese 1.781 3.745 3.748Japanese 6.247 6.396 9.103Southeast Asian 3.119 4.089 4.830
SOURCE: U.S. Department of Education, National Center for Education Statistics, National EducationLongitudinal Study of 1988, "Base-Year Student" survey.
136 11 7

Table A20Standard errors for Figure 2.8
LowEnglish language proficiency
Moderate
Total 0.819 1.651 1.835
Student's nativity(adjusted for SES)
Native-born 0.876 2.092 2.205Foreign-born 1.221 2.235 2.322
SOURCE: U.S. Department of Education, National Center for Education Statistics, National EducationLongitudinal Study of 1988, "Base-Year Student and Parent" surveys.
Table A21 Unad usted data and standard errors for Fi ure 2 8
LowEnglish language proficiency
Moderate High
(percentages)
Total 4.21 29.32 66.47
Student's nativityNative-born 1.67 15.04 83.29Foreign-born 6.03 36.87 57.10
(standard errors)
Total 0.819 1.651 1.835
Student's nativityNative-born 0.900 2.090 2.226Foreign-born 1.279 2.245 2.439
SOURCE: U.S. Department of Education, National Center for Education Statistics, National EducationLongitudinal Study of 1988, "Base-Year Student and Parent" surveys.
137
143

Table A22Standard errors for IFJ'i ure 2.9
High English language proficiency
Total
Student's residency(adjusted for SES)
<6 years6-8 years9-11 years>11 yearsNative-born
1.835
4.7054.3833.8635.1792.205
MS1111MW
TOURCE: U.S. Department of Education, National Center for Education Statistics, National EducationLongitudinal Study of 1988, "Base-Year Student and Parent" surveys.
Table A23Unad'usted Ii ures and standard errors for Fi&ure 2.9
High English language proficiency
Total
Student's residency<6 years6-8 years9-11 years>11 yearsNative-born
Total
Student's residency<6 years6-8 years9-11 years>11 yearsNative-born
(percentages)
66.47
31.2154.6773.8372.0483.29
(standard errors)
1.835
4.9304.5333.8685.2712.226
SOURCE: U.S. Department of Education, National Center for Education Statistics, National EducationLongitudinal Study of 1988, "Base-Year Student and Parent" surveys.
138 11 it)

Table A24Standard errors for Table 2.6
Home language proficiencyLow Moderate
Total 1.726 1.616
Student's years in the U.S.(adjusted for SES)
Less than 6 years 5.014 4.971Between 6 and 8 years 4.835 4.810Between 9 and 11 years 4.088 3.677More than 11 years 4.955 4.613Native-born 2.887 2.464
SOURCE: U.S. Department of Education, National Center for Education Statistics, National EducationLongitudinal Study of 1988, "Base-Year Student and Parent" surveys.
Table A25Unad'usted data and standard errors for Table 2.6
Home language proficiencyLow Moderate
(percentages)
Total 58.61 29.65
Student's years i.i the U.S.Less than 6 years 34.07 50.41Between 6 and 8 years 62.32 30.21Between 9 and 11 years 68.85 24.77More than 11 years 66.69 25.85Native-born 61.64 23.79
(standard errors)
Total 1.726 1.616
Student's years in the U.S.Less than 6 years 5.008 4.968Between 6 and 8 years 4.854 4.811Between 9 and 11 years 4.088 3.692More than 11 years 4.960 4.606Native-born 2.886 2.468
SOURCE: U.S. Department of Education, National Center for Education Statistics, National EducationLongitudinal Study of 1988, "Base-Year Student end Parent" surveys.
139
150

Table A26 Stundard errors for Table 2.7
English lanziage proficiencyLow Moderate Hi h
Total 0.819 1.651 1.835
Parent's Englishlanguage proficiency(adjusted for SES)
Low 2.638 3.303 3.504Moderate 1.252 3.155 3.101High 0.266 2.336 2.280
SOURCE: U.S. Department of Education, National Center for Edr,cation Statistics, National EducationLongitudinal Study of 1988, "Base-Year Student and Parent" surveys.
Table A27Unad'usted data and standard errors for Table 2.7
Enalish language proficiencyLow Moderate Hi h
(percentages)
Total 4.21 29.32 66.47
Parent's Englishlanguage proficiency
Low 11.19 40.92 47.90Moderate 2.29 27.42 70.29High 0.34 19.94 79.71
(standard errors)
Total 0.819 1.651 1.835
Parent's English proficiencyLow 2.639 3.368 3.566Moderate 1.315 3.068 3.102High 0.250 2.370 2.313
SOURCE: U.S. Department of Education, National Center for Education Statistics, National EducationLongitudinal Study of 1988, "Base-Year Student and Parent" surveys.

Table A28Standard errors for Table 2.8
Reading achievement Math achievemert:
Total 1.858 1.780
Ethnicity(adjusted for SES)
Pacific Islander 9.849 9.967
Other Asian 4.874 5.044
Filipino 4.024 4.049
Japanese 6.069 6.087
Chinese 2.968 2.985Southeast Asian 3.777 3.807
Korean 4.721 4.509South Asian 3.839 4.038
English proficiency(adjusted for SES)
Low 7.482 9.002Moderate 2.980 2.805
High 1.981 2.077
SOURCE: U.S. Department of Education, National Caner for Education Statistics, National Education
Longitudinal Study of 1988, "Base-Year Student" survey.

Table A29 Unad usted data and standard errors for Table 2.8
Reading achievement Math achievement
(percentages)
Total 24.41 22.79
EthnicityPacific Islander 42.36 49.71Other Asian 30.30 29.87Filipino 26.36 36.41Japanese 22.12 30.81Chinese 23.86 26.47Southeast Asian 27.03 19.93Korean 16.67 21.36South Asian 8.78 20.20
English proficiencyLow 69.95 31.93Moderate 35.62 27.33High 17.19 20.29
(standard errors)
Total 1.858 1.780
EthnicityPacific Islander 9.916 9.527Other Asian 5.287 5.065Filipino 4.065 3.813Japanese 6.209 6.568Chinese 3.330 2.891Southeast Asian 3.894 4.254Korean 4.593 4.456South Asian 3.590 4.436
English proficiencyLow 8.375 9.370Moderate 3.035 2.859High 2.070 2.105
SOURCE: U.S. Department of Education, National Center for Education Statistics, National EducationLongitudinal Study of 1988, "Base-Year Student" survey.
142 1 r0

Table A30Standard errors for Fi ure 2.10MP
Reading AchievementNon-LM LM
Math AchievementNon-LM 11%.4
Total 2.898 1.858 3.341 1.780
SOURCE: U.S. Department of Education, National Center for Education Statistics, National Education
Longitudinal Study of 1988, "Base-Year Student" survey.
Table A31 Standard errors for Fi ure 2.11
Reading achievement Math achievementSocioeconomic statlis Socioeconomic status
Low Medium High Low Medium High
Total 3.705 2.284 1.923 3.705 2.368 2.012
SOURCE: U.S. Department of Education, National Center for Education Statistics, National Education
Longitudinal Study of 1988, "Base-Year Student" survey.
Table A32 Standard errors for Table 2.9
Reading achievementSocioeconomic status
Math achievementSocioeconomic status
Low Medium High Low Medium High
Total 3.705 2.284 1.923 3.705 2.368 2.012
English proficiencyLow Low-N Low-N Low-N Low-N Low-N Low-N
Moderate 5.196 5.083 5.508 5.075 4.630 3.469
High 5.466 3.305 2.263 5.844 3.203 2.512
SOURCE: U.S. Department of Education, National Center for Educatio'n Statistics, National Education
Longitudinal Study of 1988, "Base-Year Student" survey.

Table A33Standard errors for Figure_112
Bilingual home Bilingual home Monolingual home Monolingual homeidentified as identified as identified as identified as
non-LM LM LM non-LM
Total 2.132 2.216 0.318 2.220
SOURCE: U.S. Department of Education, National Center for Education Statistics, National EducationLongitudinal Study of 1988, "Base-Year Student and Teacher" surveys.
Table A34Standard L.-rors for Fi ure 2 13
LowEnglish language proficiency
Moderate Hi h
Total 0.819 1.651 1.835
LM statusRecognized LM 1.827 2.649 2.877Nonrecognized LM 0.775 2.052 2.109
SOURCE: U.S. Department of Education, National Center for Education Statistics, Nationa! EducationLongitudinal Study of 1988, "Base-Year Student and Teacher" surveys.
Table A35 Standard errors for Figure 2.14
LowEnglish language proficiency
Moderate H hTotal 0.819 1.651 1.835
NEM statusNEM,Non-NETIL
5.0750.674
5.4471.772
6.1711.838
SOURCE: U.S. Department of Education, National Center for Education Statistics, National EducationLongitudinal Study of 1988, "Base-Year Student and Teacher" surveys.

Table A36Standard errors for Table 2.10
l_aulaegtuagitituasLLwilago_in-En h n
Reading Math Other subiests
Total 1.164 0.856 0.868
Socioeconomic status(unadjusted)
Low 3.097 2.219 2.550Medium 1.437 1.082 0.922High 1.344 1.259 1.202
LM status(adjusted for SES)
Nonrecognized LM 1.080 0.860 0.805Recognized LM 1.476 1.646 1.732
SOURCE: U.S. Department of Education, National Center for Education Statistics, National EducationLongitudinal Study of 1988, "Base-Year Student and Teacher" surveys.
Table A37 Unad'usted data and standard errors for Table 2.10
Sub'ects 1anguae
Readin Math Other sub'ects
(percentages)
Total 5.92 5.47 4.65
LM statusNonrecognized LM 3.73 3.30 2.52Recognized LM 6.14 8.51 7.16
(standard errors)
Total 1.164 0.856 0.868
LM statusNonrecognized LM 1.075 0.867 0.821Recognized LM 1.561 1.660 1.752
SOURCE: U.S. Department of Education, National Center for Education Statistics, National EducationLongitudinal Study of 1988, "Base-Ym Student and Teacher" surveys.

Table A38-Standard errors for Table 2.11
Ever enrolledin language Enrolled in
3rd grdEnrolled in4th, 5th, 6t12 grd
Enrolled in7th, 8th el_
Total 1.517 3.482 3.631 3.264
Socioeconomic status(unadjusted)
Low 3.850 5.110 6.466 5.356Medium 2.269 5.259 5.305 5.245High 2.115 6.409 6.491 5.490
LM status(adjusted for SES)
Recognized LM 2.528 4.261 4.627 3.890Nonrecognized LM 1.770 6.260 5.892 5.793
NETIL staais(adjusted for SES)
NETIL 5.757 7.700 8.382 6.614Non-NETIL 1.591 4.044 4.272 3.760
English proficiency(adjusted for SES)
Low 9.147 Low-N Low-N Low-NModerate 3.128 5.031 5.006 4.606High 1.604 3.575 4.103 3.200
SOURCE: U.S. Department of Education, National Center for Education Statistics, National EducationLongitudinal Study of 1988, "Base-Year Student and Teacher" surveys.
146

Table A39 Unad usted data and standard errors for Table 2.11
Ever enrolledin language Enrolled inro m 1st, 2nd, 3rd rd
Enrolled in4th, 5th, 6th
Enrolled inI .d 7th, 8th
(percentages)
Total 23.63 68.77 40.71 19.97
/ 2v1 statusRecognized LM 33.82 67.23 45.35 16.58Nonrecognized LM 16.58 69.29 32.11 22.65
NETIL statusNETIL 45.22 53.08 57.81 23.93Non-NETIL 21.03 71.53 36.71 18.30
English proficiencyLow 63.34 Low-N Low-N Low-NModerate 37.63 59.54 50.39 21.36High 15.02 84.24 21.45 9.39
(standard errors)
Total 1.517 3.482 3.631 3.264
LM statusRecognized LM 2.631 4.607 4.632 3.867Nonrecognized LM 1.784 6.143 5.978 5.889
NETIL statusNETIL 5.476 8.198 8.499 6.517Non-NETIL 1.638 4.130 4.276 3.810
English proficiencyLow 10.237 Low-N Low-N Low-NModerate 3.225 5.438 4.991 4.711High 1.564 3.644 4.150 3.254
SOURCE: U.S. Department of Education, National Center for Education Statistics, National EducationLongitudinal Study of 1988, "Base-Ycar Student and Teacher" surveys.
1471 5 S

Table A40Standard errors for Table 2.12
Reading achievementbefore SES ad'ustment
Reading achie,,ementafter SES ad'u ,tment
Total 1.858 1.858
LM statusRecognized LM 3.182 3.107Nonrecognized LM 2.075 1.893
NETIL statusNETIL 7.493 7.532Non-NETIL 1.876 1.745
SOURCE: U.S. Department of Education, National Center for Education Statistics, National EducationLongitudinal Study of 1988, "Base-Year Student and Teacher" surveys.
Table 41Standard errors for Fi ure 2.15
Academicro
Vocational Generalro ram ro
Specialro am unknown plans
Other/
Total 1.771 1.384 0.961 0.594 1.406
SOURCE: U.S. Department of Education, National Center for Education Statistics, National EducationLongitudinal Study of 1988, "Base-Year Student" survey.

Table A42-Standard errors for Table 2.13
Plakto enroll in Unknown orother plansAcademic
ProVocational Generalro ro
Specialro am
Total 1.771 1.384 0.961 0.594 1.406
SES(unadjusted)
Low 3.403 3.339 1.961 1.276 3,366Middle 2.617 2.010 1.414 1.043 2.220High 2.460 1.611 1.728 0.793 2.091
Ethnic groups(adjusted for SES)
Korean 4.371 3.031 4.638 1.809 3.312Japanese 6.088 3.254 5.293 3.254 5.554South Asian 5.191 4.867 4.153 1,765 4.630Southeast Asian 3.447 3.125 1.142 1.212 3.925Chinese 3.051 2.442 1.754 1.224 2.893Other Asian 3.963 3.444 3.889 1.883 4.044Filipino 3.233 2.805 2.510 1.084 3.092Pacific Islander 5.405 4.472 4.147 2.161 5.377
English proficiency(adjusted for SM)
Low 5.034 5.051 2.289 3.169 8.972Moderate 2.670 2.750 3.157 0.687 2.885High 2.266 1.601 1.547 0.796 2.125
SOURCE: U.S. Department of Education, National Center for Education Statistics, National EducationLongitudinal Study of 1988, "Base-Year Student" survey.

Table A43-Unad usted data and standard errors for Table 2.13
Unknown orother plansAcademic
programVocational General
programSpecialprogram_program
(percentages)
Total 37.58 17.44 9.78 4.11 31.09
Ethnic groupsKorean 51.94 9.93 10.75 6.06 21.32Japanese 52.06 8.41 8.61 7.81 23.11South Asian 52.25 16.74 8.23 1.80 20.97Southeast Asian 37.83 18.02 3.55 2.42 38.17Chinese 39.71 18.58 8.38 3.86 29.46Other Asian 29.69 17.53 15.56 4.37 32.85Filipino 30.94 21.98 10.08 3.50 33.50Pacific Islander 23.51 18.76 11.48 3.42 42.83
English proficiencyLow 18.89 9.75 7.84 4.35 59.17Moderate 30.35 21.03 12.31 2.33 33.98High 45.94 14.41 8.72 4.04 26.89
(standard errors)
Total 1.771 1.384 0.961 0.594 1.406
Ethnic groupsKorean 4.505 3.008 2.865 1.825 3.328Japanese 5.959 3.275 4.769 3.244 5.618South Asian 5.643 5.128 3.195 1.787 4.645Southeast Asian 3.505 2.993 1.263 1.223 4.047Chinese 3.249 2.648 1.715 1.225 2.888Other Asian 4.027 3.509 3.255 1.886 4.075Filipino 3.368 2.878 1.916 1.074 3.114Pacific Islander 5.538 4.401 3.602 2.175 5.377
English proficiencyLow 5.703 5.178 4.568 3.186 9.374Moderate 2.535 2.771 2.578 0.677 2.832High 2.430 1.651 1.192 0.795 2.182
SOURCE: U.S. Departmeat of Education, National Center for Education Statistics, National EducationLongitudinal Study of 1988, "Base-Year Student" survey.

Table A44-Standard errors for Figure 2.16
Very surewill graduate
Probably surewill graduate
Probably/surelywill not graduate
Total 1.378 1.341 0.356
SOURCE: U.S. Department of Education, National Center for Education Statistics, National EducationLongitudinal Study of 1988, "Base-Year Student" survey.
Table A45-Standard errors for Table 2.14
Very surewill graduate
41Probably surewill graduate
Total 1.378 1.341
Socioeconomic status(unadjusted)
Low 3.426 3.218Medium 2.056 2.024High 1.639 1.658
Ethnic groups(adjusted for SES)
South Asian 2.606 2.597Southeast Asian 2.364 2.359Korean 2,685 2.668Other Asian 3.393 3.419Chinese 3.109 2.987Filipino 3.414 3.252Japanese 5.662 5.638Pacific Islander 6.482 6.287
English proficiency(adjusted for SES)
Low 8.112 7.566Moderate 2.903 2.866High 1.655 1.590
NETIL status(adjusted for SES)
NETIL 6.259 5.570Non-NETIL 1.411 1.409
SOURCE: U.S. Department of Education, National Center for Education Statistics, National EducationLongitudinal Study of 1988, "Base-Year Student and Teacher" surveys.
151 1.62

Table A46Uedjusted data and standard errors for Table 2.14
Very sure Probably surewill graduate will graduate
(percentages)
Total 78.05 20.79
Ethnic groupsSouth Asian 92.56 7.44Southeast Asian 82.62 17.11Korean 88.23 11.77Other Asian 79.42 20.58Chinese 74.94 21.14Filipino 73.02 26.40Japanese 74.85 25.15Pacific Islander 65.38 32.52
English proficiencyLow 55.84 33.62Moderate 66.99 31.97High 84.35 14.87
NETIL statusNETIL 56.56 39.02Non-NETIL 79.45 19.54
(standard errors)
Total 1.378 1.341
Ethnic groupsSouth Asian 2.716 2.716Southeast Asian 2.356 2.354Korean 2.643 2.643Other Asian 3.520 3.520Chinese 3.392 3.204Filipino 3.459 3.285Japanese 5.441 5.441Pacific Islander 6.370 6.191
English proficiencyLow 8.048 7.266Moderate 2.868 2.834High 1.715 1.641
NETIL statusNETIL 6.425 5.616Non-NETIL 't29 1.425
SOURCE: U.S. Department of Education, National Center for Education Statistics, National EducationLongitudinal Study of 1988, "Base-Year Student and Teacher" surveys.
152

Table A47-Standard errors for Figure 2.17
Graduate Collegeschool graduation
(11WIMIEITEMIII.
College Post-secondary No plansattendance vocational after HS
school uation
Total 1.796 1.602 1.101 0.720 0.928
SOURCE: U.S. Depaament of Education, National Center for Education Statistics, National Education
Longitudinal Study of 1988, "Base-Year Student" survey.
Table A48-Standard errors for Table 2.15
Plan to attain anadvanced degree
No plans for furthereducation after HS
Total 1.796 0.928
SES(unadjusted)
Low 2.653 2.768Medium 2.374 1.464High 2.563 0.759
Ethnic groups(adjusted for SES)
Korean 4.358 0.671South Asian 5.910 0.776Southeast Asian 3.477 2.509Chinese 3.188 1.772
Other Asian 4.053 2.285Japanese 6.012 3.536Filipino 2.800 1.716Pacific Islander 4.169 4.745
LM status(adjusted for SES)
Recognized LM 2.872 1.318Nonrecognized LM 2.492 1.151
Recognized non-UM 3.089 2.200
SOURCE: U.S. Department of Education, National Center for Education Statistics, National EducationLongitudinal Study of 1988, "Base-Year Student and Teacher" surveys.
153 I tt.?

Table A49Unadjusted data and standard errors for Table 2.15
Plan to attain an No plans for furtheradvanced degree education after HS
(percentages)
Total 38.69 6.88
Ethnic groupsKorean 59.98 1.00South Asian 61.69 0.65Southeast Asian 33.74 7.57Chinese 44.61 5.40Other Asian 36.02 6.02Japanese 38.96 9.25Filipino 29.29 6.63Pacific Islander 16.19 23.39
LM statusRecognized LM 34.13 4.82Nonrecognized LM 47.67 5.02Recognized non-LM 27.82 11.88
(standard errors)
Total 1.796 0.928
Ethnic groupsKorean 4.312 0.579South Asian 6.062 0.653Southeast Asian 3.554 2.556Chinese 3.703 1.773Other Asian 4.265 2.239Japanese 5.798 3.643Filipino 3.011 1.788Pacific Islander 4.075 4.862
I,M statusRecognized LM 2.737 1.243Nonrecognized LM 2.777 1.181Recognized non-LM 3.211 2.315
SOURCE: U.S. Department of Education, National Center for Education Statistics, National EducationLongitudinal Study of 1988, "Base-Year Student and Teacher" surveys.
154

Table A50-Standard errors for Table 2 16
Parental expectatimx_No HSdiploma
HSdiploma
Vocationalschool
Somecollege
College Advancedgraduation degree
Total 0.075 1.043 0.669 1.215 1.639 2.016
Socioeconomic status(unadjusted)
Low 0.222 3.124 1.795 3.645 3.815 3.379
Medium 0.144 1.675 1.168 1.801 2.494 2.646
High 0.000 0.698 0.599 1.122 2.653 2.803
LM status(adjusted for SES)
Recognized LM 0.184 1.551 1.010 2.088 3.018 3.244
Nonrecognized LM 0.005 1.409 0.614 1.165 2.497 2.702
Recognized non-LM 0.257 2.484 2.110 2.838 4.061 3.359
SOURCE: U.S. Department of Education, National Center for Education Statistics, National EducationLongitudinal Study of 1988, "Base-Year Student, Parent,and Teacher" surveys.
Table A51-Unad usted data and standard errors for Table 2.16
Parental expectations:No HSdiploma
HSdiploma
Vocational Someschool college
College Advancedgraduation degree
(percentages)
Tc 0.10 7.43 3.63 11.95 34.93 41.95
LM statusRecognized LM 0.19 5.97 2.22 14.17 32.97 44.48Nonrecognized LM 0.00 7.61 1.70 5.59 33.23 51.87Recognized non-LM 0.26 9.23 9.53 18.02 40.23 22.73
(standard errors)
Total 0.075 1.043 0.669 1.215 1.639 2.016
LM statusRecognized LM 0.185 1.626 1.016 2.201 3.069 .3.270Norkrecognized LM 0.000 1.526 0.645 1.137 2.517 3.012Recognized non-LM 0.257 2.626 2.125 3.066 4.040 3.589
SOURCE: U.S. Department of Education, National Center for Education Statistics, National EducationLongitudinal Study of 1988, "Base-Year Stude-:, Parent, and Teacher" surveys.

Table A52Standard errors for Fi ure 2 18
Academic Other/unknownro lans
Academic Other/Unknownro lans
Total 2.069 2.913 2.144 2.906
SOURCE: U.S. Department of Education, National Center for Education Statistics, National EducationLongitudinal Study of 1988, "Base-Year Student" survey.
Table A53Standard errors for Fi ure 2.19
Reading achievementVery sure Probably sure
will graduate willsraduate
.101011101=
Very sure Probably surewill aduate will aduate
Total 1.666 3.480 1.663 3.634
SOURCE: U.S. Department of Education, National Center for Education Statistics, National EducationLongitudinal Stud 1988, "Base-Year Student" survey.
(Table A54 Standard errors for Fi ure 2.20
Reading achievement Math achievementNo plans College Advanced No plans College Advancedafter HS degree degree after
Total 6.832 2.168 2.224 6.274 2.336 2.249
SOURCE: U.S. Department of Education, National Center for Education Statistics, National EducationLongitudinal Study of 1988, "Base-Year Student" survey.
Table A55Standard errors for Fi ure 2.21
Reading achievement Math achievementEargagaggisc
HS grad Vocational College Advanced HS grad Vocational College Advanceddegree degree onlx_ school cjegree degree
Total 6.392 8.700 1.704 1.143 6.707 9.483 1.941 1.216
SOURCE: U.S. Department of Education, National Center for Education Statistics, National EducationLongitudinal Study of 1988, "Base-Year Student and Parent" surveys.
156 11; 7

Table A56Standard errors for Fi ure 3.1
Total
Mexican Cuban Puerto Rican Other Hispanic
2.238 0.941 1.261 1.336
SOURCE: U.S. Department of Education, National Center for Education Statistics, National Education
Longitudinal Study of 1988, "Base-Year Student" survey.
Table A57Standard errors for Fi ure 3.2
Socioeconomic statusLow Medium Hi
Total 1.703 1.470 0.768
Ethnic groupsMexican 2.118 1.926 0.649
Cuban 4.889 4.932 5.279
Puerto Rican 3.233 2.896 1.320
Other Hispanic 2.328 2.252 1.932
SOURCE: U.S. Department of Education, National Center for Education Statistics, National Education
Longitudinal Study of 1988, "Base-Year Student" survey.
Table A58Standard errors for Fi ure 3.3
Total
Native-born Forein-born
1.229 1.229
SOURCE: U.S. Department of Education, National Center for Education Statistics, National Education
Longitudinal Study of 1988, "Base-Year Student and Parent" surveys.
Table A59Standard errors for Table 3.1
First eneration Second leneration Third eneration
Total 1.302 1.976 2.828
SOURCE: U.S. Department of Education, National Center for Education Statistics, National Education
Longitudinal Study of 1988, "Base-Year Parent" survey.

Table A60Standard errors for Table 3.2
Non-LM LM
Total 1.230 1.230
Nativity(unadjusted)
Native-born 1.527 1.527Foreign-born 1.544 1.544
Ethnic groups(adjusted for SES)
Mexican 1.189 1.189Cuban 3.076 3.076Puerto Rican 2.520 2.520Other Hispanic 2.653 2.653
SOURCE: U.S. Department of Education, National Center for Education Statistics, National EducationLongitudinal Study of 1988, "Base-Year Student and Parent" surveys.
Table A61Unadjusted data and standard errors for Table 3.2
Non-LM LM
(percentages)
Total 22.65 77.35
Ethnic goupsMexican 18.33 81.67Cuban 12.23 87.77Puerto Rican 17.70 82.30Other Hispanic 35.74 64.26
(standard errors)
Total 1.230 1.230
Ethnic groupsMexican 1.315 1.315Cuban 3.237 3.237Puerto Rican 2.640 2.640Other H nanic 2.670 2.670
tl=90,SOURCE: U.S. Department of Education, National Center for Education Statistics, National EducationLongitudinal Study of 1988, "Base-Year Student and Parent" surveys.
158

Table A62Standard errors for Fi ure 3.4
Home Language ProficiencyLow Moderate Hi h
Total 1.740 1.170 1.385
SOURCE: U.S. Department of Education, National Center for Education Statistics, National Education
Longitudinal Study of 1988, "Base-Year Student" survey.
Table A63Standard errors for Fi ure 3.5
Tctal
HQmpAngliagtmageIn tient Moderate Frçquent
1.942 2.080 3.177
SOURCE: U.S. Department of Education, National Center fmo*i Education Statistics, National Education
Lengitudinal Study of 1988, "Base-Year Student" survey.
Table AC4Standard errors LoLtegurs 3.6
Home Language ProficiencyLow Moderate High
Total 1.740 1.170 1.385
Home language usage(adjusted for SES)
Infrequent 2.086 1.941 1.002
Moderate 1.830 1.639 1.031
Frequent 3.598 2.346 3.320
SOURCE: U.S. Department of Education, National CenterLongitudinal Study of 1988, "Base-Year Student" survey.
15Y 70
for Education Statistics, National Education

Table A65.-1.1.1.)thd'usted data and standard errors for Fi ure 3.6
HomeLow Moderate
(percentages)
Total 40.81 42.80 1639
Home language usageInfrequent 76.44 17.61 5.94Moderate 34.93 51.36 13.71Frequent 15.61 52.15 32.25
(standard errors)
Total 1.740 1.170 1.385
Home language usageInfrequent 2.050 1.905 1.003Moderate 1.866 1.666 1.032Frequent 3.266 2.308 3.310
SOURCE: U.S. Department of Education,National Center for Education Statistics, National EducationLongitudinal Study of 1988, "Base-Year Student" survey.
Table A66Standard errors for Fi ure 3 7
Total
ficlogy_Low Moderate Hi h
0.669 1.657 1.840
SOURCE: U.S. Department of Education, National Center for Education Statistics, National EducationLongitudinal Study of 1988, "Base-Year Student" survey.
160 171

Table A67-Standard errors for Table 3.3 ANSUIRWMEMZINIMNIIMMII
English language proficiencyLow Moderate High
Total 0.669 1.657 1.840
Home language proficiencyLow 1.227 1.927 2.076
Moderate 0.425 2.253 2.291
High 1.730 4.081 3.778
SOURCE: U.S. Department of Education, National Center for Education Statistics, National Education
Longitudinal Study of 1988, "Base-Year Student" survey.
Table A68-Standard errors for Table 3.4
Home Lanage ProficiencyLow Moder High
Total 1.740 1.170 1.385
Ethnic [(pups(adjusted for SES)
Mexican 2.444 1.423 1.845
Cuban 4.997 4.307 3.789
Puerto Rican 2.965 3.926 3.287Other Hispanic 3.390 2.904 2.268
Student's U.S. residency(adjusted for SES)
Native-born 2.837 1.387 2.316
<6 years 6.536 6.262 6.223
6-8 years 4.024 6.034 5.840
9-11 years 4.858 5.624 4.371
>11 years 4.941 4.549 4.826
SOURCE: U.S. Department of Education, National Center for Education Statistics, National Education
Longitudinal Study of 1988, "Base-Year Student and Parent" surveys.

Table A69-Unad usted data and standard errors for Table 3.4
Home Langui fge_erciHi hLow Moderate
(percentages)
Total 40.81 42.80 16.39
Ethnic groupsMexican 42.86 42.13 15.00Cuban 32.02 54.00 13.97Puerto Rican 3' .68 44.66 19.66Other Hispanic 38.85 42.03 19.11
Student's U.S. residencyNative-born 45.33 40.15 14.52<6 years 19.67 39.06 41.276-8 years 16.96 53.99 29.059-11 years 25.01 58.16 16.83>11 years 34.88 48.35 16.77
(standard errors)
Total 1.740 1.170 1.385
Ethnic groupsMexican 2.407 1.465 1.843Cuban 5.315 4.538 3.810Puerto Rican 2.906 3.825 3.290Other Hispanic 3.475 2.958 2.273
Student's U.S. residencyNative-born 2.848 1.413 2.317<6 years 7.009 6.350 6.2346-8 years 3.977 5.976 5.8409-11 years 4.988 5.924 4.361. .1 years 5.237 4.515 4.832
SOURCE: U.S. Department of Education, National Center for Education Statistics, National EducationLongitulinal Study of 1988, "Base-Year Student and Parent" surveys.
162

Table A70-Standard errors for Table 3.5
Eigish logilag fg_mkiguyi LinguagLaQ_c_s_slfii n
Low Moderate High Low Moderate High
Total 0.669 1.657 1.840 1.740 1.170 1.385
SESLow 0.902 2.089 2.249 2.079 1.773 2.521
Medium 0.896 1.991 2.414 2.165 1.924 1.276
High 0.063 2.730 2.730 4.035 4.188 2.251
SOURCE: U.S. Department of Education, National Center for Education Statistics, National EducationLongitudinal Study of 1988, "Base-Year Student" survey.
Table A71-Standard errors for Fi ure 3.8
English language proficiencyLow Moderate H h
Total 0.669 1.657 1.840
Student's nadvity(adjusted for SES)
Native-born 0.697 2.100 2.051Foreign-born 1.584 3.268 2.730
SOURCE: U.S. Department of Education, National Center for Education Statistics, National EducationLongitudinal Study of 1988, "Base-Year Student and Parent" surveys.
1631. 7 4

Table A72Unadtsted data and standard errors for FieseLS
nglish language proficiencyModerate :High
(percentages)
Total 3.90 31.80 64.30
Student's nativityNative-born 2.48 26.42 71.09Foreign-born 7.70 49.26 43.04
(standard errors)
Total 0.669 1.657 1.840
Student's nativityNative-born 0.711 2.177 2.173Foreign-born 1.577 3.554 3.084
SOURCE: U.S. Department of Education, National Center for Education Statistics, National EducationLongitudinal Study of 1988, "Base-Year Student and Parent" surveys.
Table A73Standard errors for Figure 3:9
High English language proficiency
Total 1.840
Student's U.S. residency(adjusted for SES)
<6 years6-8 years9-11 years>11 yearsNative-born
5.0534.7414.5994.9112.051
..SOURCE: U.S. Department of Education, National Center for Education Statistics, National EducationLongitudinal Study of 1988, "Base-Year Student and Parent" surveys.
164 1

Table A74Unad'usted data and standard errors for Fi ure 3.9
High English language proficiency
(percentages)
Total 64.30
Student's U.S. residency<6 years 25.276-8 years 36.489-11 years 43.18>11 years 59.69Native-born 71.09
(standard errors)
Total 1.840
Student's U.S. residency<6 years 4.7936-8 years 5.1899-11 years 4.824>11 years 5.259Native-born 2.173
SOURCE: U.S. Department of Education, National Center for Education Statistics, National Educe.. 3n
Longitudinal Study of 1988, "Base-Year Student and Parent" surveys.
Table A75 Standard errors for Fi ure 3.10
Home language proficiencyLow Moderate High
Total 1.740 1.170 1.385
Student's nativity(acijusted for SES)
Native-born 2.837 1.387 2.316
Foreign-born 3.318 2.845 3.306
SOURCE: U.S. Department of Education, National Center for Education Statistics, National Education
Longitudinal Study of 1988, "Base-Year Student and Parent" surveys.
1176

Table A76Unad usted data and standard errors for Fi ure 3 10
Home language proficiencyLow Moderate Hi h
(percentages)
Total 40.81 42.80 16.39
Student's nativityNative-born 45.33 40.15 14.52Foreign-born 25.18 50.03 24.78
(standard errors)
Total 1.740 1.170 1.385
Student's nativityNative-born 2.848 1.413 2.317Foreign-born 3.502 2.881 3.309
SOURCE: U.S. Department of Education, National Center for Education Statistics, National EducationLongitudinal Study of 1988, "Base-Year Student and Parent" surveys.
Table A77Standard errors for Table 3.6
JulanuaigcLow Moderate High
Total 0.669 1.657 1.840
Parent's English proficiency(adjusted for SES)
Low 1.457 2.071 2.158Moderate 0.471 4.106 4.032High 0.495 2.043 2.076
SOURCE: U.S. Department of Education, National Center for Education Statistics, National EducationLongitudinal Study of 1988, "Base-Year Student and Parent" surveys.
166

Table A78Unad'usted data and standard errors for Table 3.6
EngliskIL proficiencyModerate Hi h
(percentages)
Total 3.90 31.80 64.30
Parent's English proficiencyLow 8.35 43.24 48.41Moderate 0.86 35.90 63.24High 1.10 19.74 79.16
(standard errors)
Total 0.669 1.657 1.840
Parent's English proficiencyLow 1.457 2.196 2.297Moderate 0.472 3.999 3.908High 0.493 2.012 2.033
SOURCE: U.S. Department of Education, National Center for Ediration Statistics, National EducationLongitudinal Study of 1988, "Base-Year Student and Parent" surveys.
Table A79 Standard errors for Table 3.7
Reading Achievement M tlAjt_tg.g_i_v m nNon-LM 111 Non-LM LM
Total 2.331 1.420 2.343 1.699
Ethnic groups(adjusted for SES)
Mexican 3.283 1.805 3.090 2.182Cuban Low-N 4.290 Low-N 4.317Puerto Rican 7.691 3.258 7.675 3.713Other Hispanic 3.570 3.425 3.433 2.958
SOURCE: U.S. Department of Education, National Center for Education Statistics, National EducationLongitudinal Study of 1988, "Base-Year Student" survey.
167
1 7S

Table A80Unadtettl data and standard errors lor Table 3.7
Reading Achievement Math AchievementNon-LM LM Non-LM LM
(percentages)
Total 30.18 31.02 36.10 36.62
Ethnic groupsMexican 30.15 28.98 40.70 36.17Cuban Low-N 26.32 Low-N 30.13Puerto Rican 39.36 40.85 50.61 42.19Other Hispanic 25.03 32.78 23.63 35.23
(standard errors)
Total 2.331 1.420 2.343 1.699
Ethnic groupsMexican 3.298 1.899 3.180 2.274Cuban Low-N 4.241 Low-N 4.599Puerto Rican 7.762 3.379 7.978 3.733Other Hispanic 3.609 3.583 3.516 3.016
SOURCE: U.S. Department of Education, National Center for Education Statistics, National EducationLongitudinal Study of 1988, "Base-Year Student" survey.
Table A81Standard errors for Fi ure 3.11
Jiedng_AsLe_st_tiiv m n Math Achievement
Total 1.420 1.699
English proficiency(adjusted for SES)
Low 7.088 7.024Moderate 2.500 3.691High 1.459 1.669
SOURCE: U.S. Department of Education, National Center for Education Statistics, National EducationLongitudinal Study of 1988, "Base-Year Student" survey.
168

Table A82Unad usted data and standard errors for Fi ure 3.11
Reading Achievement Mat1iAchievcmen
(percentages)
Total 31.02 36.62
English proficiencyLow 72.08 60.40Moderate 35.35 38.59High 26.71 34.27
(standard errors)
Total 1.420 1.699
English proficiencyLow 6.772 6.680Moderate 2.564 3.754
High 1.489 1.711
SOURCE: U.S. Department of Education, National Center for Education Statistics, National Education
Longitudinal Study of 1988, "Base-Year Student" survey.
Table A83Standard err )rs for Figure 3.12
Reading achievement Math achievementSocioeconomic status
Low Medium High Low Medium High
Total 1.716 1.600 2.543 2.117 1.815 2.744
SOURCE: U.S. Department of Education, National Center for Education Statistics, National Education
Longitudinal Study of 1988, "Base-Year Student" survey.
169 1 S 0

Table A84-Standard errors for Table 3.8
Reading achievementSocioeconomic status
Math achievementSocioeconomic status
Low Medium Hi h Low Medium Hi h
Total 1.716 1.600 2.543 2.117 1.815 2.744
English proficiencyLow 7.480 Low-N Low-N 8.106 Low-N Low-NModerate 2.885 4.026 9.321 3.795 5.873 7.856High 2.051 1.981 2.975 2.376 2.336 3.872
TOIRCE: U.S. Department of Education, National Center for Education Statistics, National EducationLongitudinal Study of 1988, "Base-Year Student" survey.
Table A85-Standard errors for Figure 3.13
Total
Bilingual homeidentified as
non-LM
1.775
Bilingual homeidentified as
114
Monolingual homeidentified as
LM
Monolingual homeidentified as
non-LM
2.083 0.630 1.640
SOURCE: U.S. Department of Education, National Center for Education Statistics, National EducationLongitudinal Study of 1988, "Base-Year Student and Teacher" surveys.
Table A86-Standard errors for Figure 3.14
English language proficiencyLow Moderate Hi h
Total 0.669 1.657 1.840
LM statusRecognized LM 1.292 2.191 2.490Nonrecognized LM 0.380 2.330 2.364
SOURCE: U.S. Department of Education, Natio J Center for Education Statistics, National EducationLongitudinal Study of 1988, "Base-Year Student and Teacher" surveys.
170

Table A87-Standard errors for Fi ure 3.15
English r iLow Hi h
Total 0.669 1.657 1.840
NETIL statusNETIL 5.820 5.899 4.374Non-NETIL 0.369 2.008 2.041
SOURCE: U.S. Department of Education, National Center for Education Statistics, National EducationLongitudinal Study of 1988, "Base-Year Student and Teacher" surveys.
Table A88-Standard errors for Table 3.9
au i5_11N,ILLI a non-English uagg__
Lan ua e Arts Mathematics Other sub'ects
Total 0.693 0.779 0.751
SES(unadjusted)
Low 1.006 1.161 1.057Medium 0.910 . 1.042 0.931High .. 1.150 0.999 0.980
Student's nativity(adjusted for SES)
Native-born 0.723 0.733 0.653Foreign-born 2028, 1.942 2.138
LM status(adjusted for SES)
Recognized LM 1.170 1.092 1.289Nonrecognized LM 1.017 0.760 0.810
English language proficiency(adjusted for SES)
Low 5.750 10.819 10.954Moderate 1.203 1.480 1.232tligh 0.645 0.616 0.523
SOURCE: U.S. Department of Education, National Center for Education Statistics, National EducationLongitudinal Study of 1988, "Base-Year Student, Parent, and Teacher" surveys.
171 182

Table A89 Standard errors for Table 3.9
ailbjr&a=0_in_g_nag::Englisjanguagt__d
Language arts, Mathematics
(percentages)
Other sub'ects
Total 8.46 7.98 6.49
Student's nativityNative-born 6.31 5.11 4.27Foreign-born 13.17 17.11 12.04
LM statusRecognized LM 6.74 4.64 4.61Nonrecognized LM 8.54 9.78 7.27
English proficiencyLow 18.34 38.95 32.67Moderate 13.89 12.10 9.60High 5.14 3.98 3.33
(standard errors)
Total 0.693 0.779 0.751
Student's nativityNative-boin 0.747 0.759 0.664Foreign-born 2.136 1.968 2.217
LM statusRecognized LM 1.058 0.813 0.791Nonrecognized LM 1.198 1.131 1.306
English proficiencyLow 5.627 10.542 10.858Moderate 1.256 1.531 1.249High 0.657 0.629 0.530
SOURCE: U.S. Department of Education, National Center for EduocLongitudinal Study of 1988, "Base-Year Student, Parent, and Teacher" surveys.
172
'Rtics, National Education

Table A90-Standard errors for Table 3.10
Ever enrolledin language
rip_22:_am
Enrolled in2m_t3r.c.d
Enrolled in4th, 5th, 6th al
Enrolled in7th, 8th grd
Total 1.179 2.953 2.916 3.146
SES(unadjusted)
Low 1.817 2.971 3.409 2.247
Medium 1.489 7.362 5.042 8.433
High 2.225 Low. N Low-N Low-N
LM status(adjusted for SES)
Recognized LM 1.692 3.759 4.174 3.379
Nonrecognized LM 1,174 5.477 6.231 5.443
NETIL status(adjusted for SES)
NETIL 4.896 7.978 7.928 7.661
Non-NETIL 1.172 3.150 3.544 2.679
English proficiency(adjusted for SES)
Low 7.515 .3492 12.536 11 026
Moderate 2.062 3,847 4.430 3.913
High 1.138 3.258 3.918 2.577
SOURCE: U.S. Department of Education, National Center for Education Statistics, National Education
Longitudinal Study of 1988, "Base-Year Swdent and Teacher" sw veys.
1 84173

Table A91-Unad'usted data and standard errors for Table 3.10
Ever enrolledin language Enrolled inro. m 1st, 2nd, 3rd rd
Enrolled in4th, 5th, 6th
Enrolled ind '7th, 8th
(percentages)
Total 20.10 66.44 45.13 18.86LM status
Recognized LM 27.05 66.65 44.22 15.58Nonrecognized LM 12.31 67.80 42.03 21.83NETIL status
NETIL 44.78 45.15 57.48 30.09Non-NETIL 16.91 73.72 39.17 14.43
English proficiencyLow 52.33 34.07 53.14 32.94Moderate 30.28 64.88 49.25 21.34High 12.96 76.09 38.72 12.19
(standard errors)
Total 1.179 2.953 2.916 3.146LM status
Recognized LM 1.701 3.725 4.090 3.430Nonrecognized LM 1,234 5.391 5 706 5.516NETIL status
NETIL 4.745 7.839 7.651 8.055Non-NETIL 1.211 3.122 3.392 2.724English proficiency
Low 7.087 9.718 12.390 12.578Modefate 2.139 3.842 4.332 3.934High 1.162 3.183 3.774 2.460
SOURCE: U.S. Department of Education, National Center for Education Statistics, National EducationLongitudinal Study of 1988, "Base-Year Student and Teacher" surveys.
174

Table A92Standard errors for Table 3.11
__Esaanz
FCSIR7Kfalt1111111117106.
Non-LM 1.1V1 Non-LM LM
Total 2.331 1.420 2.343 1.699
LM status(adjusted for SES)
Recognized LM 2.Z95 1.932
Nonrecognized LM 7.592 1.850 5.753 2.289Recognized non-LM 2.423 2.540
These cells are empty. Non-LM students are either recognized non-LM or nonrecognized LM; LM students are
either recognized LM or non-recognized LM. Placement depends upon teacher descriptions.
SOURCE: U.S. Department of Education, National Center for Education Statistics, National EducationLongitudinal Study of 1988, "Base-Year Student and Teacher" surveys.
Table A93Standard errors for Taloe 3.11
Achievemot
1111NirilrIMINNIt
Kat Achievement__IkadingNon-LM LM Non-L M LM
(percentages)
Total 30.18 31.02 36.10 36.62
LM statusRecognized LM 34.57 18.14Nonrecognized LM 30.26 25.11 49.30 31,20Recognized non-LM 27.66 32.99
(standard errors)
Total 2.331 1.420 2.343 1.699
LM statusRecognized LM 2.383 1.964Nonrecognized LM 7.785 1.897 5.866 2.362Recognized non-LM 2.432 2.640
These cells are empty. Non-LM students are either recognized non-LM or nonrecognized LM; LM students are
either recognized LM or non-recognized LM. Placement depends upon teacher descriptions.
SOURCE: U.S. Department of Education, National Center for Education Statistics, National EducationLongitudinal Study of 1988, "Base-Year Student and Teacher" surveys.
1751ST

Table A94Standard errors for Fi ure 3.16
Total
Academic Vocational General Special Other/program program program progam unknown plans
1.223 0.996 0.683 0.545 1.028
SOURCE: U.S, Department of Education, IZtional Center for Education Statistics, National EducationLongitudinal Study of 1988, "Bas6-Year Student" survey.
Table A95Standard errors for Figure 3.17
Very surewill graduate
Probably sure Probably/surelywill graduate will not graduate
Total 1.106 0.976 0.432
SOURCE: U.S. Department of Education, National Center for Education Statistics, National EducationLongitudinal Study of 1988, "Base-Year Student" survey.
176 V:

Table A96-Standard errors for Table 3.12
Plan to_enroll inVocational General Special
Unknown or otherplansAcademic
Total 1.223 0.996 0.683 0.545 1.028
SES(unadjusted)
Low 1.322 1.307 1.040 0.625 1.351Medium 1.658 1.799 1.009 0.941 1.585High 3.254 2.304 2.101 1.233 3.140
English proficiency(adjusted for SES)
Low 3.194 6.915 2.764 1.781 6.112Moderate 1.767 1.945 1.678 0.645 2.096High 1.514 1.213 0.875 0.847 1.398
SOURCE: U.S. Department of Education, National Center fa; Education Statistics, National EducationLongitudinal Study of 1988, "Base-Year Student" survey.
Table A97-Unad'usted data and standard errors for Table 3.12
1212lliggLa.lr11 in
General SpecialUr 'mown or other
plansAcademic Vccational
(percentages)
Total 22.51 22.33 10.63 5.18 39.35
English proficiencyLow 8.17 31.61 6.69 2.42 51.11Moderate 18.21 24.18 10.22 3.17 44.22High 24.94 22.17 10.65 6.18 36.06
(standard errors)
Total 1.223 0.9°6 0.683 0.545 1.02w
English proficiencyLow 2.967 6.811 2.722 1.769 6.346Moderate 1.739 1.942 1.653 0.642 2.160High 1.546 1.231 0.815 0.849 1.385
SOURCE: U.S. Department of Education, National Center for Education Statistics, National EducationLongitudinal Study of 1988, "Base-Year Student" survey.

Table A98Standard errors for Table 3.13
Very surewill graduate
obably surewill graduate
Probably/surelywill not graduate
Total 1.106 0.976 0.432
SES(unadjusted)
Low 1.497 1.348 0.712Medium 1.316 1.260 0.451High 2.068 2.026 0.496
NEM status(adjusted for SES)
NETIL 3.825 3.779 2.385Non-NETIL 1.073 0.990 0.380
English proficiency(adjusted for SES)
Low 7.709 7.257 4.264Moderate 2.170 2.161 0.918High 1.285 1.137 0.418
SOURCE: U.S. Department of Education, National Center for Education Statistics, National EducationLongitudinal Study of 1988, "Base-Year Student and Teacher" surveys.
1784. S

Table A99Unadjusted data and standard errors for Table 3.13
Very sure Probably surewill graduate will graduate
Probably/surelywill not graduate
(percentages)
Total 70.69 25.83 3.48
NETIL statusNETIL 51.36 40.21 8.43Non-NETIL 73.28 23.92 2.80
English proficiencyLow 49.24 40.10 10.66Moderate 59.32 36.70 3.98High 75.61 22.01 2.38
(standard errors)
Total 1.106 0.976 0.432
NETIL statusNETIL 4.016 3.849 2.420Non-NETIL 1.142 1.039 0.389
English proficiencyLow 8.145 7.507 4.319Moderate 2.149 2.114 0.938High 1.334 1.163 0.430
SOURCE: U.S. Department of Education, National Center for Education Statistics, National EducationLongitudinal Study of 1988, "Base-Year Student and Teacher" surveys.
179
I ()
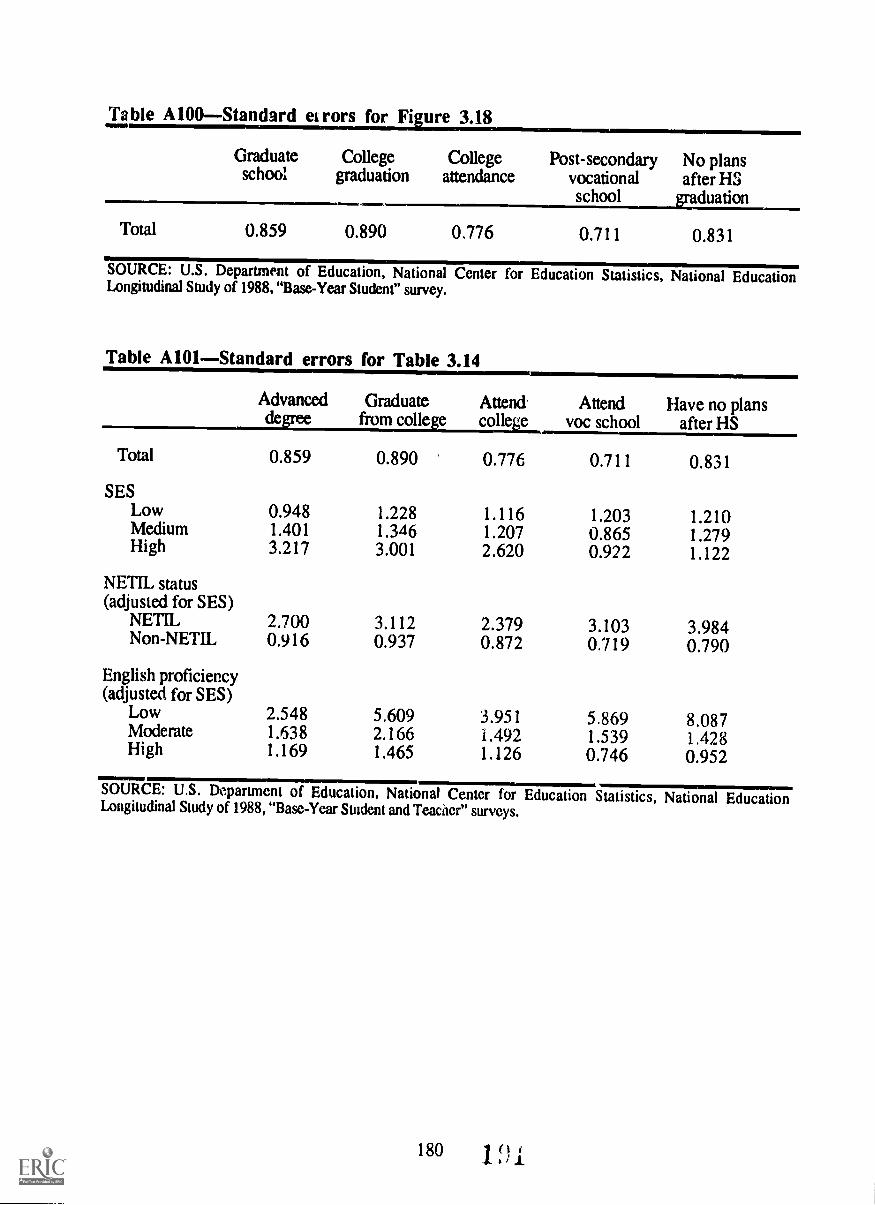
Table A100-Standard errors for Fi ure 3.18
Graduateschool
College Collegegraduation attendance
Total 0.859 0.890 0.776
Post-secondaryvocationalschool
0.711
No plansgraaftdeuraHtioSn
0.831
SOURCE: U.S. Department of Education, National Center for Education Statistics, National EducationLongitudinal Study of 1988, "Base-Year Student" survey.
Table A101-Standard errors for Table 3.14
Advanceddegree
Graduatefrom colle e
Attendcolleen_
Attendvoc school
Have no plansafter HS
Total 0.859 0.890 0.776 0.711 0.831
SESLow 0.948 1.228 1.116 1.203 1.210Medium 1.401 1.346 1.207 0.865 1.279High 3.217 3.001 2.620 0.922 1.122
NETIL status(adjusted for SES)
NETIL 2.700 3.112 2.379 3.103 3.984Non-NETIL 0.916 0.937 0.872 0.719 0.790
English proficiency(adjusted for SES)
Low 2.548 5.609 3.951 5.869 8.087Moderate 1.638 2.166 1.492 1.539 1.428High 1.169 1.465 1.126 0.746 0.952
SOURCE: U.S. Department of Education, National Center for Education Statistics, National EducationLongitudinal Study of 1988, "Base-Year Studentand Teacher" surveys.
180 1(1

Table A102-Unad4usted data and standard errors for Table 3.14
Advanceddegyee
Graduatefrom college
Attendcollege
Attendvoc sclaool
Have no plansafter HS
(percentages)
Total 21.49 33.22 17.07 10.71 17.50
NETIL statusNETIL 15.12 21.64 14.59 15.47 33.19Non-NETIL 22.24 34.08 17.20 10.54 15.93
English proficiencyLow 5.02 20.69 12.09 20.60 41.61Moderate 18.83 30.96 18.14 11.44 20.63High 24.21 33.40 18.50 9.84 14.06
(standard errors)
Total 0.859 0.890 0.776 0.711 0.831
NETIL statusNETIL 2.768 3.003 2.385 3.122 3.898Non-NETIL 0.981 0.961 0.883 0.728 0.835
English proficiencyLow 2.496 5.723 4.005 5.851 8.033Moderate 1.650 2.22'7 1.491 1.550 1.475High 1.208 1.483 1.131 0.768 0.974
SOURCE: U.S. r nartment of Education, National Center for Education Statistics, National EducationLongitudinal Study b. 1988, "Base-Year Student and Teacher" surveys.

Table A103-Standard errors for Table 3.15
Parental expectations:No HS HS Vocational Some College Advanceddiploma diploma school college graduation degee
Total 0.206 0.896 0.602 1.009 0.983 0.945
SESLow 0.387 1.540 0.946 1.457 1.366 1.120Medium 0.170 1.015 0.943 1.418 1.673 1.365High 0.000 1.179 0.804 1.410 3.229 3.248
SOURCE: U.S. Department of Education, National Center for Education Statistics, National EducationLongitudinal Study of 1988, "Base-Year Student and Parent" surveys.
Table A104-Standard errors for Fi ure 3.19
Parental t,xpectat:ons:College
graduationAdvanced
degree
Total 0.983 0.945
English proficiency(adjusted for SES)
Low 4.317 4.672Moderate 1.687 1.916High 1.295 1.325
SOURCE: U.S. Department of Education, National Center for Education Statistics, National EducationLongitudinal Study of 1988, "Base-Year Student and Parent" surveys.
182( j
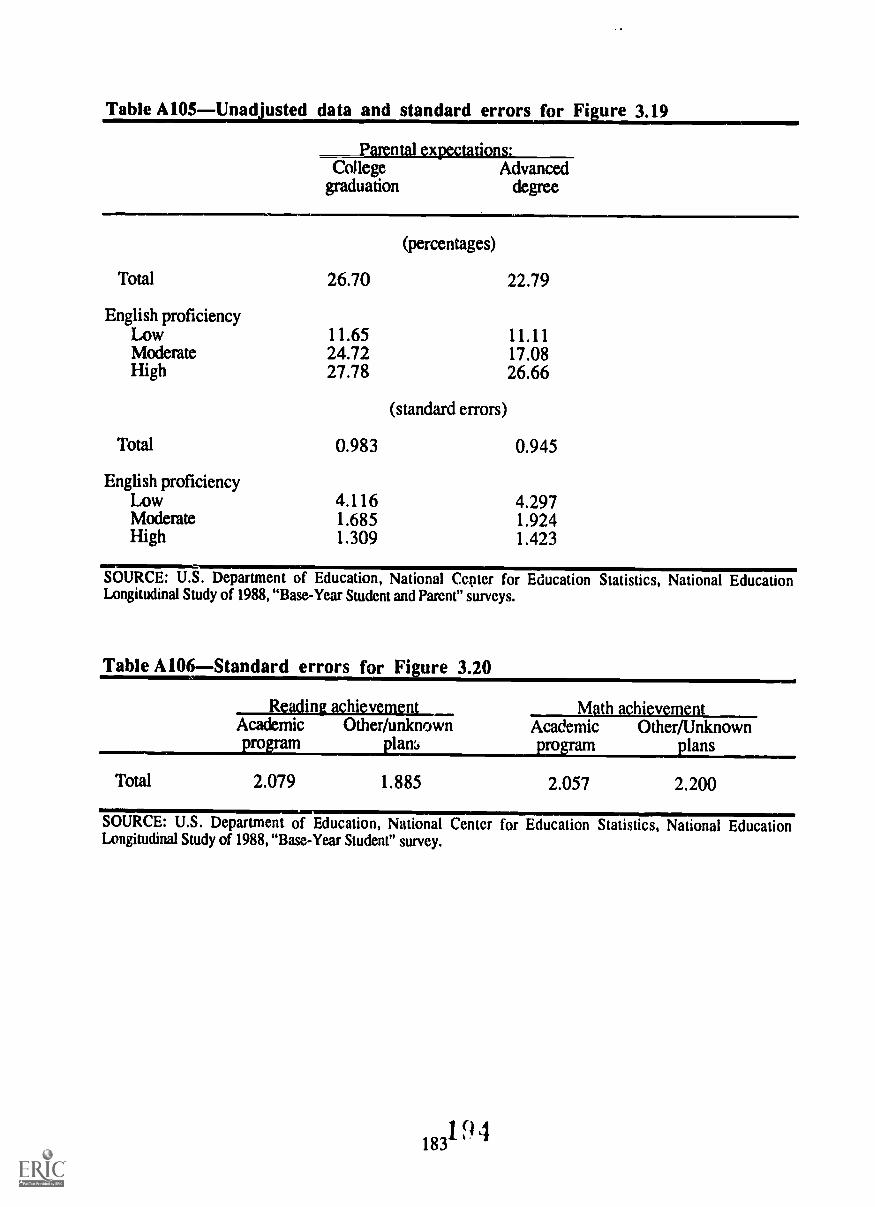
Table A105Unad'usted data and standard errors for Fi ure 3.1941=
_girdlipj_sairsjap:DAK____College Advanced
graduation degree
(percentages)
Total 26.70 22.79
English proficiencyLow 11.65 11.11Moderate 24.72 17.08High 27.78 26.66
(standard errors)
Total 0.983 0.945
English proficiencyLow 4.116 4.297Moderate 1.685 1.924High 1.309 1.423
SOURCE: U.S. Department of Education, National Cepter for Education Statistics, National EducationLongitudinal Study of 1988, "Base-Year Student and Parent" surveys.
Table A106Standard errors for Figure 3.20
Reading achievement Math achievementAcademic Other/unknown Academic Other/Unknown
ro lans
Total 2.079 1.885 2.057 2.200
SOURCE: U.S. Department of Education, National Center for Education Statistics, National EducationLongitudinal Study of 1988, "Base-Year Student" survey.

Table A107Standard errors for Figure 3.21
i_tetICLaiiii dliSySagat Math achievementVery sure Probably sure Probably/surely Very sure Probably sure Probably/surely
will will will not will will will notgraduate graduate graduate graduate graduate graduate
Total 1.503 2.209 5.325 1.514 3.096 5,302
SOURCE: U.S. Department of Education, National Center for Education . tatistics, National EducationLongitudinal Study of 1988, "Base-Year Student" survey.
Table A108Standard errors for Figure 3.22
Advanced College College Vocational No plansdegree demtendance school after HS
Reatling achievement
Total 2.469 1.907 2.376 3.279 2.595
Math achievement
Total 2.364 1.739 3.327 3.319 2.962
SOURCE: U.S. Department of Education, National Center for Education Statistics, National EducationLongitudinal Study of 1988, "Base-Year Student" survey.
Table Al09Standard errors for Fi ure 3.23
Total
Total
PAdvanced College Vocational HS
school vaduation_
Reading achievement
1.439 1.577 3.583 3.747
Math achievement
1.714 1.968 3.931 3.254
SOURCE: U.S. Department of Education, National Center for Education Statistics, National EducationLongitudinal Study of 1988, "Base-Year Student and Parent" surveys.
184

9
ISBN 0-16-036115-X
811 61 36111

United StatesDepartment of Education
Washington, D.C. 20208-5651
Official BusinessPenalty for Private Use, $300
Postage and Fees PaidU.S. Department of Education
Permit No. G-17
FOURTH CLASS BOOK RATE