landscapes of west africa - usgs
TRANSCRIPT

AA Window on a Changing World
Landscapes of West A
frica: A W
indow on a C
hanging World
Landscapes of West Africa, A Window on a Changing World presents a vivid picture of the changing natural environment of West Africa. Using images collected by satellites orbiting hundreds of miles abovethe Earth, a story of four decades of accelerating environmental change is told. Widely varied landscapes— some changing and some unchanged — are revealing the interdependence and interactions betweenthe people of West Africa and the land that sustains them. Some sections of this atlas raise cause for concern, of landscapes being taxed beyond sustainable limits. Others offer glimpses of resilient and resourceful responses to the environmental challenges that every country in West Africa faces. At the center of all of these stories are the roughly 335 million people who coexist in this environment; about three times the number of people that lived in the same space nearly four decades ago.
This rapid growth of West Africa’s population has driven dramatic loss of savanna, woodlands, forests and steppe. Most of this transformation has been to agriculture. The cropped area doubled between 1975 and 2013. Much of that agriculture feeds a growing rural population, but an increasing fraction goes to cities like Lagos, Ouagadougou, Dakar and Accra as the proportion of West Africans living in cities has risen from 8.3 percent in 1950 to nearly 44 percent in 2015. The people of West Africa and their leaders must navigate an increasingly complex path, to meet the immediate needs of a growing
population while protecting the environment that will sustain it into the future. This atlas contributes quantifiable information and meaningful perspective that can helpguide West Africa and its people to a more sustainable future.
Landscapes of West AfricaA WindoW on A ChAnging World

Back of cover

Landscapes of West AfricaA WindoW on A ChAnging World

Editorial and Production Team
Comité Inter-états de Lutte contre la Sécheresse dans le Sahel (CILSS)Issifou Alfari, GIS and Remote Sensing SpecialistEdwige Botoni, Natural Resources Management SpecialistAmadou Soulé, Monitoring and Evaluation Specialist
U.S. Geological Survey Earth Resources Observation and Science (USGS EROS) CenterSuzanne Cotillon, Geographer*W. Matthew Cushing, GIS SpecialistKim Giese, Graphic Designer*John Hutchinson, CartographerBruce Pengra, Geographer*Gray Tappan, Geographer
University of ArizonaStefanie Herrmann, Geographer
U.S. Agency for International Development/West Africa (USAID/WA)Nicodeme Tchamou, Regional Natural Resource Management and Climate Change Adviser
Funding and Program Support
Regional Office of Environment and Climate Change ResponseU.S. Agency for International Development/West AfricaAccra, Ghana
Copyright ©2016, Comité Permanent Inter-états de Lutte contre la Sécheresse dans le Sahel (CILSS)No use of this publication may be made for resale or for any other commercial purpose whatsoever without prior permission in writing from CILSS.
CILSS03 B.P. 7049Ouagadougou, Burkina FasoTel: (226) 30 67 58www.cilss.bf
To be cited as: CILSS (2016). Landscapes of West Africa – A Window on a Changing World. U.S. Geological Survey EROS, 47914 252nd St, Garretson, SD 57030, UNITED STATES.
Any use of trade, firm, or product names is for descriptive purposes only and does not imply endorsement by the U.S. Government.
*SGT Inc., Contractor to the U.S. Geological Survey, Contract G15PC00012
PHOTOS (COVER): GRAY TAPPAN/USGS; ROBERT WATREL/SDSU; ERIC LANDWEHR/SDSU; RICHARD JULIA

Table of ConTenTs
Preface .................................................................................................................................. iiForeword ............................................................................................................................ iii
Acknowledgements ........................................................................................................ ivIntroduction .....................................................................................................................vii
2.1 Benin ................................................................................................................. 74
2.2 Burkina Faso ............................................................................................ 82
2.3 Cabo Verde ................................................................................................ 90
2.4 Côte d’Ivoire ............................................................................................ 96
2.5 Gambia (The) ........................................................................................104
2.6 Ghana .............................................................................................................110
2.7 Guinea ...........................................................................................................118
2.8 Guinea-Bissau......................................................................................126
2.9 Liberia ............................................................................................................132
1.1 Landscapes and Physical Geography .........................3
Physical Geography .........................................................................................3Bioclimatic Regions .........................................................................................7
Landscapes of the Sahara Desert ............................................ 11Ecological Regions ........................................................................................ 13Biodiversity and Protected Areas ........................................................... 16
The W-Arly-Pendjari Transboundary Reserve ....................... 20
1.2 Approach to Monitoring Land Resources .......... 25
Satellite Imagery ........................................................................................... 25Mapping Land Use and Land Cover ....................................................... 26Land Cover Modification ............................................................................ 28
1.3 Drivers of Land Changes.......................................................... 30
Population ....................................................................................................... 31Climate ........................................................................................................... 34
1.4 Land Productivity ............................................................................. 38
1.5 Land Use and Land Cover Trends ................................. 42 from 1975 to 2013
West Africa Land Use and Land Cover Maps ....................................... 44Land Use and Land Cover Classes .......................................................... 50
Special Landscapes of West Africa .......................................... 56Agriculture Expansion ................................................................................. 59Settlements Growth ..................................................................................... 62Deforestation of the Upper Guinean Forest ........................................ 66Mangrove Changes ...................................................................................... 68Landscape Restoration and Re-greening ............................................. 70
2.10 Mali ................................................................................................................140
2.11 Mauritania ............................................................................................148
2.12 Niger ............................................................................................................156
2.13 Nigeria .......................................................................................................164
2.14 Senegal .....................................................................................................174
2.15 Sierra Leone .......................................................................................184
2.16 Chad .............................................................................................................192
2.17 Togo ..............................................................................................................200
Chapter 1: West Africa’s Changing Environment .......................................................................................................................1
Chapter 2: Country Profiles, Land Use and Land Cover, and Trends .....................................73
References .......................................................................................................................208Acronyms and Abbreviations ...................................................................................214Index .................................................................................................................................215

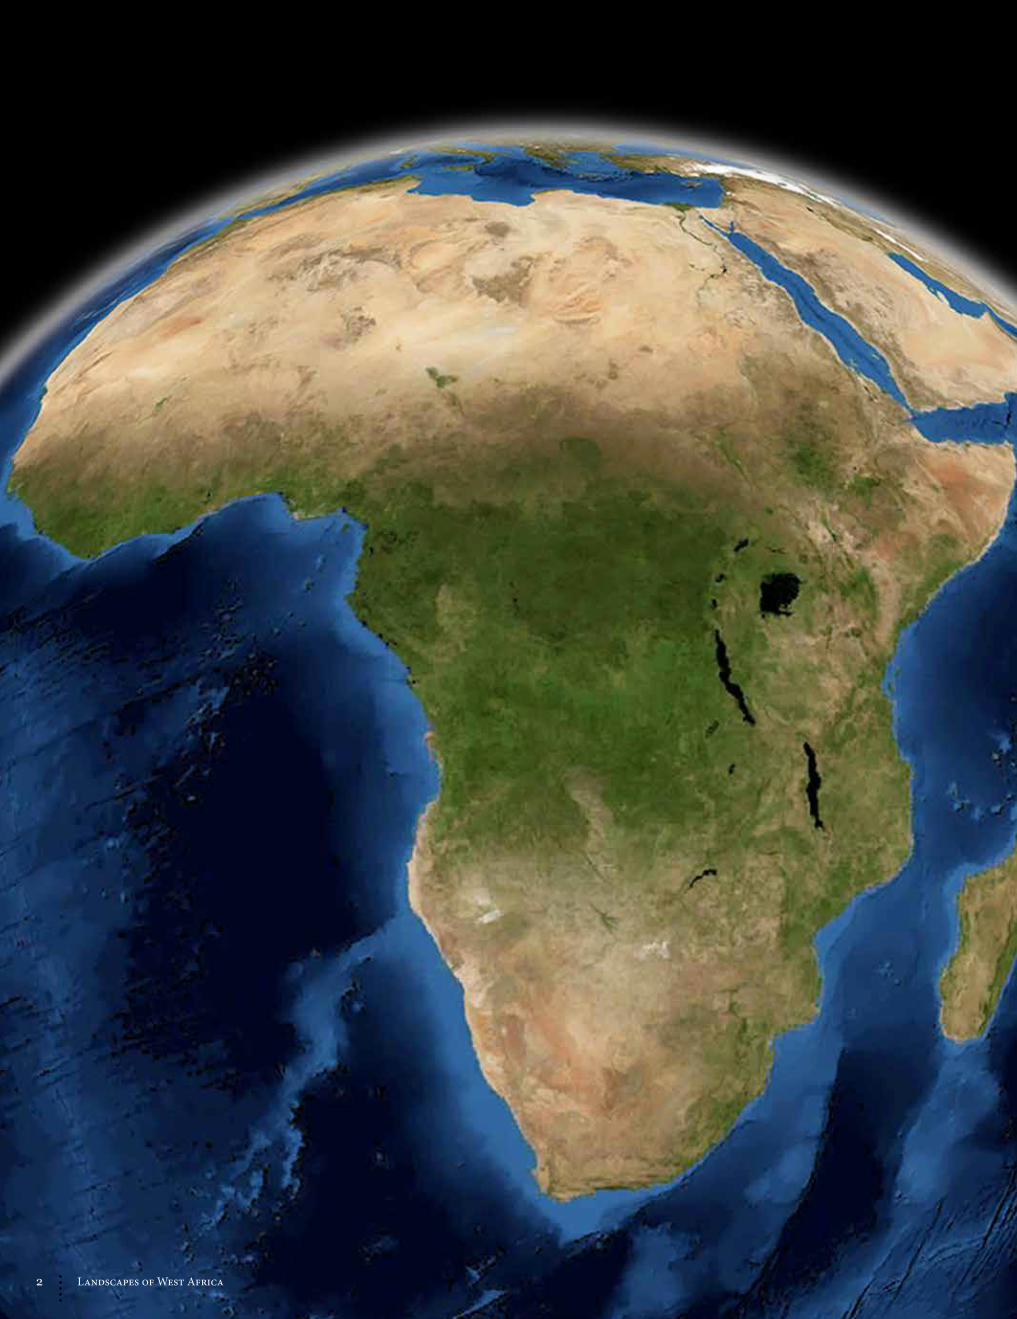
On October 12, 2015, the Lunar Reconnaissance Orbiter took this striking view of the Earth as it circled
134 km above Compton Crater on the Moon, near the terminator between day and night. The sharp
black outline of the lunar horizon is from mountains still on the night side of the terminator, silhouetted
against the lower limb of the Earth. This image is reminiscent of the iconic Earthrise photograph taken
by the crew of Apollo 8 as they orbited the Moon on December 24, 1968. Many people credit that unique
view of our home planet as having sparked the environmental movement that so shaped our thinking
about our planet during the 1970s and beyond.
Apart from its beauty, this image of the Earth from the Moon shows the African continent quite prominently.
A great amount of cloud cover characterizes the blue planet. Several large areas are, however, clear: the
deserts of North Africa and the Middle East, and in the Southern Hemisphere, the drylands of southern
Africa. The tropical regions of Africa’s mid-section are partially covered by belts of clouds that mark the
intertropical convergence zone, where the northern and southern circulation patterns merge.
Source: NASA, Lunar Reconnaissance Orbiter

A Window on a Changing World i
ii Landscapes of West Africa
PrefaCe
Dr. Djimé Adoum
Since the 1970s, West Africa has experienced many forms of climate stress — heavy rains, floods, and periods of drought. Drought has had a particularly devastating impact on agricultural production, pastoral livelihoods, and natural ecosystems. Economic losses alone are estimated in billions of dollars.
The concerns raised by these climate stressors have translated into initiatives to combat desertification and to adapt to climate change. The Comité Inter-états de Lutte contre la Sécheresse dans le Sahel (CILSS – The Permanent Interstate Committee for Drought Control in the Sahel) and the U.S. Agency for International Development (USAID) have put in place activities to benefit the population of the Sahel and all of West Africa.
The West Africa Land Use Dynamics (LULC) Project is emblematic of this cooperation. Initiated in 1999, the LULC project has had several phases including training national experts to extract pertinent information from satellite images to characterize vegetation cover and producing tools and supporting information on land cover dynamics.
This atlas — Landscapes of West Africa: Window on a Changing World — is part of the current phase of the LULC project and provides insights into the changes occurring at national and regional levels through mapping time series data from 1975 to 2013. This work highlights landscapes that have undergone major transformations, and examines the drivers of change and their environmental and socioeconomic impacts.
The atlas showcases the accomplishments of the LULC project, and makes a case for further investment in natural resource management. Aimed at both decision-makers and the general public, the Atlas has a goal of making people aware of the changes taking place in the landscapes of the region.
Beyond raising awareness, the atlas also aims to incite action to protect the environment of West Africa and the Sahelian region. We therefore invite everyone — scientists, students, researchers, teachers, planners, managers of development or research projects, local, national and regional decision-makers, donors, members of civil society organizations, and visitors to the region — to make the most of this work.
Congratulations to the experts at CILSS, U.S. Geological Survey, USAID and the country-level teams of the LULC project for this fruitful partnership. We truly hope that this cooperation will continue and deepen, with the view of regaining the equilibrium of ecosystems. Doing so will constitute a decisive step towards realizing a green economy in West Africa, thereby enhancing the well-being of all West African people.
Djimé Adoum, Ph.D,Executive Secretary
CILSS
Ouagadougou, Burkina Faso

iiiA Window on a Changing World
At the core of the U.S. Agency for International Development’s (USAID’s) mission is a deep commitment to work as partners in fostering sustainable development. Environments that are vulnerable to changing climate patterns are often the most reliant on agriculture for food and income, and the least able to financially protect themselves or respond to disasters. As effects of climate change are felt more severely, advanced mitigation and adaptation measures are key to resilience.
Rapid changes are occurring across West Africa’s natural and human landscapes and balancing the need to preserve natural ecosystems with the need to grow more food, together with ensuring resilience in the same ecosystems, is a challenge. USAID West Africa’s (USAID/WA) Environmental Threats and Opportunity Assessment and its Climate Change Vulnerability Assessment revealed that timely and accurate information, indispensable for good governance in the environmental sector, is scant and barely accessible. Mitigating climate change impacts and conserving biodiversity can support sustainable development, and prevent countries from sliding further into poverty.
USAID/WA worked in partnership with the U.S. Geological Survey (USGS) and the Comité Inter-états de Lutte contre la Sécheresse dans le Sahel (CILSS – The Permanent Interstate Committee for Drought Control in the Sahel), to analyze changes in land use and land cover in West Africa and to better understand trends over the past 40 years with the goal of improving decision-making in land management. Products derived from these analyses include maps that provide a clear record of changes and trends in three periods — 1975, 2000 and 2013 — in 17 West African countries and aggregated to the regional level.
These maps and analyses form the foundation for future landscape scenarios and contribute to a body of best practices for the re-greening of landscapes in West Africa. Application of the atlas and associated data goes beyond informing decision-making on land
use planning. The time series maps provide credible information to help countries account for their carbon emissions to the United Nations Framework Convention on Climate Change and can also be used to quantify carbon emission trends in West Africa for the past 40 years.
This achievement would not have been possible without the U.S. Landsat Program. Landsat satellites have provided the longest-ever continuous global record of the Earth’s surface. A partnership of the National Aeronautics and Space Administration and the USGS, the Landsat program provides image data that show the impact of human society on the planet — a crucial measure as the world’s population has already surpassed seven billion people. The first Landsat satellite was launched in 1972 and now, 44 years later, Landsats 7 and 8 are continuing to provide an unbroken record of the Earth, providing critical information for monitoring, understanding and managing our resources of food, water, and forests. No other satellite program in the world comes close to providing such a long, unbroken record of geospatial information of the planet.
Knowing that these analyses will be put to use for decision making in natural resource management, I would like to thank all of the teams that worked tirelessly to produce this Landscapes of West Africa atlas. And my sincere gratitude goes to CILSS, the USGS, and the multitude of government institutions in West Africa for their commitment to completing this influential work.
Alex DeprezRegional Mission Director
USAID/West Africa
Accra, Ghana
foreword
Alex Deprez
WEST AFRICA

iv Landscapes of West Africa
aCknowledgmenTs
On behalf of the governments and the people of West Africa who have benefitted from the West Africa Land Use Dynamics Project, the Comité Permanent Inter-Etats de Lutte contre la Sécheresse dans le Sahel (CILSS – Permanent Interstate Committee for Drought Control in the Sahel) expresses its profound gratitude to all those who have contributed to the publication of this atlas. In particular, we would like to thank:
The U.S. Agency for International Development/West Africa (USAID/WA) which financed, encouraged and contributed actively to the review of this atlas;
The Resilience in the Sahel Enhanced (RISE) Program managed from USAID/Senegal’s Sahel Regional Office, which supports the work of mapping best practices and re-greening, and promotes soil and water conservation in the Sahel;
The U.S. Geological Survey Earth Resources and Observation Science (USGS EROS) Center for the scientific and technical guidance, provision of satellite imagery, maps, field data and photographs, statistics and analyses;
The AGRHYMET Regional Center under CILSS for its role in the technical coordination of the work and processing of satellite imagery;
The Directors of the Centre National de Télédétection et de Suivi Ecologique (CENATEL) in Cotonou, the Agence Nationale de Gestion de l’Environnement (ANGE) in Lomé, and the Centre de Suivi Ecologique (CSE) in Dakar who hosted mapping validation workshops , and;
The national teams from across West Africa who provided valuable content for the maps and case studies.
Members of the National TeamsBenin
Cocou Pascal Akpassonou, Chef Division Coopération Technique au Centre National de Télédétection du Bénin (CENATEL) ;
O. Félix Houeto, Chef Division Télédétection et SIG au CentreNational de Télédétection (CENATEL) du Bénin.
Burkina Faso
Raïnatou Kabré, Chargé de production et de diffusion de l’information environnementale au Secrétariat Permanent du Conseil National pour l’Environnement et le Développement Durable (CONEDD) ;
Louis Blanc Traoré, Directeur Monitoring de l’Environnement au Secrétariat Permanent du Conseil National pour l’Environnement et le Développement Durable (CONEDD).
Cabo Verde
Maria Da Cruz Gomes Soares, Directrice, Direction des Services de Sylviculture (DGASP);
Sanchez Vaz Moreno Conceiçao, Responsable Inventaires Forestiers et Cartographie, Direction des Services de Sylviculture (DGASP).
The Gambia
Peter Gibba, Senior Meteorologist, Department Of Water Resources (DWR);
Awa Kaira Agi, Program Officer CGIS UNIT, National Environment Agency (NEA).
Ghana
Emmanuel Tachie-Obeng, Environmental Protection Agency (EPA);
Emmanuel Attua Morgan, Lecturer, Department of Geography and Resource Development, University of Ghana.
Guinea
Aïssatou Taran Diallo, Agro-environnementaliste, Ministère de l’Agriculture, Service National des Sols (SENASOL) ;
Seny Soumah, Ingénieur Agrométéorologiste et Chef de Section, Direction Nationale de la Météorologie (CMN).
Guinea-Bissau
Antonio Pansau N’Dafa, Responsable Bases de Données Changements Climatiques, Secrétariat de l’Environnement Durable;
Luis Mendes Cherno, Chargé de Bases de Données Climatiques, Institut National de Météorologie.
Liberia
D. Anthony Kpadeh, Head of Agro-meteorology, Climatology and Climate Change Adaptation, Liberia Hydrological Services;
Torwon Tony Yantay, GIS Manager, Forestry Development Authority (FDA).
Mali
Abdou Ballo, Enseignant Chercheur, Faculté d’Histoire-Géographie, Université de Bamako;
Zeinab Sidibe Keita, Ingénieur des Eaux Forêts, Système d’Information Forestier (SIFOR).
Niger
Nouhou Abdou, Chef Division Inventaires forestiers et Cartographie, Direction des Aménagements Forestiers et Restauration des terres, Ministère de l’Environnement, de la Salubrité Urbaine, et du Développement Durable;
Abdou Roro, Chef du Département Cartographie, Institut Géographique National du Niger (IGNN).
Nigeria
Kayode Adewale Adepoju, Lecturer and Scientist, Obafemi Awolowo University, Ile Ife;
Esther Oluwafunmilayo Omodanisi, Lecturer, Obafemi Awolowo University, Ile Ife;

vA Window on a Changing World
aCknowledgemenTs
Sule Isaiah, Lecturer, Federal University of Technology, Minna;
Mary Oluwatobi Odekunle, Federal University of Technology, Minna.
Senegal
Samba Laobé Ndao, Cartographe et Ingénieur en Aménagement du Territoire, Direction des Eaux, Forêts, Chasse, et de la Conservation des Sols (DEFCCS), Programme PROGEDE;
Ousmane Bocoum, Cartographe, Centre de Suivi Écologique (CSE).
Sierra Leone
Samuel Dominic Johnson, System Administrator, Ministry of Agriculture, Forestry and Food Security (MAFFS).
Chad
Angeline Noubagombé Kemsol, Agronome, Assistante de Recherche, Centre National d’Appui à la Recherche (CNAR);
Ouya Bondoro, Chercheur, Centre National d’Appui à la Recherche (CNAR).
Togo
Issa Abdou-Kérim Bindaoudou, Géographe et Cartographe, Direction Générale de la Statistique et de la Comptabilité Nationale;
Yendouhame John Kombaté, Responsable Suivi Evaluation et Communication, Agence Nationale de Gestion de l’Environnement, Ministère de l’Environnement.
Contributors from the AGRHYMET Regional CenterBako Mamane, Expert en télédétection et Système d’Information Géographique (SIG);
Djibo Soumana, Expert Agrométéorologue;
Alio Agoumo, Technicien en traitement d’images;
Dan Karami, Technicien en Système d’Information Géographique.
Other Contributors
In West Africa, we would also like to acknowledge the invaluable advice, insights and assistance from:
Amadou Hadj, Geographer and Land Use Planner, Dakar, Senegal, for many fruitful years of field work and reflecting on natural resource management;
Samba Laobé Ndao, besides being part of the Senegal National Team, provided considerable support to field work, geographic databases, and logistical support to the project team;
Moussa Sall and Assize Touré at the Centre de Suivi Ecologique (CSE) in Dakar, for assistance with field
work, studies on biomass and carbon sequestration, and many long years of collaboration;
Bienvenu Sambou and Assane Goudiaby, Université Cheikh Anta Diop de Dakar/Institut des Sciences de l’Environnement (ISE), for many years of exchanges with the USGS EROS team on long-term monitoring of Sudanian ecosystems.
At the USGS EROS Center, we extend special thanks to Jan Nelson and Tom Holm for guiding the publication process. Thanks also to the manuscript reviewers, Tom Adamson and Mike Budde, and to Aaron Neugebauer for his artwork on vegetation profiles. Many thanks to Melissa Mathis for her help with GIS training, and for her major role in developing the Rapid Land Cover Mapper. We are indebted to Anne Gellner for translating much of the manuscript into French.
At the World Resources Institute (WRI), we would like to thank Chris Reij and Robert Winterbottom, and Michael McGahuey at the USAID, for their many decades of work and insight into the natural resources of the Sahel, and their tireless work on landscape restoration and re-greening for the benefit of people across the region. We are also grateful for the many landscape and cultural photographs contributed by Michiel Kupers in the Netherlands, and Robert Watrel and Eric Landwehr at South Dakota State University (SDSU). Many thanks also to Scott Benton for his excellent contribution to the study of vegetation changes on the Island of Santo Antão, Cabo Verde.
In Memory
Our thoughts are with three colleagues and friends who are no longer with us. All three contributed significantly to the success of the West Africa Land Use Dynamics Project, including major content contributions to this atlas:
Yendouhame John Kombaté, Responsable Suivi Evaluation et Communication, Agence Nationale de Gestion de l’Environnement, Ministère de l’Environnement, Togo;
Kevin Dalsted, Soil Scientist and Land Resource Specialist, South Dakota State University, for his support to the land use mapping;
Richard Julia, friend and pilot based in Ouagadougou who made it possible for the project team to acquire thousands of aerial photographs in numerous countries of West Africa, and for his own photography of landscapes, wildlife and cultures of the Sahel.

Landscapes of West Africavi

viiA Window on a Changing World
Our global ecosystem is and has always been complex, dynamic, and in constant flux. Science tells us how natural forces of enormous power have shaped and reshaped Earth’s surface, atmosphere, climate, and biota again and again since the planet’s beginnings about 4.5 billion years ago. For most of the planet’s history those environmental changes were the result of the interaction of natural processes such as geology and climate, and were described on the geological time scale in epochs spanning millions of years.
When humankind appeared on Earth around 200,000 years ago the influence of human activity on the environment must have been small and localized. The influence of scattered small groups of people on the global ecosystem would have been overwhelmed by the forces of natural systems (Steffen and others, 2007). Human population would not grow to 50 million (about 0.7 percent of the Earth’s current population) for another 197,000 years. Population growth accelerated over the centuries that followed until the planet was adding more than that 50 million people every year. Our planet is now home to roughly 7.3 billion people and we are adding 1 million more people roughly every 4.8 days (US Census Bureau, 2011). Before 1950, no one on Earth had lived through a doubling of the human
population, but now some people have experienced a tripling in their lifetime (Cohen, 2003).
With hunting and the use of fire, later agriculture and urbanization, and eventually the industrial revolution and modern technology, the ability of humans to shape their environment also grew exponentially. Earth scientists use the geologic time scale to describe time periods where different processes and forces shaped events in the Earth’s history, such as ice ages and mass extinction events. They use periods of time they call epochs, which range from 11,700 years (the Holocene) to millions of years (the Pleistocene and Neogene). In about 2000, Earth scientists coined a new word — Anthropocene — to describe a new epoch where “the human imprint on the global environment has become so large and active that it rivals some of the great forces of nature in its impact on the functioning of the Earth system” (Steffen and others, 2011). Many in the Earth sciences believe that epoch has begun and that humankind with its vast numbers and its power to change the face of the Earth is at risk of putting the Earth system out of balance and causing
the collapse of natural systems that are essential for humans to thrive, perhaps even threatening the future of all humankind.
In 2015, the 17 countries included in this atlas are estimated to have a total population of over 369 million, representing a nearly 5-fold increase since 1950 — outstripping global population growth, which grew by 2.9 fold during the same time (UN, 2015). The young age structure of the West African population assures continued rapid population growth until 2050 and beyond. If United Nations estimates are correct the 17 countries in this atlas will grow to 835 million people by 2050; that would equate to 11.1 times as many people as lived on the same land in 1950 (UN, 2015)!
Introduction
“Mai lura da ice bashin jin yunwa” — He who takes care of trees will not suffer from hunger.
– Hausa proverb
PHOTO (OPPOSITE PAGE): SUZANNE COTILLON / SGT
Population growth in Africa and the rest of the world from 1950 to 2100
YEAR
PO
PU
LATI
ON
(BIL
LIO
NS
)
1960
1970
1980
1990
2000
2010
2020
2030
2040
2050
2060
2070
2080
2090
2100
1950
12
10
12
8
6
4
2
0

Landscapes of West Africaviii
Parallel trends can be seen in the land cover changes of West Africa. With so many new families to feed, West Africa doubled the area covered by farms between 1975 and 2013. Vast areas of savanna, woodland, and forest landscape have been replaced or fragmented by cropland. At the same time villages, towns, and cities have grown in area — taking up 140 percent as much land as they had in 1975. In part to make way for those farms and settlements more than a third of the forest cover present in 1975 has been lost. In savanna and steppe landscapes of West Africa, drought, in some cases made worse by unsustainable land use practices, has degraded the vegetation cover contributing to a 47 percent increase in sandy areas (see top images
pair, opposite page). The future is unpredictable, but the trends of the past four decades projected into the future would be unsustainable.
Conversion of the natural landscapes of West Africa to agriculture greatly reduces the natural biodiversity, and exposes the soil to wind and water erosion. The savanna, woodland, forest, and wetland ecosystems that are lost have some relatively tangible impacts such as the loss of natural ecosystem goods and services like wood for fuel and construction, honey, nuts, medicines, game animals, berries, and forage. There are also many important goods and services lost that are less visible such as biodiversity, carbon storage, water quality, water runoff versus infiltration, and regional climate functions.
Wooded landscape fragmented by agriculture expansion in western Burkina Faso
JAM
ES R
OW
LAN
D /
USG
S

ixA Window on a Changing World
Expansion of degraded land in the Ferlo region of Senegal
Decline in vegetation cover and biodiversity in east-central Senegal
1994
1984
2011
2013
It is in the hands of today’s decision makers to formulate wise, well informed choices about how to manage West Africa’s land, to ensure that vital ecosystem services and agricultural productivity are able to support tomorrow’s people. To make good choices the governments of West Africa need good information about the rapid changes now occurring, the causes of those changes, and the interactions occurring between climate, land use, other human activity, and the environment.
Experts from institutions in 17 countries in West Africa have partnered with the Comité Inter-états de Lutte contre la Sécheresse dans le Sahel (CILSS – The Permanent Interstate Committee for Drought Control in the Sahel), the U.S. Agency for International Development (USAID) West Africa and the U.S Geological Survey (USGS) to map changing land use and land cover and associated factors across much of West Africa through the West Africa
Land Use Dynamics Project. This publication presents the results of that work. The following chapters present maps, graphs, tables, and images detailing the natural environment of these 17 countries and changes that have taken place over the past four decades.
This atlas tells a story of rapid environmental change with both hopeful and worrisome chapters. The story is told with maps and numbers detailing the rate, magnitude, and location of land cover change but also with words and images that seek to make the story more real for the people living in West Africa and around the globe. The hope is that this information helps to build a clearer picture of past and current land use and land cover in order to guide us all in making informed choices that will support the livelihoods and well-being of ours and future generations.
GR
AY T
APP
AN
/ U
SGS
GR
AY T
APP
AN
/ U
SGS

Landscapes of West Africa2

AA Window on a Changing World
Landscapes of West A
frica: A W
indow on a C
hanging World
Landscapes of West Africa, A Window on a Changing World presents a vivid picture of the changing natural environment of West Africa. Using images collected by satellites orbiting hundreds of miles above the Earth, a story of four decades of accelerating environmental change is told. Widely varied landscapes — some changing and some unchanged — are revealing the interdependence and interactions between the people of West Africa and the land that sustains them. Some sections of this atlas raise cause for concern, of landscapes being taxed beyond sustainable limits. Others offer glimpses of resilient and resourceful responses to the environmental challenges that every country in West Africa faces. At the center of all of these stories are the roughly 335 million people who coexist in this environment; about three times the number of people that lived in the same space nearly four decades ago.
This rapid growth of West Africa’s population has driven dramatic loss of savanna, woodlands, forests and steppe. Most of this transformation has been to agriculture. The cropped area doubled between 1975 and 2013. Much of that agriculture feeds a growing rural population, but an increasing fraction goes to cities like Lagos, Ouagadougou, Dakar and Accra as the proportion of West Africans living in cities has risen from 8.3 percent in 1950 to nearly 44 percent in 2015. The people of West Africa and their leaders must navigate an increasingly complex path, to meet the immediate needs of a growing
population while protecting the environment that will sustain it into the future. This atlas contributes quantifiable information and meaningful perspective that can help guide West Africa and its people to a more sustainable future.
Landscapes of West AfricaA WindoW on A ChAnging World

Back of cover

Landscapes of West AfricaA WindoW on A ChAnging World
Editorial and Production Team
Comité Inter-états de Lutte contre la Sécheresse dans le Sahel (CILSS)Issifou Alfari, GIS and Remote Sensing SpecialistEdwige Botoni, Natural Resources Management SpecialistAmadou Soulé, Monitoring and Evaluation Specialist
U.S. Geological Survey Earth Resources Observation and Science (USGS EROS) CenterSuzanne Cotillon, Geographer*W. Matthew Cushing, GIS SpecialistKim Giese, Graphic Designer*John Hutchinson, CartographerBruce Pengra, Geographer*Gray Tappan, Geographer
University of ArizonaStefanie Herrmann, Geographer
U.S. Agency for International Development/West Africa (USAID/WA)Nicodeme Tchamou, Regional Natural Resource Management and Climate Change Adviser
Funding and Program Support
Regional Office of Environment and Climate Change ResponseU.S. Agency for International Development/West AfricaAccra, Ghana
Copyright ©2016, Comité Permanent Inter-états de Lutte contre la Sécheresse dans le Sahel (CILSS)No use of this publication may be made for resale or for any other commercial purpose whatsoever without prior permission in writing from CILSS.
CILSS03 B.P. 7049Ouagadougou, Burkina FasoTel: (226) 30 67 58www.cilss.bf
To be cited as: CILSS (2016). Landscapes of West Africa – A Window on a Changing World. U.S. Geological Survey EROS, 47914 252nd St, Garretson, SD 57030, UNITED STATES.
Any use of trade, firm, or product names is for descriptive purposes only and does not imply endorsement by the U.S. Government.
*SGT Inc., Contractor to the U.S. Geological Survey, Contract G15PC00012
PHOTOS (COVER): GRAY TAPPAN/USGS; ROBERT WATREL/SDSU; ERIC LANDWEHR/SDSU; RICHARD JULIA

Table of ConTenTs
Preface .................................................................................................................................. iiForeword ............................................................................................................................ iii
Acknowledgements ........................................................................................................ ivIntroduction .....................................................................................................................vii
2.1 Benin ................................................................................................................. 74
2.2 Burkina Faso ............................................................................................ 82
2.3 Cabo Verde ................................................................................................ 90
2.4 Côte d’Ivoire ............................................................................................ 96
2.5 Gambia (The) ........................................................................................104
2.6 Ghana .............................................................................................................110
2.7 Guinea ...........................................................................................................118
2.8 Guinea-Bissau......................................................................................126
2.9 Liberia ............................................................................................................132
1.1 Landscapes and Physical Geography .........................3
Physical Geography .........................................................................................3Bioclimatic Regions .........................................................................................7
Landscapes of the Sahara Desert ............................................ 11Ecological Regions ........................................................................................ 13Biodiversity and Protected Areas ........................................................... 16
The W-Arly-Pendjari Transboundary Reserve ....................... 20
1.2 Approach to Monitoring Land Resources .......... 25
Satellite Imagery ........................................................................................... 25Mapping Land Use and Land Cover ....................................................... 26Land Cover Modification ............................................................................ 28
1.3 Drivers of Land Changes.......................................................... 30
Population ....................................................................................................... 31Climate ........................................................................................................... 34
1.4 Land Productivity ............................................................................. 38
1.5 Land Use and Land Cover Trends ................................. 42 from 1975 to 2013
West Africa Land Use and Land Cover Maps ....................................... 44Land Use and Land Cover Classes .......................................................... 50
Special Landscapes of West Africa .......................................... 56Agriculture Expansion ................................................................................. 59Settlements Growth ..................................................................................... 62Deforestation of the Upper Guinean Forest ........................................ 66Mangrove Changes ...................................................................................... 68Landscape Restoration and Re-greening ............................................. 70
2.10 Mali ................................................................................................................140
2.11 Mauritania ............................................................................................148
2.12 Niger ............................................................................................................156
2.13 Nigeria .......................................................................................................164
2.14 Senegal .....................................................................................................174
2.15 Sierra Leone .......................................................................................184
2.16 Chad .............................................................................................................192
2.17 Togo ..............................................................................................................200
Chapter 1: West Africa’s Changing Environment .......................................................................................................................1
Chapter 2: Country Profiles, Land Use and Land Cover, and Trends .....................................73
References .......................................................................................................................208Acronyms and Abbreviations ...................................................................................214Index .................................................................................................................................215

On October 12, 2015, the Lunar Reconnaissance Orbiter took this striking view of the Earth as it circled
134 km above Compton Crater on the Moon, near the terminator between day and night. The sharp
black outline of the lunar horizon is from mountains still on the night side of the terminator, silhouetted
against the lower limb of the Earth. This image is reminiscent of the iconic Earthrise photograph taken
by the crew of Apollo 8 as they orbited the Moon on December 24, 1968. Many people credit that unique
view of our home planet as having sparked the environmental movement that so shaped our thinking
about our planet during the 1970s and beyond.
Apart from its beauty, this image of the Earth from the Moon shows the African continent quite prominently.
A great amount of cloud cover characterizes the blue planet. Several large areas are, however, clear: the
deserts of North Africa and the Middle East, and in the Southern Hemisphere, the drylands of southern
Africa. The tropical regions of Africa’s mid-section are partially covered by belts of clouds that mark the
intertropical convergence zone, where the northern and southern circulation patterns merge.
Source: NASA, Lunar Reconnaissance Orbiter

A Window on a Changing World i

ii Landscapes of West Africa
PrefaCe
Dr. Djimé Adoum
Since the 1970s, West Africa has experienced many forms of climate stress — heavy rains, floods, and periods of drought. Drought has had a particularly devastating impact on agricultural production, pastoral livelihoods, and natural ecosystems. Economic losses alone are estimated in billions of dollars.
The concerns raised by these climate stressors have translated into initiatives to combat desertification and to adapt to climate change. The Comité Inter-états de Lutte contre la Sécheresse dans le Sahel (CILSS – The Permanent Interstate Committee for Drought Control in the Sahel) and the U.S. Agency for International Development (USAID) have put in place activities to benefit the population of the Sahel and all of West Africa.
The West Africa Land Use Dynamics (LULC) Project is emblematic of this cooperation. Initiated in 1999, the LULC project has had several phases including training national experts to extract pertinent information from satellite images to characterize vegetation cover and producing tools and supporting information on land cover dynamics.
This atlas — Landscapes of West Africa: Window on a Changing World — is part of the current phase of the LULC project and provides insights into the changes occurring at national and regional levels through mapping time series data from 1975 to 2013. This work highlights landscapes that have undergone major transformations, and examines the drivers of change and their environmental and socioeconomic impacts.
The atlas showcases the accomplishments of the LULC project, and makes a case for further investment in natural resource management. Aimed at both decision-makers and the general public, the Atlas has a goal of making people aware of the changes taking place in the landscapes of the region.
Beyond raising awareness, the atlas also aims to incite action to protect the environment of West Africa and the Sahelian region. We therefore invite everyone — scientists, students, researchers, teachers, planners, managers of development or research projects, local, national and regional decision-makers, donors, members of civil society organizations, and visitors to the region — to make the most of this work.
Congratulations to the experts at CILSS, U.S. Geological Survey, USAID and the country-level teams of the LULC project for this fruitful partnership. We truly hope that this cooperation will continue and deepen, with the view of regaining the equilibrium of ecosystems. Doing so will constitute a decisive step towards realizing a green economy in West Africa, thereby enhancing the well-being of all West African people.
Djimé Adoum, Ph.D, Executive Secretary
CILSS
Ouagadougou, Burkina Faso

iiiA Window on a Changing World
At the core of the U.S. Agency for International Development’s (USAID’s) mission is a deep commitment to work as partners in fostering sustainable development. Environments that are vulnerable to changing climate patterns are often the most reliant on agriculture for food and income, and the least able to financially protect themselves or respond to disasters. As effects of climate change are felt more severely, advanced mitigation and adaptation measures are key to resilience.
Rapid changes are occurring across West Africa’s natural and human landscapes and balancing the need to preserve natural ecosystems with the need to grow more food, together with ensuring resilience in the same ecosystems, is a challenge. USAID West Africa’s (USAID/WA) Environmental Threats and Opportunity Assessment and its Climate Change Vulnerability Assessment revealed that timely and accurate information, indispensable for good governance in the environmental sector, is scant and barely accessible. Mitigating climate change impacts and conserving biodiversity can support sustainable development, and prevent countries from sliding further into poverty.
USAID/WA worked in partnership with the U.S. Geological Survey (USGS) and the Comité Inter-états de Lutte contre la Sécheresse dans le Sahel (CILSS – The Permanent Interstate Committee for Drought Control in the Sahel), to analyze changes in land use and land cover in West Africa and to better understand trends over the past 40 years with the goal of improving decision-making in land management. Products derived from these analyses include maps that provide a clear record of changes and trends in three periods — 1975, 2000 and 2013 — in 17 West African countries and aggregated to the regional level.
These maps and analyses form the foundation for future landscape scenarios and contribute to a body of best practices for the re-greening of landscapes in West Africa. Application of the atlas and associated data goes beyond informing decision-making on land
use planning. The time series maps provide credible information to help countries account for their carbon emissions to the United Nations Framework Convention on Climate Change and can also be used to quantify carbon emission trends in West Africa for the past 40 years.
This achievement would not have been possible without the U.S. Landsat Program. Landsat satellites have provided the longest-ever continuous global record of the Earth’s surface. A partnership of the National Aeronautics and Space Administration and the USGS, the Landsat program provides image data that show the impact of human society on the planet — a crucial measure as the world’s population has already surpassed seven billion people. The first Landsat satellite was launched in 1972 and now, 44 years later, Landsats 7 and 8 are continuing to provide an unbroken record of the Earth, providing critical information for monitoring, understanding and managing our resources of food, water, and forests. No other satellite program in the world comes close to providing such a long, unbroken record of geospatial information of the planet.
Knowing that these analyses will be put to use for decision making in natural resource management, I would like to thank all of the teams that worked tirelessly to produce this Landscapes of West Africa atlas. And my sincere gratitude goes to CILSS, the USGS, and the multitude of government institutions in West Africa for their commitment to completing this influential work.
Alex DeprezRegional Mission Director
USAID/West Africa
Accra, Ghana
foreword
Alex Deprez
WEST AFRICA

iv Landscapes of West Africa
aCknowledgmenTs
On behalf of the governments and the people of West Africa who have benefitted from the West Africa Land Use Dynamics Project, the Comité Permanent Inter-Etats de Lutte contre la Sécheresse dans le Sahel (CILSS – Permanent Interstate Committee for Drought Control in the Sahel) expresses its profound gratitude to all those who have contributed to the publication of this atlas. In particular, we would like to thank:
The U.S. Agency for International Development/West Africa (USAID/WA) which financed, encouraged and contributed actively to the review of this atlas;
The Resilience in the Sahel Enhanced (RISE) Program managed from USAID/Senegal’s Sahel Regional Office, which supports the work of mapping best practices and re-greening, and promotes soil and water conservation in the Sahel;
The U.S. Geological Survey Earth Resources and Observation Science (USGS EROS) Center for the scientific and technical guidance, provision of satellite imagery, maps, field data and photographs, statistics and analyses;
The AGRHYMET Regional Center under CILSS for its role in the technical coordination of the work and processing of satellite imagery;
The Directors of the Centre National de Télédétection et de Suivi Ecologique (CENATEL) in Cotonou, the Agence Nationale de Gestion de l’Environnement (ANGE) in Lomé, and the Centre de Suivi Ecologique (CSE) in Dakar who hosted mapping validation workshops , and;
The national teams from across West Africa who provided valuable content for the maps and case studies.
Members of the National TeamsBenin
Cocou Pascal Akpassonou, Chef Division Coopération Technique au Centre National de Télédétection du Bénin (CENATEL) ;
O. Félix Houeto, Chef Division Télédétection et SIG au Centre National de Télédétection (CENATEL) du Bénin.
Burkina Faso
Raïnatou Kabré, Chargé de production et de diffusion de l’information environnementale au Secrétariat Permanent du Conseil National pour l’Environnement et le Développement Durable (CONEDD) ;
Louis Blanc Traoré, Directeur Monitoring de l’Environnement au Secrétariat Permanent du Conseil National pour l’Environnement et le Développement Durable (CONEDD).
Cabo Verde
Maria Da Cruz Gomes Soares, Directrice, Direction des Services de Sylviculture (DGASP);
Sanchez Vaz Moreno Conceiçao, Responsable Inventaires Forestiers et Cartographie, Direction des Services de Sylviculture (DGASP).
The Gambia
Peter Gibba, Senior Meteorologist, Department Of Water Resources (DWR);
Awa Kaira Agi, Program Officer CGIS UNIT, National Environment Agency (NEA).
Ghana
Emmanuel Tachie-Obeng, Environmental Protection Agency (EPA);
Emmanuel Attua Morgan, Lecturer, Department of Geography and Resource Development, University of Ghana.
Guinea
Aïssatou Taran Diallo, Agro-environnementaliste, Ministère de l’Agriculture, Service National des Sols (SENASOL) ;
Seny Soumah, Ingénieur Agrométéorologiste et Chef de Section, Direction Nationale de la Météorologie (CMN).
Guinea-Bissau
Antonio Pansau N’Dafa, Responsable Bases de Données Changements Climatiques, Secrétariat de l’Environnement Durable;
Luis Mendes Cherno, Chargé de Bases de Données Climatiques, Institut National de Météorologie.
Liberia
D. Anthony Kpadeh, Head of Agro-meteorology, Climatology and Climate Change Adaptation, Liberia Hydrological Services;
Torwon Tony Yantay, GIS Manager, Forestry Development Authority (FDA).
Mali
Abdou Ballo, Enseignant Chercheur, Faculté d’Histoire-Géographie, Université de Bamako;
Zeinab Sidibe Keita, Ingénieur des Eaux Forêts, Système d’Information Forestier (SIFOR).
Niger
Nouhou Abdou, Chef Division Inventaires forestiers et Cartographie, Direction des Aménagements Forestiers et Restauration des terres, Ministère de l’Environnement, de la Salubrité Urbaine, et du Développement Durable;
Abdou Roro, Chef du Département Cartographie, Institut Géographique National du Niger (IGNN).
Nigeria
Kayode Adewale Adepoju, Lecturer and Scientist, Obafemi Awolowo University, Ile Ife;
Esther Oluwafunmilayo Omodanisi, Lecturer, Obafemi Awolowo University, Ile Ife;

vA Window on a Changing World
aCknowledgemenTs
Sule Isaiah, Lecturer, Federal University of Technology, Minna;
Mary Oluwatobi Odekunle, Federal University of Technology, Minna.
Senegal
Samba Laobé Ndao, Cartographe et Ingénieur en Aménagement du Territoire, Direction des Eaux, Forêts, Chasse, et de la Conservation des Sols (DEFCCS), Programme PROGEDE;
Ousmane Bocoum, Cartographe, Centre de Suivi Écologique (CSE).
Sierra Leone
Samuel Dominic Johnson, System Administrator, Ministry of Agriculture, Forestry and Food Security (MAFFS).
Chad
Angeline Noubagombé Kemsol, Agronome, Assistante de Recherche, Centre National d’Appui à la Recherche (CNAR);
Ouya Bondoro, Chercheur, Centre National d’Appui à la Recherche (CNAR).
Togo
Issa Abdou-Kérim Bindaoudou, Géographe et Cartographe, Direction Générale de la Statistique et de la Comptabilité Nationale;
Yendouhame John Kombaté, Responsable Suivi Evaluation et Communication, Agence Nationale de Gestion de l’Environnement, Ministère de l’Environnement.
Contributors from the AGRHYMET Regional CenterBako Mamane, Expert en télédétection et Système d’Information Géographique (SIG);
Djibo Soumana, Expert Agrométéorologue;
Alio Agoumo, Technicien en traitement d’images;
Dan Karami, Technicien en Système d’Information Géographique.
Other Contributors
In West Africa, we would also like to acknowledge the invaluable advice, insights and assistance from:
Amadou Hadj, Geographer and Land Use Planner, Dakar, Senegal, for many fruitful years of field work and reflecting on natural resource management;
Samba Laobé Ndao, besides being part of the Senegal National Team, provided considerable support to field work, geographic databases, and logistical support to the project team;
Moussa Sall and Assize Touré at the Centre de Suivi Ecologique (CSE) in Dakar, for assistance with field
work, studies on biomass and carbon sequestration, and many long years of collaboration;
Bienvenu Sambou and Assane Goudiaby, Université Cheikh Anta Diop de Dakar/Institut des Sciences de l’Environnement (ISE), for many years of exchanges with the USGS EROS team on long-term monitoring of Sudanian ecosystems.
At the USGS EROS Center, we extend special thanks to Jan Nelson and Tom Holm for guiding the publication process. Thanks also to the manuscript reviewers, Tom Adamson and Mike Budde, and to Aaron Neugebauer for his artwork on vegetation profiles. Many thanks to Melissa Mathis for her help with GIS training, and for her major role in developing the Rapid Land Cover Mapper. We are indebted to Anne Gellner for translating much of the manuscript into French.
At the World Resources Institute (WRI), we would like to thank Chris Reij and Robert Winterbottom, and Michael McGahuey at the USAID, for their many decades of work and insight into the natural resources of the Sahel, and their tireless work on landscape restoration and re-greening for the benefit of people across the region. We are also grateful for the many landscape and cultural photographs contributed by Michiel Kupers in the Netherlands, and Robert Watrel and Eric Landwehr at South Dakota State University (SDSU). Many thanks also to Scott Benton for his excellent contribution to the study of vegetation changes on the Island of Santo Antão, Cabo Verde.
In Memory
Our thoughts are with three colleagues and friends who are no longer with us. All three contributed significantly to the success of the West Africa Land Use Dynamics Project, including major content contributions to this atlas:
Yendouhame John Kombaté, Responsable Suivi Evaluation et Communication, Agence Nationale de Gestion de l’Environnement, Ministère de l’Environnement, Togo;
Kevin Dalsted, Soil Scientist and Land Resource Specialist, South Dakota State University, for his support to the land use mapping;
Richard Julia, friend and pilot based in Ouagadougou who made it possible for the project team to acquire thousands of aerial photographs in numerous countries of West Africa, and for his own photography of landscapes, wildlife and cultures of the Sahel.

Landscapes of West Africavi

viiA Window on a Changing World
Our global ecosystem is and has always been complex, dynamic, and in constant flux. Science tells us how natural forces of enormous power have shaped and reshaped Earth’s surface, atmosphere, climate, and biota again and again since the planet’s beginnings about 4.5 billion years ago. For most of the planet’s history those environmental changes were the result of the interaction of natural processes such as geology and climate, and were described on the geological time scale in epochs spanning millions of years.
When humankind appeared on Earth around 200,000 years ago the influence of human activity on the environment must have been small and localized. The influence of scattered small groups of people on the global ecosystem would have been overwhelmed by the forces of natural systems (Steffen and others, 2007). Human population would not grow to 50 million (about 0.7 percent of the Earth’s current population) for another 197,000 years. Population growth accelerated over the centuries that followed until the planet was adding more than that 50 million people every year. Our planet is now home to roughly 7.3 billion people and we are adding 1 million more people roughly every 4.8 days (US Census Bureau, 2011). Before 1950, no one on Earth had lived through a doubling of the human
population, but now some people have experienced a tripling in their lifetime (Cohen, 2003).
With hunting and the use of fire, later agriculture and urbanization, and eventually the industrial revolution and modern technology, the ability of humans to shape their environment also grew exponentially. Earth scientists use the geologic time scale to describe time periods where different processes and forces shaped events in the Earth’s history, such as ice ages and mass extinction events. They use periods of time they call epochs, which range from 11,700 years (the Holocene) to millions of years (the Pleistocene and Neogene). In about 2000, Earth scientists coined a new word — Anthropocene — to describe a new epoch where “the human imprint on the global environment has become so large and active that it rivals some of the great forces of nature in its impact on the functioning of the Earth system” (Steffen and others, 2011). Many in the Earth sciences believe that epoch has begun and that humankind with its vast numbers and its power to change the face of the Earth is at risk of putting the Earth system out of balance and causing
the collapse of natural systems that are essential for humans to thrive, perhaps even threatening the future of all humankind.
In 2015, the 17 countries included in this atlas are estimated to have a total population of over 369 million, representing a nearly 5-fold increase since 1950 — outstripping global population growth, which grew by 2.9 fold during the same time (UN, 2015). The young age structure of the West African population assures continued rapid population growth until 2050 and beyond. If United Nations estimates are correct the 17 countries in this atlas will grow to 835 million people by 2050; that would equate to 11.1 times as many people as lived on the same land in 1950 (UN, 2015)!
Introduction
“Mai lura da ice bashin jin yunwa” — He who takes care of trees will not suffer from hunger.
– Hausa proverb
PHOTO (OPPOSITE PAGE): SUZANNE COTILLON / SGT
Population growth in Africa and the rest of the world from 1950 to 2100
YEAR
PO
PU
LATI
ON
(BIL
LIO
NS
)
1960
1970
1980
1990
2000
2010
2020
2030
2040
2050
2060
2070
2080
2090
2100
1950
12
10
12
8
6
4
2
0

Landscapes of West Africaviii
Parallel trends can be seen in the land cover changes of West Africa. With so many new families to feed, West Africa doubled the area covered by farms between 1975 and 2013. Vast areas of savanna, woodland, and forest landscape have been replaced or fragmented by cropland. At the same time villages, towns, and cities have grown in area — taking up 140 percent as much land as they had in 1975. In part to make way for those farms and settlements more than a third of the forest cover present in 1975 has been lost. In savanna and steppe landscapes of West Africa, drought, in some cases made worse by unsustainable land use practices, has degraded the vegetation cover contributing to a 47 percent increase in sandy areas (see top images
pair, opposite page). The future is unpredictable, but the trends of the past four decades projected into the future would be unsustainable.
Conversion of the natural landscapes of West Africa to agriculture greatly reduces the natural biodiversity, and exposes the soil to wind and water erosion. The savanna, woodland, forest, and wetland ecosystems that are lost have some relatively tangible impacts such as the loss of natural ecosystem goods and services like wood for fuel and construction, honey, nuts, medicines, game animals, berries, and forage. There are also many important goods and services lost that are less visible such as biodiversity, carbon storage, water quality, water runoff versus infiltration, and regional climate functions.
Wooded landscape fragmented by agriculture expansion in western Burkina Faso
JAM
ES R
OW
LAN
D /
USG
S

ixA Window on a Changing World
Expansion of degraded land in the Ferlo region of Senegal
Decline in vegetation cover and biodiversity in east-central Senegal
1994
1984
2011
2013
It is in the hands of today’s decision makers to formulate wise, well informed choices about how to manage West Africa’s land, to ensure that vital ecosystem services and agricultural productivity are able to support tomorrow’s people. To make good choices the governments of West Africa need good information about the rapid changes now occurring, the causes of those changes, and the interactions occurring between climate, land use, other human activity, and the environment.
Experts from institutions in 17 countries in West Africa have partnered with the Comité Inter-états de Lutte contre la Sécheresse dans le Sahel (CILSS – The Permanent Interstate Committee for Drought Control in the Sahel), the U.S. Agency for International Development (USAID) West Africa and the U.S Geological Survey (USGS) to map changing land use and land cover and associated factors across much of West Africa through the West Africa
Land Use Dynamics Project. This publication presents the results of that work. The following chapters present maps, graphs, tables, and images detailing the natural environment of these 17 countries and changes that have taken place over the past four decades.
This atlas tells a story of rapid environmental change with both hopeful and worrisome chapters. The story is told with maps and numbers detailing the rate, magnitude, and location of land cover change but also with words and images that seek to make the story more real for the people living in West Africa and around the globe. The hope is that this information helps to build a clearer picture of past and current land use and land cover in order to guide us all in making informed choices that will support the livelihoods and well-being of ours and future generations.
GR
AY T
APP
AN
/ U
SGS
GR
AY T
APP
AN
/ U
SGS
Landscapes of West Africa2

72 Landscapes of West Africa
73A Window on a Changing World
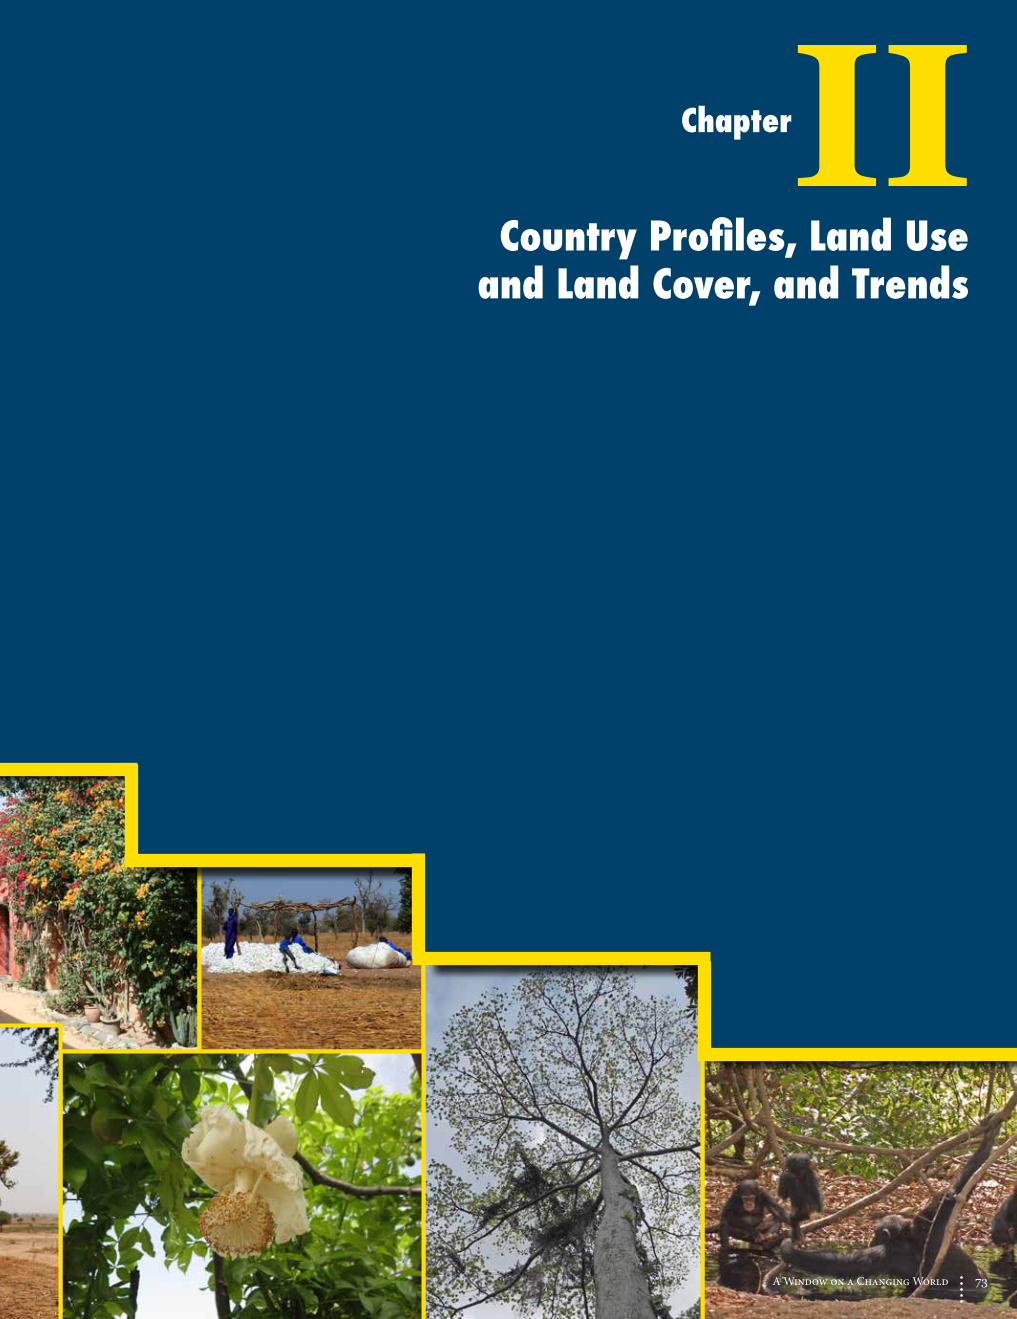
ChapterIICountry Profiles, Land Use
and Land Cover, and Trends

Photo caption
Chad is the fifth largest country in Africa and ranks second among Sahelian countries after Sudan. Chad’s land surface presents a dramatic variety of geographic contrasts. The vast northern third is located in the Sahara Desert and is sparsely populated, home to just 1 percent of Chad’s population. The whole central swath is in the Sahel, with average annual rainfall ranging from 150 to 600 mm. Both N’Djamena, the capital, and Lake Chad are found in this region. Lake Chad is fed by the country’s two main rivers, the Chari and the Logone. It is the largest body of water in the Sahel and a major center of economic activity for the region. However, due to erratic variations in the region’s climate and overexploitation of the rivers that feed it, this shallow lake (1.5 m deep on average) has shrunk to a small fraction of its 1960 size. Chad’s population lives mainly in the southern part of the country, in the more humid Sudanian climate zone, where average annual rainfall ranges between 600 and 1,300 mm. Southern Chad has the largest, relatively intact expanses of wooded savannas and woodlands of any of the Sahelian countries. Discovery of artifacts and fossils in northern Chad — especially the 7-million-year-old Toumaï skull from a hominid that is regarded as one of the oldest species in the human lineage — attests to the archaeological and historical richness of the country. Traditionally, Chad’s economy has been based on farming and livestock, but in the last decade the economy has changed dramatically from the oil boom. Besides oil, there are also significant deposits of gold, marble, and sodium carbonate.
Total Surface Area: 1,284,000 km2
Estimated Population in 2013: 13,146,000
192 Landscapes of West Africa
Republic of
Chad
NA
SA B
LUE
MA
RBLE
NEX
T G
ENER
ATIO
N
The Guéra Mountains near Mongo, whose profile suggests a woman asleep on her back, known locally as “The Queen of Guéra”.
Environmental Highlights•Desertification• Deforestation•ThedryingofLakeChad• Vast expanses of Sudanian woodland and savanna• Oil resources

193A Window on a Changing World
Ecoregions and Topography
Chad is located on a wide plain with flanks that rise gently eastward toward the Ennedi Range (ENN) and north toward the Tibesti Mountains, which culminate in the Sahara’s highest peak, Emi Koussi, at 3,415 m. The country’s northern third consists of vast sandy and gravel plains, too dry for cultivation except for small-scale traditional irrigated farming in scattered oasis towns. The high plateaus of the Ennedi and Ouaddaï (OUA) ecoregion gently slope toward the lower Sahelian plains of the Batha (BND and BSD) and Kanem (KAN) ecoregions, stretching to Lake Chad far to the west. The southern third of Chad is in the Sudanian climate region, with many ecoregions that are defined by plateaus and local highlands, expansive plains, and broad drainage channels that flood annually. To the west, these plains are more conducive to agriculture owing to their deep, rich alluvial soils. In contrast, the largest ecoregion in the southeast, Moyen-Chari and Salamat Plain (EMS – Eastern Middle-Chari and Salamat), contains large expanses of Sudanian zone woodlands and savannas where scattered communities are engaged in subsistence farming, fishing, and raising livestock.
Ecoregions
GLO
BA
L M
ULT
I-RE
SOLU
TIO
N T
ERR
AIN
ELE
VATI
ON
DAT
A 2
010
(GM
TED
201
0)
KEV
IN W
ARF
EL
Shaded Relief
Landscape of the Guéra Mountains
PHOTO (OPPOSITE PAGE): KEVIN WARFEL

194 Landscapes of West Africa
Land Use, Land Cover and Trends
In the mapped area, Sudanian and Sahelian savannas are the major land cover classes, accounting for half of the country’s land surface. Steppes also constitute a dominant land cover, covering 22 percent of the area mapped. Whereas the area of steppes remained relatively stable, savannas show a clear reduction between 1975 and 2013, especially in the Sudanian zone where they lost about 17 percent of their area over the 38 years.
Driven by an accelerated population growth and concomitant food demand, agricultural expansion is the main driver of the loss of Chad’s natural landscapes. Between 1975 and 2013, the annual rate of agricultural expansion was 5 percent, one of the highest in the region. This means that croplands almost tripled between 1975 and 2013, although this expansion is not uniformly distributed across the country. The spread of agriculture occurred mainly in the south, especially in the Bassin and Plaines du Logone (BLO and PRL – Basin and Plains of Logone), Collines du Mayo-Dala (CMD – Hills of Mayo-Dala), and Maro (MRO) ecoregions. The transition area between the Sahel and Sudan climate zones is another area of steady encroachment by croplands, especially in the regions of Ouaddaï, Lake Fitri (LFS and LFT), and around N’Djamena. In these regions, agricultural landscapes now dominate the savanna.
Deforestation is a major environmental concern in Chad. Woodlands, mainly located in the south, have diminished by 29 percent between 1975 and 2013, amounting to a very significant loss of 4,700 sq km. The area of gallery forest also declined, but not as rapidly as woodlands. Their overall land surface was always relatively small, but it has decreased by 8.3 percent, a 400 sq km loss between 1975 and 2013.
In the Sahel regions of Bahr El Gazal (BEG) and Kanem (KAN), sandy areas have grown in a patchwork fashion, pushing into the steppes. Droughts in the 1970s and 1980s, as well as grazing pressure, have destabilized the already sparse vegetation cover, allowing the underlying sands to become more mobile. Between 1975 and 2013, sandy areas have increased by 22 percent.
The reduction of surface water in Chad (a loss of 60 percent of surface water between 1975 and 2013) is mainly a result of the receding area of Lake Chad. Over 38 years, the overall surface area of the lake reduced by 87 percent. This is a concern not only to Chad, but to the region. Rainfall shortages combined with heavy use of the lake and river waters to irrigate and a major population increase in catchment area account for this decline. The entire
The northern third of Chad is a desert with vegetation cover found only in special niches where it can survive. Land cover was mapped only in the southern two-thirds of Chad, where seasonal vegetation and longer term land use and land cover dynamics are in play.

195A Window on a Changing World
Large area classes
Small area classes
northern basin, which had water as recently as 1975, has completely dried out, replaced by steppes and herbaceous savanna. In 2013, only a core area of the southern basin still had water. In contrast, the smaller Lake Fitri, also situated in Chad’s Sahel Region, appears to have been spared by the drying process. Lake Fitri’s area did not change much between 1975 and 2013. Nevertheless, the lake’s northern wetland area decreased, and agricultural pressure around the lake has visibly grown. These changes in the country’s water resources have impacted its socio-economic life. There has been a migration of population toward the south where rainfall and pastoral resources are more abundant. The dramatic decline in the extent of Lake Chad has stranded many communities that are dependent on fishing and gardening, further fueling migration to Chad’s urban areas.
The recent oil boom in Chad is another factor affecting population migrations, changes in land cover, and natural resource degradation in the south, especially at Doba and Bongor. Chad became an oil exporter in July 2003, after over 30 years of prospecting by various international oil companies. Two years later, the country joined the African Petroleum Producers’ Association (APPA) and created the Hydrocarbon Company of Chad in 2006.
0
50,000
100,000
150,000
200,000
250,000
300,000
AgricultureSteppeSahelian shortgrass savanna
Savanna1975 2000 2013 1975 2000 2013 1975 2000 2013 1975 2000 2013 YEARS
ARE
A (S
Q K
M)
0
5,000
10,000
15,000
20,000
Sandy areaSettlementsGallery forestWater bodiesWoodland
ARE
A (S
Q K
M)
1975 2000 2013 1975 2000 2013 1975 2000 2013 1975 2000 2013 1975 2000 2013 YEARS

196 Landscapes of West Africa
The increasing pressure on natural resources around Manda National Park As one of the three national parks in Chad, Manda National Park protects a relatively well-preserved stretch of Sudanian savanna ecosystem. Manda constitutes one of the last wildlife refuges in the Middle-Chari region of Chad, but the increasing pressure on natural resources in the surrounding landscapes is threatening the integrity of the park.
Established in 1965, Manda National Park is located in south-central Chad, northwest of Sarh. The park covers about 120 sq km of wooded savanna, woodland, and grassy floodplain. It is bounded on the southwest by the Sarh–N’Djamena road and on the northeast by the Chari River. Rainfall that usually starts in late April causes seasonal flooding by the Chari.
Manda National Park is isolated from most other protected areas, which makes it difficult for wildlife to migrate from the park to other suitable habitats. However, one nearby protected area is the Djoli-Kéra Forest Reserve, a vast unbroken area of Sudanian savannas and woodland. Manda National Park was initially created for the protection of Derby’s eland, but like the African elephant, this species disappeared from the park at the end of 1980s. However, hippopotamuses are still found in the Chari River and small populations of African buffalo, roan antelopes, and a few species of primates persist in Manda National Park (UICN/PACO, 2006).
Roan antelope ERIC
LA
ND
WEH
R / S
DSU

197A Window on a Changing World
A comparison of satellite images from 1986 and 2013 shows the growing pressure on the land surrounding Manda National Park and the Djoli-Kéra Forest Reserve. According to the land cover maps (see pages 194–195), the landscape was dominated by savanna and woodland in 1975 — agriculture was not well-developed and covered less than 10 percent of the area. Several areas burned by seasonal wildfires are visible across the savanna landscape in the 1986 satellite imagery (dark patches), including parts of Manda National Park. By 2013, cropland covered about 30 percent of the area around the park and the forest reserve. The progression of agriculture came from the west and, so far, has not expanded much east of the Chari River.
Recent interviews conducted among local farmers and local stakeholders by the Centre National d’Appui à la Recherche (CNAR – National Center for Research) indicate that cropland expansion is not only related to the growing population and the associated need to produce more food, but also to land deterioration. Poor land management and recurrent wildfires led to soil deterioration and reduced agricultural yield. As a result, farmers
have been searching for new, fertile land, such as the surroundings of Manda National Park and Djoli-Kéra Forest Reserve. In addition, farmers have been shifting to more lucrative activities, such as timber commercialization or charcoal production (Nougagombe and others, 2012).
Another growing pressure on the land resources in this area is livestock grazing. In recent years, herders have brought their livestock into the park during their seasonal migrations to avoid drought conditions farther north, or because their traditional pasture lands were flooded during the rainy season. Local informants blamed herders for lopping branches to create fences and deliberately setting fires in the savannas to promote early greening and better access to grass shoots. The presence of herders in the park has been the source of several conflicts with farmers and park guards (Nougagombe and others, 2012).
Satellite images show vegetation cover within the park to be relatively stable, but local inhabitants have witnessed a decrease in biodiversity and wildlife populations due to habitat deterioration and heavy poaching.

198 Landscapes of West Africa
Yamba Berté Forest ReserveThe Yamba Berté Forest Reserve lies in the relatively humid Sudanian Region of southwestern Chad. The reserve protects an island of relatively intact dense shrub savanna, gallery forests, wetlands and small lakes (GEF, 2004). Forests including African mahogany, néré, doka, tamarind, African copaiba balsam and shea trees provide good habitat for a variety of fauna including gazelles, eland and other antelope as well as monkeys, ostrich, giraffe and possibly some of Chad’s remaining savanna elephants, among others (Chaintreuil and Conteau, 2000; IUCN, 2015). The reserve’s proximity to Sena Oura National Park and the adjacent Bouba Ndjida National Park in Cameroon with patches of intact forest between the two areas has historically made up a much larger area of contiguous habitat. The amount of intact forest remaining in the area between the national parks and Yamba Berté has declined between the dates of the two satellite images above.
Rainfall in the area averages around 1,000 mm per year, but in the long term it is quite variable having been as low as 600 mm and as high as 1,400 mm between 1971 and 2006. While the area is considered quite good for

199A Window on a Changing World
agriculture, as in many areas of the Sudanian Region, farmers have to cope with this interannual variability, compounded by uneven spatial and temporal distribution of rains (Sougnabé, 2013). In part due to the in-migration attracted by the good farming and herding conditions, the population just in the area shown in the above images has grown from around 700,000 in 1990 to an estimated 1,490,000 in 2015 (CIESIN, 2005). Most of this population makes its living by farming or a combination of farming and herding (Sougnabé, 2013). In addition to subsistence crops such as maize millet and sorghum, the area is ideal for growing cotton and groundnuts, the two primary cash crops in the area (FEWSnet, 2005).
The growing demand for land has led to encroachment on the forest reserve with two villages clearly visible in the 2015 satellite image, and many areas of encroachment around the perimeter of the reserve. Additional pressures on the forest include charcoal production, poaching and grazing of livestock. There are reports of at least two instances of oil exploration work in the area of Yamba Berté since 2003 (Oyamta and others, 2013). In the 1970s over 85 percent of the area shown in the above images was shrub savanna and less than 7 percent was agriculture. By 2013 only about 39 percent of the same area was intact shrub savanna, while the area being farmed had grown to just under 54 percent.
Extraction of seeds from cucumbers in a Moussey village LUIC
LEM
ENS