landscape of higher education: human capital - eric · landscape of higher education: human capital...
TRANSCRIPT

Landscape of Higher Education: Human Capital
Kelcey Edwards
Senior Research Analyst, R&D
College Board National Forum
Miami, FL
October 26, 2012

The Demographic Wave
• Rapid expansion and diversification of graduates • Source: Western Interstate Commission for Higher Education (WICHE), Knocking at the College
Door, March 2008

The Demographic Wave
Between 1996 and 2022, the percent of US public high school graduates who are Hispanic grows from 10% to 28%.
20% 40%
23% 45% 4% 26%
5% 15%
7% 19% 3% 12% Regional and state variation in growth
Source: Western Interstate Commission for Higher Education (WICHE), Knocking at the College Door, 2008
Class of 2022 entered 3rd grade this fall

College-Bound Seniors
Sources: CDC National Center for Health Statistics Monthly Vital Statistics Reports (births); Western Interstate Commission for Higher Education (high school graduates); NCES Digest of Educational Statistics 2010 (immediate college enrollees); College Board (SAT Examinees in US Cohort)
4.1 million, 1991
3.3 million, 2009
2.1 million, 2009
0
500,000
1,000,000
1,500,000
2,000,000
2,500,000
3,000,000
3,500,000
4,000,000
4,500,000
1997 1998 1999 2000 2001 2002 2003 2004 2005 2006 2007 2008 2009 Graduating Class
Number of Births, HS Graduates, and Immediate College Enrollees
Births HS Graduates Immediate College Enrollees SAT Examinees
1.4 million, 2009
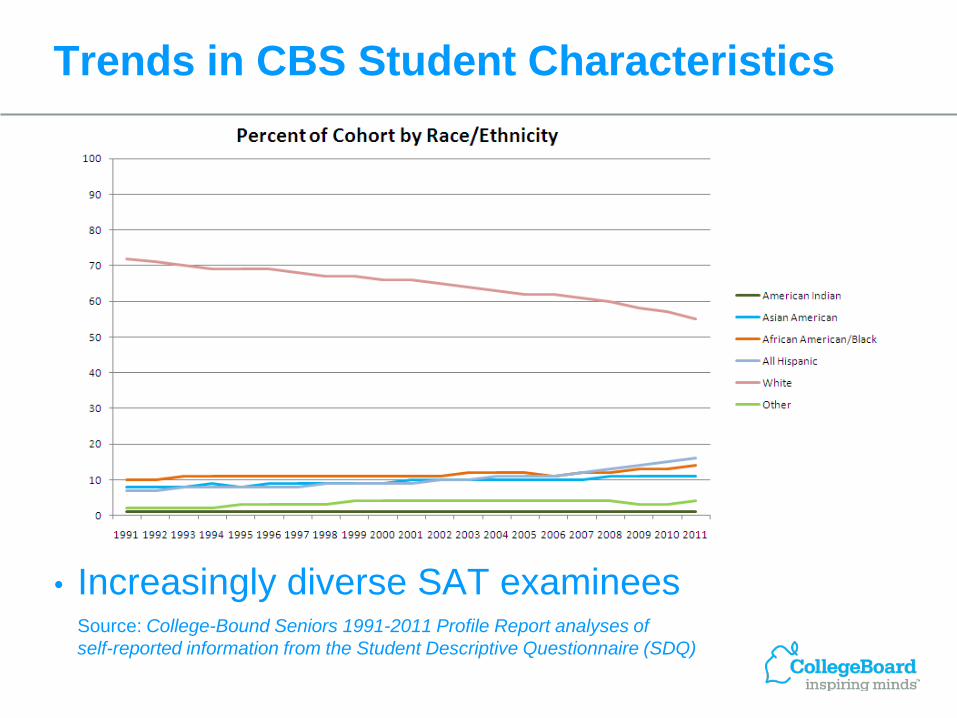
Trends in CBS Student Characteristics
• Increasingly diverse SAT examinees Source: College-Bound Seniors 1991-2011 Profile Report analyses of self-reported information from the Student Descriptive Questionnaire (SDQ)

Trends in CBS Student Characteristics
• Increasingly diverse SAT examinees Source: College-Bound Seniors 1991-2011 Profile Report analyses of self-reported information from the Student Descriptive Questionnaire (SDQ)

Trends in CBS Student Characteristics
• Steady % First Generation in past 10 years Source: College-Bound Seniors 1991-2011 Profile Report analyses of self-reported information from the Student Descriptive Questionnaire (SDQ)

Trends in Academic Preparation - Rank
• Steady rise across groups; persistent gaps Source: College-Bound Seniors 1991-2011 Profile Report analyses of self-reported information from the Student Descriptive Questionnaire (SDQ)

Trends in Academic Preparation - Rank
• Steady rise across groups; persistent gaps Source: College-Bound Seniors 1991-2011 Profile Report analyses of self-reported information from the Student Descriptive Questionnaire (SDQ)

Trends in Academic Preparation - GPA
• Steady rise across groups; persistent gaps Source: College-Bound Seniors 1991-2011 Profile Report analyses of self-reported information from the Student Descriptive Questionnaire (SDQ)

Trends in Academic Preparation - GPA
• Steady rise across groups; persistent gaps Source: College-Bound Seniors 1991-2011 Profile Report analyses of self-reported information from the Student Descriptive Questionnaire (SDQ)

Trends in Academic Preparation – AP/Honors
• Steady rise across disciplines Source: College-Bound Seniors 1991-2011 Profile Report analyses of self-reported information from the Student Descriptive Questionnaire (SDQ)

Trends in Academic Preparation – AP/Honors
• Similar, troubling gaps were observed across disciplines
• The difference by race/ethnicity were most notable in:
• Math • In the class of 2011, 48% of Asian examinees indicating taking
AP/Honors Math compared to 24% of Black/African American and 30% of Hispanic examinees.
• Science • In the class of 2011, 44% of Asian examinees indicating taking
AP/Honors science compared to 23% of Black/African American and 27% of Hispanic examinees.

Trends in Academic Preparation – Calculus
• Steady rise across groups; persistent gaps Source: College-Bound Seniors 1991-2007 Profile Report analyses of self-reported information from the Student Descriptive Questionnaire (SDQ)

Trends in Academic Preparation – Calculus
• Steady rise across groups; persistent gaps Source: College-Bound Seniors 1991-2007 Profile Report analyses of self-reported information from the Student Descriptive Questionnaire (SDQ)

Trends in Academic Preparation – Physics
• Steady rise across groups; persistent gaps Source: College-Bound Seniors 1991-2007 Profile Report analyses of self-reported information from the Student Descriptive Questionnaire (SDQ)

Trends in Academic Preparation – Physics
• Steady rise across groups; persistent gaps Source: College-Bound Seniors 1991-2007 Profile Report analyses of self-reported information from the Student Descriptive Questionnaire (SDQ)

Access to Rigorous Courses
• Steady rise across groups; persistent gaps • Hispanic and white rates are identical
Performance in Rigorous Courses
• Equity & Excellence metric • Percent of graduates scoring 3 or higher on an AP
exam during high school.
• Found in APRN, OSR, etc.
• Not equivalent to ‘pass rate’ which reflects the percent of examinees scoring 3 or higher.

Some thoughts on ‘Pass Rates’
• It’s not that we don’t want to talk about them or aren’t concerned about students who aren’t successful….
• The issue is about interpretation and potential behavior consequences.
• On a state or national level, they reflects vastly different school/district policies as to who gets into AP, who takes the exam, and how well those students were prepared both prior to and during AP.
• The easiest way to increase pass rates is to build barriers to entry, as opposed to doing the hard work of making sure that students and teachers have the tools to succeed.
• It is more efficient/cheaper to decrease the denominator than it is to increase the numerator. Is that good for students?

Performance in Rigorous Courses

Who’s knocking at the college door?
• An increasingly diverse and academically prepared student body • Also motivated and confident
• This presents substantial challenges and incredible opportunities
Questions?
• Researchers are encouraged to freely express their professional
judgment. Therefore, points of view or opinions stated in College
Board presentations do not necessarily represent official College
Board position or policy.
• Please forward any questions, comments, and suggestions to:
• Kelcey Edwards – [email protected]

Landscape of Higher Education: Net Price
Greg Perfetto
Executive Director, College Connection & Success
October 26, 2012

Net Price Calculators -- Overview
• Early data from first year under mandate
• Broad Representation • 318 Colleges
• Public, Private, Doctoral, Baccalaureate
• Over 1 Million NPC “hits” since going live.
• Almost 600K completed calculations over the just completed 12 month cycle, yielding detailed information on net cost, as well as family contribution estimates based on both IM and FM needs analysis.
• Preliminary look at affordability landscape

NPC Data Overview: 2011-12
Eliminate non-dependents, calculations before October 2011, international students
Eliminate incomplete records and those with insufficient data to generate family contribution estimates
Cost, Price and Family Contribution (FM) by College Type
NPC Completion Rate Cost Net Price NP/Cost EFC N
For Profit 47% 36,918 32,711 89% 12,424 7,387
Other Public 56% 17,970 13,767 77% 11,230 2,238
Public Masters 71% 23,429 17,101 73% 13,522 16,119 Public Doctoral 71% 32,592 22,246 68% 20,122 105,231 Public Baccalaureate 69% 27,335 17,644 65% 14,405 4,500 Other Private 75% 41,048 26,076 64% 18,469 13,586 Private Masters 77% 43,249 27,227 63% 20,296 62,497 Unclassified 73% 49,572 27,813 56% 23,246 21,716 Private Doctoral 79% 57,028 28,888 51% 25,951 204,784 Private Baccalaureate 82% 50,827 25,611 50% 23,596 159,644
Total 77% 47,470 26,155 55% 22,791 597,702
• Overall, Net Price is about 60 to 80% cost for Publics, 50 to 65% for Privates
• Completion rates (hits to full info) generally runs in the 70-80% range for typical Public and Private 4-yr colleges
Student Region
Frequency Percent
Middle States 203,953 26.1
South 175,899 22.5
MidWest 149,163 19.1
Western States 104,713 13.4
New England 84,047 10.8
Southwest 32,813 4.2
Unknown 30,596 3.9
Total 781,184 100.0
Total NPC Accesses
Frequency Percent 2010 11,272 1.1
2011 733,436 71.8
2012 277,078 27.1
Total 1,021,786 100.0

Net Price and Income
Focus on Public vs. Private Combine data from Doctoral, MA and BA Colleges
$0
$20,000
$40,000
$60,000
Total Income Range
Net Price by Income Band
Public Net Price Private Net Price
0%
5%
10%
15%
20%
25% NPC Users by Income Band (Percent of Total)
Public NPC Users Private NPC Users
Net Price by Income Band (Public vs. Private, BA and up)
Income Band
NET_PRICE
Mean Percent in Income
Group Public Private Public Private
<= 10000 12,814 14,303 18% 13% 10001 - 20000 15,640 15,319 3% 3% 20001 - 30000 15,777 14,975 4% 4% 30001 - 50000 16,666 16,495 12% 10% 50001 - 75000 20,607 20,324 14% 13% 75001 - 100000 23,694 25,451 14% 15% 100001 - 125000 25,748 30,199 11% 12% 125001 - 150000 27,383 35,291 9% 11% 150001 - 200000 29,283 42,809 8% 11% 200001+ 31,895 49,221 6% 9% Total 21,422 27,419 100% 100%
Total N 125827 426853
• Below $100,000 Public and Private are very similar on Net Price
• Above $100,000 Net Price diverges with Private > Public
• Similar distribution of NPC users across income levels for Public and Private, with slight shift towards higher income for users at Private Colleges

Who is using NPC Calculators
-10%
-5%
0%
5%
10%
<= 10000 10001 - 20000
20001 - 30000
30001 - 50000
50001 - 75000
75001 - 100000
100001 - 125000
125001 - 150000
150001 - 200000
200001+
Relative Percentages within Income Group NPC vs. Population
NPC use exceeds population percentages
NPC use lags population percentages
Source: U.S. Census Bureau, Current Population Survey, 2012 Annual Social and Economic Supplement.
• Relative to the overall population, NPC usage tends to be over-representative of students from upper-income and very low income families
• Students from Middle-to-lower income families are under-represented
0%
5%
10%
15%
20%
<= 10000 10001 - 20000
20001 - 30000
30001 - 50000
50001 - 75000
75001 - 100000
100001 - 125000
125001 - 150000
150001 - 200000
200001+
Percent in Income Range NPC calacultions vs. School Age Population
NPC Calculations as Percent of Total School Age Chdren as Percent of Total
Summary – Mandate vs. Opportunity
• Net Price Calculators are in widespread use and provide a pre-application window on families who are concerned about affordability
• Preliminary information suggests that there is general consensus between public and private colleges on expected family contribution across income levels
• Current aid policies appear to cancel out public vs. private prices differences for middle to lower income families, however net prices diverge for families making more than $75,000 with private education becoming significantly more expensive.
• Within our restricted sample, IM and FM methodologies yield similar average family contribution estimates, with major difference being the IM option for a Student Contribution regardless of income level.
• NPC Calculators are an important tool for communicating more realistic information about net price – versus “sticker price”. However, the early data suggest that while the message appears to be reaching students from very low income families, additional opportunities may exist to reach prospective students from families in the $10k-$50k income range.
Net Price Calculator Requirement • In accordance with the Higher Education Opportunity Act of 2008 (HEOA), by
October 29, 2011, each postsecondary institution that participates in Title IV federal student aid programs must post a net price calculator on its website that uses institutional data to provide estimated net price information to current and prospective students and their families based on a student’s individual circumstances. This calculator should allow students to calculate an estimated net price of attendance at an institution (defined as cost (price) of attendance minus grant and scholarship aid) based on what similar students paid in a previous year. The net price calculator is required for all Title IV institutions that enroll full-time, first-time degree- or certificate-seeking undergraduate students.


© 2012 National Student Clearinghouse. All Rights Reserved.
The Changing Landscape of How We Understand Postsecondary Pathways – With a Focus on Transfer Students and
Persistence Anywhere The College Board Annual Forum
Miami, FL October 26, 2012
Don Hossler Professor of Educational Leadership & Policy Studies, Indiana University &
Senior Consultant, National Student Clearinghouse Research Center
© 2012 National Student Clearinghouse. All Rights Reserved.
My Goals Today • Expand thinking beyond what we
typically think we know from IPEDS, SLDS systems, or institutional views of enrollment patterns.
• Better understand the actual enrollment patterns of many students
• Encourage you to start playing “what if” with your own data by linking it with data held by the Clearinghouse.
• A more complex look at transfer students.
• .

© 2012 National Student Clearinghouse. All Rights Reserved.
A Tale of Two Students
Traditional Student
3
Mobile Student
Retention at Institution of Origin Persistence Anywhere

© 2012 National Student Clearinghouse. All Rights Reserved.
Entering cohort of fall 2006
• 2.8 million unique students reported to NSC (full- and part-time)
45.1%
34.0%
15.3%
3.3% 2.0% 0.3% Two-Year Public
Four-Year Public
Four-Year Private Nonprofit
Four-Year Private For-Profit
Two-Year Private For-Profit
Two-Year Private Nonprofit
4

© 2012 National Student Clearinghouse. All Rights Reserved.
Analysis
• Tracked each student for up to five years or first degree
• Identified mobility and transfer:
– Any change of institution prior to first degree completion
• All enrollment terms counted, including summer
• Origin institution
• Destination institution
5

© 2012 National Student Clearinghouse. All Rights Reserved.
45 Percent of Four-Year Degrees Go to Students with Previous Enrollment
in a Two-Year Institution
6
2010/11 degrees awarded

© 2012 National Student Clearinghouse. All Rights Reserved.
27% of 4-to-2 Mobility/Reverse Transfer Students Enroll at the Two-Year Institution Only
During Summer Months
7
27%
73%
Summer Only Regular Term

© 2012 National Student Clearinghouse. All Rights Reserved.
The Pathways for Reverse Transfers - Summer
8
0
20,000
40,000
60,000
80,000
100,000
120,000
140,000
160,000
180,000
200,000
Regular Term Summer Only
Did not return to 4-yr
Returned to other 4-yr
Returned to origin institution

© 2012 National Student Clearinghouse. All Rights Reserved.
27 Percent of All Students Who Changed Institutions Also Crossed a State Line
330,948 1,699 5,377 242,042
73,010 1,673
91,104 802 1,861 82,703
60,331 1,427
0%
10%
20%
30%
40%
50%
60%
70%
80%
90%
100%
Public Private Nonprofit
Private For-Profit
Public Private Nonprofit
Private For-Profit
Two-Year Four-Year
Institutional Origins of Transfer Students
Transferred Out of State
Transferred Within State
9

© 2012 National Student Clearinghouse. All Rights Reserved.
Bottom Line: One-Third of Students Enroll in a Different Institution within Five Years of Their First Enrollment Term or by
the Time they Earn a Degree (whichever comes first)
Prevalence of Transfer and Mobility Among All Students in Entry Cohort, Fall 2006
N %
Transfers 923,196 33.1%
Non-Transfers 1,869,765 67.0%
Total 2,792,961 100.0%
10
© 2012 National Student Clearinghouse. All Rights Reserved.
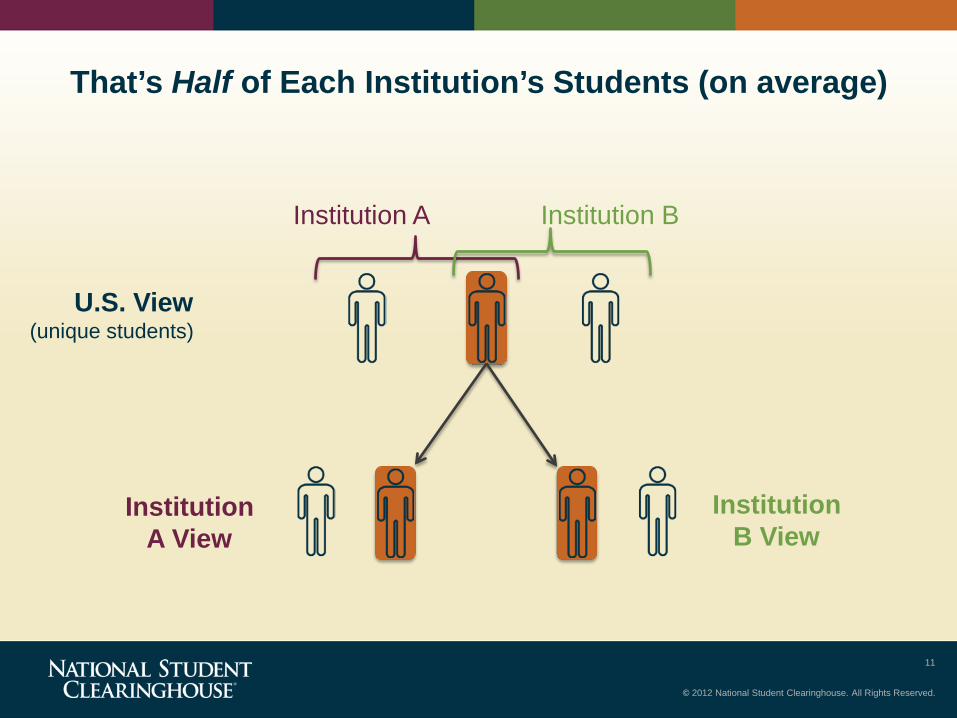
11
U.S. View (unique students)
Institution A View
Institution B View
That’s Half of Each Institution’s Students (on average)
Institution A Institution B

© 2012 National Student Clearinghouse. All Rights Reserved.
Within the Mobile Students group, One-Quarter Moved More Than Once
12
Frequency of Transfer & Mobility, 2006–11
N %
Once 688,946 74.6%
Twice 156,638 17.0%
Three Times or More 77,613 8.4%
Total All Mobile Students 923,196 100.0%

© 2012 National Student Clearinghouse. All Rights Reserved.
Mobility & Transfer Rates by Level of Origin and Destination Institution
13.0%
16.4%
20.1%
16.7%
0%
5%
10%
15%
20%
25%
Two-Year Four-Year
% T
rans
ferr
ed
Origin Institution
Two-Year
Four-Year
Destination Institution
13
© 2012 National Student Clearinghouse. All Rights Reserved.
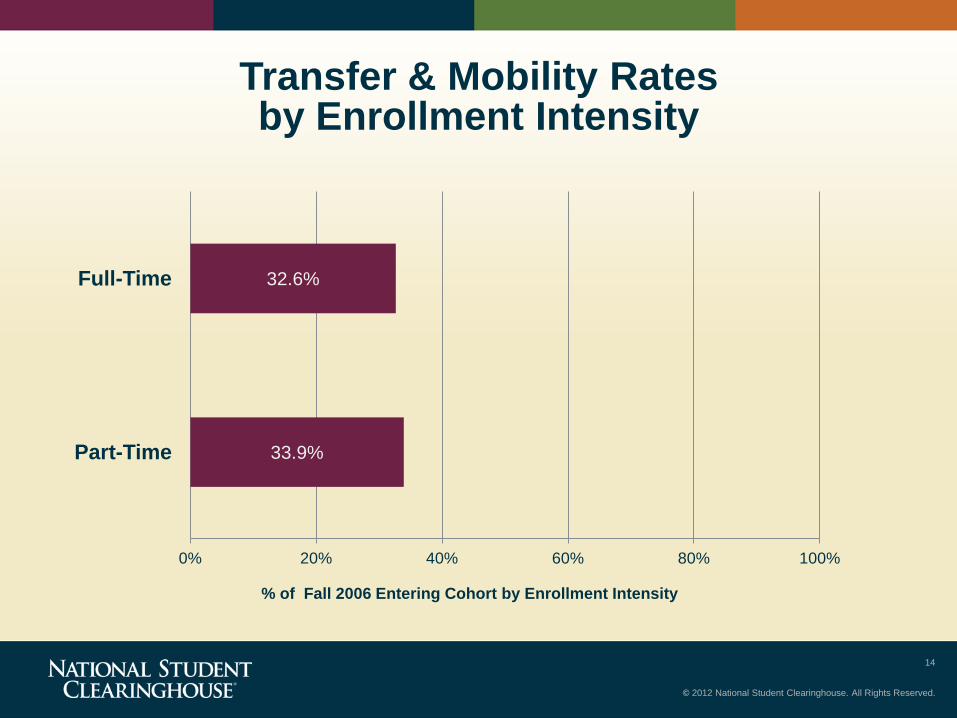
Transfer & Mobility Rates by Enrollment Intensity
33.9%
32.6%
0% 20% 40% 60% 80% 100%
Part-Time
Full-Time
% of Fall 2006 Entering Cohort by Enrollment Intensity
14

© 2012 National Student Clearinghouse. All Rights Reserved.
Some Key Takeaways
• One-third of all students transferred at least once within five years
• Transfer and mobility rates were similar for part- and full-time students, public, and private nonprofit students
• Of those who transfer:
– Most prevalent destination was a public two-year (43 percent) – One-quarter of mobile students transfer or move more than once – More than one-quarter move across state lines (27 percent)
15

© 2012 National Student Clearinghouse. All Rights Reserved.
Traditional View
• 1/2 is hard to forget
• Education as time, place
• Institutional home
• Graduation rate
• How many students complete vs. dropout
• Fear the data
Mobile View
• 1/2 is hard to ignore
• Education as career, path
• Institutional stepping stone
• Network path efficiency
• How do institutions bend student trajectories
• Free the data
16

© 2012 National Student Clearinghouse. All Rights Reserved.
Final Comments
• For public policy makers – Without clear and accurate information on student
enrollment patterns it is impossible to develop public policy incentives that will lead to desired outcomes.
• For Institutional Policy Makers
– You cannot develop sound enrollment management plans if you lack a clear understanding of the enrollment patterns of your students.
17
© 2012 National Student Clearinghouse. All Rights Reserved.
18
Thank You
Research Center Snapshots and Reports: http://research.studentclearinghouse.org/
Don Hossler
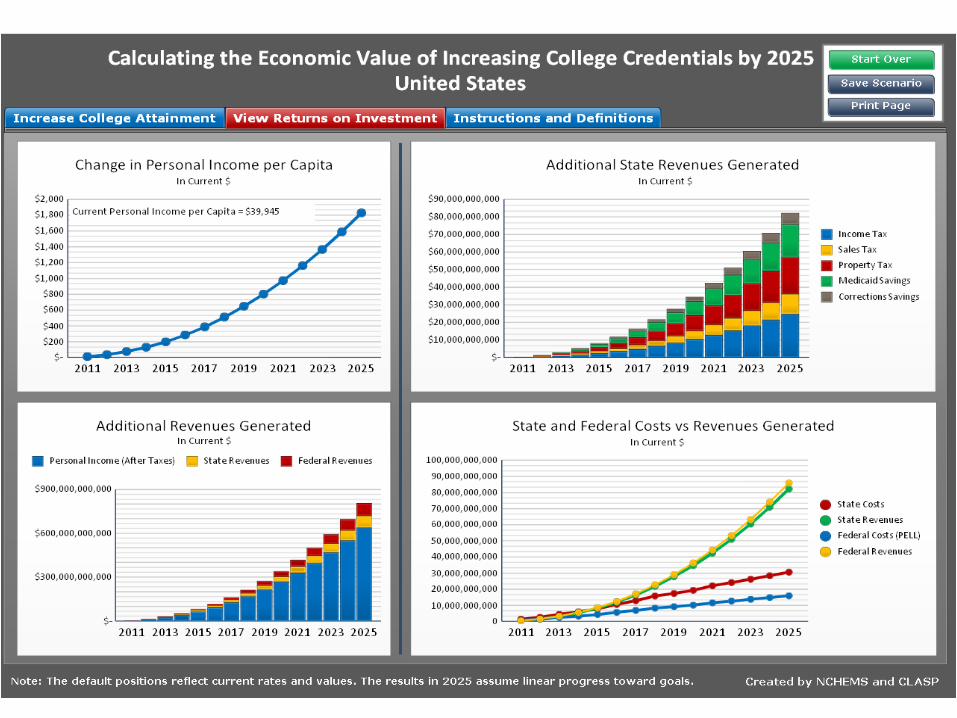
The College Completion Agenda
From “Education for Education’s Sake” to Return on Investment and Gainful Employment
Patrick J. Kelly
National Center for Higher Education Management Systems
• State policymakers are realizing they can’t afford to reach the postsecondary goals they are targeting under “business as usual” scenarios.
• Beyond the Federal concern about Pell grants and loan repayment, the economic recession has led many state policymakers to heightened awareness of the mismatch between the graduates being produced (and their skills) and employer demand.
Why ROI and Gainful Employment?

Return on Investment

0
10,000
20,000
30,000
40,000
50,000
60,000
70,000
80,000
Conn
ectic
utN
ew Je
rsey
Mar
ylan
dN
ew Y
ork
Mas
sach
uset
tsVi
rgin
iaCa
lifor
nia
New
Ham
pshi
reIll
inoi
sTe
xas
Min
neso
taDe
law
are
Uni
ted
Stat
esRh
ode
Isla
ndG
eorg
iaW
ashi
ngto
nAl
aska
Penn
sylv
ania
Colo
rado
Nev
ada
Kans
asW
isco
nsin
Ohi
oAr
izon
aN
orth
Car
olin
aAl
abam
aTe
nnes
see
Indi
ana
Loui
sian
aIo
wa
Mis
sour
iFl
orid
aH
awai
iM
ichi
gan
Okl
ahom
aAr
kans
asN
ebra
ska
Verm
ont
Kent
ucky
Sout
h Ca
rolin
aN
orth
Dak
ota
Ore
gon
Wyo
min
gU
tah
Mis
siss
ippi
New
Mex
ico
Wes
t Virg
inia
Mai
neSo
uth
Dako
taId
aho
Mon
tana
High School Graduate or GED Associate's Degree Bachelor's Degree
Median Annual Wage Earnings by Level of Education Attained 25
to 64 Year Olds (2010)

$1,1
46,1
15
$657
,582
$318
,995
0
200,000
400,000
600,000
800,000
1,000,000
1,200,000
1,400,000
New
Yor
kM
aine
Conn
ectic
utCa
lifor
nia
Loui
sian
aM
inne
sota
Rhod
e Is
land
Mas
sach
uset
tsN
ew Je
rsey
Nor
th C
arol
ina
Mar
ylan
dKe
ntuc
kyD
elaw
are
Virg
inia
Verm
ont
Mic
higa
nW
isco
nsin
Neb
rask
aH
awai
iO
rego
nM
issi
ssip
piKa
nsas
Stat
e Av
erag
eSo
uth
Caro
lina
Geo
rgia
Indi
ana
Penn
sylv
ania
Illin
ois
Ohi
oAr
kans
asId
aho
Texa
sAr
izon
aO
klah
oma
Colo
rado
Iow
aAl
aska
Was
hing
ton
Flor
ida
Mis
sour
iW
est V
irgi
nia
Tenn
esse
eW
yom
ing
Nor
th D
akot
aAl
abam
aN
ew M
exic
oM
onta
naSo
uth
Dak
ota
New
Ham
pshi
reN
evad
aU
tah
Total State Revenues Generated
Corrections Savings
Medicaid Savings
Property Tax Reveues
Sales Tax Revenues
State Income Tax Revenues
State Returns by Source if Each State Produced an Additional 100 Undergraduate Certificates, 100 Associate Degrees, and 100
Bachelor’s Degrees

AL
AK
AZ
AR
CA
CO
CT
DE
FL
GA
HI
ID
IL
IN
IA
KS
KY
LA
ME
MD
MA
MI MN
MS MO
MT
NE
NV NH
NJ
NM
NY
NC
ND
OH OK
OR
PA
RI
SC
SD
TN
TX
UT VT
VA
WA
WV
WI
WY
Avg
2,000,000
3,000,000
4,000,000
5,000,000
6,000,000
7,000,000
300,000 600,000 900,000 1,200,000
High Personal Gain, Low State Revenues Gain High Personal Gain, High State Revenues Gain
Low Personal Gain, Low State Revenues Gain Low Personal Gain, High State Revenues Gain
Additional Annual State Revenues Generated
Addi
tiona
l Ann
ual P
erso
nal I
ncom
e Ge
nera
ted
The Personal and State Returns if Each State Produced an Additional 100
Undergraduate Certificates, 100 Associate Degrees, and 100 Bachelor’s Degrees

Gainful Employment
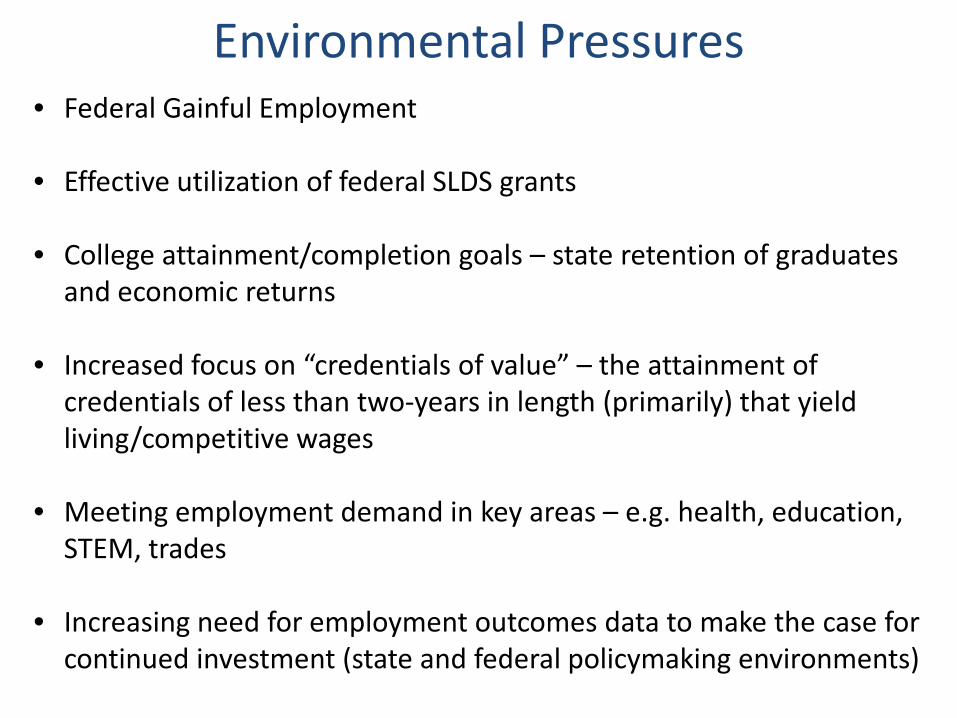
• Federal Gainful Employment
• Effective utilization of federal SLDS grants
• College attainment/completion goals – state retention of graduates and economic returns
• Increased focus on “credentials of value” – the attainment of credentials of less than two-years in length (primarily) that yield living/competitive wages
• Meeting employment demand in key areas – e.g. health, education, STEM, trades
• Increasing need for employment outcomes data to make the case for continued investment (state and federal policymaking environments)
Environmental Pressures

The Data are Simple
• Employed – record in the database (excludes self employed, military, and employed out-of-state)
• Earnings
• Industry of Employment
• Region of Employment
Employment/Wage Records
Data Available Quarterly
• Completions
• Level of Award (Certificate, Associates, Bachelor’s Masters, Doctorate, Professional)
• CIP Code of Award – Field of Study
• Origin of Student
• Continued Enrollment
Institution Records
Data Available by Term
Link SSN

• What percentage of the graduates are employed in-state – by level and type of award?
• Are the graduates employed in the region in which they graduate?
• What are their quarterly earnings?
• What industries are the employed in? (only relevant in a few fields)
• What percentage continue to enroll/persist in postsecondary education?
Major Questions Answered

• State brain drain. Is the state retaining the graduates it produces? How is it changing over time? (the impact on the degree and attainment goals of the state).
• State-level supply and demand. What is the employment status of graduates in key areas of demand for the state? E.g. health and STEM fields, certain trades. Don’t fall into the trap of overly detailed program-to-occupation supply and demand studies.
• Regional supply and demand. Are institutions producing graduates that meet local employer needs? What are the employment status and wages of the graduates they produce?
• Information for students and families. What programs provide the highest wages in the short-run? What programs are more likely to require continued education upon completion?
Most Effective Uses of the Data

• Small numbers of graduates for many programs
• It is very difficult to calculate the “value added” by institution – i.e. the likely employment and wages of students had they not completed their college credentials
• The state economy treats graduates from some institutions better than graduates from others (with the same credentials) – the “prestige” factor
• Institutions serving large numbers of place-bound students are victims of their local economy (e.g. a part of the state that has low wages relative to other parts of the state)
• The difficult balance between directing students into programs with competitive wages and providing student choice
Institutional Accountability (Difficult)
0
10,000
20,000
30,000
40,000
50,000
60,000
70,000
80,000
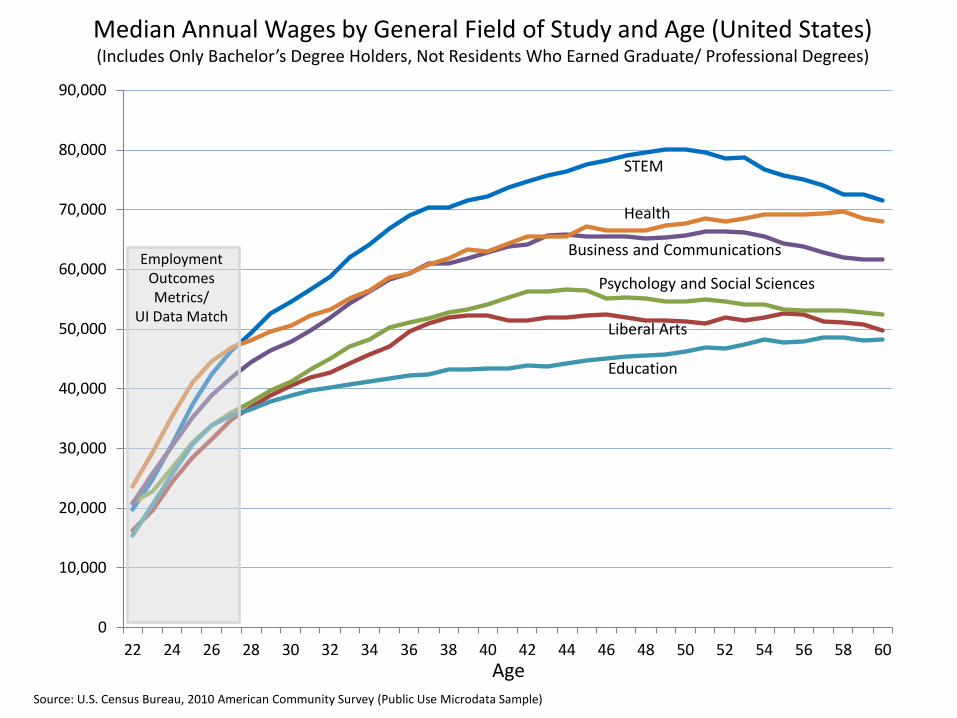
90,000
22 24 26 28 30 32 34 36 38 40 42 44 46 48 50 52 54 56 58 60
Median Annual Wages by General Field of Study and Age (United States) (Includes Only Bachelor’s Degree Holders, Not Residents Who Earned Graduate/ Professional Degrees)
Employment Outcomes Metrics/
UI Data Match
Age Source: U.S. Census Bureau, 2010 American Community Survey (Public Use Microdata Sample)
STEM
Health
Business and Communications
Psychology and Social Sciences
Liberal Arts
Education

How Can We Tell a Story with the Data?
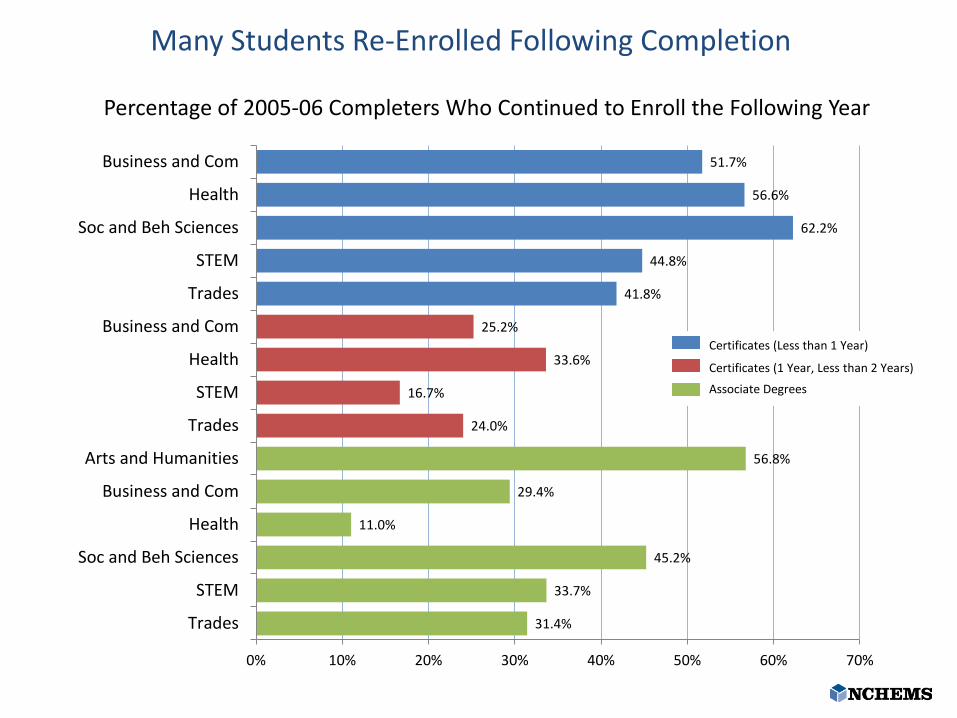
31.4%
33.7%
45.2%
11.0%
29.4%
56.8%
24.0%
16.7%
33.6%
25.2%
41.8%
44.8%
62.2%
56.6%
51.7%
0% 10% 20% 30% 40% 50% 60% 70%
Trades
STEM
Soc and Beh Sciences
Health
Business and Com
Arts and Humanities
Trades
STEM
Health
Business and Com
Trades
STEM
Soc and Beh Sciences
Health
Business and Com
Many Students Re-Enrolled Following Completion
Percentage of 2005-06 Completers Who Continued to Enroll the Following Year
Certificates (Less than 1 Year)
Certificates (1 Year, Less than 2 Years)
Associate Degrees

82.8%
77.8%
82.6%
87.8%
80.2%
78.3%
68.0%
60.0%
87.4%
61.6%
73.7%
77.3%
77.1%
82.1%
74.1%
0% 20% 40% 60% 80% 100%
Trades
STEM
Soc and Beh Sciences
Health
Business and Com
Arts and Humanities
Trades
STEM
Health
Business and Com
Trades
STEM
Soc and Beh Sciences
Health
Business and Com
Of Those Who Didn’t Re-Enroll, How Many are Employed in State?
Percentage of 2005-06 Completers Who Employed the Following Year
Certificates (Less than 1 Year)
Certificates (1 Year, Less than 2 Years)
Associate Degrees
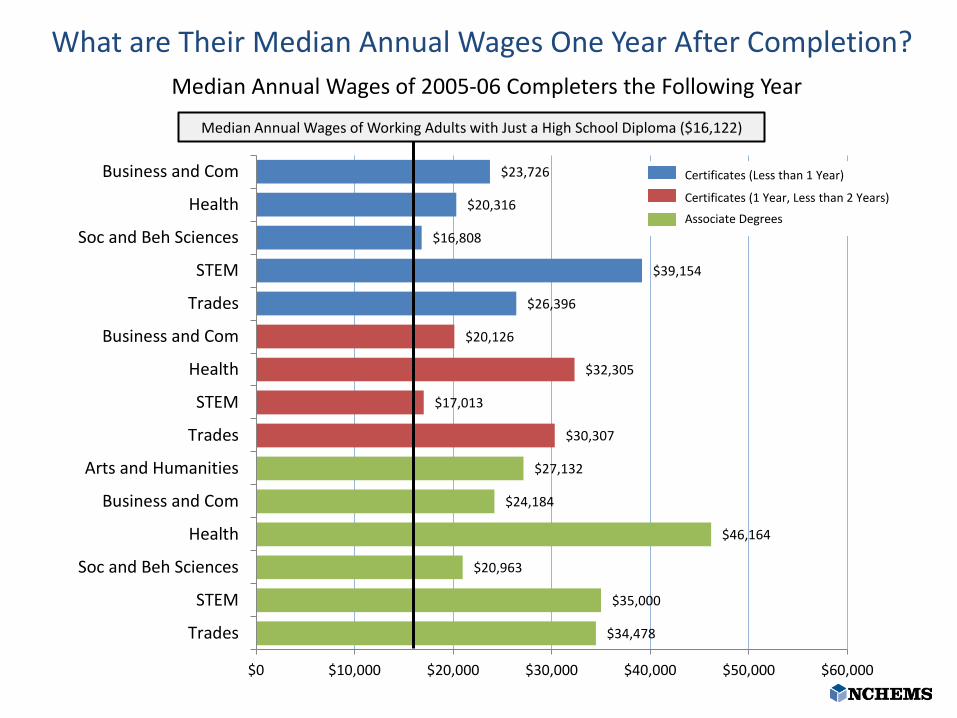
$34,478
$35,000
$20,963
$46,164
$24,184
$27,132
$30,307
$17,013
$32,305
$20,126
$26,396
$39,154
$16,808
$20,316
$23,726
$0 $10,000 $20,000 $30,000 $40,000 $50,000 $60,000
Trades
STEM
Soc and Beh Sciences
Health
Business and Com
Arts and Humanities
Trades
STEM
Health
Business and Com
Trades
STEM
Soc and Beh Sciences
Health
Business and Com
What are Their Median Annual Wages One Year After Completion? Median Annual Wages of 2005-06 Completers the Following Year
Certificates (Less than 1 Year)
Certificates (1 Year, Less than 2 Years)
Associate Degrees
Median Annual Wages of Working Adults with Just a High School Diploma ($16,122)

$46,207
$42,665
$24,276
$51,975
$29,895
$34,484
$39,200
$26,107
$35,956
$21,386
$33,504
$50,011
$18,628
$23,530
$28,211
$0 $10,000 $20,000 $30,000 $40,000 $50,000 $60,000
Trades
STEM
Soc and Beh Sciences
Health
Business and Com
Arts and Humanities
Trades
STEM
Health
Business and Com
Trades
STEM
Soc and Beh Sciences
Health
Business and Com
What are Their Median Annual Wages Five Years After Completion? Median Annual Wages of 2005-06 Completers Five Years After Completion
Certificates (Less than 1 Year)
Certificates (1 Year, Less than 2 Years)
Associate Degrees
Median Annual Wages of Working Adults with Just a High School Diploma ($16,122)

Making the Case for the Graduating Cohort of 2005-06
2007 2008 2009 2010 2011 2007 2008 2009 2010 2011 2007 2008 2009 2010 2011
Bus iness and Com 186 179 171 164 156 23,726 24,847 25,969 27,090 28,211 1,414,351 1,557,479 1,683,786 1,793,273 1,885,940
Health 718 674 631 587 543 20,316 21,120 21,923 22,726 23,530 3,011,349 3,369,578 3,657,505 3,875,132 4,022,457
Soc and Beh Sciences 101 97 94 90 86 16,808 17,263 17,718 18,173 18,628 69,290 110,967 149,232 184,084 215,523
STEM 167 161 155 149 143 39,154 41,868 44,582 47,296 50,011 3,846,344 4,145,130 4,411,347 4,644,993 4,846,070
Trades 569 540 510 481 451 26,396 28,173 29,950 31,727 33,504 5,846,134 6,501,676 7,052,382 7,498,251 7,839,282
Bus iness and Com 53 52 52 51 50 20,126 20,441 20,756 21,071 21,386 212,233 225,688 238,670 251,179 263,216
Health 437 418 399 380 361 32,305 33,217 34,130 35,043 35,956 7,071,831 7,145,877 7,185,240 7,189,919 7,159,915
STEM 39 38 37 35 34 17,013 19,287 21,560 23,834 26,107 34,761 119,468 198,491 271,831 339,487
Trades 340 323 306 288 271 30,307 32,530 34,753 36,977 39,200 4,822,859 5,295,734 5,691,905 6,011,373 6,254,138
Arts and Humanities 937 901 865 829 793 27,132 28,970 30,808 32,646 34,484 10,316,407 11,575,985 12,703,234 13,698,156 14,560,749
Bus iness and Com 264 251 239 226 213 24,184 25,612 27,040 28,468 29,895 2,128,389 2,384,345 2,603,891 2,787,026 2,933,751
Health 1,121 1,092 1,064 1,035 1006 46,164 47,617 49,069 50,522 51,975 33,676,903 34,399,922 35,039,411 35,595,369 36,067,796
Soc and Beh Sciences 109 106 102 99 95 20,963 21,791 22,619 23,448 24,276 527,652 598,093 662,737 721,582 774,630
STEM 161 158 154 151 147 35,000 36,916 38,833 40,749 42,665 3,039,345 3,275,094 3,497,429 3,706,350 3,901,856
Trades 159 154 150 145 140 34,478 37,410 40,342 43,275 46,207 2,918,528 3,283,674 3,620,962 3,930,391 4,211,962
Employed Five Years Following Graduation Median Annual Earnings Total Personal Income Generated Above the High School Median WqgaeField of Completion
Employed Over the Five Year Period
Median Earnings Over Five Years
Total Personal Earnings Above a High School
Wage ($16,122)
Total Additional Earnings Generated Over the Five Years = $438,756,988

Total Additional Earnings Over Last Five Years = $438,756,988
Total Revenues and Savings to the State = $94,244,276
Additional State Tax Revenues Generated = $68,536,366 Income Tax $37,818,493 Property Tax $8,471,451 Sales Tax $22,246,422
Savings to the State = $25,707,910 Medicaid $20,078,941 Corrections $5,628,969
Making the Case for the Graduating Cohort of 2005-06