landscape effects on bird and butterfly population … · • can be measured using coefficient of...
TRANSCRIPT

Integrated science for our changing world
www.ceh.ac.uk
Landscape effects on bird and butterfly
population resilience
Tom Oliver1
Simon Gillings2,
Michael Morecroft3
1 2 3
Integrated science for our changing world
www.ceh.ac.uk
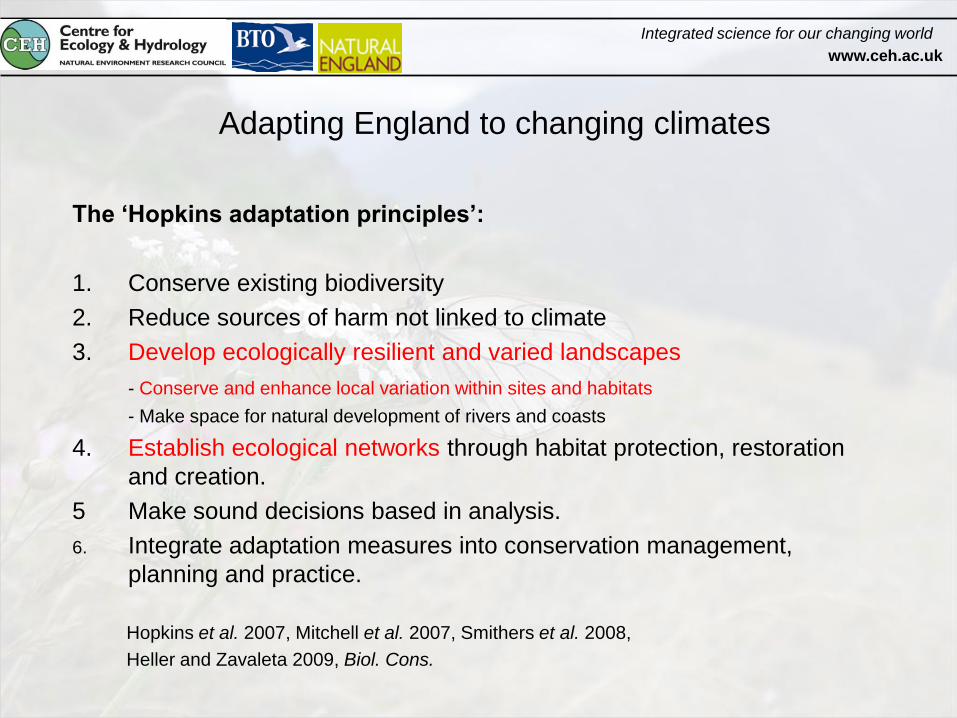
Adapting England to changing climates
The ‘Hopkins adaptation principles’:
1. Conserve existing biodiversity
2. Reduce sources of harm not linked to climate
3. Develop ecologically resilient and varied landscapes
- Conserve and enhance local variation within sites and habitats
- Make space for natural development of rivers and coasts
4. Establish ecological networks through habitat protection, restoration
and creation.
5 Make sound decisions based in analysis.
6. Integrate adaptation measures into conservation management,
planning and practice.
Hopkins et al. 2007, Mitchell et al. 2007, Smithers et al. 2008,
Heller and Zavaleta 2009, Biol. Cons.
Integrated science for our changing world
www.ceh.ac.uk
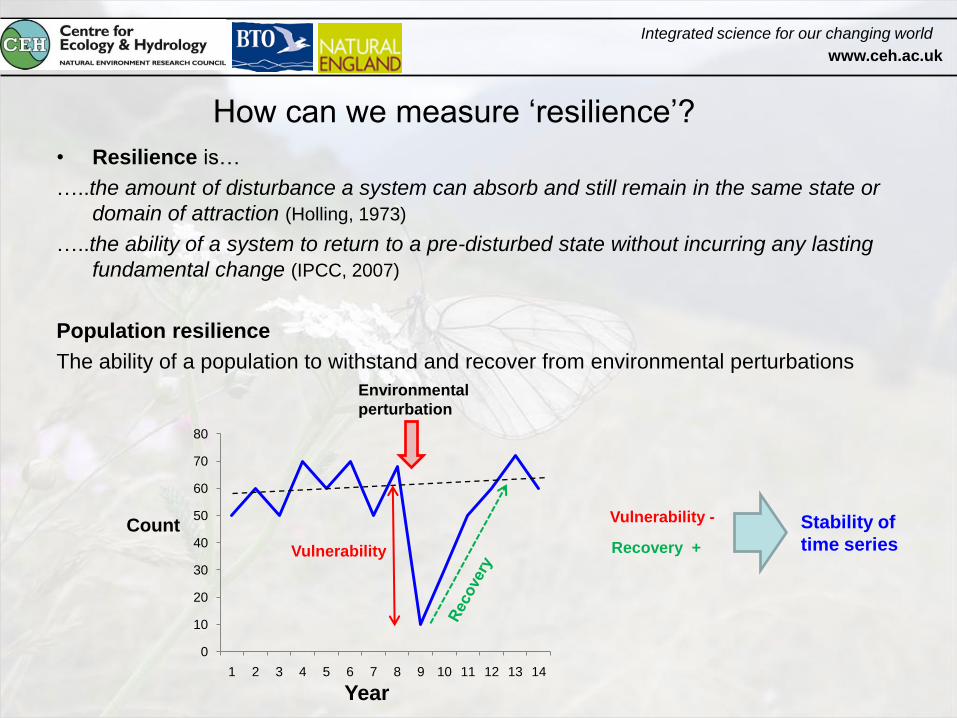
How can we measure ‘resilience’?
• Resilience is…
…..the amount of disturbance a system can absorb and still remain in the same state or
domain of attraction (Holling, 1973)
…..the ability of a system to return to a pre-disturbed state without incurring any lasting
fundamental change (IPCC, 2007)
Population resilience
The ability of a population to withstand and recover from environmental perturbations
0
10
20
30
40
50
60
70
80
1 2 3 4 5 6 7 8 9 10 11 12 13 14
Count
Year
Vulnerability
Environmental
perturbation
Vulnerability -
Recovery +
Stability of
time series

Integrated science for our changing world
www.ceh.ac.uk
• Can be measured using coefficient of variation (CV) or standard deviation of
log time series (SD)
• Theory and experiment show that stability is important for population
persistence, i.e. stable populations have lower extinction risk (Inchausti &
Halley, 2003, J. Anim. Ecol.; Pimm et al.1988, Am. Nat.)
• We may be able to manipulate landscape structure in order to improve
population resilience to environmental perturbations
i.e. improve adaptation capacity (cf. Hopkins et al. 2007)
Population stability
Integrated science for our changing world
www.ceh.ac.uk
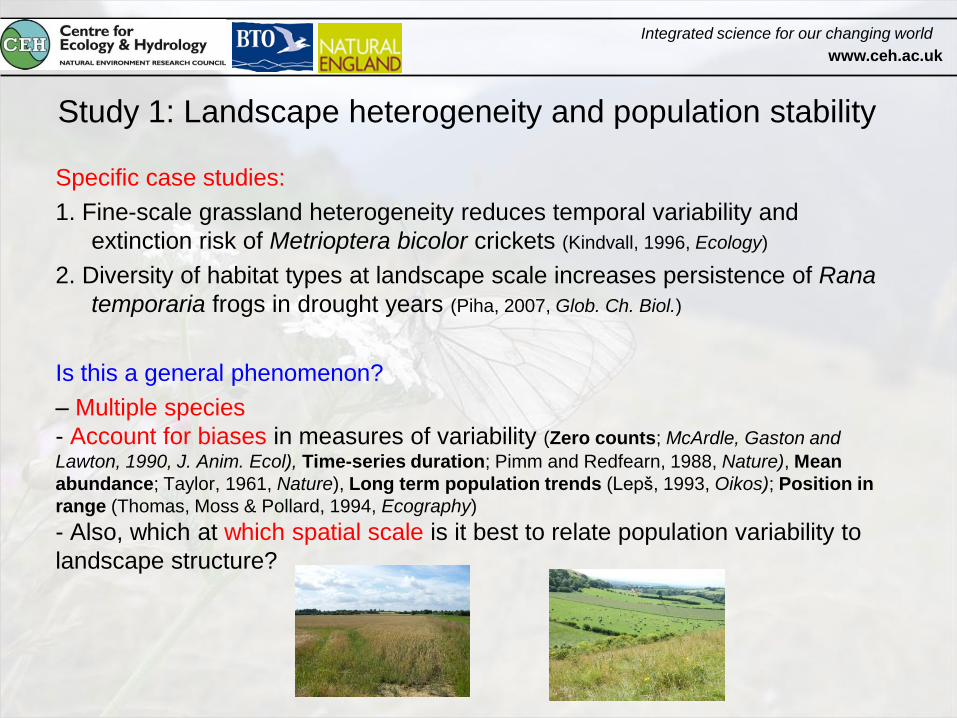
Specific case studies:
1. Fine-scale grassland heterogeneity reduces temporal variability and
extinction risk of Metrioptera bicolor crickets (Kindvall, 1996, Ecology)
2. Diversity of habitat types at landscape scale increases persistence of Rana
temporaria frogs in drought years (Piha, 2007, Glob. Ch. Biol.)
Is this a general phenomenon?
– Multiple species
- Account for biases in measures of variability (Zero counts; McArdle, Gaston and
Lawton, 1990, J. Anim. Ecol), Time-series duration; Pimm and Redfearn, 1988, Nature), Mean
abundance; Taylor, 1961, Nature), Long term population trends (Lepš, 1993, Oikos); Position in
range (Thomas, Moss & Pollard, 1994, Ecography)
- Also, which at which spatial scale is it best to relate population variability to
landscape structure?
Study 1: Landscape heterogeneity and population stability

Integrated science for our changing world
www.ceh.ac.uk
BIOTOPE/ ‘HABITAT’ DIVERSITY
• 12 broad habitat types from CEH Land cover map
• Shannon- Wiener H’ Index of habitat types ‘used’
by a particular species
• 1km, 2km, 5km radius around monitoring site
Assessing landscape heterogeneity
TOPOGRAPHIC DIVERSITY
• Slope and aspect from DEM
• Standard deviation of slope and aspect
values used as a measure of topographic
diversity
Integrated science for our changing world
www.ceh.ac.uk
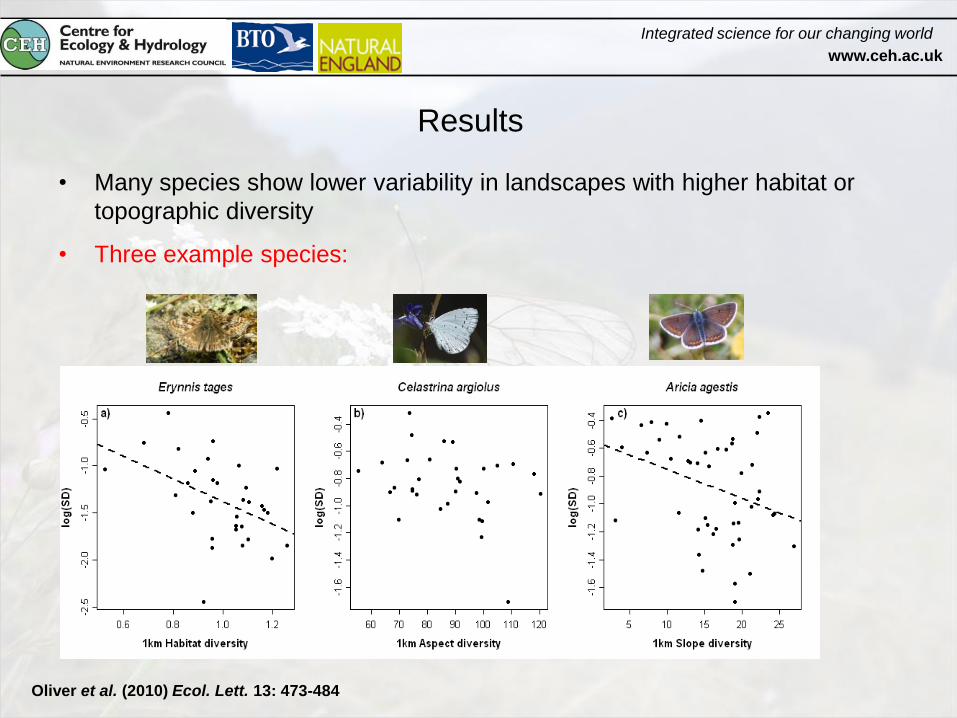
Results
• Many species show lower variability in landscapes with higher habitat or
topographic diversity
• Three example species:
Oliver et al. (2010) Ecol. Lett. 13: 473-484

Integrated science for our changing world
www.ceh.ac.uk
• Across all 35 species, there were significant relationships between habitat
diversity and topographic aspect diversity on population variability
• The results were robust to the inclusion of mean abundance and population
trend as covariates
• Habitat heterogeneity was significant at all spatial scales tested (p<0.05).
Aspect diversity was significant only at 1km around sites
Histograms of slope coefficients
Oliver et al. (2010) Ecol. Lett. 13: 473-484
Integrated science for our changing world
www.ceh.ac.uk
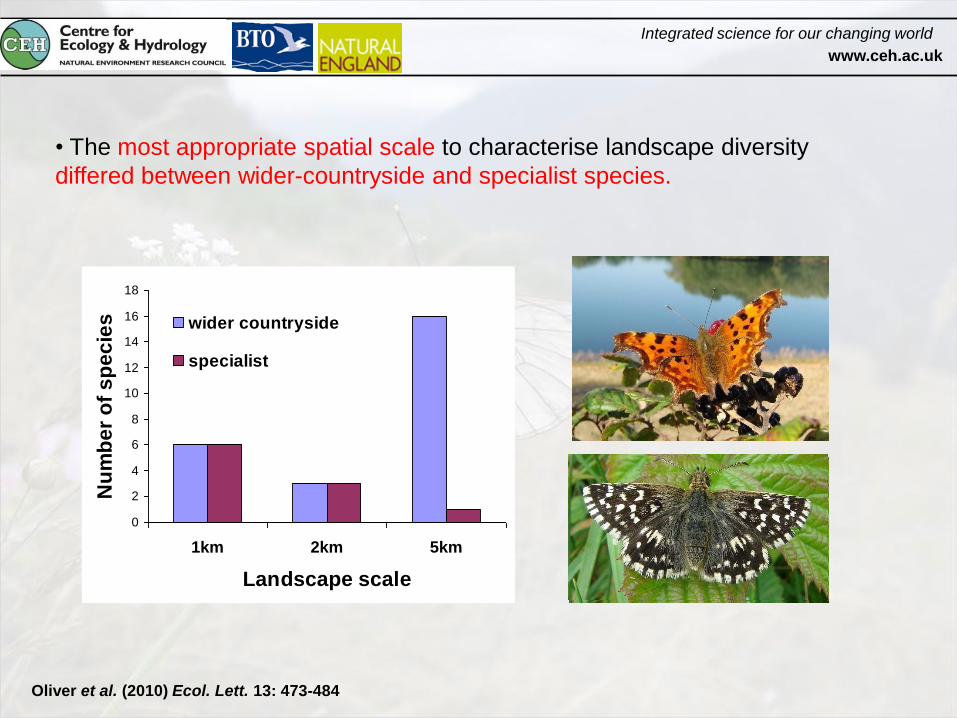
0
2
4
6
8
10
12
14
16
18
1km 2km 5km
Landscape scale
Nu
mb
er
of
sp
ec
ies wider countryside
specialist
• The most appropriate spatial scale to characterise landscape diversity
differed between wider-countryside and specialist species.
Oliver et al. (2010) Ecol. Lett. 13: 473-484

Integrated science for our changing world
www.ceh.ac.uk
Mechanisms?
1. Different population dynamics between habitat types/ topographic
formations due to differences in microclimate, resource availability, land
management, natural enemy intensity etc.
Leads to asynchronous dynamics, yet whole population across habitat
types has a more stable average (den Boer, 1981, Oecologia; Thomas, 1991
Oecologia)
2. Dispersal between habitat types dampens temporal variability
e.g.
– short term behavioural thermoregulation or resource acquisition (Ashton et al. 2009, Ecol. Ent.; Dennis & Shreeve, 2003 Oikos)
– different microclimates for different generations (Roy and Thomas, 2003,
Oecologia)
– different microsites between years depending on weather (Weiss et al,
1988, Ecology; Davies et al., 2006, J. Anim. Ecol.)
SHORT TERM
LONGER TERM

Integrated science for our changing world
www.ceh.ac.uk
Implications for conservation
1. Heterogeneity of the wider landscape is important for maintaining stable
populations of species.
2. Improving landscape heterogeneity should increase the resilience of
populations to environmental change.
3. Species responses may depend on functional traits.

Integrated science for our changing world
www.ceh.ac.uk
NE-funded project: Testing CC adaptation policy
How do site- and landscape
scale attributes affect…
Population resilience? Community composition?
• vulnerability to climatic
extremes
• recovery
• stability
• species richness
• change in proportion
of cold loving species
• change in proportion
of warmth loving
species
Project duration: October 2010 – 31st March 2011
Data
sources:
Breeding Bird Survey (4171 sites 1994-present), Common Bird Census,
(200 sites 1962-2000)
UK Butterfly Monitoring Scheme (1625 sites, 1976-present)

Integrated science for our changing world
www.ceh.ac.uk
Biotope Configuration
• Patch density
• Euclidean distance between patches
• Mean shape index
Biotope Heterogeneity
• Shannon diversity
Soil Moisture
• Mean/ max/ min modelled soil moisture in summer drought
• Dominant soil type
Soil heterogeneity
• Shannon diversity of soil hydrology types
Topography
• Mean/ max/ min slope, aspect (eastness, northness), altitude
• SD slope, aspect (eastness, northness), altitude
ATTRIBUTE:
METRICS:
LANDCOVERSOIL TOPOGRAPHY
Characterising sites and landscapes (0.5, 2, 5, 10km radius around
monitoring sites) using a range of metrics
NE-funded project: Testing CC adaptation policy
Biotope Area
• Individual biotope area
• ‘Suitability’ estimate (bioclimate model)
Integrated science for our changing world
www.ceh.ac.uk
Acknowledgements
Full project team
Marco Girardello, John Redhead, David Roy, Richard Pywell (CEH)
Simon Gillings, James Pearce-Higgins, Gavin Siriwardena, Rob Fuller (BTO)
Mike Harley, Nikki Hodgson (AEA)
Mike Morecroft, Simon Duffield, Humphrey Crick, Erica Wayman (NE)
Helen Pontier (Defra)
BTO & UKBMS Volunteers