landfill gas study performance on a ic engine with addition of syngas
TRANSCRIPT

1
Landfill gas study performance on a IC Engine with addition of Syngas
Liubov Melnikova
Advisor: Prof. Marco J. Castaldi
Co Advisor: Prof. Nickolas J. Themelis
Department of Earth and Environmental Engineering
Fu Foundation School of Engineering & Applied Science
Columbia University
April 2015
Submitted in partial fulfillment of the requirements for M.S. in Earth Resources Engineering
Research sponsored by Global WTERT Council and
National Science Foundation
Experiments carried out at Department of Chemical Engineering, City College, City University of New York,
Combustion and Catalysis Laboratory
2
EXECUTIVE SUMMARY
In this research, Chapter 1 is dedicated to analytical evaluation of landfill
gas recovery. The majority of the world’s municipal solid waste in is still
going to the landfills, US being no exception. According to BioCycle and
Earth Engineering Center, about 270 million tons of waste are landfilled
annually in US. Anaerobic degradation, a naturally occurring process on
the landfills, generates landfill gas which mainly consists of methane and
carbon dioxide. Methane is a highly potent greenhouse gas that can be
captured and used in a variety of applications. When methane from the
landfill is collected and used it not only prevents the gas from escaping into
the atmosphere, but also displaces the Carbon Dioxide emissions from the
fossil fuels that would otherwise have been used. Methane can be used
directly as gas or used to generate electricity and be sold to the grid.
Electricity generation makes up about three–fourths of currently operational
landfill gas capture projects in the United States. Besides the revenue from
electricity sale, creation of new jobs associated with the design,
construction, and operation as well as air quality improvement are other
benefits of landfill gas utilization. While there are lots of environmental and
economic advantages, from a technical point of view, utilization of landfill
gas for energy presents technical challenges due to low and fluctuating
energy content which results in flame instability.
One of the methods of catalytic reforming of portion of landfill gas and an
experiment conducted to validate it are described in Chapter 2 of this
research. A mixture of Hydrogen and Carbon Monoxide (syngas) was
injected at the different ratios to the stream of landfill gas and the resulting
gas mixture was then introduced to an internal combustion engine. Results
were measured in terms of exhaust emissions and engine performance at
different ratios of landfill gas and syngas.
3
Despite the difficulties with laboratory equipment, this experiment proved
that the addition of syngas to Landfill gas changes characteristics of
combustion process and results in increased reactivity of the fuel mixture
and decreased exhaust emissions.
Review of waste management in Russia and in Moscow: In Appendix D of
this report (p.41 et seq.), the author reviews briefly the current state of
waste management in Russia and the means of disposal of municipal solid
waste in the metropolitan area of Moscow.

4
Table of contents List of Figures ................................................................................................................................................ 5
List of Tables .................................................................................................................................................. 6
Chapter I. Current state of Landfilling and Landfill gas usage analyses ........................................................ 7
I.1. Municipal Solid Waste in the World .................................................................................................... 7
I.2. Municipal Solid Waste in the USA ....................................................................................................... 9
I.3. Landfill gas feasibility ........................................................................................................................ 11
I.4. Landfill gas utilization ........................................................................................................................ 14
I.5. Landfill gas to energy in the US ......................................................................................................... 15
I.6. Classification of landfill gas usage projects ....................................................................................... 18
I.7. Method of the catalytic reforming a portion of LFG ......................................................................... 20
II. Chapter 2. Experiment ............................................................................................................................ 21
II.1 Intention ............................................................................................................................................ 22
II.2. Equipment and specifications .......................................................................................................... 22
Engine .................................................................................................................................................. 22
Generator, Emission analyzer ............................................................................................................. 23
Power meter ........................................................................................................................................ 25
II.3. Schematic and description ............................................................................................................... 26
II.4 Experiment procedure ..................................................................................................................... 27
II. 6. Safety ............................................................................................................................................... 28
II.7. Calculations ...................................................................................................................................... 31
II.8 Problems/fixes................................................................................................................................... 34
II.8. Results .............................................................................................................................................. 38
II. 9 Conclusions and Further work.......................................................................................................... 46
References ................................................................................................................................................... 47
Appendix A: ................................................................................................................................................. 49
Appendix B .................................................................................................................................................. 50
Appendix C .................................................................................................................................................. 51
Appendix D. Review of waste management in Russia and in Moscow……………………………………………………51
5
List of Figures
Figure 1. Municipal waste treatment, EU-27, kg per capita ......................................................................... 7
Figure 2. Municipal Solid Waste treatment, EU-27, % of total ..................................................................... 8
Figure 3. Management of MSW in the US ..................................................................................................... 9
Figure 4. Waste hierarchy, IPCC .................................................................................................................. 11
Figure 5. Landfill gas composition ............................................................................................................... 13
Figure 6. Distribution of electricity generation capacity from LFGTE ........................................................ 16
Figure 7. Distribution of gas generation capacity from LFGTE .................................................................... 17
Figure 8. Classification of LFGTE projects ................................................................................................... 18
Figure 9. Tristate area LFGTE projects breakdown ..................................................................................... 19
Figure 10. Schematic of partial catalytic reforming of LFG . ....................................................................... 20
Figure 11. Syngas production and H2/CO ratios obtained while auto-thermally reforming ...................... 21
Figure 12. CO, THC, and NOx Emissions of a 2.8 kW 5hp 4 stroke Honda GC 160E engine operating on
simulated landfill gas (SLFG) compared to SLFG with 10% syngas addition .............................................. 22
Figure 13. Original Honda engine ................................................................................................................ 23
Figure 14. Retrofitted Honda engine .......................................................................................................... 23
Figure 15. PRAMAC EG2800 generator ....................................................................................................... 24
Figure 16. ENERAC 700 ................................................................................................................................ 24
Figure 17. Wattsup Pro power meter ......................................................................................................... 25
Figure 18. Circuit diagram ........................................................................................................................... 25
Figure 19. Experiment schematic ................................................................................................................ 26
Figure 20 Removed spark plug Figure 21 Spark Plug conditions and damages ................................... 35
Figure 22. Blade-style feeler guage ............................................................................................................. 35
Figure 23. Changing the oil .......................................................................................................................... 36
Figure 24. Cam shaft inlet and outlet at 1 and 3 stroke position ................................................................ 37
Figure 25. Deposits, founded on the valve stem neck ................................................................................ 37
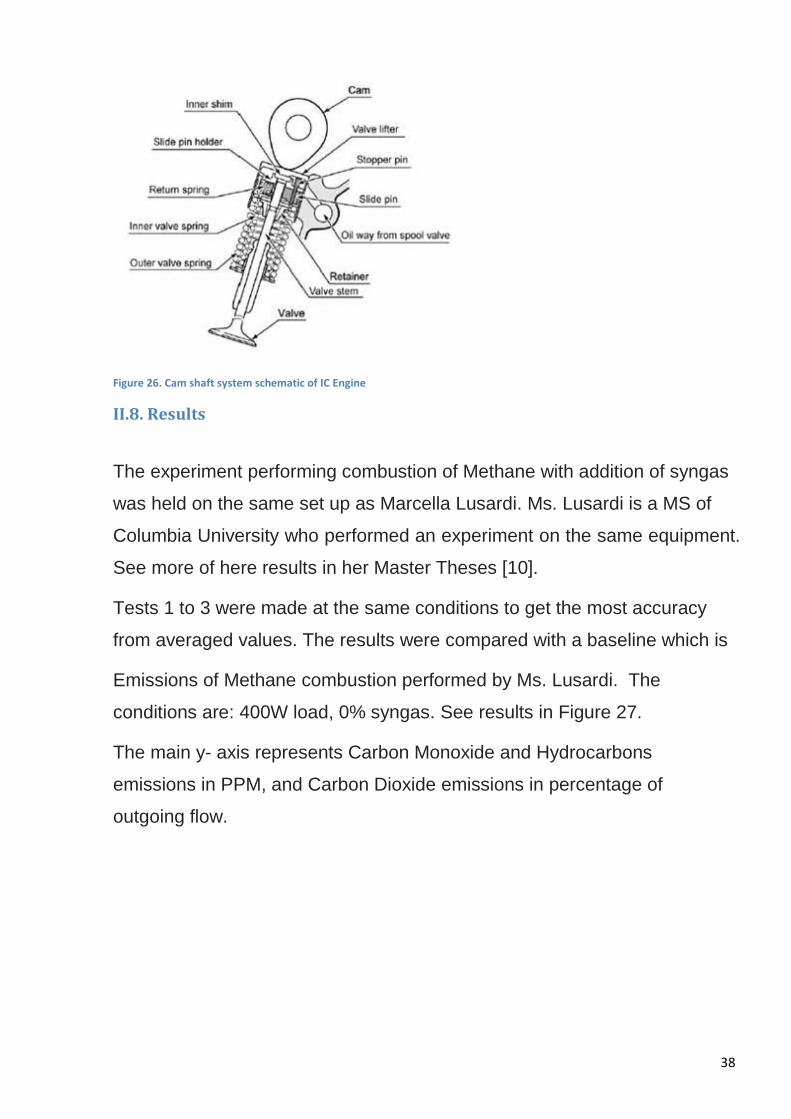
Figure 26. Cam shaft system schematic of IC Engine .................................................................................. 38
Figure 27. Methane Combustion Emission test results. 0.4kWreference .................................................. 39
Figure 28. Comparison of Methane and Landfill gas combustion emissions .............................................. 41
Figure 29. Comparison of Methane, Landfill gas and Syngas combustion emissions ................................ 43
Figure 30. Brake specific values for oxides of nitrogen and carbon monoxide .......................................... 44
Figure 31. Brake specific values of hydrocarbon emissions ........................................................................ 45
Figure 32. Disposition of MSW in Russia, 2011 ........................................................................................... 52
Figure 33. Per capita generation and disposition of MSW in Europe. ........................................................ 53
Figure 34. Disposition of MSW in Moscow ................................................................................................. 53
Figure 35. Location of WTE plants in Moscow ............................................................................................ 54
Figure 36. MSW combusted in Moscow WTE plants .................................................................................. 54
Figure 37. MSW management in Moscow .................................................................................................. 57
Figure 38. Russian Megacities MSW generation. ........................................................................................ 58
Figure 39. MSW composition of ten Russian Megacities ............................................................................ 59

6
List of Tables
Table 1. Gases characteristics ..................................................................................................................... 29
Table 2.Methane and air flow as a factor of load, based on calculations .................................................. 33
Table 3. AFT as function of CO2 concentration ........................................................................................... 34
Table 4. Euro norm emissions ..................................................................................................................... 45
Table 5. List of Eqiupment ........................................................................................................................... 49
Table 6. TRR issues and solutions outline ................................................................................................... 50
Table 7. Comparison of WTE plants in Moscow .......................................................................................... 55

7
Chapter I. Current state of Landfilling and Landfill gas usage analyses
I.1. Municipal Solid Waste in the World
The current annual world Municipal Solid Waste (MSW) generation,
estimated by D-Waste is 1.9 billion tons with almost 30% of it going
uncollected. Of the collected MSW, 70% is taken to landfills and dumpsites,
19% is recycled or recovered and 11% goes to energy recovery facilities [1]
Of the total amount of waste treated in European Union-27, disposal, which
includes landfilling as well as land treatment and release into water bodies,
represents slightly more than 50% [21]. The other main waste treatment
options are incineration, energy recovery and material recovery. In some
European countries, restrictions on the landfill of certain types of waste
have been imposed and much more waste is now recovered or incinerated.
Source: Eurostat
Currently Belgium, Denmark, Austria, Sweden, Nederland and Germany
manage municipal solid waste systems to minimize landfilling resulting in
Figure 1. Municipal waste treatment, EU-27, kg per capita

8
less than 10% of their waste stream going to landfill. Austria emphasizes
composting organic waste; while the other five countries incinerate majority
of their waste. Other European countries lag behind the six leaders, with
landfilling rate of more than 90%. Among those countries are Bulgaria,
Turkey, Romania, Malta, Latvia and Lithuania. Reviewing this data reveals
that that counties incinerating their waste, are also the ones with higher
rates of recycling and composting. Countries with no waste to energy are
most likely to have very little or no recycling and composting .
Source: Eurostat,2012
Figure 2. Municipal Solid Waste treatment, EU-27, % of total

9
I.2. Municipal Solid Waste in the USA
The majority of the world’s municipal solid waste is still going to the landfill
even in the most economically developed countries, including the US. The
actual amount of MSW generated in the US is still subject to debate.
According to the latest EPA data, there was 250 million tons of MSW
generated in 2008, while BioCycle and Earth Engineering Center cites
much higher numbers of 390 million tons generated and 270 million tons
being landfilled[4].
Figure 3. Management of MSW in the US
Source: BioCycle 2010 [4]
Disposing of solid waste in modern, managed landfills is the most
commonly used waste management technique in the United States.
Disposing of waste in illegal dumping sites is not considered to have
occurred in years since 1980 and these sites are not considered to
contribute to net emissions in this section for the inventory time frame of
1990 to 2011. MSW landfills, or sanitary landfills, are sites where MSW is
managed to prevent or minimize health, safety, and environmental impacts.
Waste is deposited in different cells and covered daily with soil, clay or
other material. There are numerous environmental monitoring systems

10
implemented at sanitary landfills to track performance, collect and
neutralize leachate, and collect landfill gas.
The United States is at a critical juncture in its energy portfolio. There is
renewed attention to producing energy domestically, reliably and
environmentally responsibly. Bringing new energy online to meet projected
demand will require a combination of conventional sources with an
increased contribution from renewable, distributed sources such as wind,
solar and biomass. In addition low quality (low BTU) and unconventional
fuels are increasingly being considered. Two significant issues with using
low quality and unconventional fuels are the combustion performance and
the emissions generated. One example of a low quality, unconventional
fuel is landfill gas (LFG), a significant source of energy from municipal solid
waste (MSW). The average MSW generation per capita is nearly 5 pounds
per day. If that waste is converted to energy it has the potential to offset
approximately 20% of oil imports.
Nearly 70% of MSW goes to landfills (see figure 3) where it anaerobically
decomposes to produce mostly CH4 and CO2 gas in a one-to-one ratio.
Capturing that gas for landfill gas-to-energy (LFGTE) projects turns landfills
into a source of clean, renewable energy and has been demonstrated on a
commercial scale. However, many small and mid-sized landfills are
prevented from installing LFGTE projects by the low and/or fluctuating BTU
content of the LFG resulting in poor combustion performance and
increased emissions.

11
Source
Separated
Materials
Reuse &
Recycling
Anaerobi
c
Digestion
Aerobic Composting
Energy Recovery
(WTE)
Modern Landfill Recovering & Using
CH4
Modern Landfill Recovering & Flaring
CH4
Landfills without CH4 Capture
Unsanitary Landfills & Open Burning
Waste
Reduction
Figure 4. Waste hierarchy, IPCC
There are only two proven methods to dispose of MSW at the rate it is
generated – landfill and waste-to-energy. The extraction of materials and
energy from MSW must be done to achieve sustainable practices in
managing and disposal of waste. The hierarchy of waste management, fig
4, shows that after reduce, reuse and recycle, energy extraction is the next
best disposal method. Energy extraction can come from gas collection of
composting the organic fraction of the waste or from landfills (yielding 120
MWh/ton) or combustion of MSW (yielding ~620 MWh/ton). As consumer
awareness of environmental issues and the demand for renewable energy
such as LFGTE increase, LFGTE projects are becoming especially
valuable to utilities and thus require continued development.
I.3. Landfill gas feasibility
Because of the presence of organic content in the landfilled waste, landfill
gas and leachate are generated by the process of anaerobic
decomposition. To be more specific, after being placed in a landfill, organic
waste is initially decomposed by aerobic bacteria. After the oxygen has

12
been depleted, the remaining waste is available for consumption by
anaerobic bacteria, which break down organic matter into substances such
as cellulose, amino acids, and sugars. These substances are further
broken down through fermentation into gases and short-chain organic
compounds that form the substrates for the growth of methanogenic
bacteria [19]. These Methane- producing anaerobic bacteria convert the
fermentation products into stabilized organic materials and biogas
consisting of approximately 50 percent biogenic Carbon Dioxide and 50
percent Methane, by volume.
C6H10O4 + 2H20 3CH4+ 3CO2
Landfill biogas also contains trace amounts of non-methane organic
compounds (NMOC) and volatile organic compounds (VOC) that either
result from decomposition by-products or volatilization of biodegradable
wastes [19] . See figure 5. It also contains trace amounts of ammonia and
sulfides, both of which cause unpleasant odors even at very low
concentrations.
Landfill gas composition is highly dependent on climate at the landfill
location, season, landfill conditions and age, type of landfilled waste and
moisture content. However, regardless of the local conditions, almost half
of the generated gas is methane. Methane is well known as Green House
Gas (GHG). Despite the fact that Methane's lifetime in the atmosphere is
much shorter than Carbon Dioxide, Methane is much more efficient at
trapping radiation than Carbon Dioxide. The comparative impact of
Methane on climate change is over 20 times greater than that of Carbon
Dioxide over a 100-year period [3]. If uncontrolled, Landfill Gas contributes
to smog and global warming, and may cause health problems.

13
Methane
Carbon Dioxide
Oxigen
Nitrogen Ammonia NMOC Sulfides
But at the same time, landfill gas is a potential alternative energy source.
Landfill Gas to Energy (LFGTE) process has attracted a lot of interest as a
source of energy and heat with an additional benefit of reducing methane
emissions into the atmosphere. One ton of biodegradable waste produces
between 50 m3 and 270 m3 of landfill gas. [14], [15],[20].
Collection and use of Landfill gas should not be considered as the best
Waste-To-Energy way in every country where landfilling is used. The
diversion of biodegradable municipal waste from landfill is a key objective
under the European Union landfill directive. This directive aims to reduce
negative impact of landfilling waste on the environment and requires
Member States to reduce the amount of biodegradable waste going to
landfills in order to reduce methane emissions. The goal of the directive is
to achieve a 50% reduction of landfilled biodegradable waste by 2013 and
65% reduction by 2020 as measured against the 1995 levels [22]. The
emphasis on composting and other technologies to deal with this waste
stream is growing in European Union. However, this reduction in organic
material reaching the landfills will also reduce the methane stream
available to LFGTE projects in the EU by as much as 1/3 making them
economically unfeasible by 2020.
Until there is no separate collection and recycling of the organic waste
stream in the US, landfill gas to energy projects will remain feasible.
Figure 5. Landfill gas composition

14
I.4. Landfill gas utilization
US laws requiring collection of landfill gas are not based on global warming
impact of methane, but rather on the toxic hazards of NMOCs. Federal
regulations require that landfills with total permitted capacity greater than or
equal to 2.5 million cubic meters of waste, to have their annual Non-
Methane Organic Compound emissions estimated. If the NMOCs are
estimated at more than 55 tons per year, the landfill must adhere to rules
that include submitting compliance reports and installa gas collection
system [3].
LFG electricity projects capture ~85% of the methane emitted from a MSW
landfill. In addition to reduced price volatility, an LFG to electricity project
provides two GHG emissions reduction opportunities. First, it requires
methane from the landfill to be collected, thereby preventing the gas from
escaping into the atmosphere. Second, it displaces the CO2 emissions from
the fossil fuels that would otherwise have been used. There are other
broader benefits such as air quality improvement of the surrounding
community by reducing landfill odors. LFGTE projects generate revenue
from the sale of the electricity and create jobs associated with the design,
construction, and operation of energy recovery systems that include
engineers, construction firms, equipment vendors, and utilities or end–
users of the power produced. Much of this cost is spent locally for drilling,
piping, construction, and operational personnel, helping communities to
realize economic benefits from increased employment and local sales.
Besides electricity production, gas, captured from Landfills can be used
directly. Landfill gas can offset the use of fossil fuel thus reduce current
dependency rate from primary energy sources. It also can be used on the
landfill itself to evaporate leachate. Innovative direct uses include firing
pottery and glass–blowing kilns; powering and heating greenhouses and an
ice rink; and heating water for an aquaculture (fish farming) operation [2].

15
Another benefit of LFGTE is education and increasing of public awareness
of positive sides of Landfills and of waste treatment in general. A lot of
people may not be aware of environmental benefits of waste to energy
projects and suppose that everything beyond recycling is not environmental
friendly. Implementing LFGTE projects increase public awareness and
make people from local community become familiar with environmental
friendly engineered waste treatment.
I.5. Landfill gas to energy in the US
Currently there are 621 operational LFGTE projects in the US generating
1,978 MW and 311 mmscfd. There are also about 450 LFGTE candidate
landfills, which are expected to create additional 850 MW or 470 mmscfd
[12]. There are two maps representing direct usage of Landfill gas (see fig
7) and electricity generation LFGTE projects (see fig 6)in the US. Colored
background of both maps represents population density, where blue is the
lowest and red is the highest. Each county with a LFGTE project allocated
in that map is bordered in green color. The diameter of the circles
represents power output, fig 6, and gas generation, fig7.
The generation of electricity from LFG makes up about three–fourths of the
currently operational projects in the United States, see the distribution of
those projects of the map- fig6. The bigger the diameter- the more
megawatts are generated from landfill gas combustion. From maps it is
easy to see how LFGTE projects located where the population is the
densest. LFGTE projects require both, source of waste as big landfill and a
market for the product- power or gas. That is why there are projects located
next to the biggest cities in the country: New York great area, Chicago area,
Los Angeles and San Francisco areas and Dallas.

16
Figure 6. Distribution of electricity generation capacity from LFGTE

17
Figure 7. Distribution of gas generation capacity from LFGTE

18
I.6. Classification of landfill gas usage projects
EPA classifies LFGTE projects into four categories: direct use of gas,
electricity generation, cogeneration and upgraded. The majority of LFGTE
projects generate electricity from landfill gas. Syngas addition into landfill
gas stream it is not a method that is currently implemented. Syngas
addition will fall into EPA category of upgraded use of landfill gas.
Figure 8. Classification of LFGTE projects [12]
There are 147 operation LFGTE projects located in Tri-state area, which is
associated with states of New York, New Jersey and Pennsylvania. All
together they generate 290 megawatt of power. About a quarter of the
projects are currently closed and a little more than a half is governmental
owned.
Electricity from landfills gas be generated using a variety of different
technologies, including internal combustion engines, turbines,
microturbines, and fuel cells. The majority of projects use internal
combustion engines or turbines, with microturbine technology being used at
smaller landfills. Technologies such as Stirling and organic Rankine cycle
engines and fuel cells are still in development.
Nowadays there are a lot of applications for direct use of landfill gas.
Current industries using LFG include auto manufacturing, chemical

19
production, food processing, pharmaceuticals, cement and brick
manufacturing, wastewater treatment, consumer electronics and products,
paper and steel production, and prisons and hospitals [12].
Figure 9. Tristate area LFGTE projects breakdown

20
I.7. Method of the catalytic reforming a portion of LFG
There are difficulties in using LFG for energy because of low and
fluctuating energy content resulting in lack of flame stability. That results in
decreasing of fuel efficiency and increased CO, unburned hydrocarbon
(UHC), and NOx emissions. To mitigate these emissions, there are many
conventional post combustion cleanup methods. However, many of these
methods result in reduced power output due to pressure drop increases
and could potentially add significant expense. Typically, emission waivers
are required before LFGTE projects can be permitted [6].
One method of increasing the reactivity of LFG and reducing engine
emissions is to add hydrogen to the fuel stream. In this study, injection of
syngas, a mixture of H2 and CO, is investigated as a method of reducing
engine emissions and increasing engine efficiency.
Figure 10. Schematic of partial catalytic reforming of LFG [6].

21
II. Chapter 2. Experiment
The Combustion and Catalysis Laboratory (CCL) has demonstrated that
landfill gas can be fully converted to syngas using a Rh/Al2O3 catalyst for
both dry and auto-thermal reforming even in the presence of LFG chlorine
impurities. Dry reforming is the direct conversion of CH4 and CO2 into H2
and CO, while auto-thermal reforming includes the addition of air. The
benefit of air addition is that it
enables the exothermic reactions
of methane combustion and partial
oxidation to supply heat for the
reforming reactions, resulting in
lower heat input, or possibly zero
external heating (i.e. autothermal
operation).
Figure 11 shows the amount of
syngas production and the H2/CO
ratios obtained while auto-thermally reforming a simulated landfill gas with
a CH4/CO2 ratio of one. H2/CO ratio is shown on the primary ordinate and
syngas production is shown on the secondary ordinate as a function of
monolith outlet temperature (abscissa). This data demonstrates that LFG
can be reformed to produce syngas at various H2/CO ratios and
concentrations as a function of the temperature of the catalyst.
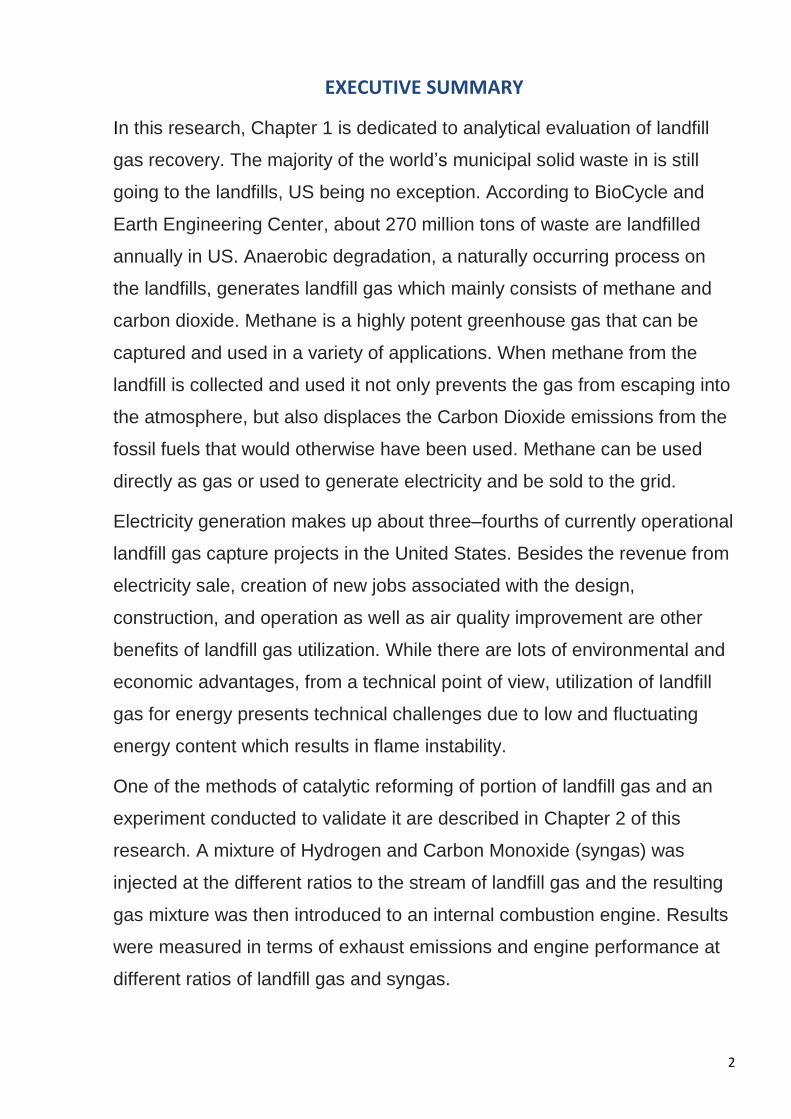
The CCL has also demonstrated that syngas introduction into an IC engine
operating on LFG reduces emissions and improves the engine efficiency.
Figure 12 below shows the performance of a 2.8 kW (5-hp), 4 stroke Honda
GC 160E engine operating on simulated landfill gas (SLFG) compared to
SLFG with 10% addition of syngas with a H2/CO ratio of one. The engine
testing showed that injecting up to 5% syngas into a simulated LFG mixture
prior to entering a combustion engine decreases CO, UHC, and NOx
Figure XX: Syngas production and H2/CO ratios obtained
while auto-thermally reforming a 1:1:0.5 CH4:CO2:O2 gas
mixture as a function of monolith outlet temperature
0%
10%
20%
30%
40%
50%
60%
1.0
1.5
2.0
2.5
3.0
3.5
4.0
4.5
5.0
300 400 500 600 700 800
Syn
gas
Pro
du
ctio
n %
H2
/CO
ra
tio
Monolith Outlet temperature [°C]
H2/CO ratio and % Syngas Production during ATR of LFG
H2/CO % Syngas
Figure 11. Syngas production and H2/CO ratios obtained while auto-thermally reforming a 1:1:0.5 CH4:CO2:O2 gas mixture as a function of monolith outlet temperature [6]
22
emissions by 73%, 89%, and 38%, respectively, and increases engine
efficiency by 10% [6]. Therefore syngas addition clearly improves the
combustion efficiency of an IC engine operating on LFG and opens
opportunities for the conversion of low-BTU LFG or other CH4/CO2 mixtures
to energy.
Figure 12. CO, THC, and NOx Emissions of a 2.8 kW 5hp 4 stroke Honda GC 160E engine operating on simulated landfill gas (SLFG) compared to SLFG with 10% syngas addition [6]
II.1 Intention
The intent of this experiment is to make a contribution to the global waste
to energy research in the area of municipal solid waste combustion reaction.
The experiment conducted during this research was performed to examine
the use of landfill gas with the addition of syngas (H2 and CO) in the
internal combustion engine. The points of interest were the exhaust
emissions and engine performance at different electrical loads. It is
expected that syngas would be produced by a catalyst installed close
coupled to an engine where it will reform a portion of the landfill gas. In the
experiment, all gases were obtained from cylinders and mixed in the surge
tank directly connected to the engine.
II.2. Equipment and specifications
Engine
In this study, the experiments were performed using a Honda 5 hp, 160cc,
single cylinder, four-stroke, spark-ignition gasoline engine. See original
engine picture Figure 13.

23
The engine was originally fueled by gasoline. It was retrofitted for use with
gaseous fuels such as methane. The carburetor, fuel tank, and fuel pump
were removed from the engine. An aluminum plate with a 1/2 inch threaded
hole for pipe fitting was fabricated and fixed to the engine in order to
directly feed the mixture of fuel and air into the engine cylinder. Between
the plate and cylinder wall, a graphite gasket was installed to prevent
leakage of fuel and air mixture. See Figure 14.
The muffler, which is used to reduce engine noise, was removed, and a
metal plate with a threaded hole was installed on the exhaust outlet. A tee
was fitted on the added exhaust pipe so that the analyzer was only drawing
off a sample of the exhaust and not receiving the full exhaust flow.
Figure 13. Original Honda engine
Figure 14. Retrofitted Honda engine
Graphite
gasket
Gaseous fuel
pipe
Removed
fuel tank
Generator, Emission analyzer
The engine was directly connected to a PRAMAC EG2800 electric
generator. This generator is shown in Figure 15. Emission analysis, Figure
16, was conducted with ENERAC integrated emissions system Model 700.

24
Figure 15. PRAMAC EG2800 generator
Figure 16. ENERAC 700
The probe of the Enerac was inserted into the exhaust pipe. With analyzer
in operation, the pump inside the device withdrew a sample of the exhaust
gas. This sample was conditioned before entering the analyzer, via an
onboard water trap. A number of sensors in the ENERAC 700 analyzed the
contents of the stack gas, calculated and displayed the results.
Electrochemical sensors (SEM) measured the Carbon Monoxide, Nitric
Oxide, Nitrogen Dioxide and Oxygen gases. These SEM sensors consisted
of two components: the sensor module and the precision control module
(PCM). The function of the PCM is to set the sensitivity of the sensor and
also to contain any filter material that removes the effect of interfering
gases. Non-dispersive infrared spectroscopy (NDIR) sensors are also
included in the ENERAC 700. The NDIR bench operates on the principal
that different gases absorb infrared radiation at varying frequencies. The
NDIR bench could then measure Carbon Monoxide, Carbon Dioxide, and
Unburned Hydrocarbons

25
Power meter
To measure the power output produced by electric generator , a Wattsup
pro power meter was used. A current transformer was used to step down
the current by a factor of ten so that the meter’s current rating was not
exceeded. Figure 17 and 18 shows the power meter and the circuit
diagram of the load board and meter assembly.
Figure 18. Circuit diagram
Figure 17. Wattsup Pro power meter

26
II.3. Schematic and description
The engine connected to the generator was fueled by simulated landfill gas.
Four gases were mixing in a surge tank with house air. Final fuel mixture
was fed to the engine to be burned. The emissions were then measured on
the exhaust side. The generator was connected to an electric load
consisting of several light bulbs 100 watts each to provide variable engine
load. All gases were taken from the cylinders (gas purity) and were
measured and controlled by rotameters. House air was controlled by
pressure regulator and measured by air flow meter. The electric power
generated by the engine-generator system was measured by the Wattsup
Pro powermeter as an indication of engine load and performance. Exhaust
emissions such as carbon monoxide, unburned hydrocarbon, and oxides of
nitrogen (as the sum of nitrogen oxide and nitrogen dioxide) were analyzed
by an Enerac 700 integrated gas analyzer. The Enerac was displayed on
the computer with the help of Enercom software.
Figure 19. Experiment schematic

27
II.4 Experiment procedure
TU
RN
ING
ON
TH
E E
NG
INE
1. Before each test the ENERAC 700 was zeroed for 100 seconds. 2. The ENERAC 700 was connected to a computer to record data. 3. The fume hood in which the engine experiment carried out was turned
on. 4. Tube connections from gas sources to each rotameter, from each
rotameter to pressure gauges, and to the mixing chamber and engine were closely checked and tightened.
5. The air flow to the engine was turned on. 6. The rotameter value for air was monitored and flow was adjusted
appropriately. 7. The delivery pressure regulator for air was set at 30 psi 8. The system was checked for leaks on the air line with soaped water. 9. The CH4 flow was turned on. 10. The delivery pressure for methane was set at 20 psi 11. The rotameter value for CH4 was monitored and flow was adjusted
appropriately. 12. The system was checked for leaks on the methane line with soap water. 13. The engine was started.
FL
OW
S R
EG
UL
AT
ION
14. The CO2 flow was turned on (if required by the specific test). 15. The rotameter value for CO2 was monitored and flow was adjusted
appropriately (if required by the specific test). 16. The system was checked for leaks on the carbon dioxide line with soap
water. 17. The CO flow was turned on (if required by the specific test). 18. The rotameter value for CO was monitored and flow was adjusted
appropriately (if required by the specific test). 19. The system was checked for leaks on the carbon monoxide line with
soap water. 20. The H2 flow was turned on (if required by the specific test). 21. The rotameter value for H2 was monitored and flow was adjusted
appropriately (if required by the specific test). 22. The system was checked for leaks on the hydrogen line with soap water.

28
LO
AD
&P
RO
BE
23. A number of bulbs on the load board were turned on. 24. 15 minutes were allowed to pass so that steady state was reached. 25. A probe connected to the gas analyzer was put into the center of
exhaust pipe. 26. 10 minutes were allowed to pass until data from the gas analyzer
stabilized. 27. Gas analyzer data recording was started on the computer during the
next 10 minutes. 28. The probe was removed from the exhaust pipe.
RE
PE
AT
29. When the electrical load, the fuel or air flow were changed, the above procedure was repeated from the beginning.
30. Each experiment was repeated three times to calculate the mean values of the experiments.
TU
RN
ING
OF
F 31. The bulbs on the load board were turned off.
32. The CH4 flow was turned off, engine stopped. 33. The CO flow was turned off. 34. The H2 flow was turned off. 35. The CO2 flow was turned off. 36. Air flow was turned off.
FIN
ILIZ
ING
37. The ENERAC 700 was allowed to draw in ambient air until all emission values approached 0 ppm.
38. The fume hood was turned off. 39. When all values on the ENERAC 700 reached zero, the device was
turned off. 40. It was checked to make sure gas cylinders were completely closed and
gas remaining in pipeline was vented.
II. 6. Safety
Laboratory experiments are always associated with a risk. Because of that,
safety is a main priority during the experimental research.
Chemical reaction of combustion is a rapid oxidation, which transforms
energy stored in the chemical bonds to the heat that can be utilized [8]. In
that experiment, energy from 3 flammable gases- methane, hydrogen and
carbon monoxide are being used. Characteristics of the gases see table 1.

29
Table 1. Gases characteristics
Gas Flammable Auto-ignition Temperature
Toxicity LEL-UEL Symptoms
CH4 Yes 580 C 1076 F
relatively non-toxic
5 - 15 headache, heart palpitations, dizziness, fatigue
H2 Yes, extremely
500 C 932 F
Non toxic 4 - 75 headaches, ringing in ears, dizziness, drowsiness, unconsciousness, nausea, vomiting and depression of all the senses. The skin may have a blue color
CO Yes 609 C 1128 F
25 ppm 12,5 - 74 headache, drowsiness, dizziness, nausea, confusion
CO2 No - 5000 ppm - headache, flushed skin, full pulse, shortness of breath
Leaking of flammable gases can cause unwanted ignition. Sources of
ignition for leaked Hydrogen, Carbon Monoxide and Methane are the
engine, generator, and light board. The rotameters of all gases are kept at
the distance from all of those sources and located on the separated table to
reduce risk of ignition. Before the test, each line has been tested for leaks
with soapy water. During the operation, the lines were closely monitored.
There are some conditions for that experiment at which concurrent flow can
occur. The delivery pressure for house air are usually 25-30 PSI while
flammable gases from the cylinders were delivered at constant 20 PSI
pressure. The air can flow against the current of influent gas and into the
original source of gases. It is dangerous for air to enter flammable gas lines
and especially the Hydrogen cylinder, as the combination of highly
pressurized oxygen and hydrogen would practically create a rocket. To
prevent this from happening, two check valves were installed upstream of
the surge tank, one in the fuel line and the other in the air line. Each gas
line was equipped with check valves so no flow can get to the cylinders.

30
If the engine gets not sufficient amounts of air or fuel, it will stall. This will
cause a large pressure build-up in the engine, and if large enough, the fuel
or air will flow against the current. As there are check valves on the serge
tank, the pressure will builds up in the line between the surge tank and
engine. The emergency exhaust line with a on-off valve were installed right
after the surge tank. The cross was installed down the line to provide
second emergency exhaust. This way any countercurrent flow would stop
at the surge tank inlet and pressure will be release in the line.
If the leak is happening and not detected by soapy water, there are 2
detectors located around the set up. As long as Methane – 16 g/mol and
Hydrogen – 2g/mol are lighter than air, the detectors are located above the
set up on the wall.
When the experiment runs, the fire extinguisher is located next to the set
up. All the cylinders are secured according to the training provided by the
office of the environmental health and occupational safety. Power cords are
separated from the gas lines. Heat proof glove is used since the engine
gets hot very quickly.
To eliminate the risk of working in the lab, the team of senior students and
doing a Test Readiness Review for the upcoming experiment. Having a
fresh look to the set up and answer critical questions is always very helpful
in terms of safety concern.
For the experiment held in that research work, the test readiness review
TRR was held June, 30th 2014. See TRR issues and solutions outline see
in the Appendix B.

31
II.7. Calculations
Before experimental part began, fuel flows were calculated for each
electrical load.
From the engine specifications it is known that before engine was retrofitted,
it’s fuel consumption was 0.313 kg/kWh. Low Heating Value (LHV) of
gasoline which was meant to be used in the engine is 44.3 MJ/kg.
1 kWh = 3.6 MJ, thus fuel consumption is
In other words, 1 kg of fuel gave an energy output
While energy that was going in from 1 kg of gasoline is 44.3MJ
Thus, the Engine Efficiency is energy output divided by energy input.
It is important to know engine efficiency to find amount of methane, needed
for each electrical load experiment. Desired Thermal output of the system
depends on the engine efficiency and will require more input in terms of
fuel.
for instance with the electrical load, is 0.4 kW, then required
thermal

32
This requirement shall be fulfilled by methane, (LHV = 50029.6 kJ/kg), thus
fuel flow equals Thermal output divided by enthalpy.
See the results table2
The theoretical air required to complete methane combustion results from
the equation of stoichiometry of oxygen/fuel reaction.
CH4+2(O2+3.76N2) --> CO2+2H2O + 7.52N2
Stoichiometric air means the exact amount of air required by a
stoichiometrically balanced equation. The stoichiometric air/fuel ratio (AFR)
can be calculated from the reaction equation. 1 mole of Methane requires
2 moles of Oxygen and 2 times 3.76 mole of Nitrogen, thus AFR = 2+7.52
= 9.52
The actual combustion air depends also on the assumed air excess
(equivalence ratio or stoichiometric ratio)[10]. Using equivalence ratio
consistent =0.5 by formula below actual air needed for the combustion
reaction was found:
(
)
(
)
(
) (
)
(
) is the stoichiometric fuel to oxidizer ratio and the (
) is the actual
fuel to oxidizer mass ratio. The results for each load see in the Table2.

33
Table 2.Methane and air flow as a factor of load, based on calculations
Load: Methane Air
kW (L/min) (L/min)
0.4 2.6 49.1
0.8 5.2 98.2
1.2 7.7 147.4
The addition of Syngas was made by calculated percentage of enthalpy of
the reaction.
During the experiment three different combustion reactions were produced:
combustion of methane, combustion of methane with carbon dioxide and
combustion of methane with carbon dioxide and syngas.
The enthalpy of each of the reactions was found by the heat of formation
[10]
1)CH4+CO2+3(O2+3.76N2) = 2CO2 + 2 H20
H comb = 2H*CO2+ 2H*H20 – H*CH4 – H*CO2 – 3H*02 – 5.64N2
H comb = - 802.2 KJ/mol
2)CH4+CO2 + H2 + CO 3(O2+3.76N2) = 3CO2 + 3 H20
H comb = 3H*CO2+ 3H*H20 – H*CH4 – H*CO2 – 3H*02 – 5.64N2
H comb = - 1327 KJ/mol
3)CH4+3(O2+3.76N2) = CO2 + 2 H20
H comb = H*CO2+ 2H*H20 – H*CH4 –– 3H*02 – 5.64N2
H comb = - 802.2 KJ/mol
As we see, the enthalpy of the reaction with carbon dioxide and without is
the same because there is no heat (no enthalpy) in Carbon Dioxide.
However, presence of CO2 in the gas mixture causes changes in Adiabatic
Flame Temperatures (AFT). As greater CO2 concentration – the lower AFT
is, see table 3.

34
Table 3. AFT as function of CO2 concentration
Fuel Type AFT, (K)
100% CH4 1244
100% CH4 1251
50% CH4, 50% CO2 1206
Source: [10]
Because of the CO2 presence in Landfill gas lowers AFT, partial reforming
of LFG to Syngas will help to maintain a AFT. Using 802.2KJ/mol as a
baseline enthalpy of the reaction, Syngas addition was calculated at 5, 10
and 15 % by enthalpy.
II.8 Problems/fixes
After several full sets of experiments, the engine stopped and didn’t turn on
again. It was found that inlet tube is getting hot while trying to turn on the
engine. As for trouble shooting, we detected 3 groups of potential
problems: spark (spark plug or electrical connections to the spark), fuel/air
ratio, or inner parts of the engine. First of all, number of different fuel/air
ratios were put into the system and all the flows calculations were double
checked. Removing and installing a new spark plug is far easy to
accomplish because of no need to open the engine and take it apart, that is
why it was changed next.
A spark plug is a device for delivering electric current from an ignition
system to the combustion chamber. The spark work is to ignite the
compressed fuel/air mixture by an electric spark. A properly gapped spark
plug is necessary for a properly functioning engine. The gap size affects
the spark plug's firing temperature, which has a direct relationship to the
combustion of fuel and air in the engine. Also, the spark plugs can build up
some soot on the contact points

35
Figure 20 Removed spark plug Figure 21 Spark Plug conditions and damages
Removed spark plug was not seems damaged, ( see figure 20 however,
according to the figure 21, the distance between the electrodes were less
than required by engine specifications- 0.6-0.7 mm. Some ash deposits
were observed. Ground electrode seemed a bit banded.
The new spark plug was purchased but it seemed to have the gap more
than required by engine specifications. A blade-style feeler gauge was
used to reduce the distance between electrodes.
Figure 22. Blade-style feeler guage

36
Changing the spark plug didn’t help to start the engine. The next step was
to change the oil, because it was not changed since engine purchase.
Figure 23. Changing the oil
In the oil it was a lot of metal particular matter on the bottom. It looked very
dark grey (fig 23), unlike dark brown used oil the car. A small sample bottle
was taken while the rest went to Environmental Health and Occupational
Safety Department.
After the oil was changed, the engine didn’t start. It was decided to open
the top cap of the engine.
Right under the cap there is a cam shaft system of the engine, see figure
24. In internal combustion engines working with pistons, the camshaft is
used to operate poppet valves. The cam lobes force the valves open by
pressing on the valve. The camshaft lifts the valve from its seat. The further
the valve rises from its seat the more airflow can be released.
When the cap was opened it was detected the cam shaft of the inlet
doesn’t touch the valve stem in ―up‖ position. At the same time, outlet cam
shaft system was working fine with the valve on both ―up‖ and ―down‖
position.

37
Figure 24. Cam shaft inlet and outlet at 1 and 3 stroke position
It means that the inlet valve stuck in the position
―closed‖ or almost ―closed‖, which didn’t let the
engine to operate normally. To fix that problem, the
valve steam was liberally lubricated and forced to
move up and down. On the way up it moved with a
very high resistance and brought some metal
deposits on the valve stem neck, see figure 25.
The fact of metal particles occurred on the stem could indicate that the
stem, made from stronger material, scratched the inner part of the stem
corridor. One of the reasons of such happening could be that the stem was
slightly bended. The other reason that could happen is that the inner parts
of the engine shifted from the original positions because of the not initial
intended usage of the engine.
Figure 25. Deposits, founded on the
valve stem neck
38
Figure 26. Cam shaft system schematic of IC Engine
II.8. Results
The experiment performing combustion of Methane with addition of syngas
was held on the same set up as Marcella Lusardi. Ms. Lusardi is a MS of
Columbia University who performed an experiment on the same equipment.
See more of here results in her Master Theses [10].
Tests 1 to 3 were made at the same conditions to get the most accuracy
from averaged values. The results were compared with a baseline which is
Emissions of Methane combustion performed by Ms. Lusardi. The
conditions are: 400W load, 0% syngas. See results in Figure 27.
The main y- axis represents Carbon Monoxide and Hydrocarbons
emissions in PPM, and Carbon Dioxide emissions in percentage of
outgoing flow.

39
Figure 27. Methane Combustion Emission test results. 0.4kWreference
According to the data from the Enerac 700, Carbon Dioxide readings were
slightly fluctuating from 4 to 6%. Carbon Monoxide data fluctuated from 40
to 80 ppm, which exceeds the baseline by 3 times. Hydrocarbons readings
showed a significant change between the tests, varying from 20 up to 120
ppm. Concentration of the Hydrocarbons and Carbon Monoxide in the
exhaust gas characterizes the completeness of combustion process in the
cylinder of an internal combustion engine and it is also an indicator of the
engine workflow. Complete combustion results in the production of Carbon
Dioxide and water. The incomplete combustion results in the Carbon
Monoxide formation and soot (carbon).
Complete combustion:
CH4 + 2O2---->CO2 + 2H2O
Incomplete combustion:
CH4+O2---->C+CO+ CnH2n+H2O+CH4 +..
When unburned fuel is emitted from the engine, the emission could cause
by fuel which didn’t reach the flame zones or the methane could reach the
flame zone but the residence time was too short. In addition, partial
combustion of methane will also show UHC formation. Some regions of the
combustion chamber may have a weaker flame. Fuel-air mixture may have

40
either fuel-lean or fuel-rich conditions and consequently have a lower
combustion temperature.
Methane combustion emissions results of test #1 (see figure 27),
performed at the 0.4kW load, are showing that the combustion was more
incomplete than other tests, held at the same conditions.
Further experiment was done with addition of Carbon Dioxide to make
simulated landfill gas.
The next set of tests was held at the following conditions: 400W load, 0%
syngas, landfill gas combustion. The fact that simulated landfill gas consist
50% from Carbon Dioxide, make it expect to see more Carbon Dioxide in
the emissions. Based on the stoichiometric reaction, twice more Carbon
Dioxide should be emitted:
CH4 + 2O2---->CO2 + 2H2O
CH4 + O2 + CO2---->2CO2 + 2H2O
The averaged results from the experimental landfill gas combustion shows
that Carbon Dioxide emissions increased slightly less than twice (see figure
28), from 4.1 to 7.2 %. It is less than expected from stoichiometry equation.
However, stoichiometric reaction assumes complete combustion and in
case of those sets of experiment we are dealing with not complete
combustion. Because of that, some Carbon turned into Carbon Monoxide
and Unburned Hydrocarbons and we see much more of them in the Landfill
gas combustion emissions comparing to Methane combustion emissions.

41
Figure 28. Comparison of Methane and Landfill gas combustion emissions
Observed increase of Carbon Monoxide was significant. Three times more
Caron Monoxide were emitted from Landfill gas comparing to Methane.
Concentration of Unburned hydrocarbons increased by 29 % from 50 to 65
PPM.
Those results falls into the trend of previous research made on various
mixtures of methane and Carbon Dioxide in IC engines. Canadian research
of Prof Wong [17] conducted in 1977 examined potential of sewer gas
combustion. Fuel mixtures containing up to 40% of C02 were investigated.
It was found that when the fraction of Carbon Dioxide increased, unburned
hydrocarbons and monoxide emissions were increased. Lowering the fuel
quality tended to reduce Nitric Oxide emissions.
Assessment of simulated biogas as a fuel for the spark ignition engine by
Huang and Crookes [16] from 1998 presents the same result for Nitric
Oxide, saying that the main influence of Carbon Dioxide in the biogas fuel
on engine operation was to lower the NOx emissions. That research shows
that the CO emissions went up rapidly when the CO2 fraction was
increased above 30%. That can be causes by incomplete combustion. CO

42
emissions increased from 1.5% to 2.5%, almost 2 times, which is in line
with current research - 3 times . When CO2 was less than 30%, the CO
emissions were low and did not change with the CO2. THC emissions
increased from 500 to 680 PPM by 36 % while current research observe
increase by 28% . NOx emissions decreased by 17% with higher fraction of
Carbon Dioxide while current research shows 52% reductions.
In general , the trend that higher carbon dioxide fraction in a fuel leaded
higher concentration of unburned methane, thus CO and THC and reduces
NOx due to lower flame temperature , falls in the line with previous
research. More significant changes in increased emissions and NOx
reduction could occur because of higher concentration of CO2 in current
research which was 50% while referenced research went only up to 40%.
Effect of Carbon Dioxide on the performance of biogas/diesel duel-fuel
engine by Prof Bari [18] keeps the same trend of CO UHC and NOX
emissions, pointing out that gas containing more than 40% carbon dioxide
needs scrubbing, because it is found in this research that the engine ran
harshly with biogas containing high carbon dioxide (>40%).
During the experiment, gas addition was made on the constant enthalpy
base, which means that Carbon Dioxide did not replace part of the
Methane in the mixture but was added at the same flow rate as methane.
Despite of the fact that enthalpy of the fuel mixture stayed constant, Carbon
Dioxide works as a diluent. It lowers the heating value of the mixture while
doesn't react. That combustion stimulates the instability of the combustion
process which leads to increasing emissions from the exhaust.
Syngas addition test was successfully done only ones, thus the data in Fig
29 is not an average through series of test but the results of that one test

43
and is not fully reliable. However, that test shows interesting result of
significant emission reduction comparing to Landfill gas combustion.
Figure 29. Comparison of Methane, Landfill gas and Syngas combustion emissions
Amount of hydrocarbons decreased by 33 %, Carbon Monoxide emitted 4
times less than from Landfill gas combustion, Oxides of Nitrogen slightly
decreased by 4%. Syngas addition leads to better combustion. NOx was
reduced with Syngas addition because it allows lean burn combustion to
more cool combustion.
Performance of an Internal Combustion Engine Operating on Landfill Gas
and the Effect of Syngas Addition by McKenzie [6] shows the same rate of
CO reduction- from 802 to 214 PPM. However, emission reduction of UHC
and NOx were achieved in much greater values than in current research:
89% reduction of UHC and 38% for NOx. In general, all emissions were
decreased in both cases which prove that addition of syngas allows
performing more stable combustion of fuel at lower temperatures.
Another parameter commonly used to evaluate the emissions based on
fuel composition and load is a brake specific emissions. Brake specific fuel
consumption (BSFC) is defined as the amount of fuel consumed for each
unit of brake power per hour. It indicates the efficiency with which the

44
engine develops the power from fuel. Different BS characteristics can be
used to compare performance of different engines in terms of efficiency or
emissions.
BSNOX = Brake specific oxides of nitrogen emissions.
The ratio of the rate at which oxides of nitrogen leave the engine exhaust
manifold to the brake horsepower. To compare tests results with EURO V1,
NOx emissions for heavy duty vehicles have a limit set at 2g/kWh. (see
table 4) It never reached that amount during the tests.
Figure 30. Brake specific values for oxides of nitrogen and carbon monoxide
BSCO = Brake specific carbon monoxide emissions.
The ratio of the rate at which carbon monoxide leaves the engine exhaust
manifold to the brake horsepower. EURO V CO emissions for heavy duty
vehicles have a limit set at 1.5g/kWh (see table4). None of the tests were
able to meet that limit.
1 European emission standards define the acceptable limits for exhaust emissions of new vehicles sold
in EU member states. The emission standards are defined in a series of European Union directives staging the progressive introduction of increasingly stringent standards. Currently, emissions of nitrogen oxides (NOx), total hydrocarbon (THC), non-methane hydrocarbons (NMHC), carbon monoxide (CO) and particulate matter (PM) are regulated for most vehicle types, including cars, lorries, trains, tractors and similar machinery, barges, but excluding seagoing ships and aeroplanes. For each vehicle type, different standards apply. (Wikipedia)

45
BSHC = Brake specific hydrocarbon emissions.
The ratio of the rate at which hydrocarbons leave the engine exhaust
manifold to the brake horsepower. EURO V HC emissions for heavy duty
vehicles have a limit set at 0.46g/kWh. Only 2 test met the European limit,
one of which is a baseline test.
Figure 31. Brake specific values of hydrocarbon emissions
Test #2 shows poor results in both BS Carbon Monoxide and BS
Hydrocarbon emissions, because incomplete combustion reaction took
place during that test.
Table 4. Euro norm emissions
Standard Date CO (g/kWh) NOx (g/kWh) HC (g/kWh) PM (g/kWh)
Euro I 1992–1995 4.9 9.0 1.23 0.40
Euro II 1995–1999 4.0 7.0 1.1 0.15
Euro III 1999–2005 2.1 5.0 0.66 0.1
Euro IV 2005–2008 1.5 3.5 0.46 0.02
Euro V 2008–2012 1.5 2.0 0.46 0.02

46
II. 9 Conclusions and Further work
This work has shown that presence of Carbon Dioxide in the fuel mixture,
so-called simulated landfill gas, deteriorated the engine performance and
produced more pollutants in emissions than pure methane. At the same
load conditions, engine efficiency was decreased by mixing with Carbon
Dioxide. Syngas addition was proved by Jechan Lee in his Master Thesis
[11] to be the most effective gas to reduce pollutant emissions out of
Hydrogen and Carbon Monoxide .
Because of high laminar flame speed and low ignition energy of Hydrogen
and fast burning rate of Carbon Monoxide, the addition of syngas to Landfill
gas changes characteristics of combustion process, which results to
increasing reactivity of the fuel mixture.
During this research the author could not implement all series of test. To
make stronger arguments in favor of Syngas addition, further experiments
are needed.
It is suggested to continue testing 5 and 10 and 15% of syngas additions at
different loads to get a complete picture of the effect on emission and
engine efficiency. It is important to vary the H2 and CO ratio in the syngas,
ideally landing on an optimal composition that can be produced by
autothermal reforming. Due to diverse CH4/CO2 ratios on different landfills it
is critical to conduct the same tests with reduced amount of CH4 to
determine maximum feasible CO2 concentration in landfill gas.

47
REFERENCES 1. (#Waste Atlas report 2013))
http://www.atlas.d-waste.com/ tab: Global Waste Clock 2. EPA’s Landfill Methane Outreach Program
(http://www.epa.gov/lmop/documents/pdfs/overview.pdf) 3. Overview of Greenhouse Gases
http://epa.gov/climatechange/ghgemissions/gases/ch4.html 4. The State of Garbage in America, BioCycle. 2008 5. EPA Municipal Solid Waste Generation, Recycling, and Disposal in the United States:
Facts and Figures for 2012 6. McKenzie P.,Kohn, M. P.; Lee, J.; Basinger, M. L.; Castaldi, M. J., Performance of an
Internal Combustion Engine Operating on Landfill Gas and the Effect of Syngas Addition, Ind. Eng.
7. Chem. Res., 2011, 50 (6), pp. 3570-3579 Inventory of U.S. Greenhouse Gas Emissions and Sinks: 1990 – 2011 APRIL 12, 2013, U.S. Environmental Protection Agency
8. Stephen Turns, An Introduction to Combustion: Concepts and Applications, 2nd edition, McGraw-Hill; 2000
9. Lee, Jechan. Master Thesis A Study on Performance and Emissions of a 4-stroke IC Engine Operating on Landfill Gas with the Addition of H2, CO and Syngas 10. Lusardi, Marcella. Master Thesis Combustion of Syngas Generated from MSW
Gasification 11. Bove, R.; Lunghi, P., Electric Power Generation from Landfill Gas using Traditional and
Innovative Technologies, Energy Conversion and Management, 47 (2006), pp. 1391-1401
12. EPA, Landfill Methane Outreach Program, 2010 13. Heyhood, J.B., Internal combustion engine fundamentals, New York: McGraw-Hill; 1988 14. Barlaz A. Morton and Florentino dela Cruz, Landfill Gas Modelling: Estimation of
Landfill Gas Decay Rate Constants and Yields for Individual Waste Components, North Carolina State University, 2010
15. EPA, LFG Energy Project Development Handbook ,Chapter 2 page 2. http://www.epa.gov/lmop/documents/pdfs/pdh_chapter2.pdf
16. Jingdang Huanga, R.J Crookesb, Assessment of simulated biogas as a fuel for the spark ignition engine Fuel, Volume 77, Issue 15, December 1998, Pages 1793-1801, 1998
17. Wong, J., "Study of Mixtures of Methane and Carbon Dioxide as Fuels in a Single Cylinder Engine (CLR)," SAE Technical Paper 770796, 1977
18. Effect of carbon dioxide on the performance of biogas/diesel duel-fuel engine, Renewable Energy Volume 9, Issues 1–4, September–December 1996, Pages 1007–1010.
19. Inventory of U.S. Greenhouse Gas Emissions and Sinks: 1990–2012. EPA full report,April 2014
20. Themelis Nickolas, Ulloa Priscilla. Methane generation from landfills. Renewable Energy 32(2007) 1243-1257.
21. Environmental statistics and accounts in Europe. Eurostat. Statistical books. 2010 edition.
22. Ministry of Natural Resources and Ecology of the Russian Federation http://www.mnr.gov.ru/news/detail.php?ID=130242
23. The World Factbook. Russia https://www.cia.gov/library/publications/the-world-factbook/geos/rs.html
24. Landfills in Russia: Precarious Grounds for Waste Management Opportunities. Published: 22Nov 2010. http://www.frost.com/prod/servlet/market-insight-print.pag?docid=216893446
25. EcoTechProm http://www.eco-pro.ru/tarify-na-uslugi
26. State report "On the state and Environmental Protection of the Russian Federation in 2011" http://www.mnr.gov.ru/regulatory/detail.php?ID=130175
27. Demography: Russian Federal State Statistics Service. ―Number and composition of the population‖

48
http://www.gks.ru/wps/wcm/connect/rosstat_main/rosstat/ru/statistics/population/demography/#
28. ―Ecological condition of landfills and waste dumps Moscow region, assessing their impact on the environment‖ http://www.solidwaste.ru/i/jurnaldocs/66/1-4.pdf

49
Appendix A: Table 5. List of Eqiupment
Engine Honda GC 160E-QHA
Generator PRAMAC EG2800
Emission analyzer ENERAC 700
Power meter Wattsup Pro meter/ multimeter
Rotameters (4) OMEGA FL1300/1400
Air Flow meter OMEGA FMA 1700/1800
Methane cylinder T.W. Smith Corp, ultra high purity 99,999%
Carbon Dioxide cylinder T.W. Smith Corp, UHP
Hydrogen cylinder T.W. Smith Corp, UHP
Carbon Monoxide Cylinder T.W. Smith Corp,UHP
Surge tank
pressure gauges (7)
check valves (2) Air and fuel lines before surge tank
needle valves (2) Extra air and air flow meter
Quarter turn valves (5) To each gases and final mixture
On off valves (2) For emergency exhaust
Fittings
Stand To hold emission analyzer probe
tubing 1/4 inch
tubing 3/4 inch

50
Appendix B Table 6. TRR issues and solutions outline
ISSUE SOLUTION TO BE IMPLEMENTED
COMPLETED
Kink in the tubing from the CO2 cylinder
Insert a length of ss tubing connecting to cylinder so that plastic tubing will be less likely to kink
done
What is the delivery pressure of house air?
Put a pressure gauge between house air and mass flow meter
complete
What is the pressure rating of the check valves?
Look up specifications on Swagelock
The check valves have a cracking pressure of 1 psi and a room temp pressure rating of 2200 psig
There is small leak by pressure gauge downstream of mass flow meter
It is tightened as much as possible so Teflon tape is needed
Yes, no longer leaking
What can be max pressure in the fuel line
Find pressure ratings of all tubing used
From McMaster: PTFE semi-clear white 3/8‖ w/1/16‖wall—150psi; 1/4‖ w/1/32’wall—130psi. However, fuel line is clear(er) and it is not certain it has same rating as semi-clear. (no clear tubing on mcmaster)
Possible leaks from unused fuel inlet ports
Cap them Yes
Plastic tubing on pressure gauge downstream of fuels
Replace with ss tubing and ensure that gauge is visible during operation
done
In case of emergency shut-off, there needs to be a way to depressurize both the fuel line and the surge tank
Add another vent valve between the on/off and the surge tank. When in off position, each section can be depressurized separately
Yes
How will we take enerac measurements? Avoid reaching across hot engine
Use a stand and clamp to hold the enerac probe while engine is in operation
ok
Live connections on the load board
Cover with electrical tape. Also, need to have a better understanding of how to take power measurement
Put generous amount of electric tape

51
Positioning of load board—not ideal
Would ideally like to hang on wall, but not really possible with current configuration. Just make sure it is accessible, but not in the way. May need an extension cord
Will stand to the left of the fume hood
Gas detectors—currently have in the lab for CO and CH44, but will later use H2 and will need one for that
Research gas detectors. Ordered multiple gas detector (H2, CO, CH4) June 30
Appendix C
Within the scope of the research, the group visit to the Fresh Kills landfill
was conducted. The landfill was opened in 1947 as a temporary landfill, but
eventually became New York City's principal landfill and was once the
largest landfill, as well as human-made structure, in the world. The landfill
was closed in 2009 for redevelopment.

52
Appendix D. Review of waste management in Russia and in Moscow
Research sponsored by Global WTERT Council and National Science Foundation
Introduction, Russia
Russia is geographically the largest country in the world and also a major
pollutant. Russia wants to be considered as part of Europe and to be integrated
in world events, such as international expositions, the Olympic Games, etc.
Sustainable development is one of the most discussed topics for the last 30
years, but there is no national directive as to how to manage the generated
municipal solid wastes (MSW) in the country.
The potential for applying better waste management systems in Russia is
huge. As part of Soviet heritage, Russia has a strong industrial base and a fairly
good academic system but, in contrast to northern Europe, still landfills most of
its waste and substantial improvements could be made in the capital region and
other big cities of this country.
MSW generation in Russia
The latest governmental report [22] states that in 2011 52.3 million metric
tonnes of Municipal Solid Wastes (MSW) were generated in Russia. The current
disposition pf MSW is shown in Figure 1 that shows 4% recycled, 1% combusted
in waste-to-energy (WTE) plants and 96% landfilled.
Figure 32. Disposition of MSW in Russia, 2011

53
The 2011 population of Russia was 143 million [27]; therefore, the per
capita generation was 0.37 tonnes. This rate is in the range of countries such as
Turkey, Serbia, and others (Figure 33).
Figure 33. Per capita generation and disposition of MSW in Europe (nations are sorted from lowest to highest percent of MSW landfilled). Source: Eurostat, 2012
Waste management in Moscow
According to the 2010 data [26], the capital has a population of 11.6 million
and generated 5.9 million tonnes of municipal solid waste, corresponding to 518
kg of MSW per capita. Collection of MSW in Moscow is managed by the
Governmental Unitary Enterprise ―EkoTechProm‖. Of this amount, an estimated
530,000 tonnes (9.6%) were recycled, 765,000 tonnes (13.9%) combusted with
energy recovery, and 4.2 million tonnes (76.4%) were landfilled (Figure 34).
Figure 34. Disposition of MSW in Moscow

54
Recycling in Moscow
The official city report [26] states that 9.7% of the city’s MSW was recycled.
Recycling is mainly concentrated on packaging materials. High rates,
comparable to European rates, are achieved with some types of wastes such as
paper, cardboard and glass. The recycling rate of some packaging materials is
up to 30%, which is close to the Packaging Waste Directive of the European
Union (94/62/UN)[3]. However, the rate of recycling is lower than the Directive,
when one considers each type of packaging materials separately.
There are a few private composting facilities in the Moscow area but the
contribution of composting is negligible in terms of the total amount of generated
wastes.
Waste-to-energy (WTE)
There are three waste-to-energy (WTE) plants in
Moscow, out of a total of seven in Russia. The locations of
these facilities are shown in Figure 35. Two of these plants
are operated by the governmental company ―EcoTechProm‖
and have a capacity of 130,000 and 275,000 metric tons per
year, respectively. The third one is operated by the Austrian
company EVN-Group and has a capacity of 360,000 tons per
year. In total, the three WTE plants process 765,000 metric
tons of MSW, i.e., 13.9 % of the total generation [25]. Figure
36 shows the tonnage processed in the three WTE plants of
Moscow in the period from 2004.
Figure 36. MSW combusted in Moscow WTE plants
Figure 35. Location of WTE plants in Moscow

55
Waste to energy in Russia started during the Soviet Union period in 1975,
when the first plant for thermal treatment of municipal solid wastes opened with
two lines of 72,000 tonnes capacity each. Electrostatic precipitators were used in
the Air Pollution Control system of the plant. As part of the Moscow sanitation
program of 1992, it was decided to retrofit this plant. It was opened again in 1995
with an additional line and significant gas cleaning improvements.
The EVN Group is an Austrian-based producer and transmitter of electricity.
It is one of the largest in Europe with over three million customers in 14 countries.
The company also operates in wastewater treatment, natural gas supply and
waste management business facilities. It is the second-largest utility in Austria. In
Moscow, the EVN Group operates WTE plant #3 of which it owns 70%; the other
30% belongs to EcoTechProm.
There is another WTE pant in Moscow which is based on fluidized bed
technology. However, the plant did not allow the author to visit and does not post
any data online. However, it is known that in addition to municipal waste
combustion the plant recycles PET-bottles. Processing is located in the main
building of the plant. The mode of operation is 12 hours a day and the annual
capacity is 8000 tons.. Feedstock - selected from municipal solid waste (MSW)
PET bottles. The recycled product is PET flakes (chips) with a size of 10-20 mm,
while ensuring the impurities to be less than 0.012% and humidity 0.5% [25].
Table 7 summarizes the known data for the all three WTE plants of
Moscow.
Table 7. Comparison of WTE plants in Moscow
WTE Plant#2 WTE Plant#3 WTE Plant#4
Location Otradnoe
Birulevo Rudnevo
Company EcoTechProm EVN EcoTechProm
1975 as a 1st
Russian WTE
plant.
Retrofitted in
1995
2007 2003
Capacity
tons/year
130,000 360,000 275,000

56
Lines 3 2 3
Boiler technology Moving
grate
Moving grate fluidized bed
Fuel heat output 92 MW Before burning,
waste is sorted
and separated
recyclables and
non-combustible
materials,
including paper,
cardboard,
plastic, glass,
ferrous and non-
ferrous metal,
large fraction of
waste is crushed.
PET packaging
capacity of 8000
tons per year
Av Calorific value,
MJ/kg
7.9 7.5
Flue gas cleaning
technology
Activated carbon,
lime milk, 726
baghouses
Spray absorber
Fabric filter
DeNOx plant
Heat generation for internal needs 370 000Gcal/year
Electricity
generation,
MWhr/year
19 470
50% for the
internal needs
38 000
Price for 1 tone, $ 79 55 78
Source: interview and visit by author of plants #2 and #3.
Landfilling
It is reported [22] that 2.3 million metric tons of MSW were disposed at
sanitary landfills in the Moscow Oblast, which corresponds to 41.8% of the total
MSW generated. The rest 34% of the total wastes were dumped, see Figure 37.
Moscow Oblast is the second most populous federal region of Russia, located
around the borders of Moscow City. According to Federal regulations, landfilling
within Moscow City is prohibited and all city waste goes to the Moscow Oblast
landfill. The Ministry of Natural Resources and Ecology reported [22] that another
1.4 million tonnes were handled by private companies under direct contracts with
other landfills and waste dumpsites in the Moscow Oblast; 0.5 million tonnes
were disposed at non–regulated landfills and dumps in the Moscow Oblast under
direct contracts with housing and communal services. As noted earlier, in total
76.4 % of the Moscow MSW is disposed in all types of landfills.
One of the reasons why the majority of wastes are going to landfills is the
cost of disposal. In comparison to the gate fees at the WTE plants (Table 7), the
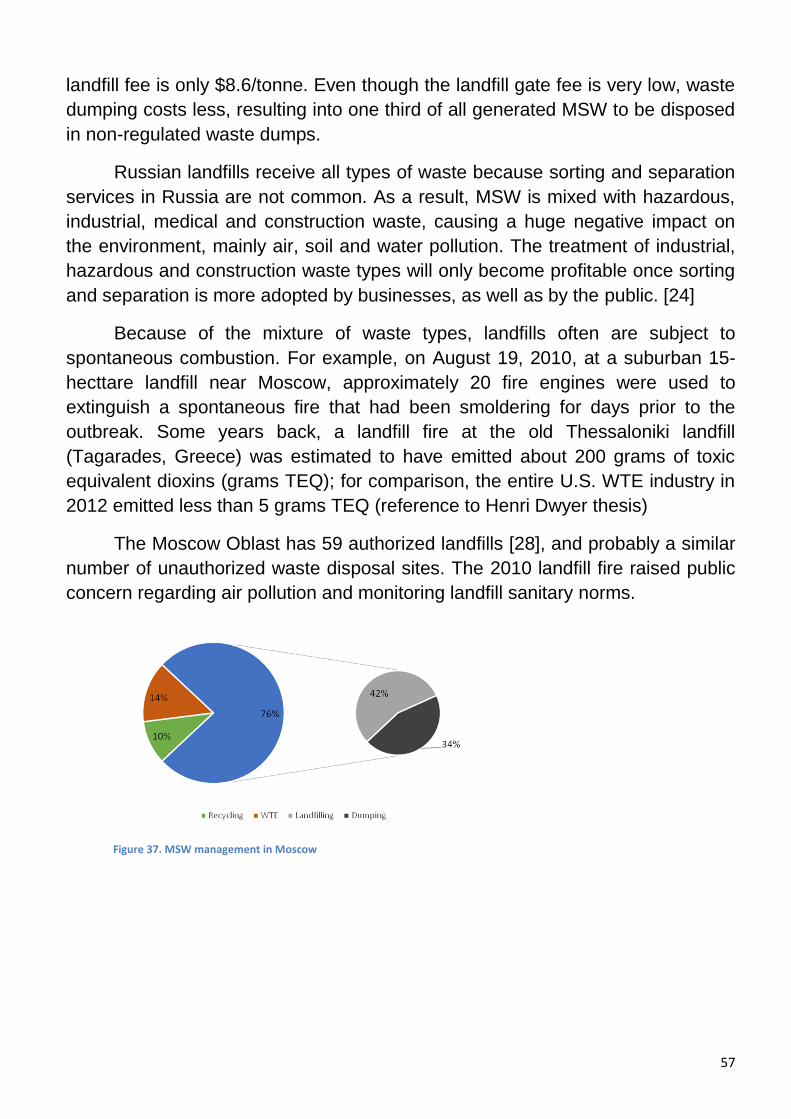
57
landfill fee is only $8.6/tonne. Even though the landfill gate fee is very low, waste
dumping costs less, resulting into one third of all generated MSW to be disposed
in non-regulated waste dumps.
Russian landfills receive all types of waste because sorting and separation
services in Russia are not common. As a result, MSW is mixed with hazardous,
industrial, medical and construction waste, causing a huge negative impact on
the environment, mainly air, soil and water pollution. The treatment of industrial,
hazardous and construction waste types will only become profitable once sorting
and separation is more adopted by businesses, as well as by the public. [24]
Because of the mixture of waste types, landfills often are subject to
spontaneous combustion. For example, on August 19, 2010, at a suburban 15-
hecttare landfill near Moscow, approximately 20 fire engines were used to
extinguish a spontaneous fire that had been smoldering for days prior to the
outbreak. Some years back, a landfill fire at the old Thessaloniki landfill
(Tagarades, Greece) was estimated to have emitted about 200 grams of toxic
equivalent dioxins (grams TEQ); for comparison, the entire U.S. WTE industry in
2012 emitted less than 5 grams TEQ (reference to Henri Dwyer thesis)
The Moscow Oblast has 59 authorized landfills [28], and probably a similar
number of unauthorized waste disposal sites. The 2010 landfill fire raised public
concern regarding air pollution and monitoring landfill sanitary norms.
Figure 37. MSW management in Moscow

58
MSW generation in the Russian ―megacities‖
―Megacities‖, according to the Russian Federation, are cities where the
population within the city borders is more than 1 million. Figure 38 shows
the population and MSW generation of 10 Russian ―megacities‖.
Figure 38. Russian Megacities MSW generation. Research by the author for D-waste Atlas (http://www.atlas.d-waste.com/ 2014 report)
The composition of MSW of the Russian cities is not the same, as shown in
Figure 39. However, it is possible to see some trends: Organic waste is the
major component in all cities, except Kazan. Second place is held by paper
and cardboard. The composition of plastics is always 10% of total and
metal is usually less than 5% out of total.

59
Figure 39. MSW composition of ten Russian Megacities
Discussion
Russia has undergone significant changes since the collapse of the Soviet
Union, moving from a globally-isolated, centrally-planned economy towards a
more market-based and globally-integrated economy, but stalling as a partially
reformed, statist economy with a high concentration of wealth in officials' hands.
Economic reforms in the 1990s privatized most industry, with notable exceptions
in the energy and defense-related sectors [23]. Waste treatment companies
remind to be monopoly and owned by government. As for today, Russia is 7th
economy in the world [23], however, the infrastructural lag, across all industries
and sectors, is an intense problem for the federal government and society. The
waste management sector is in dire need of restructuring and opening up to
market forces.
Municipal solid waste management system is one of the key components
of a country’s overall environmental and resource efficiency framework.
Inefficient MSW management in Russia today is causing negative environmental
impact and results in suboptimal use of raw materials and energy.
However, there are a lot of opportunities for waste management
development in the country. Incorporation of Russia into the European society
and in international organizations can lead to increasing demand of sustainable
solutions for Waste Management.
For densely populated megapolis as Moscow, recycling and waste to
energy are absolutely essential for sustainable development, conserving land by
avoiding landfilling, providing electricity and heat, and reducing greenhouse gas
emissions.