land-use change modeling in a brazilian indigenous reserve: construction of a reference scenario for...
TRANSCRIPT

Land-use ChangeModeling in a Brazilian Indigenous Reserve:Construction of a Reference Scenario for the SuruíREDD Project
Claudia Suzanne Marie Nathalie Vitel & Gabriel Cardoso Carrero &
Mariano Colini Cenamo & Maya Leroy & Paulo Mauricio Lima A. Graça &
Philip Martin Fearnside
Published online: 28 September 2013# Springer Science+Business Media New York 2013
Abstract Interactions of indigenous peoples with the sur-rounding non-indigenous society are often the main sourcesof social and environmental changes in indigenous lands. Inthe case of the Suruí in Brazilian Amazonia’s “arc of defores-tation,” these influences are leading to deforestation and log-ging that threaten both the forest and the sustainability of thegroup’s productive systems. The Suruí tribal leadership hasinitiated a proposal for an economic alternative based onReducing Emissions from Deforestation and Degradation(REDD). This has become a key case in global discussionson indigenous participation in REDD. The realism of thebaseline scenario that serves as a reference for determiningthe amount of deforestation and emissions avoided by theproposed project is critical to assuring the reality of the carbonbenefits claimed. Here we examine the SIMSURUI model, itsinput parameters and the implications of the Suruí Forest
Carbon Project for indigenous participation in climate mitiga-tion efforts.
Keywords Amazon . Deforestation . Baseline . REDD .
Carbon . Global warming . Climate change . Tropical forest .
Rainforest
Introduction
Potential of the REDD Mechanism in Amazonian ProtectedAreas
In the Brazilian Amazon, the protected areas that are mostsusceptible to deforestation are generally those that are cur-rently surrounded by cleared areas and are located in the Arcof deforestation. These protected areas have substantial po-tential for REDD (Reducing Emissions from Deforestationand Degradation). The purpose of the REDD mechanism isto finance conservation through carbon payments based on adefined future time period. REDD is usually conceived aspaying for the greenhouse gases that would have been emittedwith no REDD implantation based on a land-use and land-cover change (LULCC) baseline (flow method). An alterna-tive is to pay for carbon storage (stock method), this methodbeing appropriate in forested areas that store a considerableamount of carbon but are distant from deforestation threats(Cattaneo 2010; Fearnside 2012a, b). Forest sites that havelarge carbon stocks and are at risk of deforestation (because ofexternal or internal causes), as is the case for the 24 indigenouslands in Rondônia in the western portion of the LegalAmazon, represent good candidates for REDD projects basedon the flow method.
Electronic supplementary material The online version of this article(doi:10.1007/s10745-013-9613-9) contains supplementary material,which is available to authorized users.
C. S. M. N. Vitel : P. M. L. A. Graça : P. M. Fearnside (*)National Institute for Research in Amazonia (INPA), Av. AndréAraújo, 2936, 69060-000 Manaus, Amazonas, Brazile-mail: [email protected]
C. S. M. N. Vitele-mail: [email protected]
G. C. Carrero :M. C. CenamoInstitute for the Conservation and Sustainable Development ofAmazonas (IDESAM), Manaus, Amazonas, Brazil
C. S. M. N. Vitel :M. LeroyEnvironmental Management of Tropical Forest Ecosystems,AgroParisTech, Montpellier, France
Hum Ecol (2013) 41:807–826DOI 10.1007/s10745-013-9613-9

In addition to the establishment of a LULCC baseline,proponents such as non-governmental organizations (NGOs),regions or states (depending on the scale of implementation ofthe mechanism), have to deal with other thorny methodologicalpoints in order to implant REDD and insure a future climaticbenefit. These include the “leakage” that corresponds to defor-estation escaping as a result of project implementation, includ-ing both “in-to-out” and “out-to-out” leakage and “perma-nence” of climate benefits that insures that mitigation will beeffective over time (Fearnside 2009; Yanai et al. 2012).
The Case of the Sete de Setembro Indigenous Land: The SuruíREDD + Pilot Project
The Sete de Setembro Indigenous Land (SSIL) [TerraIndígena Sete de Setembro ], which is the focus of the presentstudy, is the first indigenous site in Brazil to develop a REDDproject. The 250,000-ha pilot site is located in a consolidatedportion of the “arc of deforestation” (the crescent-shaped stripalong the southern and eastern edges of Amazon forest whereforest clearing has been concentrated). The SSIL has experi-enced recent deforestation inside its limits that could counter-balance the retention effect exercised since its official demar-cation in 1983, when Brazil’s military dictatorship (1964–1985) promoted the occupation of Rondônia. The Suruí in-digenous tribe was officially contacted in 1969, but they hadpreviously migrated from Cuiabá to Rondônia to escape per-secution (Mindlin 2003). In 1974, 5 years after contact, half ofthe group died, mostly from influenza and measles(Greenbaum 1989). Although the territory was initially de-marcated in 1976, successive invasions by colonists continuedto occur, and the invaders refused to leave the land (Mindlin2008). The successive interventions of public entities such asFUNAI (National Indian Foundation), INCRA (NationalInstitute of Colonization and Agrarian Reform) and theRondônia state government delayed ratification of the demar-cation decree until 1983. This delay was part of a broaderpattern during this period, where policies were almost entirelyconcentrated on economics and the stimulation of occupation(Pedlowski et al. 2005).
The development dynamics of the municipal seat ofCacoal, located 40 km from the SSIL, motivated many Suruíto leave the territory to live in the town. After 40 years ofcontact, although many Suruí are integrated into the localsociety (which is mainly composed of the descendants ofSoutheast Brazilian colonists), they still suffer severe discrim-ination based on their origin. Suruí are seen as privilegedpeople because of their rights guaranteed by the Brazilianconstitution, which recognizes the right of indigenous popu-lations to permanent possession and exclusive usufruct of theirland (Mindlin 2003). In the territory itself, logging activity hascontributed to shaping a new distribution of villages. Suruífamilies moved to strategic points near the edges of the
territory and created new villages as a way of preventing thetheft of timber and to protect their natural resources. In 1979,700 Suruí were living in six villages, whereas in 2009 therewere 1231 Suruí in 26 villages (Metareilá 2010).
The Suruí point to poor attention of the government re-garding indigenous people and their needs, particularly healthand inclusion in the local market, as leading to a situationwhere FUNAI agents encouraged indigenous leaders to selltimber to loggers illegally (Metareilá 2010). Income from thesales was used to pay for the new customs of the indigenouspeople, such as a new diet of manufactured products likesugar, in addition to use of health services. In 1992, theEcumenical Center of Documentation and Information(CEDI) calculated that almost US$2 million worth of timberhad been removed from the SSIL (Mindlin 2003). Forty yearsof logging have impoverished the stocks of commercial tim-ber species in the indigenous land and have led to progressivereduction of revenues from this activity. As an adaptive pro-cess in response to decreasing logging capacity, part of theSuruí population has converted forest areas to cattle pasturesand coffee plantations in order to compensate for economiclosses (Metareilá 2010).
Recent Modification of Suruí Land-Use Patterns: ForestDegradation and Deforestation
Coffee cultivation and cattle ranching are the main economicactivities in the Cacoal region (Brazil, IBGE 2011).Historically, Cacoal (the largest town near the SSIL) has beenone of the most important coffee production areas in the state.Livestock has increasingly predominated over coffee growingfor several reasons. One is the shrinking labor force in theregion, which affects coffee production more than cattle.Another is the stimulation of cattle ranching as a result of thestrategic geographical position of Cacoal (located on the BR-364 Highway), coupled with financial incentives to attractenterprises such as tanneries, dairies and slaughter houses(Kemper 2006). The Suruí were originally hunters, fishers,and subsistence cultivators; they have now learned to adapt tothe commercial norms of the majority society. They began topractice coffee cultivation in the 1980s when they legallyobtained coffee plantations from the colonists who had invadedthe southern part of the territory. Today, coffee is an importantsource of revenue in the Suruí economy (Metareilá 2010).Coffee is a perennial crop that follows an initial 3 years underannual crops such as maize and beans. Cattle ranching is alsoimportant, even though only a few families own pasture. Since2000 the Suruí have been reinvesting revenues from illegallogging in their own productive systems (cattle ranching andcoffee production). As an aggravating factor, almost no forestsremain in the properties that surround the reserve; the tradition-al low-cost implementation of pastures motivates ranchersand farmers to exert external pressure to establish pastures
808 Hum Ecol (2013) 41:807–826

and agricultural plantations in the reserve. As a result ofinterdependence, some Suruí have recently illegally leased landto these actors and established sharecropping agreements as anadditional economic alternative to the decreasing revenuesfrom logging. Since no direct invasions have been observed,this can be considered as an indirect deforestation process,where the Suruí agent decides on the fate of the land. Theseagreements are threatening the environmental integrity of theterritory. The law states:
“Estatuto do Índio, Lei 6001, Art. 18 – As TerrasIndígenas não poderão ser objeto de arrendamento oude qualquer ato ou negócio jurídico que restrinja o plenoexercício da posse direta pela comunidade indígena oupelos silvícolas”[Statute of the Indian, Law 6001, Art. 18 – The indige-nous lands cannot be leased or be the object of any act orlegal business arrangement that restricts the full exerciseof direct possession by the indigenous people]
Confronted with this situation of increasing forest conver-sion, the Metareilá association (formed in 1989 to defend theSSIL and the Suruí people against outside threats and topromote the welfare of the Suruí), mobilized several socio-environmental NGOs in 2009 to develop a conservation pro-ject: the Suruí Forest Carbon Project (SFCP). The SFCPincludes a fund that integrates different types of conservationfinance, including carbon incentives under the REDD volun-tary carbon market mechanism. The objective is to developeconomic activities that are environmentally less impacting asalternatives to those that generate deforestation. The referencescenario of the SFCP was based on a 30-year LULCC projec-tion, developed from a 2-year study. A specific model wasdeveloped based on a preliminary analysis of deforestationdrivers by the Institute for the Conservation and SustainableDevelopment of Amazonas (IDESAM) that integrates infor-mation on local LULCC strategies generated using a partici-patory approach (IDESAM and Metareilá 2011). The presentstudy examines the utility of developing a LULCC model as aland-use projection tool and as a planning tool for REDDactivities.
Methods
Study Area: An Island of Forest in the Arc of Deforestation
The study area is the Sete de Setembro Indigenous Land(SSIL), which is located in the western Amazon region strad-dling the border between the states of Rondônia and MatoGrosso (Fig. 1). This region comprises the western flank of along corridor of indigenous lands surrounded by consolidatedagricultural areas. The area is located at the intersection of themunicipalities of Cacoal (which covers most of the SSIL) and
Espigão do Oeste in Rondônia and the municipality ofRondôlandia in Mato Grosso. The municipality of Cacoalhad 78,061 inhabitants in 2011 (Brazil, IBGE 2011). In the1970s, the Cacoal area had the fastest deforestation inRondônia (Fearnside 1986, 1989), and the intense exploitationof natural resources has now resulted in the loss of 65% of theforest cover in the municipality. Pasture and agriculture pre-dominate in the deforested areas (Brazil, INPE 2010).
The Suruí territory is located in both the Madeira andTapajós River Basins and has high biological diversity(IDESAM and Metareilá 2011). The SSIL has many attributesclassed as “high conservation value” and almost the entireterritory is rated as “extremely important” for biodiversityconservation (Brazil, MMA 2001). The SSIL is part of abroader ethno-environmental corridor that includes several in-digenous lands and conservation units. The predominant to-pography is gently undulating with a slope between 3 % and12%. The soil is predominantly red-yellow podzolic (Ultisol orAcrisol). A variety of human land uses are present in the SSIL,including pasture, agriculture and secondary vegetation in fal-low fields, in all representing 2,417 ha in 2009 or 1.4 % of theterritory. The average rate of deforestation between 2000 and2009, calculated based on the clearing of mature rainforestsexisting in 2000, was 0.07 % per year, or 157.4 ha/yr. Most ofthe uncleared area is tropical forest vegetation, specificallyopen sub-montane rain forest (IBGE code: Asp [Brazil, IBGE1992]), together with a lesser proportion of dense sub-montaneombrophilous forest (IBGE code: Sde); some small patches ofnon-forest natural vegetation (IBGE code: Sd) are alsoscattered around the territory. The ombrophilous forest areahas suffered most of the selective logging, reducing the originalstock of commercial tree species and the corresponding bio-mass. Logging tracks cross almost the entire area. A forestbiomass inventory was done throughout the SSIL, resulting inthe assumption that the entire area has reduced biomass(IDESAM and Metareilá 2011).
SIMSURUI: Combining Systems Dynamicswith a Participatory Approach
The LULCCmodel developed in this study, called SIMSURUI,is composed of two models. The first is a non-spatial systemsmodel that calculates annual land-use and land-cover changetransition rates and specifically the transition from forest todeforested land. The non-spatial model has been developed inVensim software (Ventana Systems, Inc.). The systems approachhas been chosen because of its capacity to integrate differenttypes of components and its ability to represent socio-ecologicalsystems in order to analyze management (Dougill et al. 2010;Sendzimir et al. 2011). The SIMSURUI model includes com-ponents that are specific to the Suruí socio-ecological system,including interactions among demography, economy and land-scape. Land use reflects the strategic development of productive
Hum Ecol (2013) 41:807–826 809

activities by different Suruí agent groups. Vegetation dynamicsare inferred from these interactions. The systems model wascoupled with a cellular automata model to spatially allocate themodeled deforestation rate. This spatial model uses theDINAMICA-EGO modeling platform (Rodrigues et al. 2007;Soares-Filho 2013), which allocates land-use and cover changetransition rates to a landscape composed of land-use/coverclasses over grid cells. We only present the non-spatial systemsmodel in this paper.
Steps in establishing the Suruí REDD reference scenariowere:
1) Analysis of the available data related to the Cacoal re-gion’s historical deforestation drivers and Suruí land-use
2) Characterization of historical and recent Suruí land-usedrivers, prospective identification of key future land-usedrivers with discussion of the construction of a SFCPcounterfactual scenario during a participative workshoporganized by the SFCP NGOs with eleven Suruí leadersin February 2010 in Porto Velho
3) Conceptual model construction and preliminary versionof a systems model with identification of feedback loops
4) Participative validation of the model structure, includinginteractions between key variables, quantification of pa-rameters and selection of the most probable scenarioduring a second workshop in Cacoal in August 2010
5) Statistical validation and6) Monte-Carlo sensitivity analysis
The SIMSURUI Vensim systems model is composed offive sub-models (Fig. 2):
1) Demography2) Groups of productive agents in the Suruí population3) Economic investment strategies of the groups of produc-
tive agents4) Subsistence farming5) Landscape dynamics of the Suruí territory
The historical reference period (2000–2009) was used asthe basis for projecting the most-probable future loss of forestcover over a period of 30 years (2009 and 2038). The subse-quent calculation of greenhouse-gas emissions was based onthis most-probable scenario, making it possible to generatefinancial carbon benefits to conserve the SSIL.
Themodel incorporated data derived from the literature, fromparticipatory workshops and from a parallel study that wasconducted to determine the vegetation cover of the SSIL in2009 and the evolution of LULCC in the SSIL during the2004–2009 historical period. Household economic data wereobtained from a census conducted by Metareilá in 2009. Thecensus visited all of the Suruí households that lived in or usedresources in the SSIL, of which 65 % had responses complete
Fig. 1 Map of the Sete de Setembro Indigenous Land (Terra Indígena Sete de Setembro) showing other indigenous lands, surrounding towns and thearea that had been deforested previous to 2009
810 Hum Ecol (2013) 41:807–826

enough to use in our study of approximately 90 % of the Suruíhouseholds (Table 1).
Additional economic and ecological data were obtainedfrom ground observations in 2009, combined with remote-sensing and GIS data and informal interviews applied to localentities. Some parameters were based on historical observa-tions and are considered to be fixed during the simulations,while others are expected to change according to the prospec-tive scenario selected (Table 2).
Simulation Assumptions
SSIL Landscape Composition
The composition of the initial landscape was estimated byclassifying a Landsat 5 ThematicMapper (TM) satellite imagefor 2009, the starting date of the project. Of the five initialland-use and cover classes that were obtained from the clas-sification, we ignored the hydrography and savanna classes toconsider only three classes for inferring land-use dynamics: 1)
ombrophilous forest, 2) cleared areas and 3) secondary vege-tation originating from pasture and agriculture. Two transi-tions were considered in the model: 1 to 2 and 3 to 2.
With the objective of validating the model, we compared themodeled and observed annual rates of LULCC for the historic2005–2009 period using data obtained from the Landsat land-usechange analysis. Landscape data for 2004, obtained by Landsatclassification, allowed a specific model to be built for calibration.
Sub-Models 1and 2: Suruí Population Dynamics
The population structure used in the model is based on the 2009population pyramid data that were derived from the householddata collection. To model the population structure, three agecategories were distinguished: 0–15 years, 15–65 years and >65 years, accounting annually for births, deaths and the evolutionbetween the age categories.
In the view of the leaders, and in accord with observedtrends between 2000 and 2009, births are decreasing due tohigher use of contraceptives and due to the higher cost of
Fig. 2 Dynamic systemsmodel of the Sete de Setembro Indigenous Land socio-ecological system. Sign next to each arrow (+ or -) indicates whether therelation is positive or negative as classed from interviews and/or available data analysis
Hum Ecol (2013) 41:807–826 811

education for children. The simulations integrate extrapolatedbirth and death rates for 30 years using linear trends fromhistorical population data. Based on information collected byFUNASA (National Foundation for Health) and Metareilásince contact in 1969, immigration rate was found to bepositive at 0.026 % per annum. The number of weddingsbetween non-indigenous women and indigenous men hasincreased over the past decades and now compensates forthe emigration of families to the nearby towns of Cacoal andEspigão do Oeste (Appendix 4).
The available labor force was derived from the proportion ofactive adults between 15 and 65 years old, excluding those whoare considered to be unavailable for productive activities be-cause they have permanent jobs either in nearby towns or in theSuruí territory. We subtracted the employment rate of 9.7 %(derived from the household survey) from the total active laborforce to estimate the labor available for land-use activities.
The population model was then transformed into house-hold units, considering households to be composed by 5.85persons. Households are divided into four different agentgroups that are distinguished by their productive activities inthe Suruí territory: “Without Productive Activities” (Group 0),“Coffee Growers” (Group 1), “Mixed-strategy: CoffeeGrowers and Ranchers” (Group 2), and “Ranchers” (Group3). In order to be more conservative and to limit uncertainty,the choice was made to maintain the 2009 observed distribu-tion of producer groups during the simulations, which allowsanalysis of how combinations of productive systems willinfluence the economy and the demand for forest clearing.
Sub-Model 3: Suruí LULCC Strategy
The socioeconomic behavior of the three productive-agentgroups is modeled based on the annual financial flow or “cashflow”, which is computed for average households and equalsthe difference between household income (i.e., timber, live-stock, agriculture, government assistance, employment
compensation, non-timber forest products and handicrafts)and annual fixed expenses (i.e., food, energy, transportation,health, clothing and leisure). When cash flow is positive, thefinancial surplus of the family budget is invested in productiveactivities, real estate and is spent on consumer goods (techno-logical accessories and vehicles). The income and expensevalues for each producer-agent group were based on the datacollected by Metareilá, but the annual revenues from produc-tive activities were based on a financial cost-benefit analysisproduced by IDESAM (IDESAM and Metareilá. 2011). Thisstudy found an average profitability of R$294.00 per hectare/year for Suruí coffee growing over a 15-year period andR$190.80 per hectare/year for Suruí cattle ranching based ona 20-ha area over an 11-year period, R$121.60 per hectare/year for coffee sharecropping and R$60.00 per hectare/yearfor leasing pastures to external agents. The exchange rate forthe Brazilian real (R$) at the time of interviews with Suruíleaders in 2009 was 1.78 R$/US$. Annual revenues obtainedfrom each activity account for the new productive areasopened during iterations of the model, in addition to the areasthat existed in 2009. After the permanence period (consideredto be 11 years for pasture and 15 years for coffee), abandon-ment and the associated regeneration of secondary vegetationdecreases the productive areas. For coffee production, a de-crease in productivity is assumed from the thirteenth year andfor pasture from the sixth year until midway through theeleventh year when it is abandoned. The gradual reductionof capacity is important to conservatively model profitability.Income from logging was considered to follow a downwardtrend, starting with the income obtained for timber sales in2009 from the household socioeconomic data collection.Based on field campaigns since 2009, an over-flight of thereserve and the inventory of forest biomass (both carried outby IDESAM), much of the Suruí territory has been selectivelylogged. The inventory results indicated that the remainingtrees of commercial value would be insufficient to sustain acontinuous logging operation for more than 10 years. Thus,the model assumes that income from timber decreases from2009 until 2018, when it becomes zero.
Each productive-agent group has a different annual house-hold cash flow, and each group has different investmentpatterns. All groups have the goal of maintaining an annualpositive balance of R$1500, which is considered to be theminimum desired household cash flow that would be used forproductive activities, consumer goods and real estate and (seeparameter values for investment ratios in Table 2). Theseinvestment parameters were defined during the participatoryworkshops. IDESAM applied questionnaires to eleven Suruíleaders who were present in the first participatory meeting.The questionnaire was intended to define the investmentproportions depending on the cash-flow value categories asconsidered in the model. However, because some Suruíleaders were unable to answer the questions on these financial
Table 1 Data sources used in SIMSURUI
Type of data Source
Suruí household socioeconomics Metareilá (2010)
Demographic FUNASA (2010)
Metareilá (2010)
Productive areas and landscapedynamics
Landsat-TM imagery analysisbetween 2000 and 2009
Metareilá (2010)
Suruí household financialinvestment
Interviews-Workshop with Suruíindigenous leaders (IDESAMand Metareilá 2011)
Prospective analysis of keydeforestation drivers
Workshop with Suruí indigenousleaders (IDESAM andMetareilá 2011)
812 Hum Ecol (2013) 41:807–826

Table 2 SIMSURUÍ parameter values
Sub-model Name Parameter description Value Reference/Justification
Suruí age-pyramid demography b Birth rate Varying[0.046–0.018]
Extrapolation of the 2009Metareilá census assumed.See Appendix 4
d Death rate [0.0024–0.0028] Extrapolation of the 2009Metareilá census assumed.See Appendix 4
ca1 Young age class 15 year Assumed
ca2 Adult age class 50 year Assumed
i Immigration rate 0.00026 Metareilá (2010) See Appendix 4
j Job recruitment 0.0097 Metareilá (2010) See Appendix 4
pf Number of people per household 5.85 people Metareilá (2010)
Labor dw Days worked per year 260 days/year Assumed
lc,i Labor demand for implementationof Suruí-managed coffee plantations
58.15 days/year/ha IDESAM and Metareilá (2011)
See Appendix 4
lc,m Labor demand for maintenance ofSuruí-managed coffee plantations
21.5 days/year/ha IDESAM and Metareilá (2011)See Appendix 4
ll,i Labor demand for implementationof Suruí-managed livestock
13.65 days/year/ha IDESAM and Metareilá (2011)See Appendix 4
ll,m Labor demand for maintenance ofSuruí-managed livestock
5.66 days/year/ha IDESAM and Metareilá (2011)See Appendix 4
lsa,i Labor demand for implementation ofSuruí-managed subsistence agriculture
14.65 days/year/ha IDESAM and Metareilá (2011)See Appendix 4
lsa,m Labor demand for maintenance ofSuruí-managed subsistence agriculture
6 days/year/ha IDESAM and Metareilá (2011)See Appendix 4
Distribution of householdsamong productive agentgroups
dG0 Proportion of the households in thenon-productive group G0
0.091 Metareilá (2010)
See Table 4
dG1 Proportion of the households in thecoffee growers group G1
0.44 Metareilá (2010)
See Table 4
dG2 Proportion of the households inmixed-strategy (coffee growingand ranching) group G2
0.4 Metareilá (2010)
See Table 4
dG3 Proportion of the households inthe ranchers group G3
0.074 Metareilá (2010)
See Table 4
Illegal logging revenues rtGi rtG1 Revenue from timber: coffee growers group G1 7120 R$/year/hh Metareilá (2010)
rtG2 Revenue from timber: mixed-strategy(coffee growing and ranching) group G2
9984 R$/year/hh Metareilá (2010)
rtG3 Revenue from timber: ranchers group G3 7875 R$/year/hh Metareilá (2010)
Handicraft revenues rhGi rhG1 Revenue from handicrafts:coffee growers group G1
148 R$/year/hh Metareilá (2010)
rhG2 Revenue from handicrafts: mixed-strategy(coffee growing and ranching) group G2
344 R$/year/hh Metareilá (2010)
rhG3 Revenue from handicrafts: ranchers group G3 12 R$/year/hh Metareilá (2010)
Fixed revenues rfGi rfG1 Fixed revenues (employment, governmentassistance): coffee growers group G1
6974 R$/y/hh Metareilá (2010)
rfG2 Fixed revenues (employment, governmentassistance): mixed-strategy (coffee growingand ranching) group G2
6042 R$/year/hh Metareilá (2010)
rf G3 Fixed revenues (employment, governmentassistance): ranchers group G3
5006 R$/year/hh Metareilá (2010)
Fixed Expenses efGi eG1 Expenses (transport, health, energy, etc.):coffee growers group G1
7026 R$/year/hh Metareilá (2010)
eG2 Expenses: mixed-strategy (coffee growingand ranching) group G2
9060 R$/year/hh Metareilá (2010)
e G3 Expenses: ranchers group G3 8423 R$/year/hh Metareilá (2010)
Revenues of Suruí-managedproductive systems rsps
rl Net revenue Suruí-managed livestock 190.8 R$/ha/hh IDESAM and Metareilá (2011)
rc Net revenue Suruí-managed coffee 294 R$/ha/hh IDESAM and Metareilá (2011)
Revenues of divided productivesystems rdps
rdl Net revenue leasing livestock 60 R$/ha/hh IDESAM and Metareilá (2011)
rdc Net revenue coffee sharecropping 121.6 R$/ha/hh IDESAM and Metareilá (2011)
Hum Ecol (2013) 41:807–826 813

Table 2 (continued)
Sub-model Name Parameter description Value Reference/Justification
Productive system establishmentcosts
cc Coffee plantation cost of deployment 2465 R$/ha/hh IDESAM and Metareilá (2011)
cp Pasture: cost of deployment 931.1 R$/ha/hh IDESAM and Metareilá (2011)
cd Minimum desired household cash flow R$1500/hh Assumed
Investment proportions of the cashflow of productive agent groupsin consumer goods - icg
icg > 10000 Investment proportion in consumer goods(if household cash flow > R$10,000)
0.312 IDESAM and Metareilá (2011)
icg [5000–10000] Investment proportion in consumer goods(if household cash flow is betweenR$5000 and R$10,000)
0.46 IDESAM and Metareilá (2011)
icg <5000 Investment proportion in consumer goods(if household cash flow < R$5000)
0.47 IDESAM and Metareilá (2011)
Investment proportions of the cashflow of productive agent groupsin real estate - ire
ire > 10000 Investment proportion in real estate(if household cash flow > R$10,000)
0.592 IDESAM and Metareilá (2011)
ire [5000–10000] Investment proportion in real estate(if household cash flow is betweenR$5000 and R$10,000)
0.22 IDESAM and Metareilá (2011)
ire <5000 Investment proportion in real estate(if household cash flow < R$5000)
0.062 IDESAM and Metareilá (2011)
Investment proportions of the cashflow of productive agent groupsin productive systems - ips
ips>10000 Investment proportion in productive systems(if household cash flow > R$10,000)
0.096 IDESAM and Metareilá (2011)
ips [5000–10000] Investment proportion in productive systems(if household cash flow is between R$5000and R$10,000)
0.32 IDESAM and Metareilá (2011)
ips <5000 Investment proportion in productive systems(if household cash flow < 5000 R$)
0.468 IDESAM and Metareilá (2011)
ipsc <5000 Proportion of the productive-system investmentin coffee production for the mixed-strategy(coffee growing and ranching) group G2
(if household cash flow < R$5000)
0.45 IDESAM and Metareilá (2011)
ipsl <5000 Proportion of the productive-system investmentin livestock for the mixed-strategy (coffeegrowing and ranching) group G2 (if householdcash flow < R$5000)
0.55 IDESAM and Metareilá (2011)
ipsc [5000–10000] Proportion of the productive-system investmentin coffee production for the mixed-strategy(coffee growing and ranching) group G2
(if household cash flow is between 5000and R$10,000)
0.33 IDESAM and Metareilá (2011)
ipsl [5000–10000] Proportion of the productive-system investmentin livestock for the mixed-strategy(coffee growing and ranching) group G2
(if household cash flow is between R$5000and R$10,000)
0.67 IDESAM and Metareilá (2011)
ipsc >10000 Proportion of the productive-systeminvestment in coffee production for themixed-strategy (coffee growingand ranching) group G2 (if householdcash flow > R$10,000)
0.18 IDESAM and Metareilá (2011)
ipsl >10000 Proportion of the productive-system investmentin livestock for the mixed-strategy(coffee growing and ranching) group G2
(if household cash flow > R$10,000)
0.82 IDESAM and Metareilá (2011)
Subsistence agriculture hhsa Proportion of the indigenous familiespracticing subsistence agriculture
0.791 hh/year Calculated from Metareilá (2010)
Tsa Time permanence of subsistence agricultureproduction
4 year IDESAM and Metareilá (2011)
Asa Land demand for subsistence agriculture 0.175 ha/year Calculated from Metareilá (2010)
Lsa,i Indigenous labor necessary for traditionalagriculture implementation
14.65 days/year/ha IDESAM and Metareilá(Amazonas) and Metareilá 2011)
Ltc,m Indigenous labor necessary for traditionalagriculture maintenance
6 days/year/ha IDESAM and Metareilá (2011)
Land demand adc,G1 Land demand in coffee sharecropping system(if household cash flow is above R$1500)coffee growers group G1
0.0452 ha/year Calculated from Metareilá (2010)
adc G2 Land demand in coffee sharecropping system(if household cash flow is above R$1500)
0.0878 ha/year Calculated from Metareilá (2010)
814 Hum Ecol (2013) 41:807–826

allocations, it was considered preferable to average the data bycash-flow category to increase the sample size, making itimpossible to obtain separate proportions for each group.The same average productive investment proportions wereused for all four productive-agent groups because of the sizeof the sample available to calculate this parameter. We as-sumed that, in view of the reduction in timber revenue, agentgroups would invest their net revenues in productive activitiesaccording to the average proportion informed by the leaders.The leaders argued that the clan population that they repre-sented would follow the same investment patterns. Averagingthe data could therefore have led to either an overestimate oran underestimate of the strategic productive investment ofcertain productive groups. Also, it was not possible to deducean averaged investment rate linking the sizes of the 2009productive areas and the ages of the systems because thisinformation was not collected during the socioeconomic sur-vey. We could not verify such information using Landsatsatellite imagery and a geographic information system be-cause productive areas were not mapped during interviewsand the 30-m resolution of Landsat-TM does not permitdistinguishing pastures from coffee plantations.
It was assumed that the proportion of investments in pro-ductive systems is higher when cash flow declines, as calcu-lated from interviews and adjusted during the calibrationparameterization (See Table 2 and Appendix 3). It was notassumed that there would be a continuous increase in theproductive-investment proportions in response to the down-ward trend in cash flow; instead, the choice was made tostrictly follow the results from the surveys as modified duringthe Monte-Carlo calibration. Categorizing these proportionsled to the investment being modeled as a discrete phenome-non. This is especially important when approaching the limitsof the cash-flow value categories, as the threshold could beconsidered to be a modeling artifact.
Depending on the annual household cash flow, the Suruíengage in two types of arrangement for income generation
from productive activities. The first type is a Suruí-managedsystem (which is considered legal by the Brazilian constitu-tion) in which Suruí agents alone invest in production andaccumulate all income. The second type is a “divided” systembased on either sharecropping or leasing (both consideredillegal, but which do occur), where the Suruí grant the rightto use an area of land in the indigenous territory to an externalagent (lessee) who bears the costs of deployment, mainte-nance and harvesting. The revenues are shared between thetenant and the Suruí.We considered that when the cash flow ismore than R$1500, a portion of the balance is allocated toestablish a Suruí-managed system of coffee cultivation orlivestock, depending on the productive-agent group. The pro-ductive area is cleared in accordance with the cost of deploy-ment of each activity (R$931 per hectare for pasture estab-lishment and R$2465 per hectare for coffee plantation estab-lishment). When the cash flow is below the desired value ofR$1500, each group chooses to increase the area allotted tosharecropping or rental in order to cover the difference be-tween the cash-flow value obtained and the desired value.Thus, the group will earn revenue without investing in settingup and maintaining these productive areas. The area designat-ed for sharecropping matches the amount required to generateenough income to maintain the household cash flow at thedesired level. The annual demands of all productive groups forSuruí-managed productive areas are summed with the annualdemands for sharecropping productive areas in order to obtainthe potential demand for opening new production areas thatgenerate profits at the landscape level.
Sub-Model 4: Subsistence Agriculture
Because slash-and-burn subsistence agriculture (manioc,sweet potatoes, etc.) is an activity that impacts forest coverbut does not provide cash income, a constant area per house-hold and per year is assumed to be cleared for this activity. Thetotal potential demand for new areas is calculated each year by
Table 2 (continued)
Sub-model Name Parameter description Value Reference/Justification
mixed-strategy (coffee growing and ranching)group G2
adl G2 Land demand in pasture leasing (if householdcash flow is above R$1500) mixed-strategy(coffee growing and ranching) group G2
0.336 ha/year Calculated from Metareilá (2010)
adl G3 Land demand in pasture leasing (if householdcash flow is above R$1500) ranchers group G3
0.432 ha/year Calculated from Metareilá (2010)
Tcr Time permanence of livestock system 11 year Luizão et al. (2009)
Tc Time permanence of coffee production system 15 year Luizão et al. (2009)
SSIL landscape d Proportion of the annual total land demand inopening new areas of primary vegetation
0.78 Landsat TM imagery analyses
c Proportion of the annual total land demand inopening new areas of secondary vegetation
0.22 Landsat TM imagery analyses
Hum Ecol (2013) 41:807–826 815

adding this demand for new areas of subsistence agricultureand the calculated potential demand for new areas that gener-ate profits.
To calculate the effective demand for new production areasin any given year, the model considers the availability of laborneeded to maintain the areas for productive use and theavailability of labor to open up new areas. If the potentialdemand cannot be supported by the available manpower, theratio of available to needed manpower is applied to calculatethe effective demand for new areas. The effective demand fornew productive areas can be satisfied either through defores-tation (transition 1–2) or through clearing of secondary vege-tation (transition 3–2).
Sub-Model 5: Productive Areas and Landscape Dynamics
The resulting total demand for productive area is translatedinto conversion of native forests (1–2) or reuse of secondaryforests (3–2) and then integrated into the landscape dynamics.All three classes of land use and cover are affected by the twoland-use and cover class transitions. Of the current demand fornewly deforested areas, 72 % is associated with theombrophilous forest stock and 28 % with the secondaryvegetation stock, according to the averaged annual analysisof LULCC conducted using Landsat TM 5 images between2000 and 2009. Annually, the converted area is added to theproductive areas in use and the abandoned areas are added tothe secondary-vegetation stock.
Calibration and Validation
A qualitative validation of the model was conducted with theSuruí leaders during two workshops, one to present a prelim-inary design of the model after studying data availability andthe second to test and correct some of the assumptions in thepreliminary version of the model and related outcomes. All ofthese steps are important for reducing uncertainties in model-ing deforestation. A complementary quantitative analysis hasbeen conducted to define the accuracy and uncertainties of themodel in reproducing the historical patterns. To obtain the bestmatch for the minimum payoff, a key-parameter sensitivityanalysis of the model was conducted using the Monte Carlomethod in the PLE Plus version of Vensim (Appendix 3).
Results
Accuracy and Uncertainties of the SIMSURUI Model
We obtained a correspondence of 93 % when the modeled“cumulative area of forest cleared” data were compared to thehistorical data for 2005–2009. The uncertainties ofSIMSURUI are presented in Appendix 3.
Suruí Demographic Evolution
The model projected the Suruí population to 2504 persons in2038, corresponding to 428 households. The 2038 projectedlabor force of 949 persons represents 37 % of the population(Table 3).
The increasing demographic projection based on the ob-served increasing trend (Appendix 1) indicates that internalpressure on natural resources would be higher in the future.The main productive-agent group in 2038 is the coffeegrowers with 187 families (Table 4).
Cash-flow Evolution and Productive Economic Returnon Investment
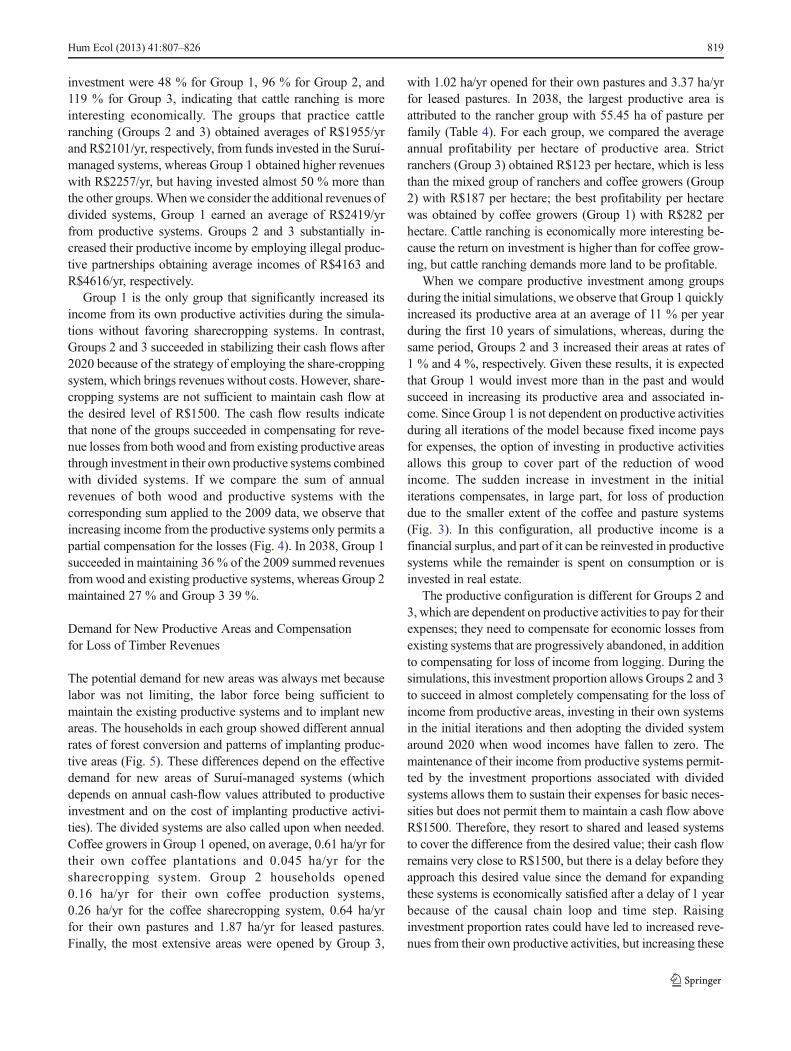
All of the productive-agent groups had different economicconfigurations in 2009 because financial receipts vary amongthe groups (Fig. 3). All groups were similarly dependent onwood sales, which represented approximately 48 % of house-hold revenues in 2009. In terms of productive income, Groups2 and 3 were both similarly dependent (by around 20 %),whereas Group 1 was less dependent (4 %). Group 1depended essentially on fixed revenues, representing 48 %of the gross income, whereas fixed income represented around30 % for Groups 2 and 3. In 2009, expenses representedaround 50 % of the income for all groups and net cash flowrepresented the remaining 50 % of the income. In this config-uration, Group 1 is the only group that fully covers its ex-penses from fixed income. In addition to fixed income,Groups 2 and 3 have to rely on a part of the income fromproductive systems and wood to cover their expenses. At theend of simulations (in 2038), these proportions change signif-icantly among productive groups; expenses represent 71 % ofthe income in Group 1, 88% in Group 2 and 89% in Group 3,reducing the net cash flow to 29 % of the income for Group 1and 12 % and 11 % for Groups 2 and 3. Group 1 succeeds inhaving higher net cash flow (surplus) than the other groupsdue to its simulated investment in coffee cultivation. Group 1raised its productive benefits by 341 % as compared to 2009(R$2759 per household (hh) in 2038 against R$625/hh in
Table 3 SIMSURUI demographic input and simulated values
Demographic level state variables (number of individuals) 2009 2038
Suruí population 1142 2504
[0–15 years] 518 705
[15–65 years] 597 1266
[> 65 years] 27 532
Suruí households 195 428
Employed individuals 62 316
Labor available in Suruí territory 534 949
816 Hum Ecol (2013) 41:807–826
2009) as well as Group 3 by 20%., whereas Group 2 lost 10%of its 2009 productive benefits.
During the simulation, for all groups the household cashflow followed a downward trend from 2009 onwards (Fig. 4),following the downward trend in wood revenue, which falls to0 % of the income in 2018. The household is also confrontedwith a reduction of existing productive-system revenues thatdepend on system permanence time. Of the three productivegroups, only Group 1 had a cash-flow level in 2038 thatexceeded the minimum desired value of R$1500, but thisgroup’s cash flow decreased to R$2854 in 2038 (Fig. 3),representing a decrease by 64 % as compared to the value in2009 (R$7841). Groups 2 and 3 reached the minimum desiredvalue around 2020 and respectively obtained cash flows of
R$1103 and R$1196 in 2038, which represent 10 % and 14 %of the initial values, respectively. Since wood income de-creases during the simulations, Groups 2 and 3 become moredependent on the productive systems to pay the portion oftheir expenses that is not covered by fixed income, this beingreflected as a reduction of the financial surplus or cash flow. Inthe model, the reduction of cash flow leads to a reduction ofproductive investment, with the result that the Suruí’s ownproductive investments decrease during the simulations for allGroups. On average, over the 30 years of the simulations,Group 1 invested R$45,687 in its own coffee productionsystems (R$1522/yr), whereas Group 2 invested R$29,889in coffee production and cattle ranching (R$996/yr) andGroup 3 invested R$28,737 (R$958/yr). Average returns on
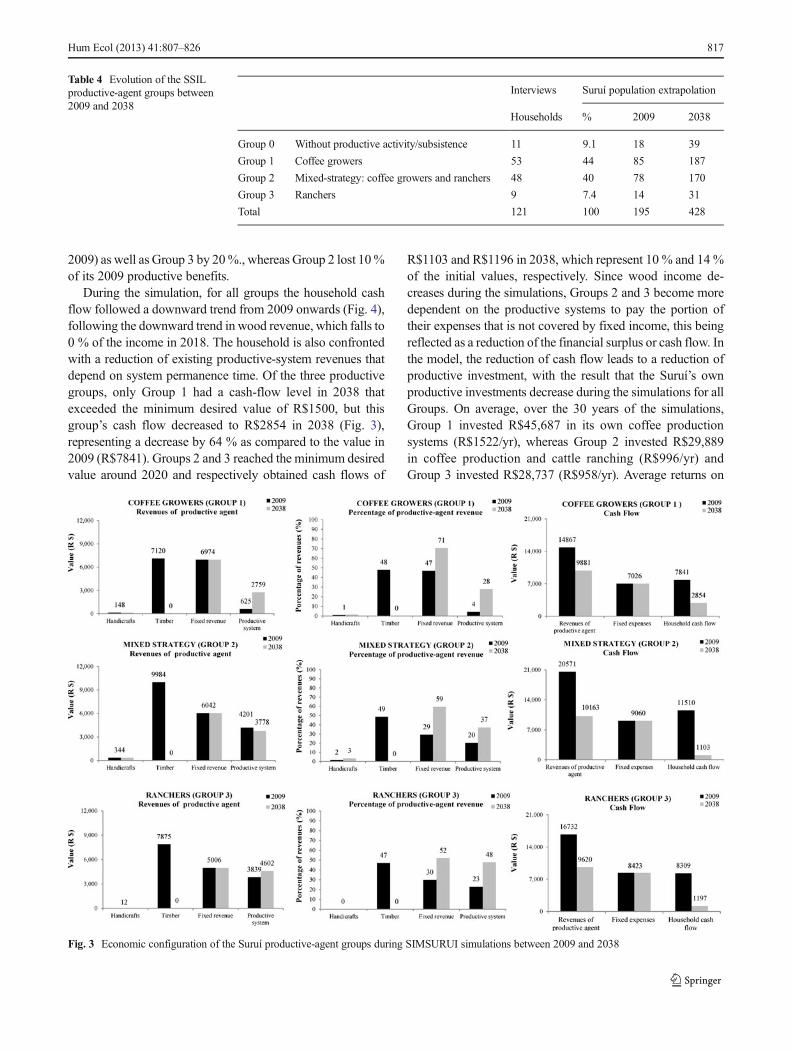
Table 4 Evolution of the SSILproductive-agent groups between2009 and 2038
Interviews Suruí population extrapolation
Households % 2009 2038
Group 0 Without productive activity/subsistence 11 9.1 18 39
Group 1 Coffee growers 53 44 85 187
Group 2 Mixed-strategy: coffee growers and ranchers 48 40 78 170
Group 3 Ranchers 9 7.4 14 31
Total 121 100 195 428
Fig. 3 Economic configuration of the Suruí productive-agent groups during SIMSURUI simulations between 2009 and 2038
Hum Ecol (2013) 41:807–826 817

Fig. 4 Economic behavior of the Suruí productive-agent groups during SIMSURUI simulations between 2009 and 2038
818 Hum Ecol (2013) 41:807–826
investment were 48 % for Group 1, 96 % for Group 2, and119 % for Group 3, indicating that cattle ranching is moreinteresting economically. The groups that practice cattleranching (Groups 2 and 3) obtained averages of R$1955/yrand R$2101/yr, respectively, from funds invested in the Suruí-managed systems, whereas Group 1 obtained higher revenueswith R$2257/yr, but having invested almost 50 % more thanthe other groups. Whenwe consider the additional revenues ofdivided systems, Group 1 earned an average of R$2419/yrfrom productive systems. Groups 2 and 3 substantially in-creased their productive income by employing illegal produc-tive partnerships obtaining average incomes of R$4163 andR$4616/yr, respectively.
Group 1 is the only group that significantly increased itsincome from its own productive activities during the simula-tions without favoring sharecropping systems. In contrast,Groups 2 and 3 succeeded in stabilizing their cash flows after2020 because of the strategy of employing the share-croppingsystem, which brings revenues without costs. However, share-cropping systems are not sufficient to maintain cash flow atthe desired level of R$1500. The cash flow results indicatethat none of the groups succeeded in compensating for reve-nue losses from both wood and from existing productive areasthrough investment in their own productive systems combinedwith divided systems. If we compare the sum of annualrevenues of both wood and productive systems with thecorresponding sum applied to the 2009 data, we observe thatincreasing income from the productive systems only permits apartial compensation for the losses (Fig. 4). In 2038, Group 1succeeded in maintaining 36 % of the 2009 summed revenuesfrom wood and existing productive systems, whereas Group 2maintained 27 % and Group 3 39 %.
Demand for New Productive Areas and Compensationfor Loss of Timber Revenues
The potential demand for new areas was always met becauselabor was not limiting, the labor force being sufficient tomaintain the existing productive systems and to implant newareas. The households in each group showed different annualrates of forest conversion and patterns of implanting produc-tive areas (Fig. 5). These differences depend on the effectivedemand for new areas of Suruí-managed systems (whichdepends on annual cash-flow values attributed to productiveinvestment and on the cost of implanting productive activi-ties). The divided systems are also called upon when needed.Coffee growers in Group 1 opened, on average, 0.61 ha/yr fortheir own coffee plantations and 0.045 ha/yr for thesharecropping system. Group 2 households opened0.16 ha/yr for their own coffee production systems,0.26 ha/yr for the coffee sharecropping system, 0.64 ha/yrfor their own pastures and 1.87 ha/yr for leased pastures.Finally, the most extensive areas were opened by Group 3,
with 1.02 ha/yr opened for their own pastures and 3.37 ha/yrfor leased pastures. In 2038, the largest productive area isattributed to the rancher group with 55.45 ha of pasture perfamily (Table 4). For each group, we compared the averageannual profitability per hectare of productive area. Strictranchers (Group 3) obtained R$123 per hectare, which is lessthan the mixed group of ranchers and coffee growers (Group2) with R$187 per hectare; the best profitability per hectarewas obtained by coffee growers (Group 1) with R$282 perhectare. Cattle ranching is economically more interesting be-cause the return on investment is higher than for coffee grow-ing, but cattle ranching demands more land to be profitable.
When we compare productive investment among groupsduring the initial simulations, we observe that Group 1 quicklyincreased its productive area at an average of 11 % per yearduring the first 10 years of simulations, whereas, during thesame period, Groups 2 and 3 increased their areas at rates of1 % and 4 %, respectively. Given these results, it is expectedthat Group 1 would invest more than in the past and wouldsucceed in increasing its productive area and associated in-come. Since Group 1 is not dependent on productive activitiesduring all iterations of the model because fixed income paysfor expenses, the option of investing in productive activitiesallows this group to cover part of the reduction of woodincome. The sudden increase in investment in the initialiterations compensates, in large part, for loss of productiondue to the smaller extent of the coffee and pasture systems(Fig. 3). In this configuration, all productive income is afinancial surplus, and part of it can be reinvested in productivesystems while the remainder is spent on consumption or isinvested in real estate.
The productive configuration is different for Groups 2 and3, which are dependent on productive activities to pay for theirexpenses; they need to compensate for economic losses fromexisting systems that are progressively abandoned, in additionto compensating for loss of income from logging. During thesimulations, this investment proportion allows Groups 2 and 3to succeed in almost completely compensating for the loss ofincome from productive areas, investing in their own systemsin the initial iterations and then adopting the divided systemaround 2020 when wood incomes have fallen to zero. Themaintenance of their income from productive systems permit-ted by the investment proportions associated with dividedsystems allows them to sustain their expenses for basic neces-sities but does not permit them to maintain a cash flow aboveR$1500. Therefore, they resort to shared and leased systemsto cover the difference from the desired value; their cash flowremains very close to R$1500, but there is a delay before theyapproach this desired value since the demand for expandingthese systems is economically satisfied after a delay of 1 yearbecause of the causal chain loop and time step. Raisinginvestment proportion rates could have led to increased reve-nues from their own productive activities, but increasing these
Hum Ecol (2013) 41:807–826 819

proportions would result in an exceedingly large reduction inthe portion allocated to investments in real estate and topurchasing consumer goods. The three groups have,
respectively, invested in real estate an average of R$398 peryear (R$33 per month), R$1317 per year (R$110 per month)and R$1143 per year (R$95 per month). These values are
Fig. 5 Evolution of the productive areas of the Suruí productive-agent groups during SIMSURUI simulations between 2009 and 2038
820 Hum Ecol (2013) 41:807–826

relatively low as compared to the local price of real estate,which is why these outlays can be considered to be eitherexpenditures for maintenance of the existing real estate or lowprogressive investments in new real estate. The possibility ofSuruí soliciting personal bank loans to invest in real estate wasnot considered, as it seems that the lack of sufficient fixedincome to serve as a guarantee for bank loans would restrictthese investments to a small part of the population, especiallyto those who earn salaries. Moreover, we did not consider theeconomic return of the real estate in which some Suruí havealready invested outside the indigenous land, especially inCacoal and Riozinho, which could be a source of income inthe future if sold when needed. This choice is believed to beconservative because it underestimates future financial reve-nues, but, as observed in the field, real-estate speculation inCacoal is increasing because of the implantation of newinfrastructure such as private faculties and hospitals, attractingprofessionals from southern Brazil (personal communicationsand the websites of real-estate agencies). In terms of acquisi-tion of consumer goods, which is modeled from cash flow, theproportion attributed can be considered to be relatively con-servative; expenditures of the three groups on goods were,respectively, R$1701 per year (R$142 per month), R$1317per year (R$110 per month) and R$1143 per year (R$95 permonth).
Landscape Dynamics
Concerning landscape dynamics, 13,575 ha of ombrophi-lous forest would be deforested by 2038, and 5279.3 haof secondary vegetation would be re-used in the indige-nous territory (Fig. 6). On average, we obtained a defor-estation rate of 452.2 ha/yr during the 30-year simula-tion, which corresponds to 2.9 times the 2000–2009historical rate.
Discussion
The Suruí Standard of Living and Consumption of ModernGoods in SIMSURUÍ
An important point in the SIMSURUI household economicsmodel is the separation of basic economic needs or “expenses”(e.g., clothing, food, transport, electricity) from additionalconsumer goods such as technological products like cellphones, DVD players and vehicles. This makes it possible toinvestigate whether Suruí households would be able to sustainthe 2009 observed standard of living based on fixed expenses,and how they would have to adapt their consumption oftechnological products to a new less-prosperous economicconfiguration when the SSIL forest no longer offers an abun-dant supply of timber. Fixed expenses also express the
evolution of modernity because they include the use of elec-tricity and landline telephones, which represent new customsthat have progressively entered into the category that is con-sidered to be basic necessities by the Suruí in the period sincecontact with modern civilization and Brazilian economicprogress.
The Brazilian Institute of Geography and Statistics(IBGE) carried out a social study in 2010 in order toanalyze the average Brazilian family budget, evaluatingthe current family expenses that include consumer spending(transport, food, housing, health, hygiene, clothing, educa-tion, leisure, tobacco and personal services) and other ex-penses (taxes, postal services, etc.). These results can becompared with the modeled Suruí economic data in order toassess the place of the Suruí population in the Braziliancontext. A difference with our assumption is that IBGE alsoincluded as “housing expenses” the acquisition of electricalproducts such as freezers, washing machines, television setsand DVD players, and included as “transport expenses” theacquisition of vehicles, which we did not include in theSuruí fixed expenses. A way to make the methodologiescomparable is to sum Suruí expenses and modeled acquisi-tion of consumer goods (which include both technologicalproducts and vehicles). On average, Brazilian householdsspent R$2134 per month on consumer spending (Brazil,IBGE 2010). Our data indicate that, on average, the Suruíproductive-agent groups spent R$796 per household peryear on consumer spending over the 30-year simulations,or 2.67 times less than the average Brazilian householdspent in 2010.
We therefore can conclude that the assumption that house-holds would maintain an annual net cash flow or surplus ofR$1500 in order to invest in real estate or to purchase con-sumer goods (in addition to expenses) is quite conservative ascompared to the Brazilian living standard. However, assuminga desired cash flow value of R$1500 (which represents 19, 13and 18 % of the 2009 cash flow for Groups 1, 2 and 3,respectively) could appear unreasonable because it does notpresume that the Suruí households will be progressively in-cluded in modern life, as expressed by a higher basic standardof living and consumption of goods. We would expect aprogression of inclusion in modernity among families becausethe rapid progression to modernity observed in the surround-ing area of Cacoal, which is a symbol of social status andpower. An indication of the potential for increased acquisitionof modern goods is that only 6 % of the Suruí households owna car and 28 % a motorcycle (Metareilá 2010). Consideringthe difficulty of transport from the indigenous territory tosurrounding towns, we could expect that the acquisition ofvehicles would be a priority in order to facilitate the flow ofagricultural products and for the Suruí’s frequent journeys tothe surrounding towns. We expect that the economic con-straint of decreased cash flow linked to the reduction of wood
Hum Ecol (2013) 41:807–826 821

availability will have a preponderant role in shaping the evo-lution of modernity in the life style of Suruí households. Asillustrated by Group 1, if fixed income increases and compen-sates for expenses among productive groups, then the level ofconsumption would be higher than the modeled level butlower than historical consumption because of a resultingdownward evolution of cash flow. A desired cash flow couldhave been considered that corresponds to the average ex-penses of Brazilians, but, as observed in the model, this wouldhave led to more reliance on divided production systems andconsequent demand for deforestation to obtain productiverevenues that could satisfy this level of financial demand.The SIMSURUI reference scenario would then sustain theSuruí standard of living for all productive groups, but forGroups 2 and 3 it implies relying on illegal agreements thatlead to higher deforestation rates because they depend moreheavily on income from the productive systems.
Land-use Trajectories in the SSIL: A Switch from CoffeeCultivation to Cattle Ranching?
One of the assumptions that is considered conservative is thefixed proportions of households among productive-agentgroups, as observed in 2009. Since cattle ranching is econom-ically more profitable (in terms of return on money invested),the model could have assumed a progression of householdsswitching from Group 1 to Group 2 and from Group 2 toGroup 3. This would be based on the maximization of profits,since the internal rate of return is higher for cattle ranchingthan for coffee production, and, consequently, the Suruí would
progressively abandon their coffee plantations to establishpastures. However, arguments to the contrary suggest thatthere is no clear trend towards this distribution of productivegroups. Both coffee and cattle ranching are linked to access tolocal markets, to historical insertion in the market, and toexperience with these activities. An additional factorrestraining pasture is a respect for forest by indigenous peoplethat represents an additional value placed on the ecologicalimpact of land-use practices. We are not able to evaluate theproportion of the Suruí who hold this more-conservationistvalue, versus individuals who are more opportunistic andwould devalue the importance of environmental impacts.Indeed, the impact of cattle ranching is much higher becauseit demands more land to be as profitable as coffee production.
As reported by Metareilá (2010), households have recentlyopted to implant both coffee plantations and pastures, and themajority of coffee plantations are not yet productive, indicat-ing that coffee cultivation is contingent on the choices regard-ing cattle ranching. Additionally, the Suruí have gained expe-rience in coffee production since 1980, although the Suruíhave not practiced this activity continuously in the interveningyears due to fluctuations in the price of coffee (Metareilá2010). Metareilá argues that coffee growing is the principalactivity in villages that do not participate to illegal logging.During the participatory workshops, some participants arguedthat the households that used to only sell timber and that hadabandoned agricultural habits would directly establish pas-tures. The pastures could be either as Suruí-managed systemsor for leasing. It was argued that cattle ranching would befavored over coffee because pasture is economically more
Fig. 6 Landscape dynamics through SIMSURUI simulations between 2009 and 2038
822 Hum Ecol (2013) 41:807–826

profitable and less demanding on manpower and time, is lessdependent on climatic conditions, and is less subject to marketvolatility.
On the contrary, the current pressure of international environ-mental groups on slaughter houses to avoid purchasing cattlefrom Amazonian protected areas is stronger than before andcould discourage some Suruí from ranching. If voluntary in-volvement of companies such as JBS (which has an almost-complete monopoly on cattle purchases in Cacoal) is effective,the Suruí would encounter serious problems in selling their cattledirectly to the slaughter house. The profitability of indigenouscattle ranching would be significantly reduced if intermediarieswere to enter the price chain in order to disguise the origin of thecattle. This might favor coffee production if the coffee marketremains stable. However, it appears that, in practice, Suruíhouseholds succeed in selling cattle to the slaughter house inCacoal (ABIEC 2012). Two years after the environment-friendly accord between JBS and Greenpeace to impede pur-chase of cattle originating from protected areas, the NGOattacked JBS for not respecting the agreement, especially forbuying cattle from indigenous lands in Mato Grosso(Greenpeace 2012). JBS countered by claiming that Braziliangovernance is not able to trace the origin of cattle from birth tofinal sale (JBS 2012). We can therefore doubt the effectivenessof the agreement between Greenpeace and JBS because JBS iswell aware of previous failures in monitoring the cattle-ranchingchain, especially the illegal contracts for leasing pastures inindigenous lands (Greenpeace, 2012). Since commercial cattleranching by indigenous people is not a prohibited activity inindigenous lands, what would be questionable is the reduction ofaccess to the market for the Suruí-managed cattle ranching. Thiscould indirectly favor the illegal activity of pasture leasing unlessthere is total control over every step in the beef production chain,including the fattening of cattle in indigenous lands. Under theassumptions of the model, this situation could increase defores-tation inside indigenous lands in order to meet the R$1500/hh/yrcash-flow target because the illegal practice requires three timesas much land to generate the same income for the Suruí, ascompared to Suruí-managed cattle ranching.
Another limitation of the SIMSURUI model is the con-stancy of the profitability of Suruí activities. The possibleimprovement of practices during the simulations is not con-sidered. We can imagine that the Suruí would improve theyield of coffee cropping (e.g., space between lines of plantsand reduction of invasive plants as reported in the socioeco-nomic survey by Meitarelá) and increase their return on in-vestment in coffee cultivation based on the fact that surround-ing colonists, who act in the Suruí systems as sharecroppers oras wage laborers, are sharing their knowledge coffee growingwith the Suruí and influencing the improvement of practices.Cattle ranching is less demanding on agricultural techniques.Ranching could also be improved in the future, especially withrespect to animal density per hectare and implantation of
pastures based on slash-and-burn, but not necessarily meaningimprovement of profitability. Since the IDESAM profitabilitycalculation considered that the Suruí pay for foot-and-mouthdisease vaccine and for all wage labor, it is possible that cattle-ranching profitability is slightly underestimated.
Defining a Local LULCC Reference Scenario for a REDDProject
One of the major criticisms of REDD reference scenarios is theuncertainty of the emissions calculation on which the financialcalculation of REDD credits is based, and the creation ofundeserved “hot-air” credits that could distort the carbon market(Olander et al. 2008, Huettner et al. 2009). Increasing complex-ity through inclusion of many variables to represent a socio-ecological system, as is the case in the SIMSURUI, can lead toincreasing the uncertainty of a LULCC predictive model ascompared to a simple statistical model. Associating variablesimplies combining their respective natural variability and theuncertainty of the methods from which the values were derived.Additionally, when no historical trends could be determinedfrom data, we had to assume future trends of parameters andvariables based on expert knowledge and the visions of the Suruíleaders expressed in the participative workshops. Relying on astatistical model with only one or two variables, such as popu-lation size or distance to market, can hide other variables thatexplain land-use dynamism at the level of productive agents. Inorder to project the future strategic behavior of productive-agentgroups (as in SIMSURUI), combining economic, productiveand landscape data may appear to have led to increased uncer-tainty in the LULCC model. However, the more completerepresentation of the socio-ecological system provided by sys-temsmodeling was useful in order to integrate different trends inthe variables and to understand how the result influences land-use patterns, sometimes in un-expected ways.
In the SSIL case, integrating local variables in a LULCCmodel led to obtaining lower projected deforestation rates thanthose from hypothetical projections made by environmentalNGOs and obtained by other LULCC models that project futuredeforestation throughout the Brazilian Amazon Basin. This in-cludes the SIMAMAZONIA model in the DINAMICA-EGOplatform by Soares-Filho et al . (2006) or the model of BrazilianAmazonia in the CLUE software by Aguiar (2006). TheSIMSURUI SFCP reference scenario projects deforestation of6 % of the territory by 2038, which is much lower than thehypothetical projection of ISA and Forest Trends (2010) thatexpects at-risk indigenous lands (such as the SSIL) to be approx-imately 20 % deforested by 2020. SIMAMAZONIA also pro-jects higher deforestation, with 35 % of the SSIL deforested by2038. Basing the deforestation rate calculation on a sub-regionthat encompasses several municipalities, the SIMAMAZONIAmodel allocated a higher deforestation rate in the SSIL. Theparameter values in SIMAMAZONIA do not consider variables
Hum Ecol (2013) 41:807–826 823

internal to the protected areas. Projecting deforestation based oninternal factors related to local land-use activities together withthe influence of agents in the surrounding area can produce morerealistic results for protected areas than can applying a sub-regional deforestation rate that homogenizes the agents anddrivers of deforestation.
In the case of the Juma REDD project (IDESAM 2009),developed in the southern part of the state of Amazonas, theland-use baseline was determined from the SIMAMAZONIAprojection and consequently does not consider internal informa-tion from this sustainable-use reserve. The Juma project wasvalidated both by the Voluntary Carbon Standard (VCS) andClimate, Community and Biodiversity Alliance (CCBA) normsin 2009. For a REDD project, the integration of local land-usedynamics in a protected area can be considered a progress in thesense that characterizes the inherent pressure on inhabited forestecosystems.
The development of a specific LULCC model is onlypossible in well-studied sites such as the Suruí territory.Demographic data are available for almost all BrazilianAmazonian tribes because they have been monitored byFUNASA for decades, but land-use characterization and so-cioeconomic diagnostics are not usually available in indige-nous lands. A few management and use plans exist inBrazilian indigenous lands (GEF 2009). In Rondônia, onlythree of 24 indigenous lands have such plans, all of whichwere produced by Kanindé and the Amazon ConservationTeam (ACT) NGOs (see http://www.kaninde.org.br).
In the SIMSURUI model, socioeconomic data are the coreof the land-use strategy modeling. Developing LULCCmodelsbased on demographic trends and historical deforestation ratesis possible but less precise if the model does not includerealistic land-use dynamics, which are first characterized bysocioeconomic surveys coupled with spatial analyses. Specificprospective studies are needed to plan territorial and environ-mental management in protected areas, indicating zones wheredeforested land uses would be developed depending on de-mography and population needs and other zones that would bestrictly preserved to guarantee environmental integrity.
Analyses such as that of cash flow in Suruí households areuseful to indicate how a REDD project will deal with benefit-sharing incentives. Without this information on the economicstandard of living it is likely that cost-opportunity calculationswill fail to represent the true situation of the community. Localspecificities must be included in the baselines for REDDprojects if this mechanism is to have a role in countering thereal threats to indigenous lands and other protected areas. TheSuruí REDD project baseline studied here was developed inaccord with current procedures for site-specific projects andwas certified by the standards VCS and CCBA in 2011(United States, USAID 2013).
However, Brazil is currently constructing a federal REDDframework, and some of the state governments in the Legal
Amazon region are also developing independent frameworks(Brazil,MMA2012). At the same time that mitigation is beingdone at the project level, it is also being done at the nationallevel under the Amazon Fund (Brazil, MMA 2009). National-level emissions reductions are calculated based on the totaldecrease in deforestation indicated by the PRODES dataset,including the (currently very small) portion of this decreasethat occurs inside REDD projects. At present climatic integrityis not jeopardized by the same emissions reductions beingdoubly rewarded (once in the projects and again based on thenational accounts) because REDD currently does not generatecarbon credit (certified emissions reductions: CERs) at eitherlevel. If future negotiations result in carbon credit for REDD,then it will be essential to avoid double counting of theemissions reductions. A “nested approach” has been proposed(Zhu et al. 2010) that would guarantee that a project baselinefor deforestation (such as the present one) could be integratedinto a national baseline, thus avoiding double counting ofemissions reductions. A variant of this is the Jurisdictionaland Nested REDD + Initiative (JNRI) (VCS 2012). Whateverprocedure is adopted, it will be necessary to maintain a regis-try of project emission reductions to be deducted from thenational accounting (Fearnside 2012a).
Conclusions
The land-use change modeling for the reference scenario ofthe proposed Suruí Reduced Emissions from Deforestationand Degradation (REDD) project has a wide variety of fea-tures that contribute to its realism and conservative nature inestimating baseline deforestation rates.
Modeled scenarios of future developments are inherentlyuncertain, although the model developed for the Suruí base-line (SIMSURUI) uses the most reliable information availablefrom a 2-year data collection effort with wide participation oftribal leaders and organizations. Most indigenous groups lackthis level of information.
The data and modeling demands of REDD baselines rep-resent significant, but not insurmountable, barriers to widerimplementation of indigenous REDD.
The increasing threats to indigenous areas from deforesta-tion and logging, as in the case of the Suruí, indicate the needfor economic alternatives that reward forest maintenance forenvironmental services. REDD is currently the alternative ofthis type that is closest to providing a source of such support.This justifies considerable effort to continue improvement ofdata and models for REDD baselines. SIMSURUI provides astarting point for these efforts.
Acknowledgments The Institute for the Conservation and SustainableDevelopment of Amazonas (IDESAM), CAPES and AgroParisTech/ANR Prigoue provided successive Ph.D. fellowships for the first author.
824 Hum Ecol (2013) 41:807–826

We thank the following NGO partners of the SFCP project for providinginput data: Metareilá, which provided the 2009 socioeconomic censusdata, IDESAM and the Amazon Conservation Team-Brazil, which pro-vided the data on Suruí financial investments, and Kanindé, whichprovided information about historical LULCC. We are grateful to ForestTrends for supporting Suruí participative workshops. The authors thankthe Suruí leaders for their participation in the construction of LULCCbaseline. CNPq (305880/2007-1, 143399/2008-0, 563315/2008-3,575853/2008-5, 573810/2008-7) provided financial support.
References
ABIEC. (2012). Sobre a pecuária, a indústria brasileira de carne bovina e odesmatamento na Amazônia. <http://www.abiec.com.br/news_view.asp?id=%7BED72951E-0AA7-423B-9DBC-AF42F2364EDB%7D>. (accessed 27 October 2012).
Aguiar, A. P. (2006). Modeling Land-Use Change in the BrazilianAmazon: Exploring Inter-Regional Heterogeneity. Ph.D. Thesis,Instituto Nacional de Pesquisas Espaciais (INPE), São José dosCampos, SP, Brazil. 153 pp.
Brazil, IBGE (Instituto Brasileiro de Geografia e Estatística) (1992).Manual Técnico da Vegetação Brasileira. Manuais Técnicos emGeociências no 1. IBGE, Rio de Janeiro, RJ, Brazil. 92 pp.
Brazil, IBGE (Instituto Brasileiro de Geografia e Estatística) (2010).Pesquisa de Orçamentos Familiares 2008–2009. IBGE, Rio deJaneiro.
Brazil, IBGE (Instituto Brasileiro de Geografia e Estatística) (2011).Malha Municipal e de Setores Censitários do Censo 2010. IBGE,Rio de Janeiro, RJ, Brazil. <http://www.censo2010.ibge.gov.br/sinopseporsetores>.
Brazil, INPE (Instituto Nacional de Pesquisas Espaciais) (2010). ProjetoPRODES, Brazilian Amazon Forest Monitoring. INPE, São José dosCampos, SP, Brazil. <http://www.obt.inpe.br/prodes/index.php>.
Brazil, MMA (Ministério do Meio Ambiente) (2001). SeminárioMACAPÁ- Avaliação de Ações Prioritárias Para A Conservação,Utilização Sustentável e Repartição dos Benefícios da Biodiversidadena Amazônia Brasileira. MMA, Brasília. http://www.mma.gov.br/estruturas/sbf_chm_rbbio/_arquivos/Sumario_Amazonia.pdf.
Brazil, MMA (Ministerio do Meio Ambiente). (2009). The Brazilian ReddStrategy. MMA, Brasília, DF, Brazil. 29 pp. <http://www.mma.gov.br/estruturas/168/_publicacao/168_publicacao19012010035219.pdf>.
Brazil, MMA (Ministério doMeio Ambiente). (2012). REDD + nos estadosda Amazônia: Mapeamento de iniciativas e desafios para integraçãocom a estratégia brasileira. MMA, Brasília, DF, Brazil. 35 pp. <http://www.mma.gov.br/redd/images/stories/redd_estadosamazonicos_idesam_mma.pdf>.
Cattaneo, A. (2010). Incentives to Reduce Emissions fromDeforestation:A Stock-Flow Approach with Target Reductions. In Bosetti, V., andLubowski, F. (eds.), Deforestation and Climate Change: ReducingCarbon Emissions from Deforestation and Forest Degradation.Edward Elgar Publishing, Cheltenham, pp. 93–120.
Dougill, A. J., Fraser, E. D. G., and Reed, M. S. (2010). AnticipatingVulnerability to Climate Change in Dryland Pastoral Systems:Using Dynamic Systems Models for the Kalahari. Ecology andSociety 15(2): 17.
Fearnside, P. M. (1986). Spatial Concentration of Deforestation in theBrazilian Amazon. Ambio 15(2): 72–79.
Fearnside, P. M. (1989). A Ocupação Humana de Rondônia: Impactos,Limites e Planejamento. Conselho Nacional de DesenvolvimentoCientífico e Tecnológico (CNPq), Brasília. 76 pp.
Fearnside, P. M. (2009). Carbon Benefits from Amazonian ForestReserves: Leakage Accounting and the Value of Time. Mitigation
and Adaptation Strategies for Global Change 14(6): 557–567 doi:10.1007/s11027-009-9174-9.
Fearnside, P. M. (2012a). Brazil's Amazon Forest in Mitigating GlobalWarming: Unresolved Controversies. Climate Policy 12(1): 70–81doi:10.1080/14693062.2011.581571.
Fearnside, P. M. (2012b). The Theoretical Battlefield: Accounting for theClimate Benefits of Maintaining Brazil’s Amazon Forest. CarbonManagement 3(2): 145–148 doi:10.4155/CMT.12.9.
FUNASA (FundaçãoNacional da Saúde). (2010). Sistema de Informaçãoda Atenção à Saúde Indígena -SIASI. 27/01/2010. FUNASA,Brasília, DF, Brazil. (data obtained from Metareilá).
GEF (Global Environment Facility). (2009). Catalyzing the contribution ofIndigenous Lands to the Conservation of Brazil Forest Ecosystems.United Nations Development Program (UNDP)/Brazilian Ministryof Environment (MMA)/Brazilian National Foundation of theIndians (FUNAI). Project document. GEF, World Bank,Washington, DC, U.S.A. 128 pp. <https://docs.google.com/viewer?a=v&pid=sites&srcid=ZGVmYXVsdGRvbWFpbnxwaWdhdGlmdW5haXxneDo2YTZiNGZhMjFkMzk2NTc5>.
Greenbaum, L. (1989). Plundering the Timber on Brazilian IndianReservations. Cultural Survival Quarterly 13(1): 23–26.
Greenpeace. (2012). JBS – still involved in Amazon destruction. http://www.greenpeace.org/international/Global/international/publications/forests/2012/Amazon/JBS-summary-26June.pdf. (accessed 27October 2012).
Huettner, M., Leemans, R., Kok, K., and Ebeling, J. (2009). AComparison of Baseline Methodologies for 'Reducing Emissionsfrom Deforestation and Degradation'. Carbon Balance andManagement 4: 4.
IDESAM (Instituto de Conservação e Desenvolvimento Sustentável doAmazonas). (2009). Projeto de Redução de Emissões de GEEProvenientes do Desmatamento na Reserva de DesenvolvimentoSustentável do Juma, Amazonas, Brasil. Documento deConcepção do Projeto (DCP), versão 5.1. Instituto de Conservaçãoe Desenvolvimento Sustentável do Amazonas (IDESAM), Manaus,AM, Brazil. <http://www.idesam.org.br/documentos/pdf/PDD_Projeto%20 Juma_portugues.pdf>(accessed 20 June 2011).
IDESAM (Instituto de Conservação e Desenvolvimento Sustentável doAmazonas), and Metareilá. (2011). Projeto de Carbono FlorestalSuruí. 2011. IDESAM, Manaus, AM, Brazil. 129 pp. <http://www.idesam.org.br/publicacoes/pdf/PCFS_PDD_portugues_V1.pdf>
ISA (Instituto Socioambiental), and Forest Trends. (2010). AvoidedDeforestation (REDD) and Indigenous Peoples: experiences, chal-lenges and opportunities in the Amazon context. ISA, Brasília, DF,Brazil and ForestTrends, Washington, DC, U.S.A. 142 pp. <http://www.forest-trends.org/documents/files/doc_2626.pdf>.
JBS. (2012). JBS repudia falsas acusações do Greenpeace e tomarámedidas judiciais cabíveis. <http://www.jbs.com.br/Resposta%20JBS%20ao%20relatorio%20Green%20Peace%20Scorecard%2006_06_2012%20port.pdf> (accessed 27 October 2012).
Kemper, L. (2006). Cacoal, suaHistoria, suaGente.Grafopel,Goiânia. 186 pp.Luizão, F. J., Fearnside, P. M., Cerri, C. E. P., and Lehmann, J. (2009).
The Maintenance of Soil Fertility in Amazonian Managed Systems.In Keller, M., Bustamante, M., Gash, J., and da Silva Dias, P. (eds.),Amazonia and Global Change, Geophysical Monograph Series, vol.186. American Geophysical Union (AGU), Washington, DC, pp.311–336 doi:10. 029/2008GM000742.
Metareilá (2010). Plano de Ação Participativo Para o Desenvolvimentode Uma Economia Racional e de Manejo Sustentável dos RecursosNaturais da Terra Indígena Sete de Setembro. Cacoal, RO, Brazil.252 pp.
Mindlin, B. (2003). Surui Paiter. Povos Indígenas no Brasil. InstitutoSocioambiental (ISA), Brasilia. http://pib.socioambiental.org/pt/povo/surui-paiter/846.
Mindlin, B. (2008). Carnets Sauvages: Chez les Suruí de Rondônia.Métailié, Paris. 344 pp.
Hum Ecol (2013) 41:807–826 825
Olander, L. P., Gibbs, H. K., Steininger, M., Swenson, J. J., and Murray,B. C. (2008). Reference scenarios for deforestation and forest deg-radation in support of REDD: a review of data and methods.Environmental Research Letters 3: 025011. 11 pp.
Pedlowski, M. A., Matricardi, E. A. T., Skole, D., Cameron, S. R.,Chomentowski, W., Fernandes, C., and Lisboa, A. (2005).Conservation Units: A new Deforestation Frontier in the AmazonianState ofRondônia, Brazil. Environmental Conservation 32(2): 149–155.
Rodrigues, H., Soares-Filho, B. S., and Costa, W. (2007). Dinamica-EGO, Uma Plataforma Para Modelagem de Sistemas Ambientais.Brazilian Symposium of Remote Sensing, Florianópolis, April 21–26, 2007. Instituto Nacional de Pesquisas Espaciais (INPE), SãoJosé dos Campos, SP, Brazil. pp. 3089–3096.
Sendzimir, J., Reij, C. P., and Magnuszewski, P. (2011). RebuildingResilience in the Sahel: Regreening in the Maradi and Zinder Regionsof Niger. Ecology and Society 16(3): 1 doi:10.5751/ES-04198-160301.
Soares-Filho, B. S. (2013). Dinamica Project. Remote Sensing Center.University of Minas Gerais, Belo Horizonte, MG, Brazil. http://www.csr.ufmg.br/dinamica/ (accessed 17 January 2013).
Soares-Filho, B. S., Nepstad, D. C., Curran, L. M., Cerqueira, G. C.,Garcia, R. A., Ramos, C. A., Voll, E., McDonald, A., McDonald, P.,and Schlesinger, P. (2006). Modelling Conservation in the AmazonBasin. Nature 440: 520–523.
United States, USAID (United States Agency for InternationalDevelopment). (2013). News: Forest Carbon Suruí Project gainsvisibility. USAID, Washington, DC, U.S.A. <http://brazil.usaid.gov/pt/node/1406> (accessed January 2012).
VCS (Verified Carbon Standard). (2012). Jurisdictional and NestedREDD+(JNR). 2012. <http://v-c-s.org/JNRI>
Yanai, A. M., Fearnside, P. M., and Graça, P. M. L. A. (2012). AvoidedDeforestation in Brazilian Amazonia: Simulating the Effect of theJuma Sustainable Development Reserve. Forest Ecology andManagement 282: 78–91 doi:10.1016/j.foreco.2012.06.029.
Zhu, X., Møller, L. R., De Lopez, T., and Romero, M. Z. (2010).Pathways for implementing REDD+. Experience from CarbonMarkets and Communities. UNEP (United Nations EnvironmentProgramme) Risø Centre, Roskilde, Denmark. <http://www.acp-cd4cdm.org/media/237951/pathwaysimplementingreddplus.pdf>.
826 Hum Ecol (2013) 41:807–826