land use and its impact on the succulent karoo. · 2014-11-12 · land use and its impact on the...
TRANSCRIPT

LAND USE AND ITS IMPACT ON THE SUCCULENT KAROO. Zuziwe Jonas Submitted in fulfillment of the requirements of a degree of Masters of Science SUPERVISORS: Prof. Timm HOFFMAN.
Dr. Mathieu ROUGET. Botany Department Leslie Hill Institute for Plant Conservation University of Cape Town Rondebosch 7701 February 2004

ii
TABLE OF CONTENTS
ACKNOWLEDGEMENTS...................................................................................................IV
ABSTRACT ............................................................................................................................VI
CHAPTER 1 INTRODUCTION TO THE SUCCULENT KAROO BIOME.................... 1
BACKGROUND TO THE STUDY.................................................................................................. 1 INTRODUCTION........................................................................................................................ 3 PLANT BIODIVERSITY OF THE SUCCULENT KAROO BIOME ....................................................... 4 HISTORY OF LAND USE PRACTICES IN THE SK BIOME .............................................................. 5 LAND USE PRACTICES IN THE SK BIOME.................................................................................. 6
Urban settlement ................................................................................................................ 6 Mining ................................................................................................................................ 6 Agriculture (cropland and livestock production). .............................................................. 7 Conservation ...................................................................................................................... 8
LAND USE IMPACT AND THREATS ............................................................................................ 8 WHY HAS THIS STUDY BEEN UNDERTAKEN? ............................................................................ 9
Aims of the study and key questions ................................................................................. 10 Thesis structure ................................................................................................................ 10
CHAPTER 2 CURRENT EXTENT OF LAND USE PRACTICES IN THE SUCCULENT KAROO BIOME AND SUCCULENT KAROO ECOSYSTEM PLAN PLANNING DOMAIN........................................................................................................... 12
INTRODUCTION...................................................................................................................... 12 METHODOLOGY..................................................................................................................... 15
Source of data: land use................................................................................................... 15 SKEP workshops.......................................................................................................................15 National Land Cover (NLC) dataset..........................................................................................18 ENPAT dataset ..........................................................................................................................18 CSIR dataset ..............................................................................................................................18
Classification system ........................................................................................................ 19 GIS and statistical approach............................................................................................ 20
Protocol .....................................................................................................................................20 RESULTS AND DISCUSSION .................................................................................................... 22
Current extent of land use practices in the SK biome, SKEP domain, and SKEP sub-regions. ............................................................................................................................. 22
Urban settlement........................................................................................................................22 Mining .......................................................................................................................................22 Cropland production..................................................................................................................25 Livestock production.................................................................................................................26 Conservation..............................................................................................................................29
SKEP domain sub-regions................................................................................................ 30 IMPLICATIONS FOR BIODIVERSITY CONSERVATION ................................................................ 34
CHAPTER 3 LIVESTOCK PRODUCTION IN NAMAQUALAND: A COMPARISON OF STOCKING DENSITY ON PRIVATE AND COMMUNAL AREAS. ...................... 35
INTRODUCTION...................................................................................................................... 35 METHODOLOGY..................................................................................................................... 37
Study site........................................................................................................................... 37 Data sources..................................................................................................................... 40

iii
Livestock numbers and ownership ............................................................................................40 Rainfall: CCWR ........................................................................................................................40 NDVI .........................................................................................................................................40 Vegetation map..........................................................................................................................41 Mapping stocking rate ...............................................................................................................41 Analysis .....................................................................................................................................44
RESULTS................................................................................................................................ 44 Livestock production in communal areas......................................................................... 49 Livestock production on private farms............................................................................. 50 Current stocking rate in relation to rainfall, NDVI and vegetation type. ........................ 51
DISCUSSION........................................................................................................................... 53 Potential errors in the data .............................................................................................. 53 Animal numbers in communal areas and on private farms in Namaqualand.................. 53
IMPLICATIONS OF THE FINDINGS ............................................................................................ 56
CHAPTER 4 FUTURE PREDICTIONS OF AGRICULTURE IN THE SUCCULENT KAROO ECOSYSTEM PLAN PLANNING DOMAIN. ................................................... 57
MODELLING LAND USE CHANGES .......................................................................................... 57 Introduction ...................................................................................................................... 57 Modelling techniques of land use change ........................................................................ 58 Spatial determinants of land use ...................................................................................... 62 Land use and future predictions....................................................................................... 62 Limitations of modelling land use change: the issue of scale .......................................... 63
CASE STUDY: LAND USE MODELLING IN THE SUCCULENT KAROO ECOSYSTEM PLAN (SKEP) PLANNING DOMAIN. ............................................................................................................... 64
Introduction ...................................................................................................................... 64 Methodology..................................................................................................................... 66 Sources of data ................................................................................................................. 66
Computing Center for Water Research (CCWR). .....................................................................66 Environmental Potential Atlas of South Africa (ENPAT) ........................................................66 Succulent Karoo Ecosystem Plan Planning domain (SKEP) ....................................................67 Environmental variables............................................................................................................69 Statistical approach....................................................................................................................72
RESULTS AND DISCUSSION .................................................................................................... 77 Logistic regression model ................................................................................................ 77 Spatial extent of future land use transformation .............................................................. 80
What are the environmental correlates of cropland areas in the SKEP planning domain? .......80 Can statistical models and GIS be used to derive spatially explicit predictions of future agricultural land use in the SKEP planning domain? ................................................................81 Where do we expect future crops to be sown and why? ...........................................................82
Limitations of the model ................................................................................................... 84
GENERAL CONCLUSION .................................................................................................. 85
Current land use practices in the Succulent Karoo biome............................................... 85 Livestock production in Namaqualand............................................................................. 85 Agriculture potential ........................................................................................................ 86
REFERENCES ....................................................................................................................... 88

iv
Acknowledgements
I would like to thank Prof. Timm Hoffman and Dr Mathieu Rouget, my supervisors for their
incredible support, encouragement and advice throughout this Master degree. If it was not for
your support I couldn’t make it up to the final stage, especially after what happened to my
family during the course of the year when I was doing my analysis. Thank you so much for
making all the necessary arrangements for the project available to me.
Thank you to all my funders, the Botanical Society of South Africa, the National
Research Foundation and top-up bursaries from Dr Rouget. This thesis was based on the
SKEP project funded by Conservation International (CEPF). It has also been supported, in
part, by the MAPOSDA research project which is funded by the European Commission under
INCO-DC: International Cooperation with Development Countries (2000-2004), Contract No.
ERBIC18CT970162. However, the European Commission does not accept responsibility for
any information provided or views expressed. Thanks also to the Mazda Wildlife Vehicle
Fund for the use of a courtesy vehicle during the course of the study.
I would like to thank the Botanical Society staff members, Kristal Maze and Mandy
Driver, as well as Sarah Frazee from Conservation International for allowing me to use the
GIS facilities for the project and to attend the SKEP workshops. I also thank Glynnis
Barodien for GIS technical advice.
I am proud of the Botany department and LHIPC staff and students who welcomed me
with warm hands and made me feel at home throughout the study. Their support was so
incredible. Special thanks to Mandy Sauls, who made sure that I received my funding and the
necessary equipment for the project in time.

v
I would like to thank Elrina van Aardt for collecting the Namaqualand livestock data and
spending her quality time in mapping all the private farms of Namaqualand for this project.
Special thanks to Harry May from Surplus People’s project for sharing his expertise in
identifying the communal farms of Namaqualand. Also I would like to thank Nick
Lindenberg for his help and advice in GIS.

Abstract vi
Abstract
The Succulent Karoo biome (SK biome) is one of the 25 internationally recognized
biodiversity hotspots in South Africa with approximately 1940 endemic species. The SK
biome is, however, poorly conserved with less than 5% of the area under formal protection. It
is also highly threatened by a range of different land use practices. Considering the lack of
protected areas and the high levels of endemism (about 40%), which characterize the region,
the current and future land use practices are likely to be the key factors in determining the
future conservation of the area.
Understanding the land use pattern and its drivers that have occurred in the SK biome
provides a useful starting point for outlining the future research needs and establishing
conservation goals. This project investigates a range of different land use practices such as
urban settlement, mining, cropland, conservation and livestock production with their
associated environmental drivers. The study used a Geographical Information System (GIS)
to map the current extent of land use practices based on available data from different sources
in the SK biome. The study also mapped the current extent of livestock production in two land
tenure systems (private and communal) of Namaqualand and developed a statistical model to
assess the future agricultural potential in the SK biome.
The current status of the land use practices in the SK biome shows that most of its area
is used for extensive grazing (90%) followed by conservation (4.8%). Due to the aridity of
the area, agriculture potential is low. The results confirmed that the conservation status of the
SK biome is relatively low but improving, with 4.8% of the biome conserved. Only 3.5%,
however, is formally protected in statutory reserves. The remaining conserved area (1.3%) is
conserved in non-statutory reserves.

Abstract vii
A detailed assessment of stock density at the cadastral level in Namaqualand revealed
that 76 % of the communal farms are currently stocked below grazing capacity while 67% of
the private farms are stocked below grazing capacity. About 18% of the communal areas are
stocked above carrying capacity while 24% of the private farms are above the threshold set by
the Department of Agriculture. These results for both communal and private farms are
unexpected. The decrease in communal livestock has been facilitated by several factors such
as the drought in 1998 and 1999, the additional land given to the communal farmers (200 000
ha) as part of the national government’s land reform programme, and the fact that the
Department of Agriculture maintains strict control, not only over the way in which animals
are managed, but also in the number of animals permitted on the new land reform farms. This
chapter presents results very different from previous studies due to the accurate and fine-scale
mapping of livestock numbers.
Cropland expansion has been identified as one of the major land use pressures in the
study area. A statistical GIS model was used to estimate the areas of future agriculture
potential in the SKEP domain. Environmental land use drivers namely vegetation type, soil
type, and climatic variables were the key determinants identified by the model. The model
shows that agriculture potential is high in the Southern Karoo sub-region. This sub-region is
believed to have fertile soils on arable foothills and lowlands. According to this model, 31%
of the land is suitable for agriculture expansion but this percentage also includes the non-
agricultural areas that are overestimated by the model. Sustainable agricultural intensification
and a landscape planning approach to conservation are required to ensure biodiversity and
environmental sustainability in Namaqualand and the Succulent Karoo biome
Keywords: Agriculture potential, GIS, conservation planning, land use practices, livestock
production, Namaqualand, recommended stocking rate, Succulent Karoo.

Chapter 1 1
CHAPTER 1 Introduction to the Succulent Karoo biome.
Background to the study
The Succulent Karoo biome (SK biome) is one of twenty-five internationally recognized
biodiversity hotspots (Myers et al., 2000). It covers approximately 112 000 km², extending
through the southern and northwestern areas of South Africa and the southern Namibia
(Rutherford & Westfall, 1997) (Fig. 1.1).
Figure 1.1: The boundary of the Succulent Karoo biome (shaded area) in relation to Namibia and three South African provinces (Rutherford & Westfall, 1997).

Chapter 1 2
The planning phase of the SKEP project started in January to August 2002 and was led by
Conservation International’s Southern Africa Hotspot Programme. The goal of SKEP is to
provide an overarching framework to guide conservation efforts in the Succulent Karoo. It
aims to: 1. provide a hierarchy of priority actions to guide conservation goals, 2. build human
resource capacity to implement the plan by including training and mentorship activities as part
of the planning process, 3. generate the institutional and government support required to
ensure its effective implementation. Since the SKEP project was initiated over a short time
period I was given an opportunity, with this MSc project, to provide a detailed overview of
land use practices and their impacts in the area.
The SK biome does not exist in isolation and in order to capture the outliers of the
Succulent Karoo vegetation, and the transition zones between the SK biome and other
vegetation types, the planning domain for the Succulent Karoo Ecosystem Plan (SKEP) has
been made broader than the biome boundary itself (Fig. 1.2). These transition zones are
important for understanding the impact of ecological processes such as climate change (Driver
et al., 2003). The planning domain covers a wide area with different land use patterns in
different parts of the region, as well as different vegetation patterns and types. Because of
these differences, the SKEP planning domain has been divided into four sub-regions namely:
Namibia/Gariep, Namaqualand, Roggeveld/Hantam/Tanqua and the Southern Karoo.

Chapter 1 3
Figure 1.2: The Succulent Karoo Ecosystem Plan (SKEP) planning domain with the four sub-regions indicated.
Introduction.
Rainfall throughout the Succulent Karoo (SK biome) is less than 400 mm per year and occurs
predominantly in winter. During summer, temperatures in excess of 40 °C are common
(Desmet & Cowling, 1999; Myers et al., 2000). The terrain of the SK biome is flat to gently
undulating such as on the west coastal platform of the Knersvlakte and Tanqua Karoo. Hilly
and more rugged topography occurs in Namaqualand, the Robertson and Little Karoo and
parts of the Western escarpment. Altitudinal range is from sea level to about 1 500m, but

Chapter 1 4
most of the area lies below 800m (Low & Rebelo, 1996). The largest drainage systems are
the Tanqua-Doring – Olifants rivers and the Gouritz river and its relevant tributaries. Most
other rivers are small west-flowing systems including a relatively short section of the Orange
river. The majority of river courses in the biome contain short-lived seasonal rivers
(Rutherford & Westfall, 1986).
The geology of the SK biome includes shale, granite, quartz, and limestone. Quartz
patches (desert pavement formed by a dense layer of white quartz pebbles) are scattered
throughout the biome especially in the Knersvlakte and Little Karoo (Milton et al., 1997;
Schmiedel & Jurgens, 1999). Other geological units are the old basement complexes followed
by the Ecca Group and Dwyka Formation of the Karoo Sequence, the Quartenary and Tertiary
deposits and the Gariep Group of the Damara Supergroup (Rutherford & Westfall, 1986).
The SK biome soils are generally lime-rich, weakly developed soils on rock (Dean & Milton,
1999). Other soil groups include sands, undifferentiated alluvial plains and neutral soils of the
(red, yellow and grey) latosols plinthic catena (Rutherford & Westfall, 1986).
Plant biodiversity of the Succulent Karoo biome
The plants of the SK biome have adapted to cope with the summer aridity and the cool winter
growing season (Esler, 1993; Low & Rebelo, 1996;Milton et al., 1997). The vegetation is
dominated by chamaephytes, which are often succulent shrubs, of which the
Mesembryanthemaceae and the Crassulaceae are particularly prominent (Bredenkamp, 1996).
Phanerophytes are rare but include the well-known succulent tree, Aloe dichotoma in the north
of the SK biome (Rutherford & Westfall, 1986). The SK biome, especially Namaqualand, is
home to a phenomenal diversity of geophytes (for example in the genera Gladiolus, Sparaxis,
and Bulbinella). The SK biome contains 4 849 vascular plant species of which 1940 are
endemic to the biome (Driver & et al., 2002).

Chapter 1 5
History of land use practices in the SK biome
Hunter-gatherers of the Later Stone Age (LSA) began occupying the SK biome in larger
numbers from approximately 21 000 years ago, after the cooler glacial conditions that
preceded this time abated. These people hunted zebra, wildebeest and eland on the coastal
lowlands and played a part in the extinction of large grazing herbivores such as the hartebeest
and the giant buffalo, which were the components of this LSA fauna (Deacon, 1992).
A significant event, which facilitated the expansion of the human population in the SK
biome, was the introduction of the first domestic sheep, and later cattle and goats, by the
Khoikhoi herders about 2 000 years BP (Deacon, 1992; Boonzaier et al., 1996). The effects
that herders had on the SK biome’s landscapes and ecology are not quantifiable, but given the
estimated numbers of humans (50 000), cattle (250 000 to 500 000) and sheep and goats (up
to 1 million) by the mid seventieth century, this must have been significant (Deacon, 1992).
Soil erosion from diminished vegetation cover would have been an important disturbance
factor (Deacon, 1992).
In 1679 the Dutch authorities issued permits for land occupation to colonial settlers and
by 1760 farming extended throughout much of the SK biome. The colonists of the Western
Cape, who significantly influenced natural processes, and reshaped the region’s landscapes,
introduced two important agricultural developments to the region. These developments were
firstly the introduction of settled agriculture and secondly the use of the plough to cultivate the
soil and grow crops. The awarding of more permanent holdings to encourage farmers to settle
away from Cape Town (Penn, 1986) resulted in individual ownership of areas with the
concomitant potential for overstocking and overgrazing.

Chapter 1 6
Although much agricultural transformation had already occurred in the 18th and 19th
centuries, the 20th century saw an increase in this trend. Dramatic changes in agricultural land
use were introduced after the 1940s with the introduction of mechanized agriculture, which
saw an increasing shift from veld-based grazing to the cultivation of soil for artificial pastures
and cereal crops (Mustart et al., 1997). This shift is likely to have been enhanced further by
incentives to clear land for cultivation, which were made possible by legislation promulgated
in 1930, which served to protect South African producers (Hoffman, 1997). All the land use
practices (tourism, mining, grazing, and cropland), however, have changed dramatically in the
last 20 years.
Land use practices in the SK biome
A detailed analysis of each of the main land use practices is presented in chapter 2. What
follows is a brief summary of land use practices in the SK biome.
Urban settlement
Although it only occurs in a fraction of the area, urban settlement has been highlighted out as
one of the threats to the biodiversity of the SK biome. This is due to population growth,
which leads to agriculture expansion to meet the demand for food. This means that areas of
natural habitat are converted to other land uses. Collection of plant material for the medicinal
and horticultural trades also result from the expansion of urban settlements. This reduces the
abundance of certain species in the wild and may lead to extinction of some (Krohne & Steyn,
1990).
Mining
Although it only affects 1% of the biome, mining is a significant threat to biodiversity in the
SK biome as it irreversibly transforms landscapes making them unsuitable for plants (Milton

Chapter 1 7
et al., 1997). Limestone mining in the Knersvlakte is of great concern as limestone is a very
unusual habitat in the SK biome and supports a unique and rare flora (Bredenkamp, 1996).
The entire northern extension of the SK biome is mineral & diamond rich and with various
mining applications pending throughout the region, transformation as a result of mining
operations represents a great threat. New markets and discoveries of base metals such as zinc
and copper as well as gypsum and quartz deposits continue to transform large areas of limited
habitat types (Boonzaier et al., 2002).
Agriculture (cropland and livestock production).
Agriculture, which includes cropland and grazing, is the dominant land use in the SK biome.
Due to the lack of water, however the area has little agricultural cropland potential. The
mismatch of agricultural land use practices with the production potential of the land has
contributed to wide spread desertification in the arid and semi arid parts of South Africa
(Hoffman et al., 1999).
There are two main agricultural production systems in the SK biome: namely communal
areas and private farms. These two systems differ in history and land use practices.
Overgrazing on communal rangelands threatens the biodiversity of this region, as it results in
a change in plant composition with an increase in poisonous plants (Hoffman et al., 1999;
Todd & Hoffman, 1999). There are currently 14 communal areas in Namaqualand (Hoffman
et al., 1998). These communal areas are Concordia, Komaggas, Leliefontein, Mesklip,
O’Kiep/Nababeep, Pella, Pofadder, Port Nolloth, Richtersveld, Rietpoort, Soebatsfontein,
Springbok, Steinkopf, and the Witbank farms (Hoffman et al., 1999, chapter 3). Both
biophysical (rainfall, soil, topography, vegetation, and climate) and social driving forces
(economic, increasing population density, land tenure regime and institutional capacity) affect
the way in which the land is used in the communal areas.
Chapter 1 8
The largest part of the land in the SK biome currently belongs to private landowners
where extensive sheep and goat and to lesser extent cattle farming on natural rangeland
remains the major agricultural practice. The distribution of different livestock breeds in the
SK biome is determined largely by climate, especially rainfall and vegetation condition
(Hoffman et al., 1999; chapter 3).
Conservation
The SK biome has been internationally recognized as a biodiversity hotspot (Driver et al.,
2002, Myers et al., 2000). The conservation status of this region is, however, very poor, with
less than 5% of the area protected (Driver et al., 2003; Todd & Hoffman, 1999) and only 3.5
% of the biome conserved in statutory reserves. These reserves protect only 90 of the 900
Red Data Book plant species (Driver et al., 2002). With the lack of protected areas and the
high levels of endemism (40%), which characterize the SK biome, the current and future land
use practices are likely to have an important influence on the future conservation of the area
(Todd & Hoffman, 1999; chapter 2 & chapter 4).
Land use impact and threats
Today many land use practices are threatening the natural resources of this biome. These
include unsustainable agricultural practices, ill considered urban, industrial and mining
expansion, and the removal of plants by traders and unscrupulous collectors (van Jaarsveld et
al., 2000). Alien plants in the SK biome include the tree Prosopis spp and grasses such as
Bromus tectorum. Invasive alien plants and mammals also pose a threat to many areas in the
SK biome including the Sperregebiet in southern Namibia which supports more alien
mammals than in any other area in Namibia (Driver et al., 2002).

Chapter 1 9
Unsustainable agricultural practices impact on biodiversity in various ways. Small stock
farming is ubiquitous in the semi arid region and provides many people with their only source
of income. Heavy livestock grazing, however, negatively affects the vegetation resources
with a shift from palatable perennials to unpalatable plants particularly in the overstocked
communal lands. Heavy grazing in the communal lands has also resulted in a reduction in
total vegetation cover (Todd & Hoffman, 1999). This agrees well with other studies in arid
and semi-arid regions whereby heavy grazing was associated with a shift from perennial to
annual vegetation (Hoffman et al., 1999; Kuiper & Meadows, 2000).
Mining impacts also have serious implications regarding the diversity of plant species.
Large-scale mining completely transforms landscapes and makes rehabilitation very difficult
(Driver et al., 2003).
Why has this study been undertaken?
Most South African studies on land use practices (Hoffman et al., 1999; Driver et al., 2002)
are not spatially explicit. More research on the spatial information is needed in order to
understand current land use patterns and how they are likely to change in the future.
Spatially-explicit information on current and future land use patterns can be used by
ecologists, environmentalists and students conducting research, land use planners (including
conservation planners), and affected parties in order to prioritise research and actions for the
rich, yet threatened, flora and fauna of South Africa. Furthermore, there are no modelling
studies of future land use practices. This study provides spatial information on current land
use practices (including livestock production) and also develops a statistical GIS model
predicting the agricultural potential of the SK biome and likely future trends.

Chapter 1 10
Aims of the study and key questions
The overall aim of this study was to map the extent of current land use practices in the SK
biome and to derive agricultural land use scenarios for 2010.
In particular, this study aimed to achieve the following:
To assess the extent of current land use patterns (urban settlement, mining, cropland,
grazing, and conservation) in the SK biome with an emphasis on livestock production
systems in Namaqualand.
To develop and compare future land use scenarios based on expert knowledge and
statistical modelling in a Geographical Information System.
This dissertation answers the following questions:
What are the main land use types and subtypes in the SK biome?
What is the extent of each land use type in each sub-region (for South Africa only i. e.
Gariep/Namaqualand, Roggerveld\Hantam\Tanqua, and Southern Karoo)?
What is the extent of livestock production in the Namaqualand sub-region and how
does this compare to recommended thresholds set by the Department of Agriculture?
How do stocking rates differ between the communal areas and privately owned farms
in the Namaqualand sub-region?
Can statistical models and GIS be used to derive spatially explicit predictions of
future agricultural land use in the SKEP domain?
Thesis structure
The thesis consists of three main chapters and a general conclusion.
Chapter 2: Current extent of land use practices in the Succulent Karoo biome and
Succulent Karoo Ecosystem Plan (SKEP) planning domain.

Chapter 1 11
This chapter contains a descriptive account of the current land use practices in the Succulent
Karoo biome and SKEP planning domain.
Chapter 3: Livestock production in Namaqualand: a comparison of stocking density on
private and communal areas.
This chapter provides a detailed assessment of the number of small stock (sheep & goats)
currently occupying the communal areas and privately owned farming areas of Namaqualand.
It compares these two tenure systems in terms of the recommended grazing capacity estimates
suggested by the Department of Agriculture in the region.
Chapter 4: Future predictions of agriculture in the Succulent Karoo Ecosystem Plan
(SKEP) planning domain.
This chapter provides a model of land use change in the Succulent Karoo biome and an
evaluation of environmental driving forces that could influence agricultural change in the
region in the future.
Chapter 5: General Conclusion
This chapter details the main findings and conclusions of this study. It also points to the key
policy implications of this work for SKEP as well as for other land management initiatives
and institutions.

Chapter 2 12
CHAPTER 2 Current extent of land use practices in the Succulent Karoo
biome and Succulent Karoo Ecosystem Plan planning domain.
Introduction
The earth’s land surface has been substantially transformed due to the impact of urbanisation,
industrialization, cropland and livestock production (White et al., 1997). The transformation
of natural vegetation to other land uses, such as those mentioned in chapter 1 represents the
most important threat to biodiversity. Such biodiversity must be maintained and conserved as
it provides essential goods and services and is of aesthetic value (Wessels et al., 2002).
Most of the biodiversity-rich areas in the world face the problem of limited resources
for conservation, and there is an urgent need for identifying priorities for conservation actions
(Myers et al., 2000). Conservation efforts have focused on maintaining biodiversity primarily
by minimizing exposure to human activities through the establishment of networks of
protected areas (Myers et al., 2000). The long-term conservation of biodiversity is not
dependent only on the establishment of protected areas, but also on maintaining hospitable
environments and viable populations within managed land between protected areas (White et
al., 1997). Understanding the land use pattern and its drivers that have occurred in the
Succulent Karoo biome, provides a useful starting point for outlining future research needs,
establishing conservation goals and targeting ecological restoration efforts, and can be used
immediately in local land-use planning efforts to conserve biodiversity (Hoffman & Ashwell,
2001; Driver et al., 2003).
The study area, which is derived from the Succulent Karoo Ecosystem Plan planning
domain (excluding Namibia) (hereafter referred to as the SKEP domain) covers
approximately 192 205 km² while the Succulent Karoo biome (excluding Namibia) (hereafter

Chapter 2 13
referred to as the SK biome) (Rutherford, 1997) is 91 839 km² in extent. Namibia has been
excluded from this analysis because of the difficulties in obtaining comparative land use data.
Three sub-regions of the SKEP domain are recognized in the South African portion of the
SKEP domain. These are Gariep/Namaqualand, Roggeveld/Hantam/Tanqua, and Southern
Karoo. Current land use practices, especially livestock production, are of primary concern to
the biodiversity of the SK biome where extremely high levels of plant endemism are found.
These endemics are concentrated in four centres that fall within the SKEP domain. Three of
these centres are in the Gariep/Namaqualand sub-region and one in the Southern Karoo sub-
region (van Wyk & Smith, 2001). Local and point plant endemics, however, are found
throughout the region (Desmet & Cowling, 1999).
Understanding the current pattern of land use practices and how land use patterns
respond to environmental drivers is a research question of considerable importance in the SK
biome. This chapter presents the results of current land use patterns in the SKEP domain, SK
biome and the sub-regions of the SKEP domain. It aims to answer the following questions:
1. What are the main land use practices in the region?
2. How can these land use practices be integrated within a consistent and hierarchical
classification system?
3. What is the extent of each land use practice in the SKEP domain, SK biome and in each
sub-region of the SKEP domain?

Chapter 2 14
Table 2.1: Reclassified land use categories in the Succulent Karoo biome using a hierarchical classification system based on Thompson (1996). Land use classes are arranged from most to least transformed areas.
1 ENPAT= Environmental Potential Atlas of South Africa 2 NLC= National Land Cover 3 SKEP coordinators= Succulent Karoo Ecosystem Plan coordinators who gathered data on different land use practices in regional workshops. 4 CSIR = Council for Scientific and Industrial Research 5 LSU = large stock unit
Broad land use categories
Land use sub categories Source of data
Urban settlement Urban ENPAT¹
Diamonds
Unspecified
Heavy metal
Mining
Other
NLC², SKEP³ coordinators,
GEOSCIENCE
Wheat (monoculture)
Wheat (polyculture)
Lucerne (monoculture)
Lucerne (polyculture)
Orchards (export table grapes, wine, fruits, olives)
Cropland
Unspecified crop
ENPAT, NLC, SKEP coordinators
<6.0 ha\LSU5
6.1-10.0 ha\LSU
10.1-17.0 ha\LSU
17.1-33.0 ha\LSU
Grazing
>33.0 ha\LSU
CSIR, Scholes (1998)
National Park National Heritage Site
State Forest Provincial Reserve
Private Nature Reserve Municipal Nature Reserve Mountain Catchment Area
Wilderness Area Conservancy
Conservation
Unspecified
ENPAT, NLC, SKEP coordinators

Chapter 2 15
Methodology
Source of data: land use
The current extent of land use practices, namely, urban settlement, mining, cropland,
livestock production and conservation were mapped at 1:250 000 scale from available
knowledge of the region. Sources were the Succulent Karoo Environmental Plan (SKEP)
workshops held during 2002, the National Land Cover (NLC) dataset, the Environmental
Potential Atlas of South Africa (ENPAT 2001), and the Council for Scientific and Industrial
Research (CSIR) grazing capacity model.
SKEP workshops
The first dataset was derived from a series of SKEP workshops held in the three sub-regions
of the SKEP domain during 2002. Participants were selected from different government
departments as well as local farmers, with expert information about land use practices in the
region. At each workshop the coordinators were required to draw a polygon or a point on an
overlay map identifying areas of current land use (e.g. cropland). The overlay map was
digitized using Arc View GIS 3. An accompanying datasheet gave information about each
polygon. An attribute table containing a more detailed breakdown of each land use type (e.g.
specific crop-type cultivated) was added. The major land use practices identified in this
process were urban settlement, mining, cropland, livestock production and conservation.

Chapter 2 16
Figure 2.1: Broad land use categories for the Succulent Karoo Ecosystem Plan (SKEP) planning domain. The enlarged section indicates an area where all five-land use categories are in evidence.
0 100 200 300 400 KilometersN
ConservationLivestock production
Urban settlement
SKEP planning domainSouth Africa
Broad land use categories
MiningCrop production

Chapter 2 17
Figure 2.2: Broad land use categories for the Succulent Karoo biome outlined in broad detail above. The enlarged section indicates an area where all five-land use categories are in evidence.
0 100 200 300 KilometersN
Broad land use categories
ConservationLivestock production
Mining
Succulent Karoo biomeSouth Africa
Crop production
Urban settlement

Chapter 2 18
National Land Cover (NLC) dataset
The NLC data (see Thompson, 1996) was used as the base map for all the land use practices
that were digitized from the SKEP data. The information for each land use practice that fell
within the SKEP domain was clipped from the NLC data. The NLC data identified the
following land use categories: commercial/industrial, residential, mining, cultivated land,
forestry, commercial farming, subsistence farming, conservation and vacant /unspecified
land. The NLC data categories and boundaries were refined in the SKEP workshops.
ENPAT dataset
The ENPAT (2001) dataset was used for the urban settlement layer of the region and for
categorical environmental factors such as geology and soil.
CSIR dataset
Grazing capacity data was obtained from the CSIR, where Scholes’ (1998) model was used
for the recommended grazing capacity in South Africa. This model used raster modelling
procedures to integrate the effects of the different factors in a realistic, empirically verified
way, and to guarantee that the mapped areas are homogenous within a given range limit. The
South African grazing capacity layer was clipped to the SKEP domain and then combined
with the layers obtained from the SKEP domain, NLC and ENPAT data sources to produce a
final GIS layer with urban settlement, mining, cropland, livestock production and
conservation categories.

Chapter 2 19
Classification system
The SKEP maps (Fig. 2.1 & Fig. 2.2) were classified according to their broad and relevant
land use classes and from this I developed a hierarchical classification system. A structured
hierarchical format offers a high degree of flexibility and also provides the user with the
ability to accommodate different levels (or sources) of information. Broad level classes
represent aggregates of more detailed (often user-specific) sub-classes, or several sub-
aggregate classes that can be re-combined into completely new aggregate classes (Thompson,
1996). I used the following five broad classes: urban settlement, mining, cropland, livestock
production, and conservation, each of which was then subdivided into between 1 and 5 sub-
classes (Table 2.1, Fig. 2.1 & Fig.2.2).
The category urban settlement includes rural settlements and urban areas, minor roads
and construction sites. Mining includes quarries and mines, which were classified according
to the mineral extracted (e.g. diamonds and heavy metals). Cropland production consists of
the cultivation of crops, including land used for annual field crops such as wheat, perennial
field crops (e.g. lucerne) and, tree and shrub orchards. Livestock production represents the
land used for animal production on natural veld (desert, grassland, shrublands) and includes
planted pastures used for grazing animals. Five livestock production sub-classes were
decided according to the grazing capacity estimates derived from Scholes (1998).
Conservation areas consist of 10 sub-categories including proclaimed national, provincial and
municipal conservation areas as well as state land (Hoffman & Ashwell, 2001).

Chapter 2 20
GIS and statistical approach
Protocol
The GIS layers were joined together using the union tool in Arc View 3.2. The GIS layers
were then clipped for the SKEP domain and SK biome. GIS layers for each land use category
with its associated sub-category and the broad land use layer for SKEP and the SK biome
were produced.
I calculated the area (in ha) of each land use category and sub-category using XTools in
Arc View. Then the statistical attribute table containing information on the total area covered
by each broad land use and its sub-category was exported to an Excel spreadsheet file. I
produced summary graphs and tables in order to understand the current extent of each land
use category and sub-category in the region.

Chapter 2 21
Figure 2.3: Map of the SKEP domain showing current areas of urban settlement (data are from ENPAT, 2001).
0 100 200 300 400 Kilometers
N
SKEP planning domainUrban settlementSouth Africa

Chapter 2 22
Results and Discussion
Current extent of land use practices in the SK biome, SKEP domain, and SKEP sub-
regions.
Urban settlement
Although urban settlement is one of the causes of biodiversity loss in the SK biome, it
comprises less than 150 km² of the SKEP domain and 76 km² of the SK biome (Fig. 2.1).
The area occupied by urban settlement is highest in the Southern Karoo, next highest in
Gariep/Namaqualand and lowest in the Roggeveld/Hantam/Tanqua sub-regions. Areas of
highest urban settlement usually attract more people resulting in increased population growth.
More land, therefore needs to be given to people for building houses and other land use
practices. This increase in area intensively used by people could lead to biodiversity loss in
the sub-region. The Southern Karoo sub-region is one of the areas that are characterized y a
relatively high rainfall and rich soils and vegetation (see chapter 4). These are areas that have
a high biodiversity, and according to previous researchers, major threats to biodiversity are
found in areas where there is human interaction (Cowling et al., 1999). In this regard
community-based conservation can be of best practice in the sub-region. The results also
indicate that the Southern Karoo sub-region is heavily grazed and cropped (this chapter).
Therefore it is clear that by 2010, urban settlement will expand due to population growth and
the demand for more cropping areas. The trade in medicinal plants will also likely increase,
bringing increased threats to the biodiversity of the region.
Mining
Mining areas are found predominantly along the coast of the Gariep/Namaqualand sub-
region. Diamond mining activities cover more than half (837 km²) of the total mining area in
Chapter 2 23
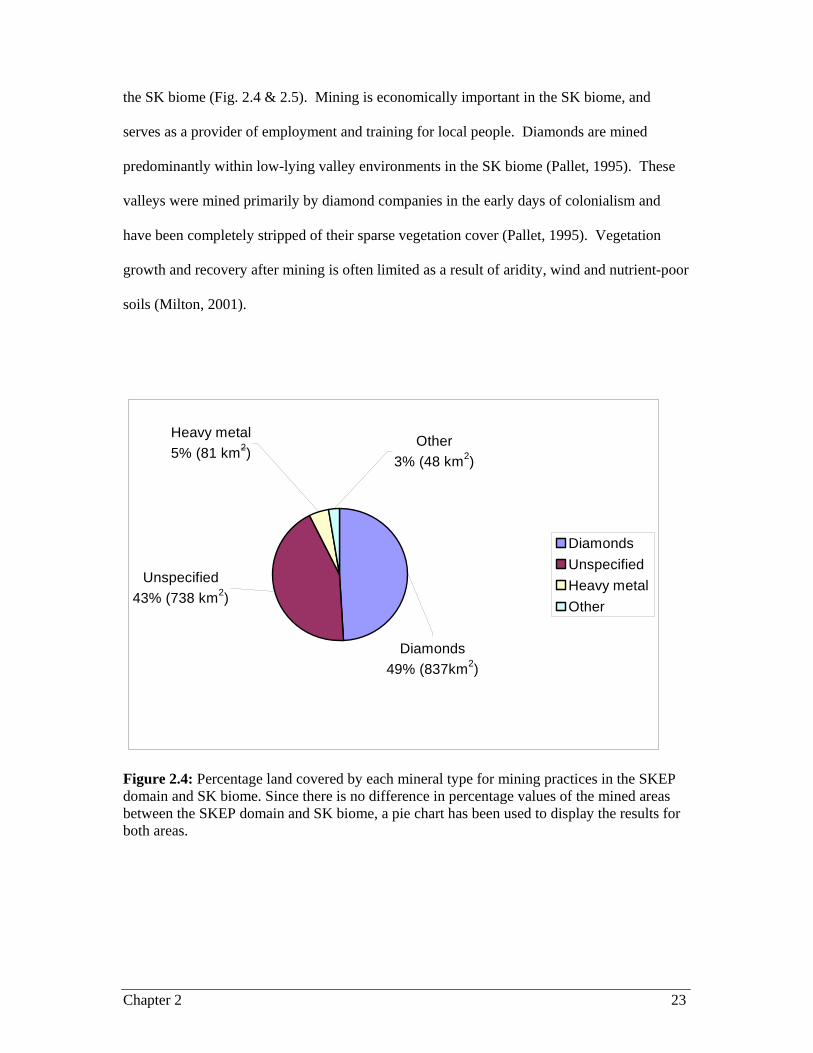
the SK biome (Fig. 2.4 & 2.5). Mining is economically important in the SK biome, and
serves as a provider of employment and training for local people. Diamonds are mined
predominantly within low-lying valley environments in the SK biome (Pallet, 1995). These
valleys were mined primarily by diamond companies in the early days of colonialism and
have been completely stripped of their sparse vegetation cover (Pallet, 1995). Vegetation
growth and recovery after mining is often limited as a result of aridity, wind and nutrient-poor
soils (Milton, 2001).
Other3% (48 km2)
Diamonds49% (837km2)
Unspecified43% (738 km2)
Heavy metal5% (81 km2)
DiamondsUnspecifiedHeavy metalOther
Figure 2.4: Percentage land covered by each mineral type for mining practices in the SKEP domain and SK biome. Since there is no difference in percentage values of the mined areas between the SKEP domain and SK biome, a pie chart has been used to display the results for both areas.

Chapter 2 24
Figure 2.5: Map of the SKEP domain showing all the current mined areas. The enlarged area indicates that portion of the Gariep/Namaqualand sub-region where all four mining activities are undertaken.
N
0 100 200 300 400 Kilometers
MiningDiamondHeavy metalOtherUnspecified
SKEP planning domainSouth Africa

Chapter 2 25
Cropland production
Most high rainfall areas are transformed by cropland production in the SKEP domain, SK
biome and SKEP sub-regions. This transformation has led to a decrease in the biodiversity of
the SKEP domain, and SK biome even though cropland areas only constitute 6, 784 km² of
the SKEP domain and 3, 046 km² of the SK biome (Fig. 2.6 & 2.7). Cropland production
areas are distributed evenly across the entire landscape of the SKEP domain, SK biome, and
in the SKEP sub-regions (Fig. 2.7).
0500
1000150020002500300035004000
Whe
at (M
onoc
ulture
)
Whe
at (P
olycu
lture)
Luce
rne (M
onoc
ulture
)
Luce
rne (P
olycu
lture)
Orchard
s
Unspe
cified
crop
Tota
l are
a (k
m2 )
SKEPSK
Figure 2.6: Percentage land covered by each crop type in the SKEP domain and SK biome
Wheat (as a monoculture crop) covers 10% of the cropland areas in the SKEP domain,
and covers 6% in the SK biome. Orchards cover 10% of the cropland areas in the SKEP
domain and only 3% in the SK biome. Wheat is grown primarily in the higher-lying
mountains of the Namaqualand sub-region (Desmet & Cowling, 1999) (Fig. 2.7). Other crop
types cover only a small area (< 7%) in both the SKEP domain and the SK biome. For

Chapter 2 26
example, lucerne (as a monoculture crop) is the least cultivated crop and accounts for only <
1% of the SKEP domain and the SK biome.
Currently, the Southern Karoo has been subjected to the highest levels of transformation
by cropland production (Fig. 2.7) due to the proximity of perennial streams draining into the
major basins where cropland occurs (Hilton-Taylor, 1994; Rebelo, 1997). About 67% of the
SKEP domain and 33% of the SK biome cropland production areas were classified as
unspecified. The unspecified cropland areas were cultivated areas identified in the National
Land Cover database, but for which specific crops could not be identified during the SKEP
coordinator workshops. Major reasons for cropland expansion in these areas are discussed in
detailed in chapter 4.
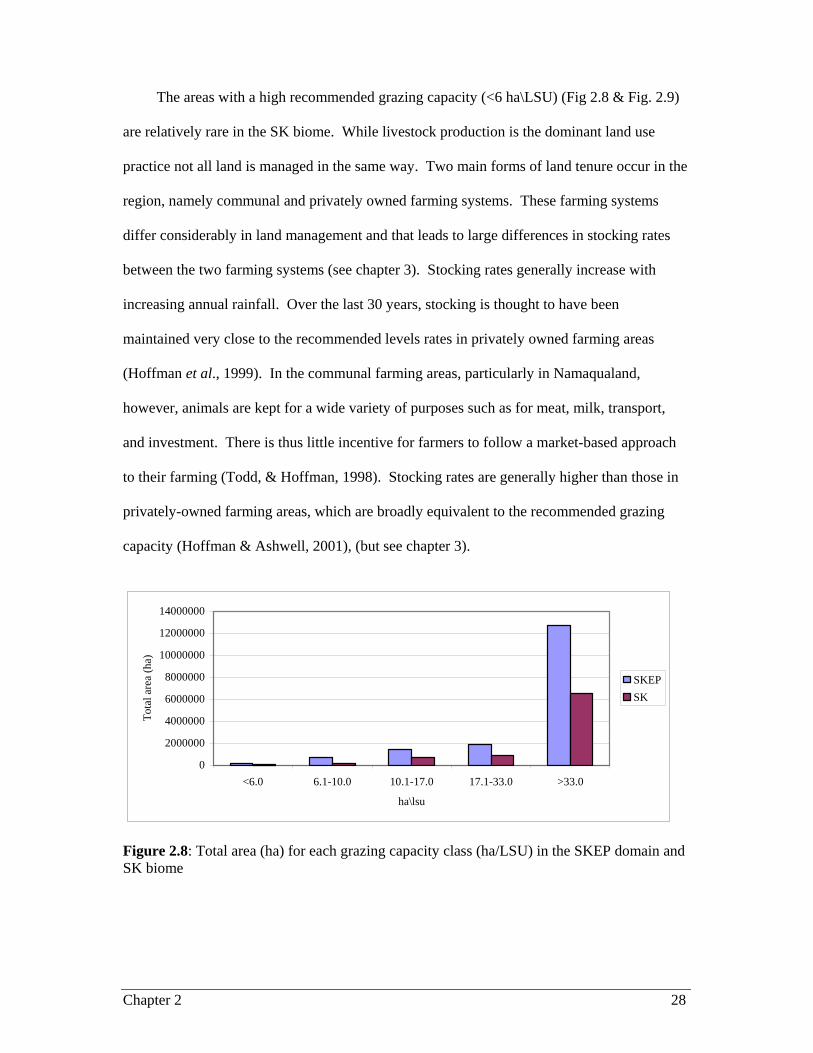
Livestock production
Livestock production is the major land use type in the SKEP domain, SK biome and SKEP
sub-regions (Table 2.2 & Fig.2.8). The grazing capacity data derived from Scholes’ (1998)
model, shows that 1267 8460 ha of the SKEP domain and 654 6140 ha of the SK biome has a
recommended grazing capacity of >33 hectares per large stock unit (ha\LSU) (Fig. 2.8 & Fig
2.9). Areas with a recommended grazing capacity between 17.1-33.0 and 10.1-17.0 ha/LSU
are similar between the SKEP domain and the SK biome (10-11%). The districts found at the
arid end of the SK biome aridity gradient, tend to have a greater area of grazing land than the
less arid magisterial districts. Therefore, the Gariep/Namaqualand, and Southern Karoo sub-
regions (especially in the west) generally possess lower grazing capacities (Hoffman &
Ashwell, 2001).

Chapter 2 27
Crop production
Wheat (Polyculture)
Lucerne (Polyculture)
OtherUnspecified crop
Lucerne (Monoculture)
Wheat (Monoculture)
SKEP planning domainSouth Africa
Orchards
0 100 200 300 400 KilometersN
Figure 2.7: Map of the SKEP domain showing the areas that are currently used for crop production. The enlarged section indicates an area where all seven cropland sub-types are present.
Chapter 2 28
The areas with a high recommended grazing capacity (<6 ha\LSU) (Fig 2.8 & Fig. 2.9)
are relatively rare in the SK biome. While livestock production is the dominant land use
practice not all land is managed in the same way. Two main forms of land tenure occur in the
region, namely communal and privately owned farming systems. These farming systems
differ considerably in land management and that leads to large differences in stocking rates
between the two farming systems (see chapter 3). Stocking rates generally increase with
increasing annual rainfall. Over the last 30 years, stocking is thought to have been
maintained very close to the recommended levels rates in privately owned farming areas
(Hoffman et al., 1999). In the communal farming areas, particularly in Namaqualand,
however, animals are kept for a wide variety of purposes such as for meat, milk, transport,
and investment. There is thus little incentive for farmers to follow a market-based approach
to their farming (Todd, & Hoffman, 1998). Stocking rates are generally higher than those in
privately-owned farming areas, which are broadly equivalent to the recommended grazing
capacity (Hoffman & Ashwell, 2001), (but see chapter 3).
0
2000000
4000000
6000000
8000000
10000000
12000000
14000000
<6.0 6.1-10.0 10.1-17.0 17.1-33.0 >33.0
ha\lsu
Tota
l are
a (h
a)
SKEPSK
Figure 2.8: Total area (ha) for each grazing capacity class (ha/LSU) in the SKEP domain and SK biome

Chapter 2 29
In the Gariep/Namaqualand sub-region about 3, 380 km² is used for communal livestock
farming, primarily in the Richtersveld. Within the Richtersveld Agricultural Development
Plan (Oppel, 2002), a number of issues linked to agricultural problems in the area were
identified. These were: land degradation (evident throughout the Richtersveld primarily as a
result of overgrazing, uncontrolled livestock numbers which exceeded the recommended
grazing capacity, insufficient feed supplies to stock during drought) and surface mining
(Oppel, 2002). In Namaqualand, commercial sheep farming with Dorpers is commonly
practiced on privately-owned farms while in the communal lands sheep, goats and donkeys
are the dominant domestic animals (Boonzaaier et al., 2002).
It has been suggested that a decrease in the stocking rate of the SKEP domain and the
SK biome over the last 100 years reflects a decrease in the primary productivity of the region
and this may reflect widespread desertification in the Karoo as a whole (Dean & MacDonald,
1994).
Conservation
Given its global significance as a biodiversity hotspot (Cowling & Pierce, 1999), and its
recognition as a conservation priority (Hilton-Taylor 1994; Rebelo, 1997), the Succulent
Karoo biome is relatively poorly conserved (Cowling & Lombard, 1998) (Fig.2.10 & 2.11).
With 4.8% conserved in total (Table 2.2), only 3.5% is formally protected in statutory
reserves (national parks and provincial reserves). The remaining conservation areas are non-
statutory reserves such as municipal reserves and conservancies. Perhaps of more concern is
the fact that the formally protected areas do not adequately represents the biodiversity
patterns and processes of the biome (Driver et al., 2003).

Chapter 2 30
Table 2.2: Summary statistics of the percent of area occupied by current land use practices in the SKEP domain, SK biome, and the SKEP domain sub-regions.
Broad land use categories Area Total
area (km2)
Urban settlement
(%)
Mining (%)
Cropland (%)
Grazing (%)
Conservation (%)
SKEP domain 192 000
0.1 0.9 3.5 87.6 8.0
SK biome 91 000
0.1 1.7 3.3 90.1 4.8
SKEP domain sub-regions
Gariep/ Namaqualand
62 000
0.1 2.7 3.4 89.5 4.3
Roggeveld/Hantam/ Tanqua
44 000 <0.1 0.0 2.6 88.9 8.5
Southern Karoo
86 000 0.1 0.0 4.1 85.5 10.3
The current conservation status of the SK biome has been improved significantly in the
last 20 years (Fig. 2.11). The Richtersveld National Park is currently the largest section of
protected land within the Gariep/Namaqualand sub-region and was proclaimed in January
1994. It covers approximately 1, 624 km² and remains the main tourist attraction within the
area (Oppel, 2002). In Namaqualand there are two formally conserved areas: The Namaqua
National Park (600 km²), proclaimed in January 1994 and added to since then and the
provincial reserve, Goegap Nature Reserve (150 km²) comprised of several farms. The first
farm, Karéhoute Kloof, was proclaimed on 17 August 1990 and the second, Melkboschkuil
on 12 April 1994 (Boonzaaier, et al., 2002).

Chapter 2 31
Figure 2.9: Map of the SKEP domain showing the recommended grazing capacity levels for the region (adapted from Scholes’ 1998 model).

Chapter 2 32
0
500
1000
1500
2000
2500
3000
3500
4000
Nation
al Park
Nation
al Heri
tage S
ite
State F
orest
Provinc
ial re
serve
Private
Natu
re Rese
rve
Munici
pal N
ature
Reserve
Mounta
in Catc
hmen
t Area
Wild
erness
Area
Conser
vanc
y
Unspeci
fied
Tota
l are
a (k
m2 )
SK EPSK
Figure 2.10: The total area and percentage land covered by each conservation category for the SKEP domain and SK biome.

Chapter 2 33
ConservationNational ParkNational Heritage SiteState Forest
Private Nature ReserveMunicipal Nature ReserveMountain Catchment AreaWilderness AreaConservancyUnspecified
SKEP planning domainSouth Africa
Provincial reserve
N
0 100 200 300 400 Kilometers
Figure 2.11: Map of the SKEP domain showing all the areas that are currently conserved. The enlarged section indicates an area where all 10 conservation sub-types are present.

Chapter 2 34
Implications for biodiversity conservation
Since much of the SK biome’s biodiversity has been severely transformed by land use
practices, especially grazing (Hoffman & Ashwell, 2001), it is regarded as one of the 25
internationally recognized biodiversity hotspots (Myers et al., 2000). Land use practices that
will further threaten the biodiversity of the region are, as follows: the expansion of
communally owned land and associated overgrazing and desertification; mining for diamonds
and heavy metals and cropland expansion, especially in the valleys of perennial rivers. In
addition to these land use practices, the effects of global climate change and the illegal
collection of succulents and geophytes are likely to have a major negative influence on the
biodiversity of the Succulent Karoo biome (Cowling & Pierce, 1999; Rutherford et al., 1999).
Efforts to conserve biodiversity remain relatively weak due to a lack of integration of
conservation goals into development plans. Therefore conservationists would do best to work
with development authorities if they have explicit plans for biodiversity conservation on a
landscape scale. Such plans would need to map out how and where conservation and socio-
economic goals can be addressed together. Government authorities (including the
conservation, environment, agriculture and tourism sectors) and other planners can use
detailed data and criteria to understand the trade offs between the placement of specific
infrastructure projects and the potential impact of that placement on threatened species
(Sanderson et al., 2003).

Chapter 3 35
CHAPTER 3 Livestock production in Namaqualand: a comparison of
stocking density on private and communal areas.
Introduction
In terms of the area used, grazing is the most important land use in Namaqualand and the
Succulent Karoo biome (see chapter 1). However, natural grazing is usually insufficient in
the arid zones, and herd owners often have to resort to feed supplements, particularly during
droughts (De Pauw et al., 2000). Heavy grazing pressure may have a negative impact on
vegetation by directly increasing the mortality rate among established adult plants (Hunt,
2001) and by reducing the competitive ability of grazed shrubs (Milton et al., 1997a; Riginos
& Hoffman, 2003). Because of these processes, grazing may result in the altered dominance
of perennials in favour of annuals (Todd & Hoffman, 1999). This change in vegetation from a
perennial shrubland to an annual- and geophyte-dominated flora results in changed patterns of
productivity (Cowling et al., 1994; Huenneke & Noble, 1996).
Heavy grazing not only affects the vegetation in Namaqualand. With heavy grazing, the
area of soil covered by shrub species decreases, exposing a larger proportion of bare soil to
erosion and nutrient loss. As open soils have a lower nutrient content compared to the soil
under vegetation, the total soil nutrient budget for the heavily grazed area decreases as the
area occupied by shrubs decreases (Allsopp, 1999). Bare soils are common in areas that have
been overgrazed.
The issue of environmental degradation has been noted but there is a debate as to
whether observed changes in vegetation are attributable to rainfall or to grazing by domestic
livestock. The extreme annual climatic fluctuations in arid and semi arid environments make
it particularly difficult to distinguish between grazing and climatic effects in the region, and

Chapter 3 36
few studies have managed to effectively separate the impacts of these factors (livestock,
production, and rainfall) (Dean & Macdonald, 1994; Dodd, 1994; Seymour & Dean, 1999).
The significant decrease in stocking rates for domestic livestock in Namaqualand over the last
100 years (Dean & MacDonald, 1994) is thought to reflect degradation and it has been
suggested that the threat to biodiversity from overgrazing is most severe in communally
grazed land (Cowling & Hilton-Tylor 1994; Cowling & Pierce, 1999). Rangeland
degradation and its influence on ecological processes could, therefore, have important
repercussions for the people of Namaqualand (Hoffman et al., 1999).
Previous studies have found that people, livestock grazing practices and the conservation
of Namaqualand are inextricably linked (Todd & Hoffman, 1999). The current stocking rate
in the semi-arid and arid rangelands of Southern Africa is determined by utilizable primary
productivity of rangelands (Dean & MacDonald, 1994). Grazing capacity is the desired
stocking rate for a given land management objective. Stocking rate is the flock of sheep,
goats and herd of cattle usually expressed as x-number of hectares per animal since the
capacity of natural pastures of South Africa to carry stock is so low on account of the low
rainfall and the arid nature of the larger part of South Africa (du Toit, 2002).
Hoffman et al., (1999) suggest that, for the past 30 years, the Paulshoek communal area
in Namaqualand has had a stocking rate at least twice that of neighbouring, privately-owned
farms, which have been stocked at the recommended grazing capacity threshold set by the
Department of Agriculture. This has resulted in marked differences between communal and
private farms in both densities of vegetation and dominant plant species (Todd & Hoffman,
1999).
Although Namaqualand has attracted the attention of researchers because of its unique
biological features (Dean & MacDonald, 1994; Milton et al., 1997b; SPP, 1997; Todd &

Chapter 3 37
Hoffman, 1999; Cowling et al., 1999; Seymour & Dean, 1999; Desmet & Cowling 1999), few
systematic surveys have been undertaken (Dean & McDonald, 1994; SPP, 1997; Todd &
Hoffman, 1999). Even fewer studies have occurred at cadastral level, which provides a
spatially explicit analysis of land use pattern. The outbreak of scab in Namaqualand in 2002
led to a district-wide dipping programme by the Department of Veterinary Services, which
gave an opportunity to record stocking rate at the cadastral level. In this study, I mapped the
private farms and communal farms with their respective stocking rate in a Geographical
Information System (GIS), with the aim of answering the following questions:
1. How do stocking rates differ between the communal areas and privately-owned
farms in the Namaqualand sub-region?
2. What is the extent of livestock production in Namaqualand and how does this
compare to the recommended thresholds set by the Department of Agriculture?
3. Which areas are “at grazing capacity”, “below grazing capacity” and “above grazing
capacity”?
4. How does stocking rate relate to rainfall, land cover and vegetation type?
Methodology
Study site
Namaqualand forms part of the Succulent Karoo biome (Cowling et al., 1999; Desmet &
Cowling, 1999), and is formally defined as a magisterial district within the old Cape Province
of South Africa (Rutherford & Westfall, 1986; Milton et al., 1997b). The region investigated
in this chapter forms part of Namaqualand and is about 34 852 km² in extent (Fig. 3.1). It is
comprised of more than 330 privately-owned farms and 14 main communal areas, which have
significantly increased their area since 1994 as a result of the national government’s land

Chapter 3 38
reform programme. Although mining companies also own a significant portion of
Namaqualand, these areas were not investigated here because there were no data.
Namaqualand is a mild desert and its annual rainfall varies from about 50mm in the
northwest to more than 400mm in the Kamiesberg (Cowling et al., 1999). It is characterized
by winter rainfall of less than 150 mm per annum (Rutherford & Westfall 1986; Cowling et
al., 1999). The geology of Namaqualand is extremely complex. The mountainous desert in
the northwest, the Richtersveld, comprises a varied sequence of pre-Gondwana rocks that
were extensively intruded at least a billion years ago, by granite and gneiss of the Namaqua
Metamorphic Province. The level coastal plain (the Sandveld) consist of a complex sequence
of marine and wind blown sands ranging from weathered and fine-grained deposits of late
Tertiary age to the recent white and calcareous sands of the coastal margin (Cowling et al.,
1999; Desmet & Cowling, 1999).
The area is well known for its spectacular displays of spring flowers and high diversity
and endemism of bulbous flowers (Cowling et al., 1999; Boonzaier et al., 2002). Succulents
are extremely well represented in the Namaqualand flora and are associated with many of the
larger families (Mesembryanthemaceae, Asteraceae, Crassulaceae, Geraniaceae,
Euphobiaceae, and Asclepiadaceae (Cowling et al., 1999). Namaqualand harbours about 10%
of the world’s succulent species (van Jaarsveld, 1987).
In addition to its diversity, the region contains large zones of transitional vegetation
between succulent karoo and fynbos habitats. These zones are considered crucial for the
conservation for both species diversity and for providing a buffer against climate change
(Boonzaier et al., 2002).

Chapter 3 39
Land tenureCommunal farmOther landusePrivate farm
0 30 60 90 120 Kilometers
N
Figure 3.1: A land tenure map for the study area. Communal areas incorporate previous Act 9 areas, municipal commonage land as well as land recently purchased as part of the national governments land reform programme. Areas classified as being used for “other land uses” were not included in this study.

Chapter 3 40
Data sources
Livestock numbers and ownership
An outbreak of scab in 2002 necessitated a region-wide dipping programme under the
auspices of the Department of Veterinary Services in the Northern Cape Province’s
Department of Agriculture. At each dipping tank used, the number and type of animal (cattle,
sheep, and goats) was noted and ownership determined. The farm boundaries where each
herd was resident were hand drawn on the Namaqualand base map by Elrina van Aardt, the
resident veterinary officer for the region and person responsible for the dipping programme.
Both private and communal farm boundaries were drawn, and linked to an excel spreadsheet
containing information on the farmer, farm names, and livestock numbers (cattle, sheep, and,
goats). The total area in hectares and total numbers of livestock per farm was calculated for
each farm captured in a GIS. For farmers who possessed more than one farm, livestock
numbers were divided proportionately between farms. The number of ha required per large
stock unit (LSU) was calculated by taking the area in hectares divided by livestock numbers
and multiplied by the LSU value obtained from the Department of Agriculture. The LSU
value for sheep was = 0.15, goats = 0.17 and cattle = 1.1.
Rainfall: CCWR
A layer of rainfall data obtained from the Computing Centre for Water Research (CCWR)
(Shulze, 1997) was clipped onto the Namaqualand boundary and analysed in Arc View 3 GIS
to understand the relationship between annual rainfall and stocking rate.
NDVI
A Normalized Difference Vegetation Index (NDVI) layer was obtained from the Agricultural
Research Council with each land cover type (bare soils, low vegetation, medium vegetation

Chapter 3 41
and high vegetation) classified. NDVI values between 0-33 were classified as bare soil; 33-72
low vegetation; 73-106 medium vegetation and 106-255 were classified as high or dense
vegetation. This layer helped to assess how much of the area (in hectares) of each land cover
type was covered by each grazing capacity category (above, at, and below grazing capacity).
Vegetation map
Low & Rebelo’s (1996) vegetation map with different vegetation types, namely Mountain
Fynbos, North-western Renosterveld, Upland Succulent Karoo, Lowland Succulent Karoo,
Strandveld Succulent Karoo, Bushmanland, Orange River Nama Karoo (Fig. 3.2) was used to
understand how much of the area in hectares of each vegetation type was covered by each
grazing capacity category (above, at, and below grazing capacity).
Mapping stocking rate
The base maps for private and communal farms were digitized in Arc View GIS. Livestock
numbers per farm were then assigned to the relevant polygon. On-screen digitizing of
unidentified private farms was done using the Namaqualand cadastral deed for 2002 which
was obtained from the Department of Agriculture. Farms with the same owner name were all
considered to be the property of the owner whether they were adjacent to each other or not.
The recommended grazing capacity base maps, obtained from the Department of
Agriculture, were also digitised in Arc View GIS (Fig. 3.3). The maps contained information
about the recommended grazing capacity for a particular area.

Chapter 3 42
Vegetation types (after Low & Rebelo 1996)Mountain FynbosNorth-western Mountain RenosterveldUpland Succulent KarooLowland Succulent KarooStrandveld Succulent KarooBushmanland Nama KarooOrange River Nama Karoo
0 30 60 90 120 KilometersN
Figure 3.2: Vegetation map of the study area (after Low & Rebelo (1996)).

Chapter 3 43
45
72
4854
60
96
42
90
120
90
606072
54
42
60
Recommended (ha\lsu)0-4849-8081-96120
0 30 60 90 120 KilometersN
Figure 3.3: The recommended stocking rate for Namaqualand (expressed in ha\LSU) as recommended by the Department of Agriculture (digitised from 1:250 000 topographic maps).

Chapter 3 44
Analysis
The current stocking rate and recommended grazing capacity maps for Namaqualand,
digitised from 1:250 00 topographic maps in the Department of Agriculture’s offices in
Springbok, were produced (Fig. 3.3). The current stocking rate map was linked to the
recommended grazing capacity map to assess which farms were “above”, “at”, and “below,”
the recommended grazing capacity (using +/- 5% error rate). Factors such as rainfall, land
degradation, and NDVI were analysed in relation to the 3 grazing categories mentioned
above. The communal farms were analysed according to the main communal areas in the
region and private farms were analysed according to Low & Rebelo’s (1996) vegetation types.
Results
The study area consists of 322 private farms and 46 communal farms (grouped into 14 main
communal areas), each covering half of the study area (Fig. 3.1, Table 3.1 & Table 3.2). Fig.
3.4 indicates the current stocking rate (ha\LSU) in Namaqualand as determined from the 2002
census. Sheep are the dominant animal type on the private farms while goats are more
common than sheep in the communal areas. About 76% of the communal farms and 67% of
the private farms are currently stocked below grazing capacity, while 18% of the communal
farms and 24% of the private farms are above grazing capacity and 7% of the communal
farms and 8% of the private farms are at grazing capacity (Fig. 3.5, Fig. 3.6).

Chapter 3 45
Table 3.1: Livestock numbers and recommended stocking rate (ha/LSU) in the communal areas of Namaqualand.
Name of communal area
Total number of polygons Area (ha) No. Sheep No. Goats No. Cattle LSU
Actual ha\LSU
Mean recommended
ha\LSU
Mean above or below (-)
recommended values
Leliefontein 18 213736 8621 19391 354 3952 54 50 -7
Steinkopf 8 490353 18092 7196 0 3937 125 66 -88
O'Kiep/Nababeep 4 38830 1522 3404 0 806 48 54 11
Pella 3 186652 4112 7321 0 1862 100 78 -29
Concordia 2 175360 21056 7276 0 4394 40 60 33
Richtersveld 2 515849 6730 11417 0 2951 175 110 -60
Springbok 2 2197 77 126 0 33 67 54 -23
Komaggas 1 69374 4238 6139 0 1680 41 59 30
Mesklip 1 2169 186 118 0 48 45 54 16
Pofadder 1 13088 475 815 0 210 62 53 -18
Port Nolloth 1 15464 139 74 0 34 455 71 -541
Rietpoort 1 2864 80 257 0 56 51 45 -14
Soebatsfontein 1 12751 242 122 4 61 209 54 -287
Witbank 1 12189 832 577 0 223 55 96 43
Total for communal areas 46 1750876 66402 64233 358 20247 1527 903 -69

Chapter 3 46
Table 3.2: Livestock numbers and recommended stocking rate (ha/LSU) in the privately-owned farms of Namaqualand according to Low & Rebelo’s (1996) vegetation types.
Vegetation
Total number
of polygons Area (ha) No. Sheep No. Goats No. Cattle LSU
Actual ha/LSU
Mean recommended
ha/LSU
Mean % above or below (-)
recommended values
Upland Succulent Karoo 119 535984 120285 9828 4282 10864 49.3 50 2
Bushmanland 78 683463 136154 4048 2068 14638 46.7 48 2
Lowland Succulent Karoo 77 338234 62438 5750 1366 5814 58.2 48 -20
Orange River Nama Karoo 15 85855 16993 2118 193 1176 73.0 60 -21
Sand Plain Fynbos 12 46141 12497 1401 9 1129 40.9 45 9
North-western Mountain Renosterveld 11 23101 5947 1917 100 1027 22.5 45 50
Strandveld Succulent Karoo 10 19157 3434 166 21 303 63.2 45 -41
Total for private farms 322 1731936 357748 25228 8039 34951 353.8 342 -18

Chapter 3 47
Figure 3.4: Current stocking rate (ha\LSU) in Namaqualand as determined from a survey carried out in 2002 by the Department of Agriculture’s Veterinary Services division in the region
0 30 60 90 120 Kilometers
N
Stocking rate (ha\lsu)-99<4040 - 8080 - 120>120

Chapter 3 48
Figure 3.5: Stocking rates in the communal and private farms in relation to the recommended stocking rate (see also Fig. 3.3). The data are divided into 3 grazing capacity (GC) categories (above GC, at GC, and below GC) with an error rate of +/-5% used.
Stocking rate Above GCAt GCBelow GCOther landuse
0 30 60 90 120 KilometersN

Chapter 3 49
Figure 3.6: The percentage area of communal and private farms in relation to three stocking rate classes (above grazing capacity, at grazing capacity, and below grazing capacity).
Livestock production in communal areas
Most livestock are found in the Leliefontein communal area, which is comprised of 18 farms
(Table 3.1). The total number of livestock in Leliefontein is 28 366 animals. Goats (19 391)
are the most commonly farmed livestock followed by sheep (8 621) and cattle (354). Cattle
are least common in the communal farms and are only rarely found in Leliefontein and
Soebatsfontein. The Steinkopf communal area, with only 8 farms mapped, has 25 288
livestock in total, with sheep (18 092) being the dominant animal type and then goats (7 196).
The Richtersveld is also one of the communal areas that supports more than 10 000 animals.
Total livestock in this communal area is 18 147 with goats (11 417) more common than sheep
(6 730). Pella consists of 3 farms with a total of 11 433 animals. Goats (7 321) are more
common than sheep (4 112).
About 18 % of the communal farms in 2002 were stocked above the recommended
grazing capacity (Fig. 3.5 & Fig. 3.6). Ten of the farms in the Leliefontein communal area,
three in Steinkopf, and two in O’Kiep/Nababeep area are stocked above the recommended
grazing capacity. Pella, Springbok, Komaggas, Witbank & Mesklip all have one farm stocked
0102030405060708090
100
Communal farm Private farm
Perc
enta
ge a
rea
cove
red
by e
ach
graz
ing
cate
gory Above GC
At GCBelow GC
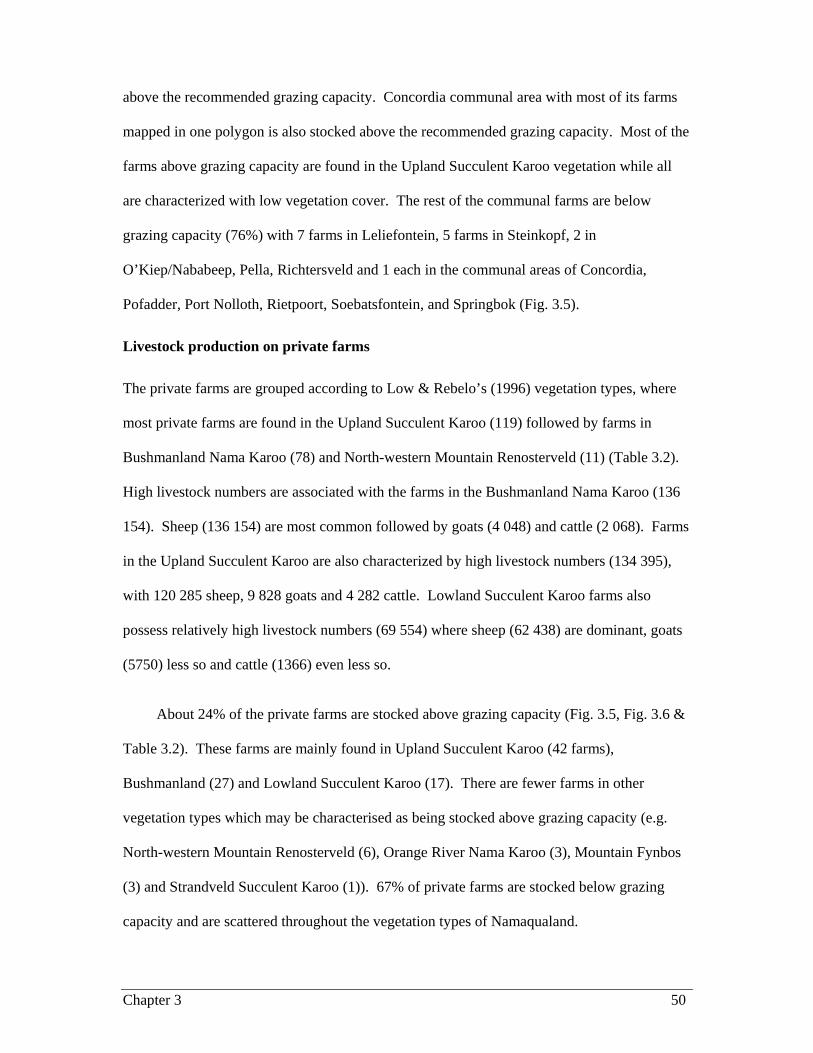
Chapter 3 50
above the recommended grazing capacity. Concordia communal area with most of its farms
mapped in one polygon is also stocked above the recommended grazing capacity. Most of the
farms above grazing capacity are found in the Upland Succulent Karoo vegetation while all
are characterized with low vegetation cover. The rest of the communal farms are below
grazing capacity (76%) with 7 farms in Leliefontein, 5 farms in Steinkopf, 2 in
O’Kiep/Nababeep, Pella, Richtersveld and 1 each in the communal areas of Concordia,
Pofadder, Port Nolloth, Rietpoort, Soebatsfontein, and Springbok (Fig. 3.5).
Livestock production on private farms
The private farms are grouped according to Low & Rebelo’s (1996) vegetation types, where
most private farms are found in the Upland Succulent Karoo (119) followed by farms in
Bushmanland Nama Karoo (78) and North-western Mountain Renosterveld (11) (Table 3.2).
High livestock numbers are associated with the farms in the Bushmanland Nama Karoo (136
154). Sheep (136 154) are most common followed by goats (4 048) and cattle (2 068). Farms
in the Upland Succulent Karoo are also characterized by high livestock numbers (134 395),
with 120 285 sheep, 9 828 goats and 4 282 cattle. Lowland Succulent Karoo farms also
possess relatively high livestock numbers (69 554) where sheep (62 438) are dominant, goats
(5750) less so and cattle (1366) even less so.
About 24% of the private farms are stocked above grazing capacity (Fig. 3.5, Fig. 3.6 &
Table 3.2). These farms are mainly found in Upland Succulent Karoo (42 farms),
Bushmanland (27) and Lowland Succulent Karoo (17). There are fewer farms in other
vegetation types which may be characterised as being stocked above grazing capacity (e.g.
North-western Mountain Renosterveld (6), Orange River Nama Karoo (3), Mountain Fynbos
(3) and Strandveld Succulent Karoo (1)). 67% of private farms are stocked below grazing
capacity and are scattered throughout the vegetation types of Namaqualand.

Chapter 3 51
Current stocking rate in relation to rainfall, NDVI and vegetation type.
High rainfall areas, areas with high NDVI values and dominated by North-western Mountain
Renosterveld generally have more livestock than recommended by the Department of
Agriculture in the region (Fig. 3.7, Fig. 3.8 & Fig. 3.9). Livestock numbers are high in areas
of high rainfall especially in the south of Namaqualand and most of these farms (communal
and private) are grazed above grazing capacity. Bare soils and low vegetation cover classes
derived from the Normalized Difference Vegetation Index (NDVI), are evident in most areas
that are grazed below grazing capacity.
North-western Mountain Renosterveld and to some extent Bushmanland may be
considered overstocked (Fig. 3.9). The other vegetation types have less than 20% of their area
currently stocked above the recommended stocking rate threshold.
0
10
20
30
40
50
60
70
80
90
100
0-50 51-100 101-150 151-200
% a
rea Above GC
At GCBelow GC
Figure 3.7: The percentage area of each grazing capacity category (above grazing capacity, at grazing capacity and below grazing capacity) in each of four mean annual rainfall classes (mm/yr) in Namaqualand.

Chapter 3 52
0
10
20
30
40
50
60
70
80
90
100
Bare soils Low vegetation Medium vegetation
% a
rea Above GC
At GCBelow GC
Figure 3.8: The percentage area of each grazing capacity category (above grazing capacity, at grazing capacity and below grazing capacity) in relation to each of three land cover classes in Namaqualand as derived from the Normalised Difference Vegetation Index (NDVI).
0102030405060708090
100
Mounta
in Fyn
bos
North-w
estern
Renost
erveld
Upland
Succu
lent K
aroo
Lowlan
d Suc
culen
t Karo
o
Strand
veld
Succu
lent K
aroo
Bushman
land
Orange
River N
ama K
aroo
% a
rea Above GC
At GCBelow GC
Figure 3.9: The percentage area of each grazing capacity category (above grazing capacity, at grazing capacity and below grazing capacity) in relation to seven vegetation types (after Low & Rebelo (1996)) in Namaqualand.

Chapter 3 53
Discussion
Potential errors in the data
There are several potential sources of error in the data, which could affect this analysis.
Firstly, the census might have only included a portion of the total stock in Namaqualand and
might reflect, therefore, only some of the animals in the region. This is unlikely, however
because scab is a very contagious disease and for a dipping campaign to be effective, all
animals need to be treated. The Department of Veterinary Services went to great lengths to
ensure that their campaign was as comprehensive as possible. An independent check on stock
numbers for the village of Paulshoek revealed a difference of only 10 animals out of a total of
3 000 for the village.
A second potential source of error could lie in the allocation of stock numbers to
individual farmers and their farm areas. While every effort was made to minimize this
problem it is possible that some incorrect allocations were made. Ownership of land is an
extremely dynamic process and cadastral maps do not keep pace with changes on the ground.
Finally, I could not establish information on farmers who might have held property
outside the region and used these areas as part of their management system. The influence of
this factor needs to be investigated further.
Animal numbers in communal areas and on private farms in Namaqualand.
Livestock numbers and proportions of the dominant animal breeds differ considerably in the
two land tenure systems. Sheep are dominant on private farms, while goats are dominant in
the communal areas. Cattle are frequent on private farms but are almost entirely absent from
most of the communal areas and were only recorded in Leliefontein and Soebatsfontein.

Chapter 3 54
This current stocking rate analysis is very different from previous studies (SPP, 1977;
Hoffman et al., 1999). It shows that the communal farms are generally stocked below grazing
capacity when compared to private farms. The stocking rate is also unexpectedly high in
private farms, which have more farms stocked above the recommended grazing capacity when
compared to the communal farms.
Unlike earlier accounts (Dean & McDonald, 1994; SPP, 1997; Todd & Hoffman, 1998
Allsop, 1999; Todd & Hoffman, 1999; Hoffman et al., 1999), which have suggested that the
communal areas in Namaqualand are overstocked, this study has shown that 76% of the
communal farms are stocked below grazing capacity when compared to only 67% of private
farms. The high number of animals on the private farms is surprising since previous studies
have suggested that private farms are generally stocked either at or below the recommended
grazing capacity. Data from this study suggest that many private farms contain more animals
than recommended by the Department of Agriculture in the region. Less than 7% of the
communal farms are at grazing capacity while 8% of the private farms have maintained the
recommended grazing capacity provided by the Department of Agriculture.
Reasons for the high stocking rates on private farms could be because the official
stocking rate data as reflected in tax returns and agricultural census, are not accurate (Dean &
MacDonald, 1994). The real numbers of livestock on the land may be far in excess of those
reported in agricultural returns. For example, the number of lambs in a herd is often not
reported, game animals are often estimated conservatively and livestock belonging to farm
labourers have often been ignored in the past. There have also been few censuses of stock
numbers on private farms at farm scale in the past and this study has shown the importance of
fine-scale surveys.

Chapter 3 55
Stock numbers are significantly lower in communal areas in general when compared to
previously surveys (e.g. SPP, 1997). In many areas, total stock numbers are now less than
half the total population of animals that were counted in earlier surveys. Two main
explanations could account for these differences.
Firstly, the decrease in livestock numbers on communal farms might be because of the
severe drought, which occurred in the region during 1988 & 1999. Herd numbers in 2002
were still recovering from the large-scale death of many animals, particularly in the
communal areas of Namaqualand. Animals in the communal areas were also affected more
by this drought than those on the private farms because of the generally lower perennial shrub
cover on communal areas (Todd & Hoffman, 1999; Hoffman et al., 1999). They would also
not have increased as quickly as herds on the private farms following average or near average
rainfall in the region in 2000 and 2001. One reason for this is that vegetation condition and
productivity are significantly lower in the communal areas than on the private farms (Todd &
Hoffman, 1999).
A second, and probably more important reason for the lower stocking rates now evident
on communal areas when compared to previous surveys is that additional land has been given
to communal farmers as part of the national government’s land reform programme in the
region. Since 1994, communal land area has increased on average by 24% (200 000ha)
(Department of Agriculture, 2001). Although farmers with larger herds generally utilize the
“new farms”, the Department of Agriculture maintains strict control, not only over the way in
which animals are managed (e.g. stock posts are discouraged, donkeys are not allowed), but
also in the number of animals permitted on the new land reform farms.

Chapter 3 56
Implications of the findings
It is not surprising that communal livestock is declining and that this trend will continue in the
future. The Department of Agriculture and municipalities have generally increased their
control over the communal area grazing systems in the last five years. Stock numbers, in
particular, are controlled especially on the newly-acquired land reform farms. While any
infrastructural provisions such as roads and stock water points might exacerbate the negative
environmental effects by encouraging further resources use beyond the carrying capacity of
the land (De Pauw et al., 2000) the Department of Agriculture is aware of this and is
attempting to limit stock numbers. There is a need for long term survey of stock numbers and
vegetation condition, particularly at fine-scale. This is because the private farms might be a
problem in the future. The Department of Agriculture also should consider updating the
recommended grazing capacity thresholds from time to time as changes (e.g. drought,
livestock mortality and rainfall variability) influence this figure considerably.

Chapter 4 57
Chapter 4 Future predictions of agriculture in the Succulent Karoo
Ecosystem Plan planning domain.
Modelling land use changes
Introduction
Several modelling techniques have been used to understand the drivers of land use change and
for predicting future changes (Rounsevell et al., 2000). Gaining a better understanding of the
ways that land use practices are evolving is a priority concern of the global change research
community. Models allow one to evaluate the sensitivity of land use systems to different
drivers of change (such as environmental and socio-economic factors), and identify which
drivers and processes are most important (Rounsevell et al., 2002). These models provide
information about the geographic scope and impact of land use change and can be used by
resource planners to identify the areas that require priority attention for conservation (Verburg
et al., 1999).
Differentiating between the terms land cover and land use is of importance in this study.
Land cover consists mainly of the vegetation (natural or planted) and man-made constructions
(buildings), which occurs on the earth surface. Water, ice, bare rocks and sand, are also
considered as land-cover classes (FAO, 1994). Land use can be defined as involving both the
manner in which the biophysical attributes of the land are manipulated and the intent
underlying that manipulation or as the purpose for which the land is used (Turner et al., 1995).
Forestry, cultivated crops, conservation practices, livestock herding and fertilizer application
are examples of land use classes (Turner et al., 1995). The main focus of this study is on land
use.

Chapter 4 58
This chapter analyses the environmental determinants of land use and models agriculture
potential in the SKEP planning domain. I first review land use modelling studies, focusing on
the types of modelling approaches, the land use determinants used, and the limitations of land
use models. Then, I present a model of agriculture potential for the Succulent Karoo
Ecosystem Plan (SKEP) planning domain.
Modelling techniques of land use change
Modelling land use change is increasingly required as a key component in simulations of
environmental processes such as land degradation (Folly et al., 1996), climate change (Dale,
1997) and hydrology (Matheussen et al., 2000). Such models are suitable for scenario
analysis or impact assessment and may provide guidance to sustainable land resource
planning management and conservation planning (Kok, 2001; Rouget et al., 2003).
Modelling, especially if done in a spatially explicit and multi-scale manner, is an
important technique for predicting future land uses, conducting experiments that test our
understanding of key processes, and describing the problem in quantitative terms. Land use
models should be exhaustive in the factors that affect land use practices and should be based
on an analysis of the system at various scales (Kok & Winogard, 2002). Many different
modelling approaches have been adopted for studying land use change (Velkamp & Lambin,
2001). This chapter focuses on spatially explicit land use models (Table 4.1).
Spatial land use models often use decision rules to describe the relationship between
land use and human and biophysical factors. These decision rules are used to allocate
predicted changes in land use (Verburg et al., 1999). These models aim at integrating diverse
temporal and spatial scales to represent ecological system dynamics at the landscape level
(Costanza et al., 1990).

Chapter 4 59
Table 4.1: Characteristics of spatial land use change models used in previous studies. Model category
Model approach What it explains Data required Scale Strengths Weaknesses References
Empirical, statistical
Multivariate statistical modelling, spatial statistics (GIS based models)
Why in the past? (Proximate causes) Where in the future? (Short term)
Land use type, land-use determinants
Local, Regional
Increases understanding of factors behind recent land use patterns. Allows projection of future land use patterns.
Human decision-making not explicitly considered. Errors are likely from misclassification of data at grid level or misalignment of map feature boundaries, and also from limited knowledge of historical land use patterns
Baker 1989; Gilruth et al., 1995; Rouget et al. 2003
Stochastic Transition probability models
Transition between land cover types. Simulate land use change
Land use type, land-use determinants
Local Model shows processes, output (new land use map)
Land Use Change Analysis System tended to fragment the landscape for low proportion land uses due to the pixel-based independent grid method. Patch based simulation would cause less fragmentation but patch definition requirements often lead to their degeneration into single cell patches.
Berry et al., 1996
Optimization Deterministic & stochastic optimization models
Where, how fast in the future? (Underlying causes; scenarios)
Land use type, determinants
National Incorporates agriculture and forest land uses. The model is dynamic, thus changes in one-decade influence land use change in the next decade. Good for long term policy impacts
Broad scale means that land capability variations within regions are not taken into account.
Adams et al., 1996

Chapter 4 60
Table 4.1 (cont.) Model category
Model approach What it explains Data required Scale Strengths Weaknesses References
Cellular Automata
Agent based, analytical, economic
Why in the future? (Underlying causes) Change in land use over time
Existing land use data, remotely sensed imagery, extent of land use, elevation, slope, and roads.
Regional Allows each cell to act independently according to rules, analogous to city expansion as a result of hundreds of small decisions. Fine scale data, registered to a 30m UTM grid.
Does not explore human decisions that lead to spread of built areas. Does not yet include biological factors.
Clarke et al., 1998; Kirtland et al., 2000; Britaldo et al., 2002
CLUE Multi-scale, spatial analysis, allocate land use changes, attempts to account for the entire system of complex interactions between historic and present land use, land use drivers
Identify priority areas for planning. Predict land cover in the future.
Spatially explicit data on the biophysical & socio- economic factors, Land use data, biophysical data- on soil conditions, relief and climate
National and Regional
Covers a wide range of biophysical and human drivers at differing temporal and spatial scales
Limited consideration of institutional and economic variables
Veldkamp & Fresco 1997, Pontius et al., 2001

Chapter 4 61
Table 4.1 summarizes the main types of spatial land use models. Empirical statistical
simulation and GIS based models attempt to identify explicitly the causes of land use changes
using multivariate analyses. These models are best suited to predict the changes in land use
pattern (Verburg et al., 1999). Other types of land use models have been developed such as
optimisation and cellular automata. Optimisation models based on linear programming have
been used mostly in agricultural land use studies (Verburg et al., 1999). Cellular automata
models have been used to predict future land use development under existing spatial plans
and policies, and to compare land use planning and policy scenarios in terms of their effects
on future land use development (Barredo et al., 2003). The land use models are limited by
different factors such as the scale at which the model has been performed. The major
limitation of the empirical statistical model is that human decision-making is not explicitly
considered. It also fails to explain historical land use patterns.
The CLUE model (Conversion of Land Use and its Effects) attempts to account for the
differences between historic and present land use, socio-economic conditions and biophysical
factors (Veldkamp & Fresco, 1996; Schoorl et al., 1997). The CLUE model operates at two
spatial-scales: fine (regional) and coarse (national) scales. At a relatively coarse scale it is
used to calculate the general trends of the changes in land use pattern and to capture the
influence of land use drivers. Based upon the general pattern of land use change calculated at
this coarse allocation scale, but taking local constraints into account, the land use pattern is
calculated at a finer level of scale. Depending on the application, the area studied and data
availability, resolution of analysis will vary. For example, a spatial resolution of 9 x 9 km in
Ecuador was chosen for the fine scale and 36 x 36 km for the coarse scale (Verburg et al.,
1999).

Chapter 4 62
In the case of the SKEP planning domain, the statistical GIS models will be applied to
understand the drivers of agricultural land use change and predict the future agriculture areas.
Spatial determinants of land use
Land use is a function of multiple factors such as culture and settlement patterns, economic
factors and environmental characteristics (Black et al., 1998). Understanding the spatial
pattern of land use and its determinants is critical in monitoring changes and in assessing
sustainable land management (Melloul & Collin, 2003). The land use determinants can be of
various types such as biotic (vegetation), abiotic (climatic conditions), and socio economic
(population density) (Kok et al., 2001). The most commonly used land use determinants in
previous studies include environmental factors such as climate, geology, soil, and topography,
distance to the rivers, socio-economic variables such as food demand, policy reform and
technology level and social variables such as population size, population growth, and
population density.
Land use and future predictions
A better understanding of the factors determining land use can help predict future land use
changes (Verburg et al., 1999). Many studies have developed models of land use change to
project and quantify future land use (see Riebsame et al., 1994;Verburg et al., 1999;
Veldkamp & Lambin, 2001). Other studies have assessed the loss of habitat as the main
cause of decline in biodiversity due to land use practices (agriculture and urbanization) (see
Noss et al., 1997; Wilcove et al., 1998; Myers et al., 2000; Rouget et al., 2003). Other
studies estimate risks to biodiversity by looking at the impact of future landscape alternatives
on species distribution and abundance (see White et al., 1997).
The human use of land alters the structure and functioning of ecosystems, and
influences how ecosystems interact with the atmosphere, aquatic systems and surrounding

Chapter 4 63
land (Verburg et al., 1999). Natural habitats are threatened by future habitat loss due to
agricultural expansion, as mentioned above (Wilcove et al., 1998; Rouget et al., 2003). For
example in the Cape Floristic Region, future changes in land use (agriculture - including
plantation forestry, and alien vegetation) were singled out as the major threat to biodiversity
of the region. The impacts were greatest on lowlands habitats especially those that have level
topography, fertile soils and where rainfall was sufficient for agriculture. Land
use/conservation planning is needed to avoid all these conflicting land use practices.
Planning is an integrative field. It collects information from a broad range of disciplines
and synthesizes that information with community objectives into a plan to guide future land
use in a region (Crist et al., 2000). However, only recently have studies attempted to identify
these patterns in a spatially explicit manner in relation to biodiversity patterns (Pressey et al.,
1996; White et al., 1997; Higgins et al., 1999; Abbit et al., 2000; Rouget et al., 2003).
Pressures on biodiversity shows no sign of slowing down, yet resources for conservation
action are limited. Therefore, planners need to be strategic to focus their efforts where they
will have the greatest impact (Driver et al., 2003). Detailed knowledge of achieving these
threats to biodiversity should be an essential component of conservation planning (Driver et
al., 2003; Rouget et al., 2003). The main reason for this is that conservation planning must
operate within the constraints of current and likely future land use changes (transformed land
usually has very low conservation value, and areas with high transformation potential are
problematic for incorporating into reserve networks) (Margules & Pressey, 2000; Myers et
al., 2000; Pressey and Cowling, 2000; Rouget et al., 2003).
Limitations of modelling land use change: the issue of scale
The issues of scale are considered to be very important and have been reported in most land
use modelling studies. Scale is defined as both the limit of resolution where a phenomenon is
discernible and the extent that the phenomena is characterized over space and time (Kok,

Chapter 4 64
2001). Spatial resolution refers to the smallest geographic unit of analysis for the model, such
as the size of a cell in a raster grid system. Spatial extent describes the total geographic area
to which the model is applied.
Land use changes occur as a result of the complex interaction between human and the
environmental factors that act over a wide range of spatial and temporal scales (Verburg et
al., 1999). Models are constrained by the quality of the environmental factors (geology, soil,
rainfall, and topographic variables) used in any analysis, and the spatial scale at which they
have been collected (Stein et al., 2001). The spatial scale of observations can influence the
relations between land use patterns and the biophysical and socio-economic factors
(Veldkamp & Fresco, 1996; De Koning et al., 1999). For example, in areas with a rugged
topography, land use patterns are closely related to topography when analysed at fine scale
while these patterns are primarily determined by climatic conditions at coarser scale (Verburg
et al., 1999).
Case study: land use modelling in the Succulent Karoo Ecosystem Plan
(SKEP) planning domain.
Introduction
Agriculture is the most important land use practice in the SKEP planning domain and has
changed considerably in recent times (Desmet & Cowling, 1999; Hoffman & Ashwell, 2001).
Climatic conditions have been implicated as a primary factor affecting agricultural land use in
most arid regions (Desmet & Cowling, 1999; Hoffman & Ashwell, 2001). The SKEP
planning domain is one of the richest biodiversity hotspot in the world with most of its
biodiversity occurring in unprotected areas (Wessels et al., 2002; see Chapter 1). Identifying
habitats susceptible to future transformation (Myers et al., 2000; Rouget et al., 2003) can help
prioritise conservation actions. Habitats that are already modified should receive more

Chapter 4 65
protection effort than those relatively free of human activities (such as agricultural land,
urbanization) (Rouget et al., 2003). One strategy for implementing conservation decisions is
to select areas on the basis of irreplaceability (contribution of the area in terms of
conservation goal) and vulnerability (risk of the area being transformed) (Pressey et al., 1996;
Rouget, et al., 2003).
Little attention has been given to identifying, in spatially explicit terms (Wilcove et al.,
1998), the factors that influence different agricultural land use practices, and how these are
likely to change in the future. The first step, however, in projecting potential future changes
in agricultural land use in the SKEP planning domain is to be able to understand the
environmental correlates that control current land use distributions (see chapter 2). This
chapter presents an approach to modelling the spatial distribution of agricultural land use
(cultivated crops only) at a biome scale. The objectives of this chapter are to identify drivers
of agricultural land use in the SKEP planning domain and to identify areas of future
agriculture potential.

Chapter 4 66
This chapter specifically aims to answer the following questions:
1. What are the environmental correlates of cropland production areas in the SKEP planning
domain?
2. Can statistical models and GIS be used to derive spatially explicit future agricultural land
use scenarios in the SKEP planning domain?
3. Where do we expect future crops to be sown and why?
Methodology
The approach was based on a statistical modelling approach using a Geographical
Information System. The model in this study has been used to evaluate the relationship of
cropland areas to environmental factors, and to develop a spatial model of cropland potential
(i.e. areas likely to be converted to crops in the near future). The model assumed that
environmental factors are the key determinants of agricultural land use within the SKEP
planning domain. The model was validated by comparing model outputs against current land
use data.
Sources of data
Computing Center for Water Research (CCWR).
Climatic variables were provided by CCWR (Shulze, 1997), and were then clipped to the
SKEP planning domain using the spatial analyst tool in Arc View GIS 3.
Environmental Potential Atlas of South Africa (ENPAT)
This dataset was used for the environmental factors such as soil and geology. The GIS layers
that fall within the SKEP planning domain were clipped and merged.

Chapter 4 67
Succulent Karoo Ecosystem Plan Planning domain (SKEP)
The vegetation map was obtained from the SKEP coordinators and used as the categorical
variable. The GIS layer for cropland areas was obtained from the current land use map
derived from chapter 2. This cropland production GIS layer was then converted to a grid
layer of 500m-cell size.

Chapter 4 68
Table 4.2: List of environmental factors used in the logistic regression model Categorical variables such as vegetation types were obtained from the Succulent Karoo Ecosystem Plan (SKEP) and other categorical variables from Environmental Potential Atlas of South Africa. Mthot = minimum temperature of hot days, mtcold = minimum temperature of cold days, mintemp = minimum temperature, meantemp = mean annual temperature, gdays = growth days, gtemp = growth temperature, swsmin = soil water stress minimum, swsmax =soil water stress maximum.
Factors Type Source Shrubland Categorical Thicket Categorical Fynbos Categorical Grassland arid Categorical Renosterveld Categorical Succulent shrubland Categorical Other Categorical Sparse shrubland Categorical Grassland Categorical Wetland Categorical
BIO
TIC
FA
CO
RS
Veg
etat
ion
type
s
Void Categorical
SKEP
Glenrosa/Mispah/lime soil Categorical Red-yellow apedal Categorical Miscellaneous soils Categorical Pismacutanic Categorical Grey-regic sand Categorical Plinthic catena Categorical
Soil
type
s
Melanic & red soils Categorical
ENPAT
Sediment Categorical Igneous Categorical Mineral Categorical Metamorphic Categorical
Geo
logy
ty
pes
Unknown
ENPAT
Flat Categorical North Categorical North East Categorical East Categorical South East Categorical South Categorical South West Categorical West Categorical
Asp
ect
North West Categorical
CCWR
Altitude (m) Continuous
Slope (m) Continuous CCWR
Topo
grap
hic
Distance to rivers (m) Continuous DWAF
Mthot (ºC) Continuous Mtcold (ºC) Continuous Mintemp (ºC) Continuous Meantemp (ºC) Continuous Gdays (%) Continuous Gtemp (ºC) Continuous Swsmin (% days under stress) Continuous Swsmax (% days under stress) Continuous
AB
IOTI
C F
AC
TOR
S
Clim
atic
var
iabl
es
Rainfall (mm) Continuous
CCWR

Chapter 4 69
Environmental variables
Land use drivers consisted of categorical and continuous variables (Table 4.2). Geology, soil
and vegetation types were grouped as categorical variables.
Table 4.3: The % area for different geology types in the SKEP planning domain.
GEOLOGY HECTARES PERCENTAGE Sedimentary 23864495 87 Igneous 2086662 8 Mineral 1491044 5 Metamorphic 828 <1 Unknown 16615 <1 Total 27459645 100.0
Geology was reclassified according to rock type and the percentage of each type was
also calculated (Table 4.3). Soil types were reclassified according to their nearest class
(Table 4.4). Vegetation was classified according to nine vegetation types (Table 4.5).
Table 4.4: Soil types classified according to its nearest class (Soil classification working group, 1991) and grouped according to its percentage area coverage in the SKEP domain.
Soil HECTARES PERCENTAGE Glenrosa/Mispah/lime soil 803000 44 Red-yellow apedal 4940000 27 Miscellaneous soils 449000 24 Pismacutanic 640000 4 Grey regic sand 120000 1 Plinthic catena 40000 <1 Melanic & red soils 10000 <1 TOTAL 7002000 100
Continuous variables were altitude (m), mean temperature of the hottest month (ºC),
mean temperature of the coldest month (ºC), mean of daily minimum temperature (ºC), mean
annual temperature (ºC), annual number of growth days (days), annual growth temperature
(ºC), soil water stress minimum (% days under stress), soil water stress maximum (% days
under stress), and mean annual precipitation (mm).

Chapter 4 70
Table 4.5: The % area of different vegetation types in the SKEP planning domain (arranged from most to least abundant).
VEGETATION HECTARES PERCENTAGE Shrubland 10839258 57
Thicket 1862364 10
Fynbos 1568393 8
Grassland Arid 1348259 7
Renosterveld 1231886 6
Succulent Shrubland 1144561 6
Other 736117 4
Sparse Shrubland 314669 2
Grassland 119091 1
Wetland 11882 <1
Void 1882 <1
Total 19178362 100

Chapter 4 71
Figure 4.1: The approach used in this analysis to develop a statistical GIS model to explain the potential transformation of the SKEP planning domain by agriculture, primarily crop production.
Land use practices Land use drivers
Generate Random points
Hypothesis of the factors explaining the spatial distribution of crop production
Biotic factors Abiotic factors
Tabular data in Arc View GIS 3
Explaining factors Descriptive statistics (Box & Whisker plots and Frequency tables)
Logistic regression model Statistical analysis of significant factors
Potential agriculture map
Model validations

Chapter 4 72
Statistical approach
Protocol: The tabular data of cropland points and drivers was first exported to an excel
spreadsheet and then transferred to Statistica6 (2002 version) for further analysis. Basic
statistics (box & whisker and frequency tables) were derived in order to identify the variables
showing the greatest influence on land use. Thereafter the logistic regression model was
developed.
Logistic regression models can be used to identify potential drivers of land use pattern
and for predicting future land use pattern. It was used to investigate the relationship between
the dependent land use variables and a set of environmental drivers (McCullagh &
Nelder1989, Rouget et al., 2001). The full correlation matrix was produced, which gives the
correlations between all pairs of variables. The correlation matrix was calculated between all
independent variables (Table 4.6) to examine multicollinearity. Correlation is the measure of
the relation between two or more variables. A value of -1 represents a perfect negative
correlation and a value of +1 represents a perfect positive correlation. A value of 0.00
represents a lack of correlation (Van Den Honert, 1997). From this correlation matrix the
variable most correlated with the dependent variable “land use” was chosen to enter the
equation at the first step, provided that the resulting logistic regression model shows
significant fit (Van Den Honert, 1997).

Chapter 4 73
Table 4.6: Summary of the correlation matrix between environmental factors. Auto correlated variables were removed.
A step-wise logistic regression model was derived where the crop distribution (presence
or absence) was used as the dependent variable, and all environmental factors as the
independent variables. All non-significant factors were removed. The procedure of
removing and adding variables was repeated until all variables qualify to run the logistic
regression model. All the significant variables were used as the determinants of land use
change in the SKEP planning domain. Model accuracy was derived using the classification
of odds (% of cells correctly classified for presence and absence of cropping areas) and the
Kappa statistics (Table 7). Kappa statistics also confirmed that the model performed well.
Variable Renosterveld Swsmin Glenrosa/ Mispah/lime
soil
Slope Rainfall
Renosterveld
Swsmin
0.1068
Glenrosa/Mispah/lime soil
-0.1559
-0.0577
Slope
-0.0633
0.0594
0.0886
Rainfall
-0.1309
0.1864
-0.0702
-0.2894
Mintemp
0.1679
0.3179
0.1388
-0.0061
0.3818

Chapter 4 74
Altitude (Ns) Slope (Ns)
Distance to rivers (Ns) Mtcold (Ns)
Mean Mean±SE Mean±SD
NO YES RESPONSE
200
205
210
215
220
225
230
235
240
245
MTC
OLD
Mean ±SE ±SD
NO YES
RESPONSE
-4
-2
0
2
4
6
8
10
12
14
SLOP
E
Mean Mean±SE Mean±SD
NO YES RESPONSE
-1000
0
1000
2000
3000
4000
5000
6000
DIS
TAN
CE
Mean ±SE ±SD
NO YES
RESPONSE
0
200
400
600
800
1000
1200
ALT
ITUD
E

Chapter 4 75
Mthot (Ns) Mintemp(Ns)
Swsmax (**) Rainfall(**)
Mean ±SE ±SD
NO YES RESPONSE
75
80
85
90
95
100
105
110
115
MIN
TE
MP
Mean ±SE ±SD
NO YES
RESPONSE
87
88
89
90
91
92
93
94
95
96
97
SWS
MA
X
Mean ±SE ±SD
NO YES
RESPONSE
5
10
15
20
25
30
35
40
45
50
55
60
MTH
OT
Mean ±SE ±SD
NO YES RESPONSE
20
40
60
80
100
120
140
160
180
200
220
240
260
280
300
320
RAINFALL
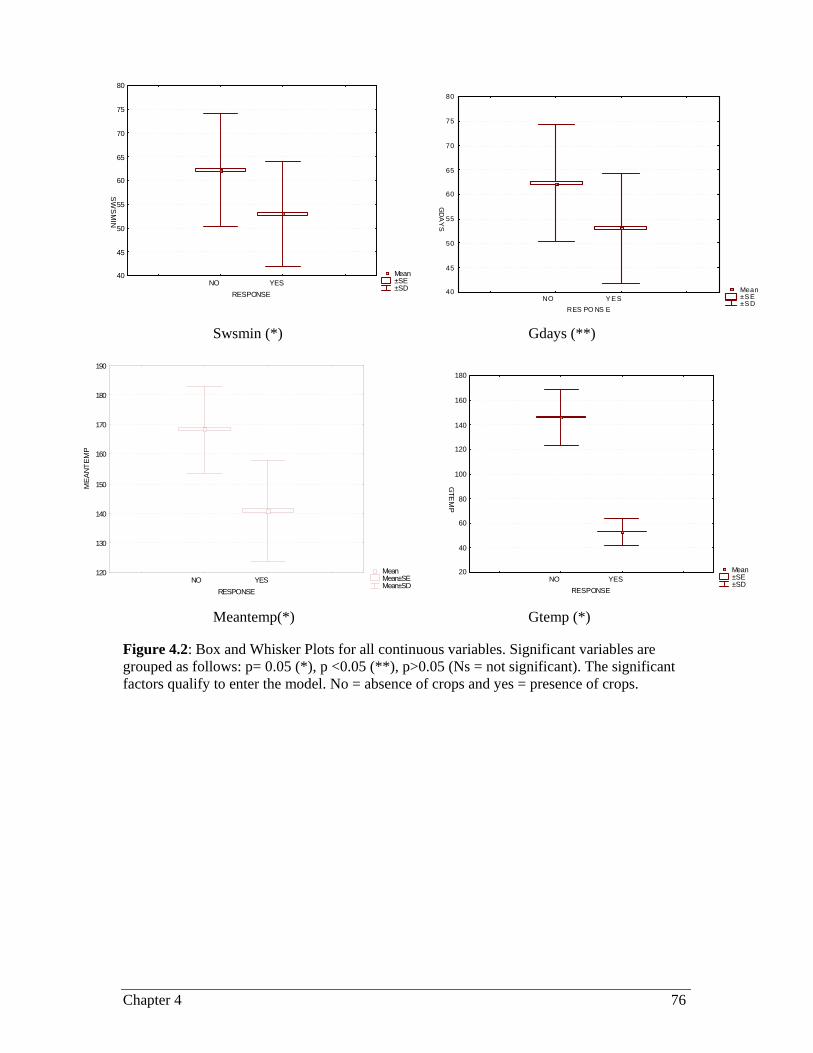
Chapter 4 76
Swsmin (*) Gdays (**)
Meantemp(*) Gtemp (*)
Figure 4.2: Box and Whisker Plots for all continuous variables. Significant variables are grouped as follows: p= 0.05 (*), p <0.05 (**), p>0.05 (Ns = not significant). The significant factors qualify to enter the model. No = absence of crops and yes = presence of crops.
Mean ±SE ±SD
NO YES RESPONSE
40
45
50
55
60
65
70
75
80
SW
SM
IN
Mean ±SE ±SD
NO Y ES RES PO NS E
40
45
50
55
60
65
70
75
80
GD
AY
S
Mean Mean±SE Mean±SD
NO YES RESPONSE
120
130
140
150
160
170
180
190
MEA
NTEM
P
Mean ±SE ±SD
NO YES RESPONSE
20
40
60
80
100
120
140
160
180
GTE
MP

Chapter 4 77
Results and Discussion
Logistic regression model
The box & whisker plots (Fig. 4.2) for minimum temperature, mean temperature, growth
days, growth temperature, soil water stress, and rainfall have shown variation between the
presence/absence of cropland areas in the SKEP planning domain. Although they show
variation, some are non significant in the final model. For the categorical variables (Fig. 4.3),
no variation was found for aspect. Regarding vegetation, the renosterveld, shrubland and
fynbos showed difference between cropland and non-cropland areas. Only the
Glenrosa/Mispah/lime soil type showed variation between presence/absence of crops.
A model based on renosterveld vegetation type, soil water stress minimum,
Glenrosa/Mispah/lime soil type, slope, rainfall and minimum temperatures explained 72% of
the variance in cropland distribution (Table 4.7).
Renosterveld, rainfall and minimum temperature affect the spatial distribution of
cropland production positively whereas the others factors affect it negatively. Previous
studies have also noted that rainfall is the major limiting factor of agriculture in the SKEP
planning domain (Desmet & Cowling, 1999).

Chapter 4 78
Figure 4.3: Frequency tables for all vegetation, aspect and soil variables
Aspect
0.0
4.0
8.0
12.0
16.0
North
North E
ast
East
South
East
South
South
West
Wes
t
North W
est
Flat
Valu
es (%
)
Other land useAgriculture
Vegetation
0.0
20.0
40.0
60.0
Shrubla
nd
Renos
terve
ld
Fynbo
s
Thicke
t
Succu
lent s
hrubla
nd
Grassla
nd ar
id
Sparse
shrub
land
Grassla
nd
Wetl
and
No Data Void
Valu
es (%
)Other land useAgriculture
Soil types
0.0
10.0
20.0
30.0
40.0
50.0
Glenros
a/Misp
ah,lim
e
Red-ye
llow ap
edal
Miscell
aneo
us so
ils
Pismac
utanic
Grey re
gic sa
nd
Plinthi
c cate
na
Melanic
& re
d soil
s
Valu
es (%
)
Other land useAgriculture

Chapter 4 79
Table 4.7: Logistic regression results. The significant factors, coefficient, and standard errors of the model are indicated.
Variable Coefficient/Estimate Standard error P-value T-value
Constant -3.000 1.000 0.000 -4.000
Renosterveld 1.000 0.000 0.000 7.000
Swsmin -0.038 0.005 0.000 -7.510
Glenrosa/Mispah/lime soil -0.339 0.114 0.003 -2.966
Slope -0.085 0.012 0.000 -6.937
Rainfall 0.008 0.001 0.000 10.549
Mintemp 0.045 0.005 0.000 8.898
Table 4.8: Classification of classes: odds ratio. This represents the accuracy of the model (percentage of correctly classified cropland observations). K = 0.435
Observed Predicted
agriculture (>0.5)
Predicted other land use (<0.5)
Model accuracy
Agriculture 713 278 72%
Cal
ibra
tion
Other land use 261 656 72%
The validation results (Table 4.9) of the predicted map of agriculture potential confirmed that
the model derived has performed better than randomly selected cells from the statistical GIS
model. The model (Fig. 4.4), predicted high probabilities of agriculture potential (31%) in
the Gariep/Namaqualand sub-region (where grid cells are > 0.5). This differs from the
Namaqualand literature (see chapter 1) and the model probably over-estimated the future
spread of cropland areas in this sub-region.

Chapter 4 80
Table 4.9: Model validation using the full dataset. K = 0.1
Observed
Predicted agriculture (>0.5)
Predicted other land use (<0.5)
Percentage
Agriculture 6504 18919 74%
Val
idat
ion
Other land use 509 846 213 059 71%
Spatial extent of future land use transformation
What are the environmental correlates of cropland areas in the SKEP planning domain?
High rainfall, high minimum temperature and the presence of renosterveld vegetation
increase the probability of agricultural expansion in the SKEP planning domain. Other
studies have found that agriculture expansion is affected by the following factors: vegetation
condition, slope (which affects soil condition, infiltration, run-off, and nutrition), and soil
condition (i.e. permeability, texture, depth, water storage capacity and fertility status)
(Rebelo, 1996; Wood & Low, 1998; Macvicar, 1999; Milewski, 2000). This level of detail
for the correlates of cropland production was not available for this study.
More cropland was found on Glenrosa/Mispah/lime soil type, which is shallow and
relatively lower in clay and less erodible. Due to these characteristics, this soil type is highly
suitable for agriculture. Previous studies have shown that the decision to use agricultural land
for cropland depends largely on the nature of the soil and water availability (Rounsevell et al.,
2002). Due to this higher rain use efficiency, areas on Glenrosa/Mispah/lime soil have a
higher and more regular cropland production (Macvicar, 1999).

Chapter 4 81
Can statistical models and GIS be used to derive spatially explicit predictions of future
agricultural land use in the SKEP planning domain?
Statistical GIS model predicted 31% of agriculture potential including non-agricultural areas
in the region. The model can be used to predict future agriculture land use at the broad scale
but some limitations were found at the local (fine) scale. For example, in the
Gariep/Namaqualand sub-region of the SKEP planning domain, the model identified cropland
production potential in non-agricultural areas (Fig. 4.4). Therefore, the model has
overestimated the agriculture potential in the sub-region. This could be explained by several
reasons.
Firstly, the model is not 100% accurate, as social variables, which are also important
drivers of cropland production expansion in the SKEP planning domain, were not included in
the model. Further changes are likely as a result of policy reform and socio-economic
influences. The transformation of the natural resources of Africa's biodiversity for example,
are due to economic and social driving forces that cannot be easily stopped as long as the
goals of most people and their political representatives are to increase production of food for
the growing population at all costs. Therefore, as Africa's population increases and demand
for food and other agricultural products continues to escalate, greater demand will continue to
be placed on landscapes to produce more food. This process is unfolding in the drylands of
Africa, and is likely to exert further pressure on biodiversity unless concerted efforts are made
to adopt more environmentally sound agricultural practices (Darkoh, 2003).
The second reason is that the model might not include all the variables that could
influence the spatial distribution of cropland production in the landscape. For example, soil
depth, texture and nutrient status might be important determinants of cropland production but
were not included in this analysis.

Chapter 4 82
Where do we expect future crops to be sown and why?
The model accuracy (74%), K=0.435 (Fig. 4.4) confirms that certain areas in the SKEP
planning domain are suitable for croplands. Areas of potential agriculture are found mainly
in the wilderness areas of the Cederberg and in the Southern Karoo. This agriculture
potential is due largely to the presence of renosterveld vegetation in the region. This
vegetation type occurs on fertile soils on arable foothills and lowlands. For this reason, most
of it has been ploughed to plant grapes, fruit and wheat (Rebelo, 1996; Wood & Low, 1998;
Milewski, 2000). All remaining renosterveld areas in the SKEP planning domain have
agriculture potential in the future. Areas in the SKEP planning domain, where croplands are
planted, vary considerably due to different soils and the amount of rainfall (see chapter1).
Vegetables and small grain crops are grown in higher rainfall areas, while dryland crops such
as wheat, barley and oats and dryland lucerne are grown in the drier areas (Dean and Milton,
1999). Croplands will expand on Glenrosa/Mispah/lime soil in the future because they are
capable of storing water from scarce rainfall events and later releasing it to plants.

Chapter 4 83
Agriculture potential0 - 0.10.1 - 020.2 - 0.30.3 - 0.40.4 - 0.50.5 - 0.60.6 - 0.70.7 - 0.80.8 - 1No Data
0 100 200 300 400 KilometersN
Namibia
South Africa
Figure 4.4: A layer of agriculture potential with values between 0 and 1, the darker areas
(>0.5) are areas where cropping can be practiced. The lighter areas (<0.5) are areas where
there is no cropping expected

Chapter 4 84
Limitations of the model
The model was mainly limited by the availability of environmental factors used. Predicting
the distribution of cropland production could be improved by integrating socio-economic
variables in the model. Understanding the land use practices in the SKEP planning domain
would require an understanding of historical changes in land use.

Conclusion 85
General Conclusion
Current land use practices in the Succulent Karoo biome.
There is little documentation of land use and its drivers in a spatially explicit way for the
Succulent Karoo biome (chapter 2). However despite the lack of historical data on initial
conditions, the current land use results have proven formative for local land use planning
efforts (Black et al., 1998; Driver et al., 2003).
The major land use practices in the Succulent Karoo biome, in increasing order of area
used are urban settlement (<1%), mining (2%), crop production (3%), conservation (5%) and
livestock production (90%). These proportions are fairly similar in each of the three South
African sub-regions of the SKEP planning domain where livestock production is by far the
dominant land use practice in all sub-regions. While the area used for cropland production
has declined over the last 50 years, the illegal collection of medicinal plants, particular in the
Southern Karoo sub-region has increased recently. Unfortunately this land use practice did
not form part of this study. The results confirmed that at least 4.8% of the Succulent Karoo
biome is conserved, although only 3.5% is formally protected in statutory reserves and the rest
in non-statutory reserves. The major concern, however, is that the formally protected areas
neither represent adequately the biodiversity pattern nor the major ecological processes in the
region (Driver et al., 2003).
Livestock production in Namaqualand.
The current status of livestock production in Namaqualand suggests that overgrazing of land
occurs not only in the communal areas of the region, but also on many of the private farms.
Livestock production systems differ considerably in these two land tenure systems where
sheep are dominant on the private farms while goats are dominant in the communal areas.

Conclusion 86
The results suggest that 76% of the communal farms were grazed below grazing capacity in
2002 while 67% of the private farms are currently stocked below grazing capacity. About
24% of the private farms and 18% of the communal areas are grazed above the grazing
capacity threshold set by the Department of Agriculture. This current stocking rate analysis is
considerably different from previous studies, which suggested that it is the communal areas of
the region only that are overstocked.
Several reasons can explain the high stocking rate on private farms such as the lack of
accuracy of official stocking rate data as reflected in tax returns and agricultural censuses.
The actual numbers of livestock on the land may be far in excess of those reported in
agricultural returns. There have also been few censuses of stock numbers on private farms at
farm scale in the past and this study has shown the importance of fine-scale surveys. The
reported decrease of livestock numbers on communal farms might be facilitated by the severe
drought that occurred in the region between 1988 & 1999 and by additional land given to
communal farmers as part of the national government’s land reform programme in
Namaqualand. This analysis suggest that there is an urgent need for a continued long term
survey of stock numbers and vegetation condition particularly at fine scale on both communal
areas and private farms.
Agriculture potential
This study has shown that statistical GIS models can be used to estimate the areas of future
agriculture potential in the SKEP domain (chapter 4). The environmental land use drivers
such as renosterveld vegetation type, Glenrosa/Mispah/lime soil type, slope, minimum
temperatures and rainfall are the key determinants of land use change as identified by the
model. Greater agriculture potential exists in the Southern Karoo sub-region. This sub-region
has more fertile soils and higher rainfall when compared to other sub-regions of the Succulent
Karoo biome. The presence of renosterveld vegetation type in the sub-region is another

Conclusion 87
reason why more of this area might be transformed by crop production in the future. Previous
studies have noted that this vegetation type (renosterveld) occurs in fertile soils on arable
foothills and lowlands.
Further study on socio-economic variables affecting policy reform and decision-making
processes would likely improve our ability to model agricultural land use distributions
(Rounsevell, et al., 2000). Information on the temporal and spatial pattern of climate change
and its implications for agricultural land use is also important for policy makers to develop
future conservation planning and sustainable agricultural development strategies (Tao et al.,
2003). Finally, further studies on how urban settlement, population growth, and grazing,
relate to agriculture expansion in the sub-region are required. Sustainable agricultural
intensification and a landscape planning approach to conservation is probably the only way to
ensure biodiversity and environmental sustainability in Namaqualand and the Succulent
Karoo biome.

References 88
References
Abbit, R.J.F., Scott, J.M. & Wilcove, D.S. (2000). The geography of vulnerability:
incorporating species geography and human development patterns into conservation
planning. Biological Conservation 96: 169-175.
Adams, D.M., Alig, R.J., Callaway, J.M., McCarl, B.A. & Winnett, S.M. (1996). The Forest
andAgricultural Sector Optimization Model (FASOM): Model Structure and Policy
Applications. Research Paper PNW-RP-495. Portland, Ore.: U.S. Department of
Agriculture, Pacific Northwest Research Station.
Allsop, N. (1999). Effects of grazing and cultivation on soil patterns and processes in
Namaqualand. Plant Ecology: 142:179-187.
Baker, W.L. (1989). A review of models of landscape change. Landscape Ecology 2: 111-133.
Barredo, J., Kasanko, M., McCormick, N. & Lavalle, C. (2003). Modeling dynamic spatial
processes: simulation of urban future scenarios through cellular automata. Landscape and
Urban Planning 64: 145 – 160.
Berry, M.W., Hazen, B.C., MacIntyre, R.L. & Flamm, R.O. (1996). LUCAS: A System for
Modeling Land-Use Change. IEEE Computational Science and Engineering 3:24.
Black, A.E., Strand, E., Wright, R.G., Scott, J.M., Morgan, P. & Watson, C. (1998). Land use
history at multiple scales: Implications for conservation planning. Landscape and Urban
Planning 43: 49-63.
Boonzaaier, M., Magerman, P., Smart, R. & Norval, M. (2002). Succulent Karoo Ecosystem
Plan: Socio-political component: Sub-regional report final draft (Namaqualand).
Unpublished.

References 89
Boonzaier, E., Malherbe, C., Smith, A., & Berens, P. (1996) (eds). The Cape Herders. David
Philip Publishers, Claremont.
Britaldo, S.S.F. & Gustavo, C.C.P. (2002). Dinamica- a stochastic cellular automata model
designed to simulate the landscape dynamics in an Amazonian colonization frontier.
Ecological Modelling 154: 271-235.
Clarke, K.C., Hoppen, S. & Gaydos, L.J. (1998). Methods and Techniques for Rigorous
Calibration of a Cellular Automaton Model of Urban Growth. Accessed June 20, 2003, at
<http://geo.arc.nasa.gov/usgs/clarke/calib.paper.html>.
Costanza, R., Sklar, F.H.& White, M.L. (1990). Modeling coastal landscape dynamics.
BioScience 40:91-107.
Cowling, R.M. & Lombard, A.T. (1998). A strategic and systemic framework for conserving
the plant life of the Succulent Karoo. IPC report 9802 submitted to the trustees of the
Leslie Hill Succulent Karoo Trust. Institute for Plant Conservation, University of Cape
Town.
Cowling, R.M. & Pierce, S.M. (1999). Namaqualand. A succulent desert. Fernwood Press,
Cape Town.
Cowling, R.M., Esler, K.J. & Rundel, P.W. (1999). Namaqualand, South Africa – an
overview of a unique winter-rainfall desert ecosystem. Plant Ecology 142: 3-21.
Cowling, R.M., Esler, K.J., Midgley, G.F., & Honing, M.A. (1994). Plant functional diversity,
species diversity and climate in arid and semi arid southern Africa. Journal of Arid
Environments 27: 141-58.

References 90
Cowling, R.M., Hilton-Taylor, C. (1994) Patterns of plant diversity and endemism in southern
Africa: an overview. In (ed) Huntley, B.J. Botanical diversity in southern Africa. National
Botanical Institute, Pretoria, Strelitzia 1. Pp 31-52.
Crist P.J., Kohley, T.W. & Oakleaf, J. (2000). Assessing land use impacts on biodiversity
using an expert systems tool. Landscape Ecology 15: 47-62.
Dale, V.H. (1997). The relationship between land-use change and climate change. Ecological
Applications 7: 753-769.
Darkoh, M.B.K. (2003). Regional perspectives on agriculture and biodiversity in the drylands
of Africa. Journal of Arid Environments 54: 261-279.
De Koning, G.H.J., Verburg, P.H., Veldkamp, A. & Fresco, L.O. (1999). Multi scale
modelling of land use change dynamics in Ecuador. Journal of Agricultural Systems 61:
77-93.
De Pauw, E., Gobel, W. & Adam, H. (2000). Agrometeorological aspects of agriculture and
forestry in the arid zones. Agriculture and Forestry Meteorology 103:43-58.
Deacon, (1992). Human settlement. Nutrients Fire and Diversity. In (eds): Cowling, R. M.
The Ecology of Fynbos. Oxford University Press, Cape Town. Pp 260-270.
Dean, W.R.J. & Macdonald, I.A.W. (1994). Historical changes in stocking rates of domestic
livestock as a measure of semi-arid and arid rangeland degradation in the Cape Province,
South Africa. Journal of Arid Environments 26: 281-298.
Dean, W.R.J., Milton, S.J. (eds) (1999). The Karoo: Ecological patterns and processes.
Cambridge University Press, Cambridge.

References 91
Desmet, P.G. & Cowling, R.M. (1999). The climate of the karoo-a functional approach. In
(eds): Dean W.R.J. & Milton, S.J. The Karoo: ecological patterns and processes.
Cambridge University Press, Cambridge. Pp 3-16.
Dodd, J.L. (1994). Desertification and degradation in sub-Saharan Africa. BioScience, 44: 28-
34.
Driver, A., Desmet, P.G., Rouget, M. Cowling, R.M & Maze, K (2003). Succulent Karoo
Ecosystem Plan: Biodiversity Component Technical Report. CCU 1/03, Botanical Society
of South Africa, Cape Town.
Driver, A., Maze, K., & Cowling, R.M. (2002). The Succulent Karoo Ecosystem Plan. Veld &
Flora. Pp 12-13.
du Toit P.C.V. (2002). The stocking rate: Grazing capacity relation. Grootfontein Agricultural
Development Institute, Middelburg, Eastern Cape. Accessed January, 10 2004 at
<http://gadi.agric.za/articles/duToit_PCV/stocking_rate.htm>.
Esler K.J. (1993). Vegetation patterns and plant reproductive processes in the Succulent
Karoo. PhD. Thesis, University of Cape Town, Cape Town.
FAO, (1994). Integrated approach to the planning and management of land resources. Draft
report of the UN Secretary-General on the implementation of Chapter 10 of Agenda 21
(UNICED) to the Commission on Sustainable Development. Third Draft of Task
Manager's Report. FAO/AGL, 28 November 1994, Rome.
Folly, A., Bronsveld, M.C. & Clavaux, M. (1996). A knowledge based approach for C-factor
mapping in Spain using Landsat TM and GIS. International Journal of Remote Sensing
17: 2401-2415.
Gilruth, P.T., Marsh, S.E. & Itami, R. (1995). A Dynamic Spatial Model of Shifting
Cultivation in the Highlands of Guinea, West Africa. Ecological Modelling 79:179–197.

References 92
Higgins, S.I., Richardson, D.M. Cowling, R.M. & Trinder-Smith, T.H. (1999). Predicting the
landscape scale distribution of alien plants and their threats to biodiversity. Conservation
Biology 13: 303-313.
Hilton-Taylor, C (1994). Western Cape Domain (Succulent Karoo). Republic of South Africa
and Namibia. In (eds) Davis, S.D., Heywood, V.H., Hamilton, A.C. Centres of plant
diversity. A guide and strategy for their conservation. Vol. 1. Europe, Africa, South West
Asia and Middle East. IUCN Publications Unit, Cambridge. Pp 204-217.
Hoffman, M.T. (1997). Human impacts on vegetation. In (eds): Cowling, R.M., Richardson,
D.M. & Pierce, S.J. Vegetation of Southern Africa. Cambridge University Press,
Cambridge. Pp 507-534.
Hoffman, M.T., Cousins, C., Meyer, T., Petersen, A., & Hendriks, H. (1998). Historical and
contemporary agricultural land use and the desertification of the Karoo. In (eds): Dean,
W.R.J. & Milton, S.J. The Karoo: Ecological Patterns and Processes. Cambridge
University Press, Cambridge. Pp 257-273.
Hoffman, T. & Ashwell, A. (2001). Nature divided: Land degradation in South Africa.
University of Cape Town Press, Cape Town.
Hoffman, T., Todd, S., Ntshona, Z., & Turner, S. (1999). Land degradation in South Africa.
Unpublished report. National Botanical Institute. Kirstenbosch, Cape Town. Available at
<www.nbi.ac.za/landdeg>.
Huenneke, L.F. & Nobble, I. (1996). Ecosystem function of biodiversity in arid ecosystem. In:
(eds) Mooney, H.A., Cushman, J.H., Medina, E., Sala, O.E. & Shulze, E. Functional roles
of biodiversity, a global perspective. Scope 55, John & Wiley Sons, Chichester. Pp 99-
128.
References 93
Hunt, L.P. (2001). Hetergeneous grazing causes local extinction of edible perennial shrubs: a
matrix analysis. Journal of Applied Ecology 38: 238-252.
Kirtland, D., Gaydos, L., Clarke, K., DeCola, L., Acevedo, W. & Bell, C. (2000). An Analysis
of Human Induced Land Transformations in the San Francisco Bay/Sacramento Area.
Accessed June 20, 2003, at <http://edcwww2.cr.usgs.gov/umap/pubs/WRR_paper.html>.
Kok, K. & Winogard, M. (2002). Modelling land use change for Central America, with
special reference to the impact of hurricane Mitch. Journal of Ecological Modelling 149:
53-69.
Kok, K. (2001). Scaling up the land use system. A modelling approach with case studies for
Central America. PhD. Thesis, Wageningen University and Research Center,
Wageningen.
Kok, K., Farrow, A., Veldkamp, A. & Verburg, P.H. (2001). A method and application of
multi scale validation in spatial land use models. Journal of Agriculture, Ecosystem and
Environment 85: 223-238.
Krohne, H. & Steyn, L. (1990). Land use in Namaqualand: Towards a community based
management strategy for Agricultural land use in the Namaqualand reserves, Leliefontein,
Steinkopf and Richtersveld. Surplus People Project, Observatory, Cape Town.
Kuiper, S.M. & Meadows, M. (2000). Is there a future for livestock farming in southern
Namibia's communal lands? MSc. Thesis, University of Cape Town, Cape Town.
Low A.B., & Rebelo A.G. (eds) (1996). Vegetation of South Africa, Lesotho and Swaziland.
Department of Environmental Affairs and Tourism, Pretoria.
Macvicar, C.N. (1999). Soil classification: A taxonomic system for South Africa. Memoirs on
the Agricultural Natural Resources of South Africa. No. 15. Soil and Irrigation Research
Institute. Department of Agricultural Development. Pretoria. 257 p.

References 94
Margules, C.R. & Pressey, R.L. (2000). Systematic conservation planning. Nature 405: 243-
253.
Matheussen, B., Kirschbaum, R.L., Goodman, I.A., O’-Donnell, G.M., Lettenmaier, D.P.
(2000). Effects of land cover change on streamflow in the interior Columbia river basin
(USA and Canada). Hydrological Processes 14: 867-885.
McCullagh, P. & Nelder, J.A. (eds) (1989). Generalized linear models, 2nd edn. Chapman and
Hall, Melbourne.
Melloul, A.J. & Collin, M.L. (2003). Harmonizing water management and social needs: a
necessary condition for sustainable development. The case of Israel's coastal aquifer.
Journal of Environmental Management 67: 385-394.
Milewski, A.V. (2000). Dwarf ebonies and megaherbivores. Veld & Flora 86: (1): 33-35.
Milton, S.J. (2001). Rethinking ecological rehabilitation in arid and winter rainfall regions of
Southern Africa. South African Journal of Science 97: 1-2.
Milton, S.J., Gourlay, I.M. & Dean, W.R.J. (1997a). Shrub growth and demography in arid
Karoo, South Africa: interference from wood rings. Journal of Arid Environments 37:
487-496.
Milton, S.J.; Yeaton, R.I., Dean, W.R.J., & Vlok, J.H.J. (1997b). Succulent Karoo. In (eds):
Cowling, R.M., Richardson, D.M. & Pierce, S.J. Vegetation of Southern Africa.
Cambridge University Press, Cambridge. Pp 131-166.
Mustart, P., Cowling, R., & Albertyn, J. (1997). Southern Overberg: South African
Wildflower Guide 8. Botanical Society of South Africa. Kirstenbosch.
Myers, N., Mittermeier, R.A., Mittermier, C.G., da Fronseca, G.A.B. & Kent, J. (2000).
Biodiversity hotspots conservation priorities. Nature 403: 853-858.

References 95
Noss, R.F., O'Connell, M.A. & Murphy, D.D. (eds) (1997). The science of conservation
planning: habitat conservation under the Endangered Species Act. Word Wildlife Fund
and Island Press, Washington, D C.
Oppel, W. (2002). Succulent Karoo Ecosystem Plan: Socio-political component: Sub-regional
report final draft (Gariep). Unpublished.
Pallett, J., (ed). (1995). The Sperrgebiet: Namibia’s least known wilderness. An environmental
profile of the Sperrgebiet or Diamond Area 1, in southwestern Namibia. DRFN and
NAMDEB, Windhoek, 84 pp.
Penn, N. (1986). Pastoralists and pastoralism in the northern cape frontier zone during the
eighteenth century. In (eds): Hall, M., & Smith, A. Pastoralism in southern Africa. The
South African Archaeological Society Goodwin Series. 20p.
Pontius Jr., R.G., Cornell, J.D. & Hall, A.S. (2001). Modelling the spatial pattern of land use
change with GEOMOD2: application and validation with Costa Rica. Agriculture,
Ecosystem, and Environment 85: 191-203.
Pressey R.L. & Cowling R.M. (2001). Reserve selection algorithms and the real world.
Conservation Biology 15: 275-277.
Pressey R.L., Ferrier, S., Hager, T.C., Woods, C.A., Tully, S.L. & Weiman, K.M. (1996).
How well protected are the forests of north-eastern New South Wales? –Analysis of forest
environments in relation to formal protection measures, land tenure, and vulnerability to
clearing. Forest Ecology Management 85: 311-333.
Quantitative Approaches in Systems Analysis 8: 1-58.
Rebelo, A. (1996) Renosterveld. In (eds): Cowling, R.M., Richardson, D.M. & Pierce, S.M.
The vegetation of Southern Africa. Cambridge University Press, Cambridge. Pp 66-67

References 96
Rebelo, A.G. (1997). Conservation. In (eds): Cowling, R.M., Richardson, D.M. & Pierce,
S.M. The vegetation of Southern Africa. Cambridge University Press, Cambridge. Pp 571-
590.
Riebsame, W.E., Meyer, W.B. & Turner, B.L. (1994). Modelling land use and cover as part of
global environmental change. Climatic Change 28: 45-64.
Riginos, C. & Hoffman, M. T (2003). Changes in population biology of two succulent shrubs
along a grazing gradient. Journal of Applied Ecology 40: 615-625.
Rouget, M. Richardson, D.M., Milton, S.J. & Polakow, D. (2001). Predicting invasion
dynamics of four alien species in a highly fragmented semi arid shrubland in South Africa.
Plant Ecology. 152: 79-92.
Rouget, M., Richardson, D.M., Cowling, R.M., Lloyd, J.W. & Lombard, A.T. (2003). Current
patterns of habitat transformation and future threats to biodiversity in terrestrial
ecosystems of the Cape Floristic Region, South Africa. Biological Conservation 112:63-
85.
Rounsevell, M.D.A., Annetts, J.E., Audsley, E., Mayr, T. & Reginster, I. (2002). Modelling
the spatial distribution of agricultural land use at the regional scale. Agriculture
Ecosystems & Environment 2023: 1-15.
Rutherford, M.C. (1997). Categorization of Biomes. In (eds) Cowling, R.M., Richardson,
D.M. & Pierce, S.M. Vegetation of southern Africa. Cambridge University Press,
Cambridge. Pp 91-98.
Rutherford, M.C., & Westfall, R.H. (1986). Biomes of southern Africa-an objective
categorization. Memoirs of the Botanical Survey in Southern Africa 54: 1-98.

References 97
Rutherford, M.C., & Westfall, R.H. (1997). Categorization of Biomes. In (eds): Cowling,
R.M., Richardson, D.M., & Pierce, S.M. Vegetation of southern Africa. Cambridge
University Press, Cambridge. Pp 91-98.
Rutherford, M.C., Midgley, G.F., Bond, W.J., Powrie, L.W., Roberts, R. & Allsopp, J. (1999).
South African Country Study on climate change. Plant Biodiversity: vulnerability and
adaptation assessment. National Botanical Institute, Claremont.
Sanderson, J., Alger, K., da Fonseca, G.A.B., Galindo-Leal, C., Inchausty, V.H., Morrison, K.
(eds) (2003) Biodiversity conservation corridors: planning, implementation, and
monitoring sustainable landscapes. Center for applied biodiversity science. Conservation
International. Washington DC. Pp 34-36.
Schmiedel, U., & Jurgens, N. (1999). Community structure on unusual habitat islands: quartz-
fields in the Succulent Karoo, South Africa. Plant Ecology 142: 57-69.
Scholes, R.J. (1998). The South African 1:250 000 maps of areas of homogenous livestock
production potential. Technical report. Council of Scientific and Industrial Research,
Pretoria.
Schoorl, J.M., Veldkamp, A. & Fresco, L.O. (1997). The conversion of land use and its effects
(CLUE-CR): a regression based model applied to Costa Rica (Pascal version 1.2).
Seymour, C.I. & Dean, W.R.J. (1999). Effects of heavy grazing on invertebrate assemblages
in the Succulent Karoo, South Africa. Journal of Arid Environments 43: 267-286.
Shulze, R.E. (1997). South African Atlas of Agrohydrology and Climatology. Water Research
Commission, Pretoria, Report TT 82/96.
Soil classification working group. (1991). Soil classification. A taxonomic system for South
Africa. Memoirs on the Agricultural Natural Resources of South Africa No.15. Soil and
Irrigation Research Institute. Department of Agricultural Development. Pretoria.

References 98
Stein. A., Riley, J. & Halberg, J. (2001). Issues of scale for environmental indicators.
Agricultural Ecosystems and Environment 87: 215-212.
Surplus People Project. (1997). Namaqualand district planning and management project.
Report on the current situation concerning livestock farming reservations, municipal
areas and communal areas with grazing in Namaqualand. Unpublished report.
Observatory. Cape Town. Pp 1-23.
Tao, F., Yokozawa, M., Hayashi, Y. & Lin, E. (2003). Future climate change, the agricultural
water cycle, and agricultural production in China. Agriculture, Ecosystem & Environment
95: 203-215.
Thompson, M. (1996). A standard land-cover classification scheme for remote-sensing
applications in South Africa. South African Journal of Science 92: 34-43.
Todd, S.W. & Hoffman, M.T. (1998). Fenced in and nowhere to go: The story of
Namaqualand’s communal rangelands. Veld & flora 84: 86-87.
Todd, S.W. & Hoffman, M.T. (1999). A fence-line contrast reveals effects of heavy livestock
grazing on plant diversity and community composition in Namaqualand, South Africa.
Plant Ecology 142: 169-178.
Turner, B.L., Skole, D.L., Sanderson, S., Fischer, G., Fresco, L. & Leemans, R. (1995). Land-
Use and Land-Cover Change: Science/Research Plan. IGBP Report No. 35 and HDP
Report No. 7, International Geosphere-Biosphere Programme and Human Dimensions of
Global Environmental Change Programme, Stockholm, Sweden, 132 pp.
Van den Honert, R. (1997). Intermediate statistical methods. Department of Statistical
Sciences. University of Cape Town Press, Cape Town.
Van Jaarsveld, E. (1987). The succulent riches of South Africa and Namibia. Aloe 24: 45-92.

References 99
Van Jaarsveld, E., Van Wyk, E., & Smith, G. (eds) (2000). Succulents of South Africa.
Tafelberg publishers, Cape Town, South Africa.
van Wyk, A.E. & Smith, G.F. (eds) (2001). Regions of floristic endemism in southern Africa.
A review with emphasis on succulents. Umdaus Press, Pp 199.
Veldkamp, A. & Fresco, L.O. (1996). CLUE-CR: an integrated multi scale model to simulate
land use change scenarios in Costa Rica. Ecological modelling 91: 231-248.
Veldkamp, A. & Fresco, L.O. (1997). Exploring land use scenarios, an alternative approach
based on actual land use. Agricultural Systems 55: 1-17.
Veldkamp, A. & Lambin, E.F. (2001) Predicting land use change. Agriculture, Ecosystems
and Environment 85: 1-6.
Verburg, P.H., De Koning, G.H.J., Kok, K., Veldkamp, A. & Bouma, J. (1999). A spatial
explicit allocation procedure for modelling the pattern of land use change based upon
actual land use. Ecological Modelling. 116: 45-61.
Verburg, P.H., Veldkamp, A. & Bouma, J. (1999). Land use change under conditions of high
population pressure. The case of Java. Journal of Global environment 9: 303-312.
Wessels, K.J., Reyers, B., van Jaarsveld, A.S. & Rutherford, M.C. (2002). Identification of
potential conflict areas between land transformation and biodiversity conservation in
northeastern South Africa. Agriculture Ecosystems & Environment: 1988: 1-2.
White, D., Minotti, P.G., Barczak, M. J., Sifneos, J.C., Freemark, K.E., Santelmann, M.V.,
Steinitz, C.F., Kiester, A.R. & Preston, E.M., (1997). Assessing risk to biodiversity from
future landscape change. Conservation Biology 11: 349-360.
Wilcove, D.S., Rothstein, D., Dubow, D., Phillips, A. & Losos, E. (1998). Quantifying threats
to imperiled species in the United States. BioScience 48: 607-615.

References 100
Wood, J & Low, A.B. (1998). The ecology and conservation of the Tygerberg. In: (eds) du
Plessis N.M. The Tygerberg. Tafelberg Press, Cape Town. Pp 127-150.