land transport (preliminary) [email protected] t +27 12 310 8911 f +27 12 310 8500 private bag...
TRANSCRIPT
www.statssa.gov.za
T +27 12 310 8911
F +27 12 310 8500
Private Bag X44, Pretoria, 0001, South Africa
ISIbalo House, Koch Street, Salvokop, Pretoria, 0002
STATISTICAL RELEASE P7162
Land transport (Preliminary)
October 2018
Embargoed until: 10 December 2018
11:30
ENQUIRIES: FORTHCOMING ISSUE: EXPECTED RELEASE DATE:
Keshnee Naidoo November 2018 21 January 2019
(012) 310 8423

STATISTICS SOUTH AFRICA 1 P7162
Land transport, October 2018
Contents
Freight transportation: results for October 2018 ............................................................................................ 2
Table A – Year-on-year percentage change in freight transportation (income at current prices) .................... 2
Table B – Freight transportation income at current prices for the latest three months by type of commodity . 2
Figure 1 – Freight transportation: year-on-year percentage change in payload .............................................. 3
Table C – Seasonally adjusted payload for the latest three months by type of transport................................ 3
Passenger transportation: results for October 2018 ...................................................................................... 4
Table D – Year-on-year percentage change in passenger transportation (income at current prices) ............. 4
Figure 2 – Passenger transportation: year-on-year percentage change in passenger journeys ..................... 4
Table E – Seasonally adjusted passenger journeys for the latest three months by type of transport ............. 4
Tables .................................................................................................................................................................. 5
Table 1 – Freight transportation (income at current prices) ............................................................................. 5
Table 2 – Year-on-year percentage change in freight transportation (income at current prices) .................... 5
Table 3 – Seasonally adjusted freight transportation (income at current prices) ............................................. 6
Table 4 – Month-on-month percentage change in seasonally adjusted freight transportation (income at
current prices) .................................................................................................................................. 6
Table 5 – Freight transportation income at current prices by type of commodity (R million) ........................... 7
Table 6 – Year-on-year percentage change in freight transportation income at current prices by type of
commodity ........................................................................................................................................ 7
Table 7 – Contribution of each type of commodity to the year-on-year percentage change in freight
transportation income at current prices (percentage points) ........................................................... 7
Table 8 – Passenger transportation (income at current prices) ....................................................................... 8
Table 9 – Year-on-year percentage change in passenger transportation (income at current prices) ............. 8
Table 10 – Seasonally adjusted passenger transportation (income at current prices) .................................... 9
Table 11 – Month-on-month percentage change in seasonally adjusted passenger transportation (income
at current prices) ............................................................................................................................ 9
Survey information ........................................................................................................................................... 10
Technical notes ................................................................................................................................................. 11
Glossary ............................................................................................................................................................ 12
Technical enquiries .......................................................................................................................................... 12
General information.......................................................................................................................................... 13
STATISTICS SOUTH AFRICA 2 P7162
Land transport, October 2018
Freight transportation: results for October 2018
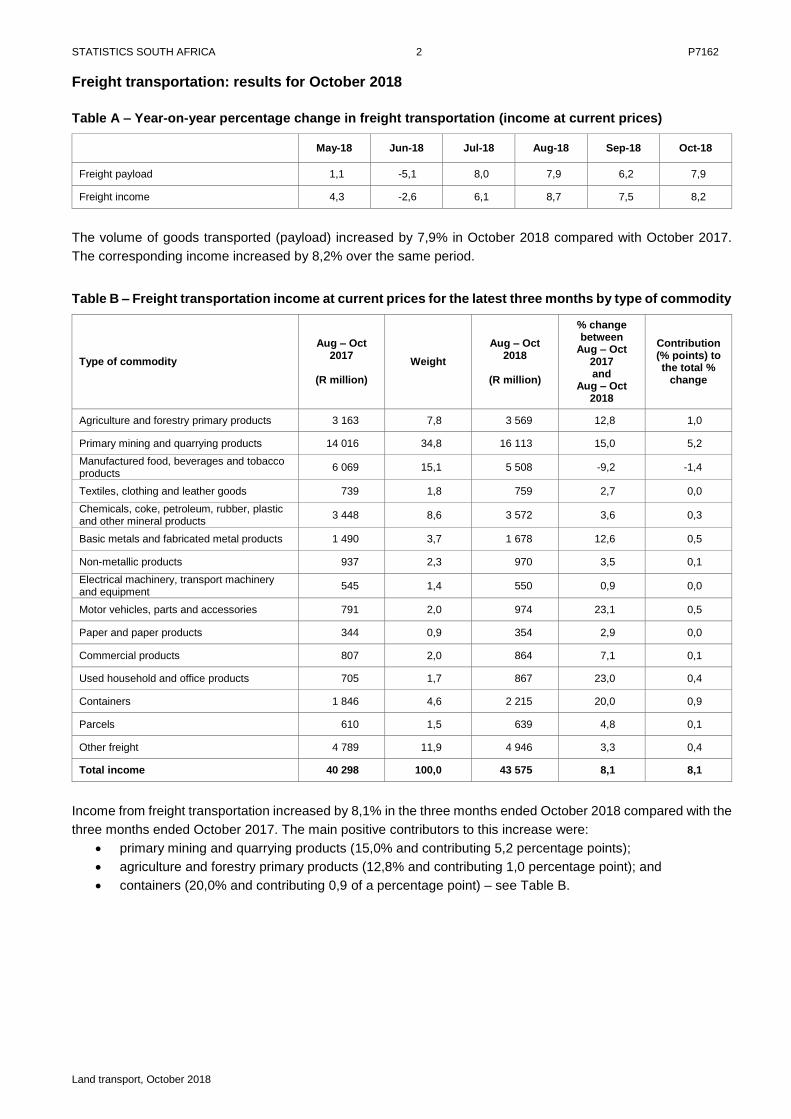
Table A – Year-on-year percentage change in freight transportation (income at current prices)
May-18 Jun-18 Jul-18 Aug-18 Sep-18 Oct-18
Freight payload 1,1 -5,1 8,0 7,9 6,2 7,9
Freight income 4,3 -2,6 6,1 8,7 7,5 8,2
The volume of goods transported (payload) increased by 7,9% in October 2018 compared with October 2017.
The corresponding income increased by 8,2% over the same period.
Table B – Freight transportation income at current prices for the latest three months by type of commodity
Type of commodity
Aug – Oct 2017
(R million)
Weight
Aug – Oct 2018
(R million)
% change between
Aug – Oct 2017 and
Aug – Oct 2018
Contribution (% points) to the total %
change
Agriculture and forestry primary products 3 163 7,8 3 569 12,8 1,0
Primary mining and quarrying products 14 016 34,8 16 113 15,0 5,2
Manufactured food, beverages and tobacco products
6 069 15,1 5 508 -9,2 -1,4
Textiles, clothing and leather goods 739 1,8 759 2,7 0,0
Chemicals, coke, petroleum, rubber, plastic and other mineral products
3 448 8,6 3 572 3,6 0,3
Basic metals and fabricated metal products 1 490 3,7 1 678 12,6 0,5
Non-metallic products 937 2,3 970 3,5 0,1
Electrical machinery, transport machinery and equipment
545 1,4 550 0,9 0,0
Motor vehicles, parts and accessories 791 2,0 974 23,1 0,5
Paper and paper products 344 0,9 354 2,9 0,0
Commercial products 807 2,0 864 7,1 0,1
Used household and office products 705 1,7 867 23,0 0,4
Containers 1 846 4,6 2 215 20,0 0,9
Parcels 610 1,5 639 4,8 0,1
Other freight 4 789 11,9 4 946 3,3 0,4
Total income 40 298 100,0 43 575 8,1 8,1
Income from freight transportation increased by 8,1% in the three months ended October 2018 compared with the
three months ended October 2017. The main positive contributors to this increase were:
primary mining and quarrying products (15,0% and contributing 5,2 percentage points);
agriculture and forestry primary products (12,8% and contributing 1,0 percentage point); and
containers (20,0% and contributing 0,9 of a percentage point) – see Table B.
STATISTICS SOUTH AFRICA 3 P7162
Land transport, October 2018
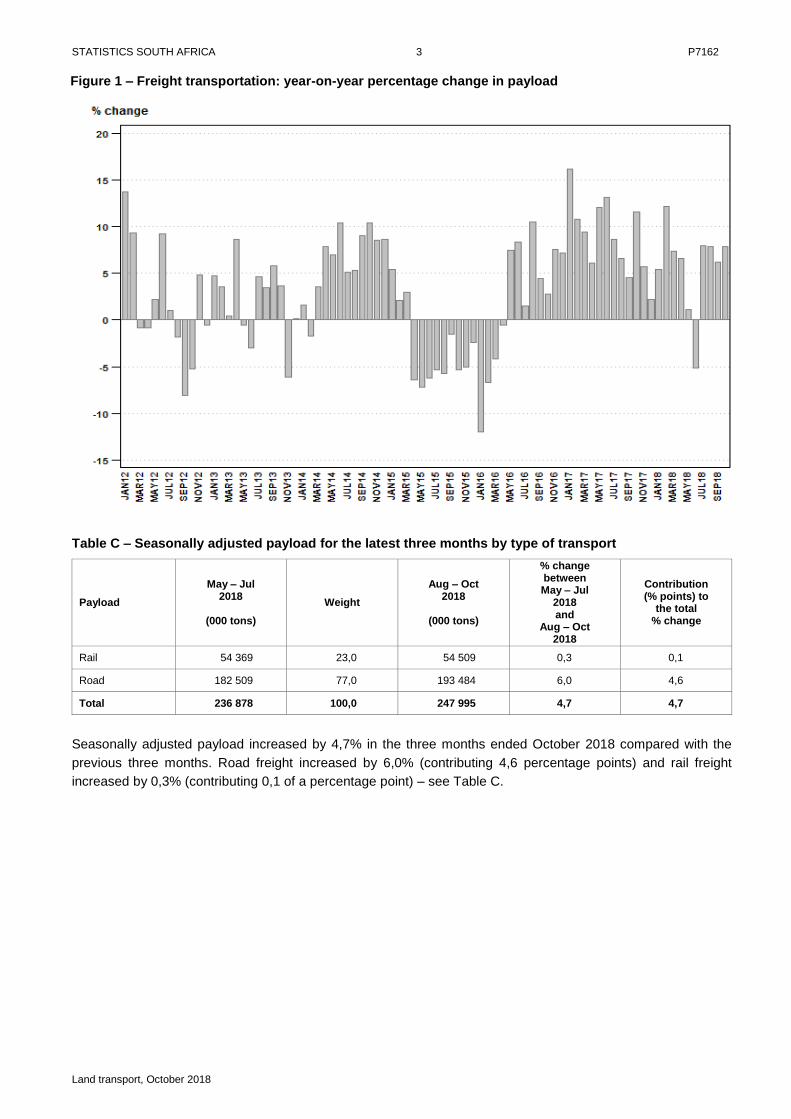
Figure 1 – Freight transportation: year-on-year percentage change in payload
Table C – Seasonally adjusted payload for the latest three months by type of transport
Payload
May – Jul 2018
(000 tons)
Weight
Aug – Oct 2018
(000 tons)
% change between May – Jul
2018 and
Aug – Oct 2018
Contribution (% points) to
the total % change
Rail 54 369 23,0 54 509 0,3 0,1
Road 182 509 77,0 193 484 6,0 4,6
Total 236 878 100,0 247 995 4,7 4,7
Seasonally adjusted payload increased by 4,7% in the three months ended October 2018 compared with the
previous three months. Road freight increased by 6,0% (contributing 4,6 percentage points) and rail freight
increased by 0,3% (contributing 0,1 of a percentage point) – see Table C.
STATISTICS SOUTH AFRICA 4 P7162
Land transport, October 2018
Passenger transportation: results for October 2018
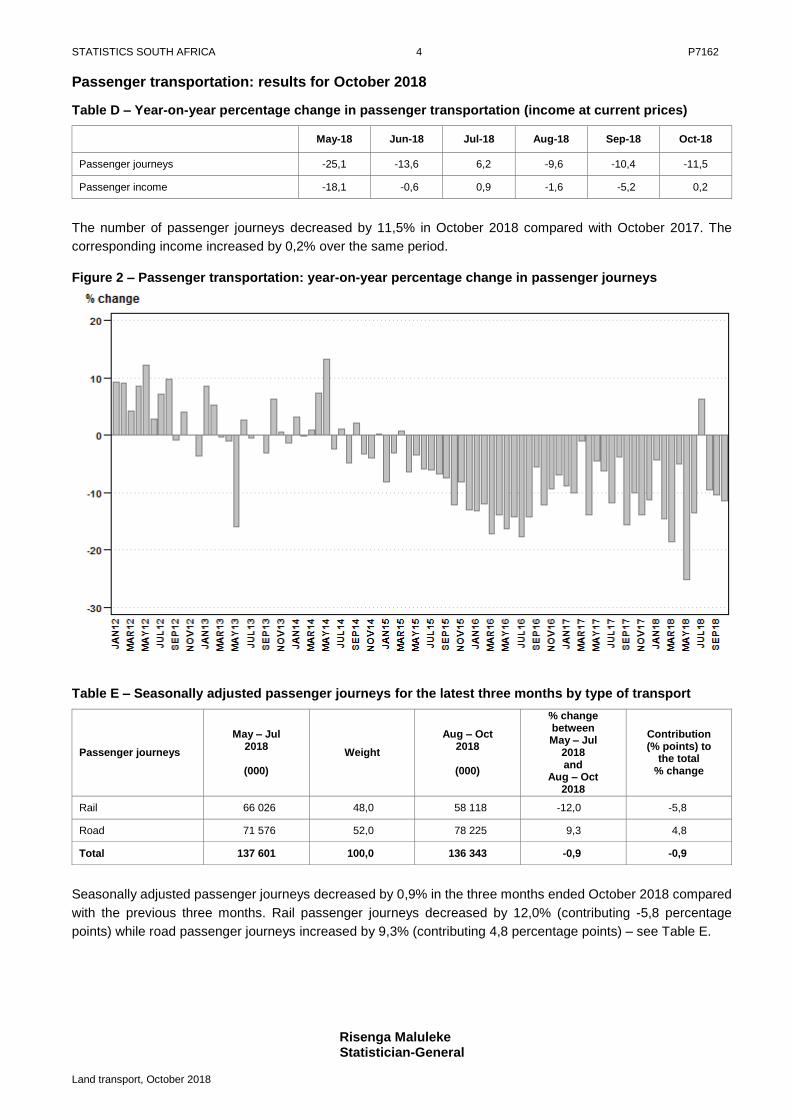
Table D – Year-on-year percentage change in passenger transportation (income at current prices)
May-18 Jun-18 Jul-18 Aug-18 Sep-18 Oct-18
Passenger journeys -25,1 -13,6 6,2 -9,6 -10,4 -11,5
Passenger income -18,1 -0,6 0,9 -1,6 -5,2 0,2
The number of passenger journeys decreased by 11,5% in October 2018 compared with October 2017. The
corresponding income increased by 0,2% over the same period.
Figure 2 – Passenger transportation: year-on-year percentage change in passenger journeys
Table E – Seasonally adjusted passenger journeys for the latest three months by type of transport
Passenger journeys
May – Jul 2018
(000)
Weight
Aug – Oct 2018
(000)
% change between May – Jul
2018 and
Aug – Oct 2018
Contribution (% points) to
the total % change
Rail 66 026 48,0 58 118 -12,0 -5,8
Road 71 576 52,0 78 225 9,3 4,8
Total 137 601 100,0 136 343 -0,9 -0,9
Seasonally adjusted passenger journeys decreased by 0,9% in the three months ended October 2018 compared
with the previous three months. Rail passenger journeys decreased by 12,0% (contributing -5,8 percentage
points) while road passenger journeys increased by 9,3% (contributing 4,8 percentage points) – see Table E.
Risenga Maluleke Statistician-General

STATISTICS SOUTH AFRICA 5 P7162
Land transport, October 2018
Tables
Table 1 – Freight transportation (income at current prices)
Year and month 1/ Rail Road Total
Payload (000 tons)
Income (R million)
Payload (000 tons)
Income (R million)
Payload (000 tons)
Income (R million)
2017 Jan 18 075 3 212 51 107 8 100 69 182 11 312
Feb 19 391 3 434 50 355 8 023 69 746 11 457
Mar 17 813 3 134 54 673 8 643 72 486 11 777
Apr 18 958 3 456 52 161 8 370 71 119 11 826
May 17 903 3 303 59 702 9 523 77 605 12 826
Jun 19 309 3 694 63 473 10 092 82 782 13 786
Jul 17 262 3 288 58 811 9 594 76 073 12 882
Aug 20 315 3 755 59 988 9 512 80 303 13 267
Sep 19 777 3 767 60 100 9 652 79 877 13 419
Oct 18 855 3 563 62 570 10 049 81 425 13 612
Nov 19 500 3 661 62 306 10 064 81 806 13 725
Dec 18 900 3 494 52 648 8 643 71 548 12 137
Total 226 058 41 761 687 894 110 265 913 952 152 026
2018 Jan 17 582 3 351 55 361 8 915 72 943 12 266
Feb 19 786 3 700 58 455 9 195 78 241 12 895
Mar 18 144 3 336 59 675 9 486 77 819 12 822
Apr 18 460 3 612 57 341 9 256 75 800 12 868
May 18 060 3 558 60 385 9 815 78 445 13 373
Jun 18 218 3 593 60 374 9 835 78 592 13 428
Jul 15 709 3 104 66 450 10 570 82 159 13 674
Aug 19 343 3 708 67 270 10 713 86 613 14 421
Sep 19 809 3 875 65 039 10 552 84 848 14 427
Oct 17 044 3 443 70 799 11 285 87 842 14 727
1/ Figures for latest month are preliminary.
Table 2 – Year-on-year percentage change in freight transportation (income at current prices)
Year and month Rail Road Total
Payload Income Payload Income Payload Income
2017 Jan 10,6 20,0 18,3 19,7 16,2 19,8
Feb 7,2 11,7 12,2 13,5 10,8 13,0
Mar 1,1 6,2 12,5 15,1 9,4 12,5
Apr 6,7 11,8 5,9 7,4 6,1 8,7
May 5,3 8,5 14,4 16,5 12,1 14,4
Jun 4,0 13,5 16,2 17,9 13,1 16,7
Jul 16,7 26,1 6,5 9,1 8,6 13,0
Aug 3,9 11,2 7,5 8,0 6,6 8,9
Sep 0,9 13,4 5,7 8,8 4,5 10,0
Oct 9,8 13,1 12,2 14,9 11,6 14,4
Nov -2,5 5,8 8,5 11,1 5,7 9,7
Dec -2,0 3,5 3,8 3,4 2,2 3,5
Total 4,8 11,7 10,1 11,9 8,8 11,9
2018 Jan -2,7 4,3 8,3 10,1 5,4 8,4
Feb 2,0 7,7 16,1 14,6 12,2 12,6
Mar 1,9 6,4 9,1 9,8 7,4 8,9
Apr -2,6 4,5 9,9 10,6 6,6 8,8
May 0,9 7,7 1,1 3,1 1,1 4,3
Jun -5,7 -2,7 -4,9 -2,5 -5,1 -2,6
Jul -9,0 -5,6 13,0 10,2 8,0 6,1
Aug -4,8 -1,3 12,1 12,6 7,9 8,7
Sep 0,2 2,9 8,2 9,3 6,2 7,5
Oct -9,6 -3,4 13,2 12,3 7,9 8,2
STATISTICS SOUTH AFRICA 6 P7162
Land transport, October 2018
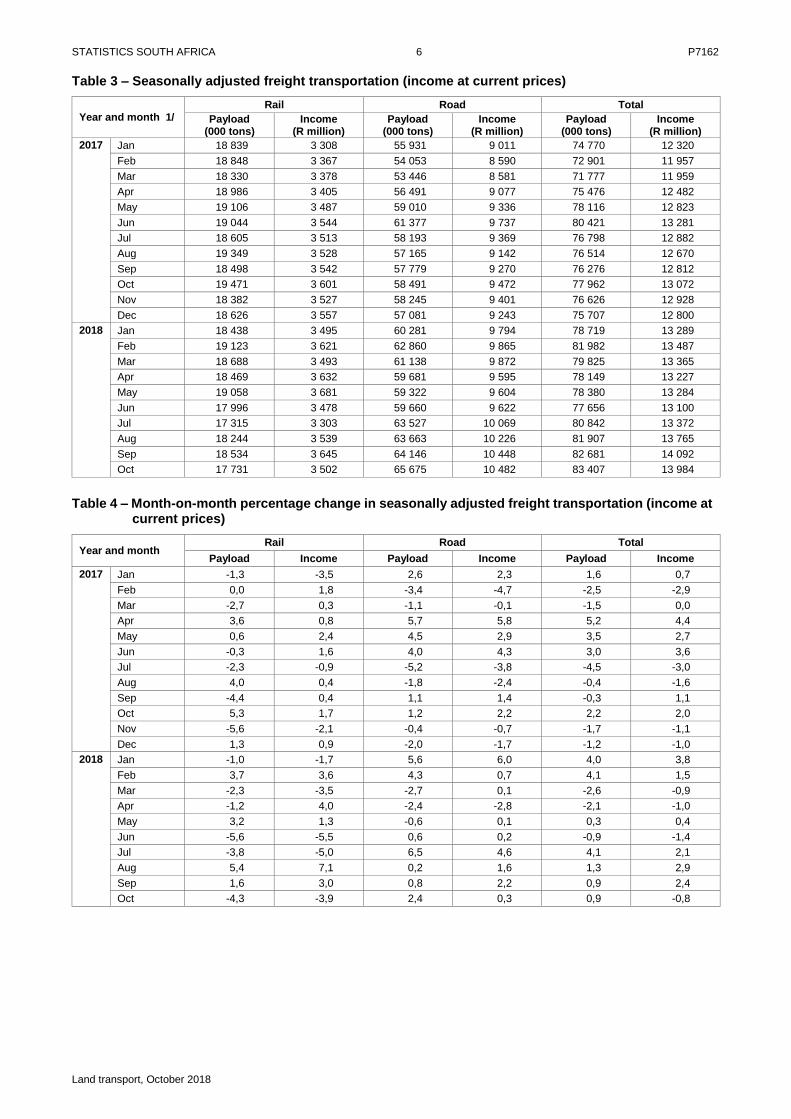
Table 3 – Seasonally adjusted freight transportation (income at current prices)
Year and month 1/ Rail Road Total
Payload (000 tons)
Income (R million)
Payload (000 tons)
Income (R million)
Payload (000 tons)
Income (R million)
2017 Jan 18 839 3 308 55 931 9 011 74 770 12 320
Feb 18 848 3 367 54 053 8 590 72 901 11 957
Mar 18 330 3 378 53 446 8 581 71 777 11 959
Apr 18 986 3 405 56 491 9 077 75 476 12 482
May 19 106 3 487 59 010 9 336 78 116 12 823
Jun 19 044 3 544 61 377 9 737 80 421 13 281
Jul 18 605 3 513 58 193 9 369 76 798 12 882
Aug 19 349 3 528 57 165 9 142 76 514 12 670
Sep 18 498 3 542 57 779 9 270 76 276 12 812
Oct 19 471 3 601 58 491 9 472 77 962 13 072
Nov 18 382 3 527 58 245 9 401 76 626 12 928
Dec 18 626 3 557 57 081 9 243 75 707 12 800
2018 Jan 18 438 3 495 60 281 9 794 78 719 13 289
Feb 19 123 3 621 62 860 9 865 81 982 13 487
Mar 18 688 3 493 61 138 9 872 79 825 13 365
Apr 18 469 3 632 59 681 9 595 78 149 13 227
May 19 058 3 681 59 322 9 604 78 380 13 284
Jun 17 996 3 478 59 660 9 622 77 656 13 100
Jul 17 315 3 303 63 527 10 069 80 842 13 372
Aug 18 244 3 539 63 663 10 226 81 907 13 765
Sep 18 534 3 645 64 146 10 448 82 681 14 092
Oct 17 731 3 502 65 675 10 482 83 407 13 984
Table 4 – Month-on-month percentage change in seasonally adjusted freight transportation (income at
current prices)
Year and month Rail Road Total
Payload Income Payload Income Payload Income
2017 Jan -1,3 -3,5 2,6 2,3 1,6 0,7
Feb 0,0 1,8 -3,4 -4,7 -2,5 -2,9
Mar -2,7 0,3 -1,1 -0,1 -1,5 0,0
Apr 3,6 0,8 5,7 5,8 5,2 4,4
May 0,6 2,4 4,5 2,9 3,5 2,7
Jun -0,3 1,6 4,0 4,3 3,0 3,6
Jul -2,3 -0,9 -5,2 -3,8 -4,5 -3,0
Aug 4,0 0,4 -1,8 -2,4 -0,4 -1,6
Sep -4,4 0,4 1,1 1,4 -0,3 1,1
Oct 5,3 1,7 1,2 2,2 2,2 2,0
Nov -5,6 -2,1 -0,4 -0,7 -1,7 -1,1
Dec 1,3 0,9 -2,0 -1,7 -1,2 -1,0
2018 Jan -1,0 -1,7 5,6 6,0 4,0 3,8
Feb 3,7 3,6 4,3 0,7 4,1 1,5
Mar -2,3 -3,5 -2,7 0,1 -2,6 -0,9
Apr -1,2 4,0 -2,4 -2,8 -2,1 -1,0
May 3,2 1,3 -0,6 0,1 0,3 0,4
Jun -5,6 -5,5 0,6 0,2 -0,9 -1,4
Jul -3,8 -5,0 6,5 4,6 4,1 2,1
Aug 5,4 7,1 0,2 1,6 1,3 2,9
Sep 1,6 3,0 0,8 2,2 0,9 2,4
Oct -4,3 -3,9 2,4 0,3 0,9 -0,8
STATISTICS SOUTH AFRICA 7 P7162
Land transport, October 2018
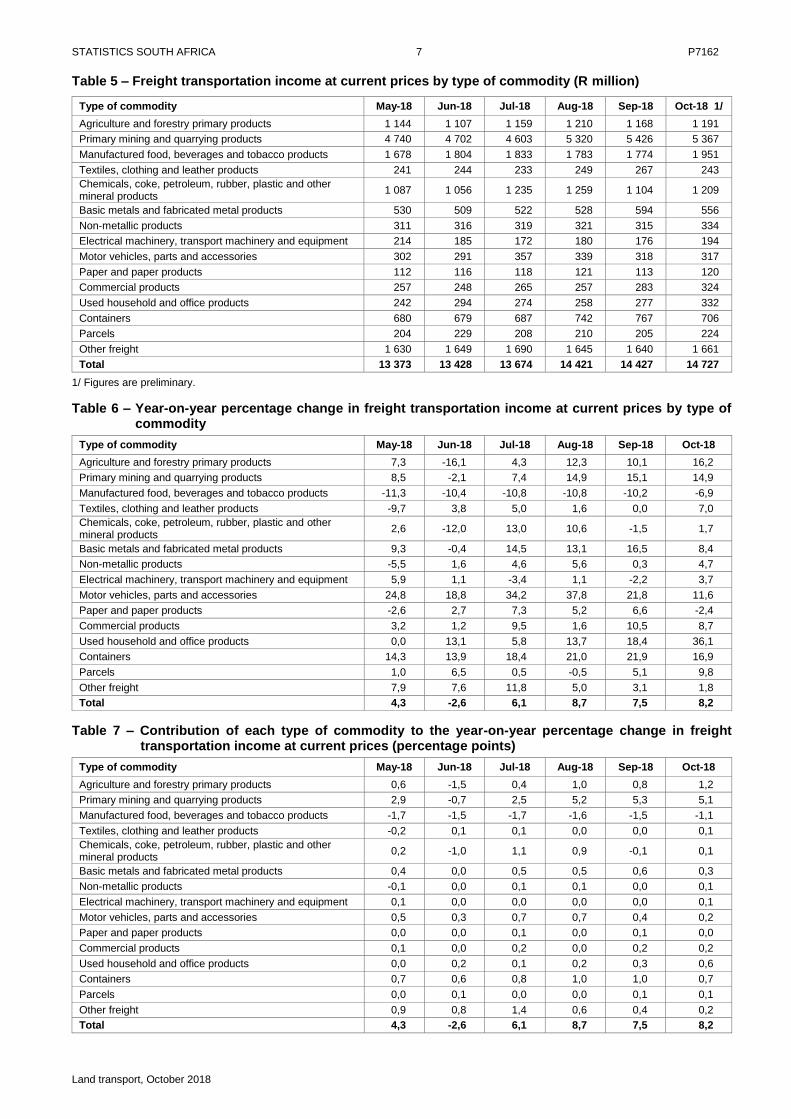
Table 5 – Freight transportation income at current prices by type of commodity (R million)
Type of commodity May-18 Jun-18 Jul-18 Aug-18 Sep-18 Oct-18 1/
Agriculture and forestry primary products 1 144 1 107 1 159 1 210 1 168 1 191
Primary mining and quarrying products 4 740 4 702 4 603 5 320 5 426 5 367
Manufactured food, beverages and tobacco products 1 678 1 804 1 833 1 783 1 774 1 951
Textiles, clothing and leather products 241 244 233 249 267 243
Chemicals, coke, petroleum, rubber, plastic and other mineral products
1 087 1 056 1 235 1 259 1 104 1 209
Basic metals and fabricated metal products 530 509 522 528 594 556
Non-metallic products 311 316 319 321 315 334
Electrical machinery, transport machinery and equipment 214 185 172 180 176 194
Motor vehicles, parts and accessories 302 291 357 339 318 317
Paper and paper products 112 116 118 121 113 120
Commercial products 257 248 265 257 283 324
Used household and office products 242 294 274 258 277 332
Containers 680 679 687 742 767 706
Parcels 204 229 208 210 205 224
Other freight 1 630 1 649 1 690 1 645 1 640 1 661
Total 13 373 13 428 13 674 14 421 14 427 14 727
1/ Figures are preliminary.
Table 6 – Year-on-year percentage change in freight transportation income at current prices by type of commodity
Type of commodity May-18 Jun-18 Jul-18 Aug-18 Sep-18 Oct-18
Agriculture and forestry primary products 7,3 -16,1 4,3 12,3 10,1 16,2
Primary mining and quarrying products 8,5 -2,1 7,4 14,9 15,1 14,9
Manufactured food, beverages and tobacco products -11,3 -10,4 -10,8 -10,8 -10,2 -6,9
Textiles, clothing and leather products -9,7 3,8 5,0 1,6 0,0 7,0
Chemicals, coke, petroleum, rubber, plastic and other mineral products
2,6 -12,0 13,0 10,6 -1,5 1,7
Basic metals and fabricated metal products 9,3 -0,4 14,5 13,1 16,5 8,4
Non-metallic products -5,5 1,6 4,6 5,6 0,3 4,7
Electrical machinery, transport machinery and equipment 5,9 1,1 -3,4 1,1 -2,2 3,7
Motor vehicles, parts and accessories 24,8 18,8 34,2 37,8 21,8 11,6
Paper and paper products -2,6 2,7 7,3 5,2 6,6 -2,4
Commercial products 3,2 1,2 9,5 1,6 10,5 8,7
Used household and office products 0,0 13,1 5,8 13,7 18,4 36,1
Containers 14,3 13,9 18,4 21,0 21,9 16,9
Parcels 1,0 6,5 0,5 -0,5 5,1 9,8
Other freight 7,9 7,6 11,8 5,0 3,1 1,8
Total 4,3 -2,6 6,1 8,7 7,5 8,2
Table 7 – Contribution of each type of commodity to the year-on-year percentage change in freight transportation income at current prices (percentage points)
Type of commodity May-18 Jun-18 Jul-18 Aug-18 Sep-18 Oct-18
Agriculture and forestry primary products 0,6 -1,5 0,4 1,0 0,8 1,2
Primary mining and quarrying products 2,9 -0,7 2,5 5,2 5,3 5,1
Manufactured food, beverages and tobacco products -1,7 -1,5 -1,7 -1,6 -1,5 -1,1
Textiles, clothing and leather products -0,2 0,1 0,1 0,0 0,0 0,1
Chemicals, coke, petroleum, rubber, plastic and other mineral products
0,2 -1,0 1,1 0,9 -0,1 0,1
Basic metals and fabricated metal products 0,4 0,0 0,5 0,5 0,6 0,3
Non-metallic products -0,1 0,0 0,1 0,1 0,0 0,1
Electrical machinery, transport machinery and equipment 0,1 0,0 0,0 0,0 0,0 0,1
Motor vehicles, parts and accessories 0,5 0,3 0,7 0,7 0,4 0,2
Paper and paper products 0,0 0,0 0,1 0,0 0,1 0,0
Commercial products 0,1 0,0 0,2 0,0 0,2 0,2
Used household and office products 0,0 0,2 0,1 0,2 0,3 0,6
Containers 0,7 0,6 0,8 1,0 1,0 0,7
Parcels 0,0 0,1 0,0 0,0 0,1 0,1
Other freight 0,9 0,8 1,4 0,6 0,4 0,2
Total 4,3 -2,6 6,1 8,7 7,5 8,2
STATISTICS SOUTH AFRICA 8 P7162
Land transport, October 2018
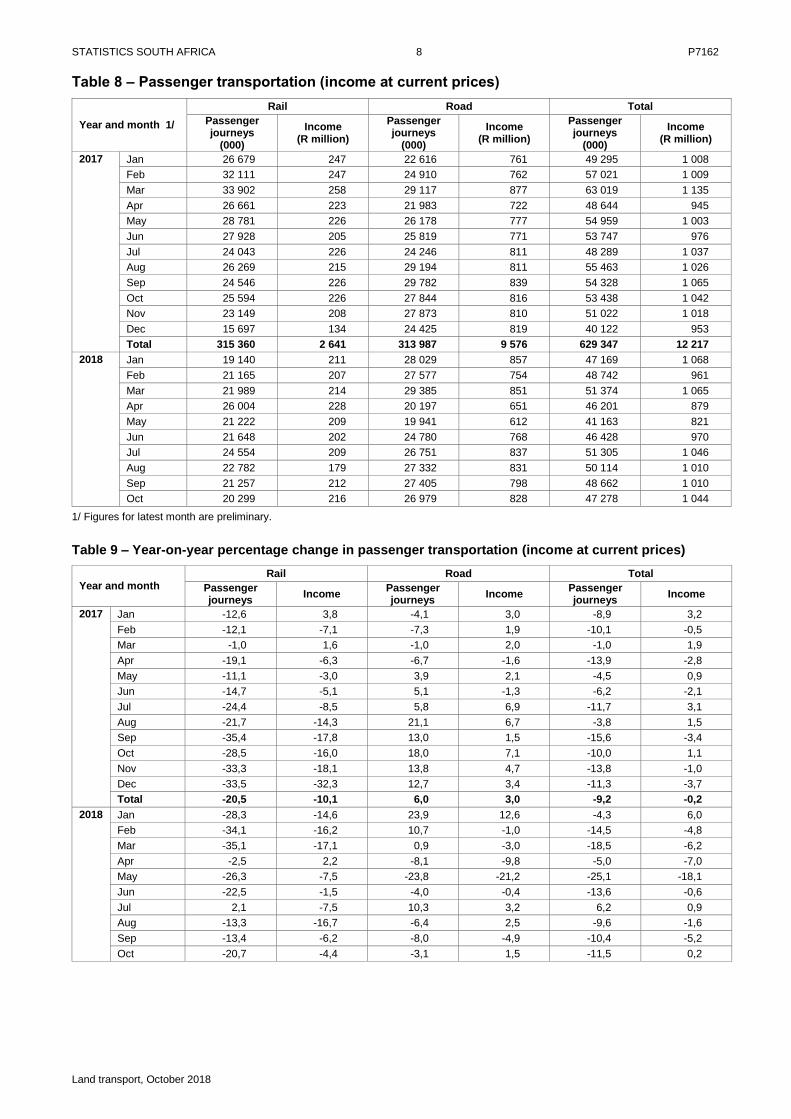
Table 8 – Passenger transportation (income at current prices)
Year and month 1/
Rail Road Total
Passenger journeys
(000)
Income (R million)
Passenger journeys
(000)
Income (R million)
Passenger journeys
(000)
Income (R million)
2017 Jan 26 679 247 22 616 761 49 295 1 008
Feb 32 111 247 24 910 762 57 021 1 009
Mar 33 902 258 29 117 877 63 019 1 135
Apr 26 661 223 21 983 722 48 644 945
May 28 781 226 26 178 777 54 959 1 003
Jun 27 928 205 25 819 771 53 747 976
Jul 24 043 226 24 246 811 48 289 1 037
Aug 26 269 215 29 194 811 55 463 1 026
Sep 24 546 226 29 782 839 54 328 1 065
Oct 25 594 226 27 844 816 53 438 1 042
Nov 23 149 208 27 873 810 51 022 1 018
Dec 15 697 134 24 425 819 40 122 953
Total 315 360 2 641 313 987 9 576 629 347 12 217
2018 Jan 19 140 211 28 029 857 47 169 1 068
Feb 21 165 207 27 577 754 48 742 961
Mar 21 989 214 29 385 851 51 374 1 065
Apr 26 004 228 20 197 651 46 201 879
May 21 222 209 19 941 612 41 163 821
Jun 21 648 202 24 780 768 46 428 970
Jul 24 554 209 26 751 837 51 305 1 046
Aug 22 782 179 27 332 831 50 114 1 010
Sep 21 257 212 27 405 798 48 662 1 010
Oct 20 299 216 26 979 828 47 278 1 044
1/ Figures for latest month are preliminary.
Table 9 – Year-on-year percentage change in passenger transportation (income at current prices)
Year and month Rail Road Total
Passenger journeys
Income Passenger journeys
Income Passenger journeys
Income
2017 Jan -12,6 3,8 -4,1 3,0 -8,9 3,2
Feb -12,1 -7,1 -7,3 1,9 -10,1 -0,5
Mar -1,0 1,6 -1,0 2,0 -1,0 1,9
Apr -19,1 -6,3 -6,7 -1,6 -13,9 -2,8
May -11,1 -3,0 3,9 2,1 -4,5 0,9
Jun -14,7 -5,1 5,1 -1,3 -6,2 -2,1
Jul -24,4 -8,5 5,8 6,9 -11,7 3,1
Aug -21,7 -14,3 21,1 6,7 -3,8 1,5
Sep -35,4 -17,8 13,0 1,5 -15,6 -3,4
Oct -28,5 -16,0 18,0 7,1 -10,0 1,1
Nov -33,3 -18,1 13,8 4,7 -13,8 -1,0
Dec -33,5 -32,3 12,7 3,4 -11,3 -3,7
Total -20,5 -10,1 6,0 3,0 -9,2 -0,2
2018 Jan -28,3 -14,6 23,9 12,6 -4,3 6,0
Feb -34,1 -16,2 10,7 -1,0 -14,5 -4,8
Mar -35,1 -17,1 0,9 -3,0 -18,5 -6,2
Apr -2,5 2,2 -8,1 -9,8 -5,0 -7,0
May -26,3 -7,5 -23,8 -21,2 -25,1 -18,1
Jun -22,5 -1,5 -4,0 -0,4 -13,6 -0,6
Jul 2,1 -7,5 10,3 3,2 6,2 0,9
Aug -13,3 -16,7 -6,4 2,5 -9,6 -1,6
Sep -13,4 -6,2 -8,0 -4,9 -10,4 -5,2
Oct -20,7 -4,4 -3,1 1,5 -11,5 0,2

STATISTICS SOUTH AFRICA 9 P7162
Land transport, October 2018
Table 10 – Seasonally adjusted passenger transportation (income at current prices)
Year and month
Rail Road Total
Passenger journeys
(000)
Income (R million)
Passenger journeys
(000)
Income (R million)
Passenger journeys
(000)
Income (R million)
2017 Jan 31 258 247 24 301 787 55 559 1 034
Feb 30 810 239 24 410 794 55 220 1 034
Mar 29 677 241 25 436 804 55 113 1 045
Apr 28 680 230 24 354 785 53 034 1 015
May 28 818 230 25 679 799 54 497 1 029
Jun 26 464 220 25 341 783 51 806 1 003
Jul 25 439 223 25 589 793 51 028 1 015
Aug 24 067 215 27 613 804 51 680 1 018
Sep 22 413 208 28 451 808 50 864 1 016
Oct 22 573 203 27 176 806 49 749 1 008
Nov 21 107 201 27 359 810 48 466 1 011
Dec 24 692 189 28 229 802 52 921 990
2018 Jan 24 268 210 29 741 884 54 009 1 094
Feb 20 004 201 27 063 785 47 066 986
Mar 20 087 201 26 245 776 46 332 977
Apr 25 873 227 22 206 720 48 079 947
May 19 515 211 19 249 633 38 764 844
Jun 21 710 224 24 914 785 46 624 1 009
Jul 24 801 201 27 413 816 52 213 1 018
Aug 20 388 176 25 621 818 46 009 995
Sep 19 662 198 26 225 771 45 887 969
Oct 18 068 193 26 379 816 44 447 1 009
Table 11 – Month-on-month percentage change in seasonally adjusted passenger transportation
(income at current prices)
Year and month Rail Road Total
Passenger journeys
Income Passenger journeys
Income Passenger journeys
Income
2017 Jan -1,9 0,4 -4,9 1,3 -3,2 1,1
Feb -1,4 -3,2 0,4 0,9 -0,6 0,0
Mar -3,7 0,8 4,2 1,3 -0,2 1,1
Apr -3,4 -4,6 -4,3 -2,4 -3,8 -2,9
May 0,5 0,0 5,4 1,8 2,8 1,4
Jun -8,2 -4,3 -1,3 -2,0 -4,9 -2,5
Jul -3,9 1,4 1,0 1,3 -1,5 1,2
Aug -5,4 -3,6 7,9 1,4 1,3 0,3
Sep -6,9 -3,3 3,0 0,5 -1,6 -0,2
Oct 0,7 -2,4 -4,5 -0,2 -2,2 -0,8
Nov -6,5 -1,0 0,7 0,5 -2,6 0,3
Dec 17,0 -6,0 3,2 -1,0 9,2 -2,1
2018 Jan -1,7 11,1 5,4 10,2 2,1 10,5
Feb -17,6 -4,3 -9,0 -11,2 -12,9 -9,9
Mar 0,4 0,0 -3,0 -1,1 -1,6 -0,9
Apr 28,8 12,9 -15,4 -7,2 3,8 -3,1
May -24,6 -7,0 -13,3 -12,1 -19,4 -10,9
Jun 11,2 6,2 29,4 24,0 20,3 19,5
Jul 14,2 -10,3 10,0 3,9 12,0 0,9
Aug -17,8 -12,4 -6,5 0,2 -11,9 -2,3
Sep -3,6 12,5 2,4 -5,7 -0,3 -2,6
Oct -8,1 -2,5 0,6 5,8 -3,1 4,1
STATISTICS SOUTH AFRICA 10 P7162
Land transport, October 2018
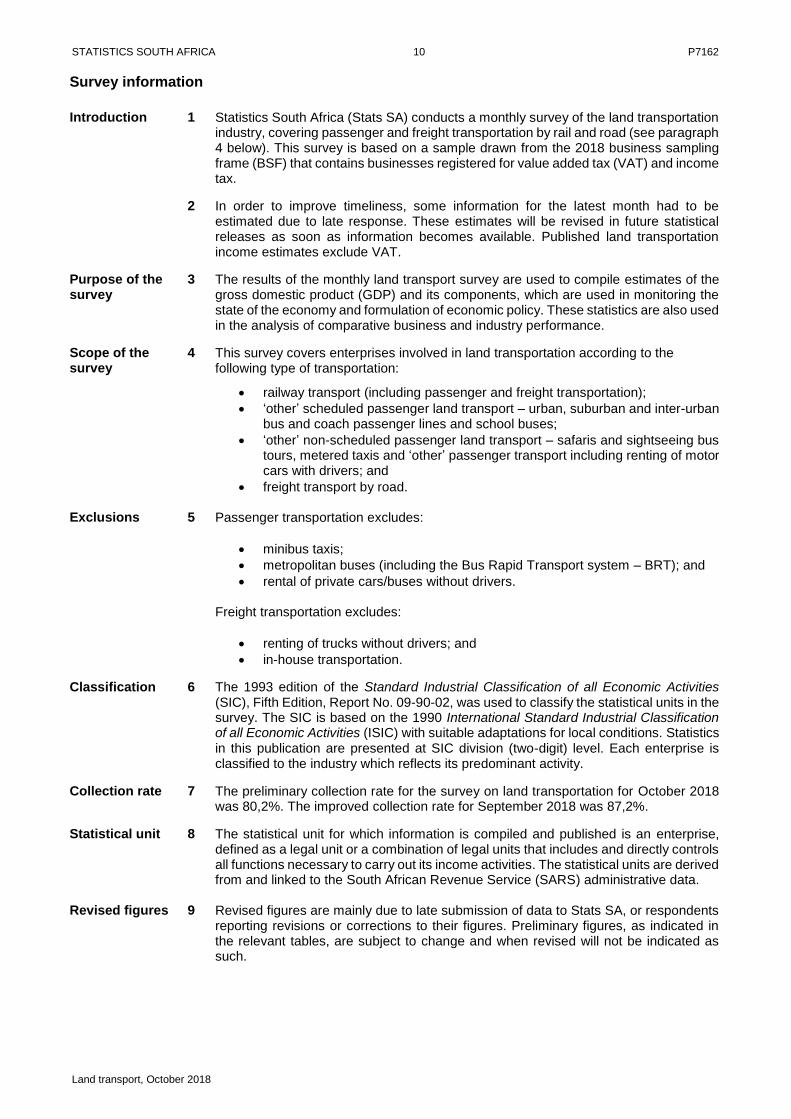
Survey information
Introduction 1 Statistics South Africa (Stats SA) conducts a monthly survey of the land transportation industry, covering passenger and freight transportation by rail and road (see paragraph 4 below). This survey is based on a sample drawn from the 2018 business sampling frame (BSF) that contains businesses registered for value added tax (VAT) and income tax.
2 In order to improve timeliness, some information for the latest month had to be estimated due to late response. These estimates will be revised in future statistical releases as soon as information becomes available. Published land transportation income estimates exclude VAT.
Purpose of the survey
3 The results of the monthly land transport survey are used to compile estimates of the gross domestic product (GDP) and its components, which are used in monitoring the state of the economy and formulation of economic policy. These statistics are also used in the analysis of comparative business and industry performance.
Scope of the survey
4 This survey covers enterprises involved in land transportation according to the following type of transportation:
railway transport (including passenger and freight transportation);
‘other’ scheduled passenger land transport – urban, suburban and inter-urban bus and coach passenger lines and school buses;
‘other’ non-scheduled passenger land transport – safaris and sightseeing bus tours, metered taxis and ‘other’ passenger transport including renting of motor cars with drivers; and
freight transport by road.
Exclusions 5 Passenger transportation excludes:
minibus taxis;
metropolitan buses (including the Bus Rapid Transport system – BRT); and
rental of private cars/buses without drivers.
Freight transportation excludes:
renting of trucks without drivers; and
in-house transportation.
Classification 6 The 1993 edition of the Standard Industrial Classification of all Economic Activities (SIC), Fifth Edition, Report No. 09-90-02, was used to classify the statistical units in the survey. The SIC is based on the 1990 International Standard Industrial Classification of all Economic Activities (ISIC) with suitable adaptations for local conditions. Statistics in this publication are presented at SIC division (two-digit) level. Each enterprise is classified to the industry which reflects its predominant activity.
Collection rate 7 The preliminary collection rate for the survey on land transportation for October 2018 was 80,2%. The improved collection rate for September 2018 was 87,2%.
Statistical unit 8 The statistical unit for which information is compiled and published is an enterprise, defined as a legal unit or a combination of legal units that includes and directly controls all functions necessary to carry out its income activities. The statistical units are derived from and linked to the South African Revenue Service (SARS) administrative data.
Revised figures 9 Revised figures are mainly due to late submission of data to Stats SA, or respondents reporting revisions or corrections to their figures. Preliminary figures, as indicated in the relevant tables, are subject to change and when revised will not be indicated as such.
STATISTICS SOUTH AFRICA 11 P7162
Land transport, October 2018
Related publications
10 Users may also wish to refer to the following publication available from Stats SA –
Stats in Brief issued annually. Rounding-off of figures
11 Where figures have been rounded off, discrepancies may occur between sums of the component items and the totals.
Historical data 12 Historical land transport data are available on the Stats SA website. To access the data electronically, use the following link: Click to download historical data
Past publications 13 Past land transport releases are available on the Stats SA website. To access the
releases electronically, use the following link: Click to download past releases
Technical notes
Survey methodology and design
1 The survey is conducted on a monthly basis. Questionnaires are sent to a sample of 704 enterprises from a population of 4 523 enterprises. Completed questionnaires are required to be returned to Stats SA within 10 days after the end of the reference month. Fax and telephone reminders are used to follow up on non-respondents.
2 A stratified random sample was drawn at the SIC four-digit level in April 2018 from Stats SA’s business sampling frame (BSF). Strata were formed using a combination of Standard Industrial Classification and the measure of size classes for enterprises (see paragraph 3 below). The Neyman optimal allocation formula given below was used to allocate samples to each stratum:
nh = n * ( Nh * Sh ) / [ Σ ( Ni * Si ) ]. Neyman allocation formula not only allocates sample sizes to each stratum but also calculates the relative precision for each stratum as well as the relative precision for all strata. The relative precision for these strata was 0,8%.
Sample design and class limits
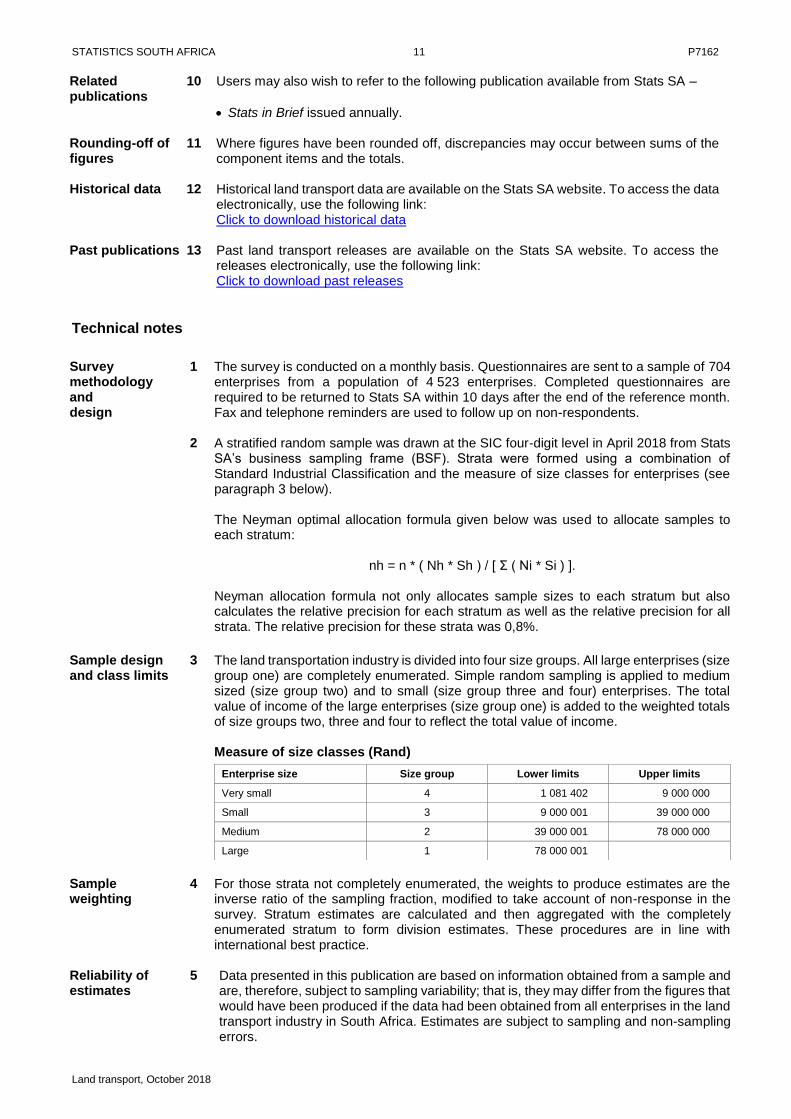
3 The land transportation industry is divided into four size groups. All large enterprises (size group one) are completely enumerated. Simple random sampling is applied to medium sized (size group two) and to small (size group three and four) enterprises. The total value of income of the large enterprises (size group one) is added to the weighted totals of size groups two, three and four to reflect the total value of income. Measure of size classes (Rand)
Enterprise size Size group Lower limits Upper limits
Very small 4 1 081 402 9 000 000
Small 3 9 000 001 39 000 000
Medium 2 39 000 001 78 000 000
Large 1 78 000 001
Sample weighting
4 For those strata not completely enumerated, the weights to produce estimates are the inverse ratio of the sampling fraction, modified to take account of non-response in the survey. Stratum estimates are calculated and then aggregated with the completely enumerated stratum to form division estimates. These procedures are in line with international best practice.
Reliability of estimates
5
Data presented in this publication are based on information obtained from a sample and are, therefore, subject to sampling variability; that is, they may differ from the figures that would have been produced if the data had been obtained from all enterprises in the land transport industry in South Africa. Estimates are subject to sampling and non-sampling errors.
STATISTICS SOUTH AFRICA 12 P7162
Land transport, October 2018
6
Inaccuracies may occur because of imperfections in reporting by enterprises and errors made in the collection and processing of the data. Inaccuracies of this kind are referred to as non-sampling errors. Every effort is made to minimise non-sampling errors by careful design of questionnaires, testing them in pilot studies, editing reported data and implementing efficient operating procedures. Fluctuations may occur in consecutive months as a result of seasonal and economic factors.
Year-on-year percentage change
7 The year-on-year percentage change in a variable for any given period is the change between that period and the corresponding period of the previous year, expressed as a percentage of the latter.
Contribution (percentage points)
8 The contribution (percentage points) to the annual percentage change for any given period is calculated by multiplying the percentage change of each type of commodity/service by its corresponding weight, divided by 100. The weight is the percentage contribution of each type of commodity/service to total income in the corresponding period of the previous year.
Seasonal adjustment
9 Seasonally adjusted estimates are generated each month using the X-12-ARIMA Seasonal Adjustment Program developed by the US Bureau of the Census. Seasonal adjustment is a means of removing the estimated effects of normal seasonal variation from the series so that the effects of other influences on the series can be recognised more clearly. Seasonal adjustment does not aim to remove irregular or non-seasonal influences which may be present in any particular month. Influences that are volatile or unsystematic can still make it difficult to interpret the movement of the series even after adjustment for seasonal variations. Therefore the month-to-month movements of seasonally adjusted estimates may not be reliable indicators of trend behaviour. The X-12-ARIMA procedure for land transportation is described in more detail on the Stats SA website at: Click to download seasonal adjustment land transport August 2017
Trend cycle 10 The trend is the long-term pattern or movement of a time series. The X-12-ARIMA
Seasonal Adjustment Program is used for smoothing seasonally adjusted estimates to estimates of the underlying trend cycle.
Glossary Enterprise An enterprise is a legal entity or a combination of legal units that includes and directly
controls all functions necessary to carry out its activities.
Industry An industry is made up of enterprises engaged in the same or similar kinds of economic activity. Industries are defined in the System of National Accounts (SNA) in the same way as in the Standard Industrial Classification of all Economic Activities (SIC), Fifth Edition, Report No. 09-90-02 of January 1993.
Symbols and abbreviations
BSF Business sampling frame GDP Gross domestic product ISIC International Standard Industrial Classification SIC Standard Industrial Classification of all Economic Activities SARS South African Revenue Service Stats SA Statistics South Africa VAT Value added tax
Technical enquiries
Kagisho Mathabatha Telephone number: (012) 310 2153
Email: [email protected]
Keshnee Naidoo Telephone number: (012) 310 8423 Email: [email protected]
STATISTICS SOUTH AFRICA 13 P7162
Land transport, October 2018
General information
Stats SA publishes approximately 300 different statistical releases each year. It is not economically viable to produce them in more than one of South Africa's eleven official languages. Since the releases are used extensively, not only locally but also by international economic and social-scientific communities, Stats SA releases are published in English only. Stats SA has copyright on this publication. Users may apply the information as they wish, provided that they acknowledge Stats SA as the source of the basic data wherever they process, apply, utilise, publish or distribute the data: and also that they specify that the relevant application and analysis (where applicable) result from their own processing of the data.
Advance release calendar A release calendar is disseminated on www.statssa.gov.za Stats SA products A complete set of Stats SA publications is available at the Stats SA Library and the following libraries: National Library of South Africa, Pretoria Division National Library of South Africa, Cape Town Division Natal Society Library, Pietermaritzburg Library of Parliament, Cape Town Bloemfontein Public Library Johannesburg Public Library Eastern Cape Library Services, King William’s Town Central Regional Library, Polokwane Central Reference Library, Mbombela Central Reference Collection, Kimberley Central Reference Library, Mmabatho Stats SA also provides a subscription service. Electronic services A large range of data is available via online services. For more detail about our electronic services, contact Stats SA’s user information service at (012) 310 8600.
You can visit us on the internet at: www.statssa.gov.za General enquiries User information services Telephone number: (012) 310 8600 Email address: [email protected] Postal address Private Bag X44, Pretoria, 0001
Produced by Stats SA