land ownership, sales and concentration in cambodia
TRANSCRIPT

Land Ownership, Salesand Concentration
in Cambodia
A Preliminary Review of Secondary Dataand Primary Data from Four Recent Surveys
Working Paper 16
CAMBODIA DEVELOPMENT RESOURCE INSTITUTEWorkingPaperNo. 16
Sik Boreak
ISSN 1560-9197
01Cambodia Development
Resource Institute Tenth Anniversary1990 - 2000


Land Ownership, Sales andConcentration in Cambodia
A Preliminary Review of SecondaryData and Primary Data from Four
Recent Surveys
Working Paper 16
Sik Boreak
Cambodia Development Resource InstitutePhnom Penh, September 2000

Copyright © 2000 Cambodia Development Resource Institute
All rights reserved. No part of this publication may be reproduced, stored in a retrieval system or transmitted in anyform or by any means—electronic, mechanical, photocopying, recording, or otherwise—without the writtenpermission of the Cambodia Development Resource Institute.
ISSN 1560-9197
Land Ownership, Sales and Concentration in Cambodia — Working Paper 16
September 2000
Sik Boreak
Responsibility for the ideas, facts and opinions presented in this research paper rest solely with the author. Hisopinions and interpretations do not necessarily reflect the views of the Cambodia Development Resource Institute.
Cambodia Development Resource Institute
56 Street 315, Tuol Kork, Phnom Penh (Postal address: PO Box 622, Phnom Penh, Cambodia)
Tel: (855-23) 368-053/880-734/883-603 Tel/Fax: (855-23) 366-094
e-mail: [email protected] website: http://www.cdri.org.kh
Editing and Layout: Ann Bishop, Em Sorany and Oum ChanthaPrinted and Bound in Cambodia by Japan Printing House, 74 Street 99, Phnom Penh

Contents
Abstract ...................................................................................................... i
Acronyms and Abbreviations ...................................................................... iii
Acknowledgements ......................................................................................v
Chapter 1. Introduction ............................................................................................. 1
Chapter 2. Historical Background .............................................................................. 3
Chapter 3. Description of the Data ............................................................................. 7
3.1 Household Socio-economic Survey in Fishing Communities .................... 7
3.2 Cambodia Socio-economic Survey 1997 ................................................. 7
3.3 Cambodian 1998 Baseline Survey of CASD Project and
WFP Target Areas ................................................................................. 8
3.4 Protracted Emergency Target Survey ...................................................... 8
3.5 Comparability and limitation of the surveys ............................................ 9
Chapter 4. Land Acquisition, Tenure and Ownership .............................................. 11
4.1 Land acquisition (PET survey data only)................................................ 11
4.2 Land tenure (SES and PET data only) .................................................... 12
4.3 Land ownership (all four surveys) ........................................................ 13
Chapter 5. Land Sales, Land Tenancy and Land Grabbing ...................................... 17
5.1 Land sales (Baseline and PET data only)................................................ 17
5.2 Land tenancy ...................................................................................... 23
5.3 Land grabbing (PET survey) ................................................................. 24
Chapter 6. Land Pressure and Concentration (all four surveys) ................................. 25
Chapter 7. Suggestions for Improvement of Future Questionnaires ......................... 33
Chapter 8. Conclusion .............................................................................................. 37
8.1 Summary of results .............................................................................. 37
8.2 Policy implications .............................................................................. 37
8.3 Suggestions for further research ........................................................... 38

Appendix A: Land-related Questions ........................................................ 39
Appendix B: The Application Process for Land Occupation and
Use Rights Certificate .......................................................... 45
Appendix C: Land Sales Form ................................................................. 47
References ............................................................................................ 49
CDRI Working Papers .............................................................................. 51

i
Abstract
Land is the most important productive asset in agrarian societies such as Cambodia’s.Throughout Cambodian history, land ownership rights have varied with changes ingovernment. In the period before French colonisation (pre-1863), when all land belonged tothe sovereign, people were freely allowed to till unoccupied land and could cultivate as muchas they liked. With French colonisation, a property-rights system was introduced in 1884.After Cambodia gained independence from France in 1953, a Western-style land ownershipsystem continued until 1975, when the Khmer Rouge seized power and eliminated all privateproperty rights. Land ownership rights were reintroduced in 1989, following the failure of theKhmer Rouge regime in 1979 and ten years of unsuccessful collectivised production.
Within ten years of the reintroduction of private ownership and the redistribution ofland, land issues have become one of the most sensitive economic, social, and political issuesin Cambodia, demanding urgent solution. In the absence of comprehensive land-related data,this study extensively analyses secondary data and primary data from four large-scale surveysto better understand the magnitude of current land issues.
Based on this analysis, it appears that most of Cambodians own at least some land, butonly a small proportion of the population has official land titles. Over 70 to 80 percent of thetotal rural population possesses agricultural land acquired in different ways (governmentdistribution, gifts from relatives/friends, purchase, or clearance of unused land), but only 1percent has legal title to their land.
The average size of agricultural holdings in Cambodia is quite small (only about 1hectare per family) and distribution is highly unequal. Female-headed households generallyhave smaller holdings than male-headed households. About 40 to 50 percent of the landlessand marginal landholders possess only about 10 to 15 percent of all agricultural land in ruralareas. The estimated Gini coefficients of land concentration range from 0.47 to 0.66 for thedifferent surveys that target different population groups.
Even though only a very small proportion of the population has official title to theirland, people have been actively transferring land (their only productive asset) on the market.Not only has private property changed hands, but also common property, such as forestry andfishery resources (state property), has been actively transferred to private use as concessionsor for long-term investment.
In the concluding chapter, the study draws some policy implications and proposes somesuggestions for the improvement of future studies of land issues. The suggestions includequestions to be answered in future research, as well as specific items to include in futuresurvey questionnaires.


iii
Acronyms and Abbreviations
CASD Community Action for Social Development
CPR Common Property Resources
GDP Gross Domestic Product
IDP Internally Displaced Persons
MAFF Ministry of Agriculture, Forestry and Fisheries
MRC Mekong River Commission
NIS National Institute of Statistics
PET Protracted Emergency Targets
SOC State of Cambodia
UNICEF United Nations Children’s Fund
UNWFP United Nations World Food Programme


v
Acknowledgements
Many people contributed their time and expertise over the course of this study. Without theirassistance and valuable contributions, the study would not have been completed. I would liketo give special acknowledgement and appreciation to the United Nations World FoodProgramme (UNWFP), the Mekong River Commission (MRC) and the National Institute ofStatistics (NIS), for contributing the raw data of their surveys which made the study possible.
In particular, I would like to thank Dr. Jacqueline Desbarats and Mr. Shaun Williamsfor their valuable time and patience in extensively editing the paper. Their suggestionsconsiderably improved the paper. Thanks are also due to Mr. Paul Matthews for his usefulcomments. This study is the result of comprehensive consultations with people from manyinstitutions. Since it is not possible to list the names of all those who contributed, I would liketo express my gratitude here for their information and cooperation.
I am also very grateful for the assistance provided by colleagues at CDRI. I wouldparticularly like to thank Ms. Eva Mysliwiec and Dr. Martin Godfrey for their continuoussupport, encouragement and guidance throughout the course of the study.


1
Chapter One
Introduction
Land is the most important productive asset and store of accumulated wealth for 84 percent ofthe Cambodian people, whose main income is derived from agricultural activities.Traditionally, Cambodian farmers use land to produce food for subsistence, especially rice,and to generate a surplus of agricultural products for sale. In 1997-98, over two million ha ofagricultural land were devoted to rice production, which contributed 11 percent to the totalGross Domestic Product (NIS 1999:15). In addition, large areas of land are allocated to othertypes of agricultural production such as rubber plantations, fisheries and livestock. These tooare important sources of income for rural people.
The way in which land rights are assigned determines farmers’ social and economicstatus and affects their ability to sustain themselves. With major economic reform in 1989, theCambodian government attempted to implement an effective land management policy. Landwas redistributed to private individuals (with rejection of pre-1979 ownership) and privateownership 1 of land was reintroduced.
Since 1989, the government has approved and implemented the following legalframeworks related to land in order to ensure efficient land privatisation and management:
• Sub-Decree No. 25, Council of Ministers of the People’s Republic of Kampuchea,22 April 1989; Political Instruction No. 3, Enforcing Instruction of the Principles forthe Management (krup krong) and Use (prae prass) of Lands, Council of Ministersof the State of Cambodia, 03 June 1989;
• Land Law, National Assembly of the State of Cambodia, 13 October 1992;
• National Constitution, National Assembly of the Kingdom of Cambodia, September1993; and
• Law for the Management of Urbanization and Construction, National Assembly ofthe Kingdom of Cambodia, May 1994.
Sub-decree No. 25 clearly redistributed residential land and houses to privateindividuals (those who occupied the land at the date of the signing of the order), whereasInstruction No. 3 provided agricultural land to most (if not all) farmers who had been workingon the land. Private ownership of land has been possible since then.
However, the complexity and lack of clarity of these regulations has given rise toenormous issues and conflicts relating to land encroachment, land grabbing and landtransactions. These processes appear to be contributing to a rapid increase in the incidence oflandlessness throughout the country, especially among vulnerable groups (households headed
1 The situation in which a private individual or household is allowed to own and to have the right to
manage land exclusively and solely as residential land or residential buildings.

Land Ownership, Sales and Concentration in Cambodia Working Paper 16
2
by females and disabled people). The majority of the population occupy land without legaldocuments. Many private and state properties have changed hands legally or illegally as aresult of market forces and other reasons. Despite some confusion between applicationreceipts and ownership rights (kamaset)2, with the re-introduction private ownership, peoplehave transferred their residential land from one to another. Although possession rights(phokeak )3 can only be obtained for agricultural/cultivation land, the market for this type ofland has also been active.
Moreover, owing to the lack of distinction between common property and state property,millions of hectares of forest and agricultural land have been granted to private companies forlong-term investment and concession exploitation. According to the Department of Planningand Statistics of the Ministry of Agriculture, Forestry and Fisheries (MAFF), 4,739,153hectares (ha) of forest have officially been granted to private companies for long-terminvestment (up to 20-30 years). This includes 264,924 ha for three forest concessions whichwere recently cancelled. Likewise, 662,496 ha of agricultural land have been granted toprivate companies for long-term investment (up to 70 years). This includes 46,600 ha for fiveagricultural concessions which were recently cancelled. In addition, 1 million ha of fishinglots have been allocated for commercial use. The transfer of common property resources toprivate owners is believed to be much higher than the above figure because of land grabbingand land encroachment by various groups.
Objectives
The magnitude of these legal and illegal transactions and their impact has not yet beencritically and comprehensively studied at the aggregate level. The main objectives of thisstudy, therefore, were to use existing large-scale databases to:
• identify patterns of land acquisition4, land tenure5 and land ownership;6
• identify the magnitude of land transactions in the market;
• identify trends in the availability of benefits derived from common propertyresources (CPR);
• identify the incidence of land concentration and landlessness;
• identify the relationship between gender- and land-related issues; and
• make some suggestions for improvement of future surveys on land.
2 Ownership right (kamaset) is the right to manage absolutely and exclusively any property, provided
that it is not prohibited by law. Ownership right can only be acquired on residential land inCambodia.
3 Possession right (phokeak) is the right to exclusive possession of any property and to undertake anyactions concerning the property as an owner would. Unlike land under ownership right, land underpossession right shall become the private domain of the state if it is abandoned for three consecutiveyears (Article 76 of Land Law).
4 This refers to the way in which populations obtain residential and agricultural land in Cambodia.5 This refers to the legal right (or legal document to prove ownership) of landholders to live in a
particular building or to use a particular piece of land.6 This refers to circumstances in which people have land to live and work on.

3
Chapter Two
Historical Background
Since land is the most valuable asset for the majority of people in Cambodia, successivegovernments have considered it in planning for economic development and sustainablepoverty reduction. It has often been the central focus of government intervention, as thefollowing review of land policies since the nineteenth century shows.
Pre-French Colonisation (Pre-1863): It is believed that all land belonged1 to thesovereign. Practically-speaking, most people were able to freely till their own land and couldcultivate as much as they liked. With a small population and the absence of a land market, thecultivating proprietor could move from one area to another and assume ownership. Ownershad exclusive right to possess, use and inherit agricultural land, without having to fulfil anyformalities except corveé or other feudal tribute.
French Colonial Period (1863-1953): After colonising Cambodia in 1863, the Frenchchanged the traditional land use system in Cambodia by first promulgating a Land Act in1884, which was not fully implemented before 1912 due to the resistance of Cambodianfarmers. By 1930, most of the rice-growing fields were registered as private property andpeople were also free to sell their land. More importantly, all free areas or unoccupied land,became available for customary ownership rights2 and sale after clearing and occupation.Virgin land was still available , leaving opportunities for those people who sold their land tomove to the forests. By 1930, most of the land was divided into plots of less than 5 hectaresand large plantations had been established (Greve, 1993).
Independent Period (1953-1975): After Cambodia gained independence from France in1953, the Western system of property ownership continued, with an increase in landtransactions. Meijers (1994) claimed that by 1962 more than 30,000 non-agriculturalhouseholds had land. He added that even though the 1962 census showed that out of 800,000agricultural families, 84 percent were "owners only" (neither tenants nor share croppers), theywere not well off.
Since the majority of rice fields had low productivity (about 1 ton per hectare, t/ha)under the predominant production system of rain-fed rice, farmers became indebted (three-quarters in 1952) and some eventually became landless. For both farm expenses and non-farmexpenses, farmers borrowed from private moneylenders at very high interest rates. These wereoften as high as 30 percent, but sometimes as high as 100 to 200 percent per season (Meijers,1994). In order to repay debts, farmers had to sell their rice harvest to private moneylenders atless than the market price. As a result, they did not have much rice left for familyconsumption, and had to borrow money again to buy rice at the much higher market price.
1 The sovereign possessed, theoretically, absolute right over land (Meijers, 1994:3).2 The rights to clear virgin/unoccupied land for possession, use and inheritance.

Land Ownership, Sales and Concentration in Cambodia Working Paper 16
4
This vicious circle often continued and some poor farmers had to sell their land to pay debtsand thus became landless (Greve, 1993).
Democratic Kampuchea (1975-79): The Khmer communists, known as Khmer Rouge,seized power from the Lon Nol government and proclaimed 1975 as Year Zero. Under KhmerRouge ideology, all people were equal and everybody had to work in the fields. All landbelonged to angkar, and nobody could own even a little piece of land as private property(troapsambat eckachun)3 and private ownership (kamaset eckachun)4 of land was abandoned.Angkar was master of water and master of the earth “Angkar mchah teuk mchah dei” (Greve,1993).
Under Khmer Rouge policies, rice production was the highest priority. Rice fields wereredesigned into 1 ha square plots and the production system was collectivised with atremendously-heavy workload of up to 18 hours a day. In the hope of increasing riceproduction to the level of 7 t/ha, many poorly-designed irrigation systems, dams, canals andreservoirs were inadequately built by manual labour. These were largely ineffective.
Centrally-Planned Economy (1979-1989): After the failure of the Khmer Rouge regimein 1979, the country was devastated. Under the threat of widespread famine, millions ofdisplaced and starving people returned to their homes. With limited foreign support (mainlyfrom the former communist bloc), a war-torn infrastructure and scarce human resources, thenew government decided to set up collective property rights5 for land and housing. Because ofshortages of labour, draft animals, production equipment and cohesive collectives, KromSamaki (collectives) were established in order to fulfil immediate food requirements.
The collectives consisted of 10 to 15 families who shared land, labour and draftanimals. The Krom Samaki were allowed to occupy and use agricultural land, although allland, including residential land, was officially the property of the State. Land wasredistributed to Krom Samaki based on the labour, draft animals and land available in eacharea. It is important to mention that even though all land belonged to the state, occasionallyduring this period some residential land was unofficially transferred between people bymutual agreement6 (Greve, 1993).
Post-1989 (1989-Present): By 1989 the failure of collectivisation and the centrally-planned economic system was obvious and the government concluded that Cambodianconditions made the adoption of such policies impossible. Following a massive reduction insupport from former Eastern Bloc countries, the government began reforming the entireeconomy towards a free-market system. In addition to implementing major economic reforms,the government took a further step and reintroduced private property rights in 19897.
According to Political Instruction (prakas) No. 3, all land in Cambodia belongs to theState: “the land of the State of Cambodia is the property of the State.” But Cambodians havethe right to possess and use it: “the Cambodian population has the full right to occupy(kankap) and use (praeapras) the land and has the right to sell the land provided by the Statefor domicile and exploitation.” At the same time, the ownership rights in force before 1975were invalidated: "no one can claim the rights (set) of ownership of land (kamaset) prior to
3 A property that does not generally benefit the public interest as a whole and that a private individual
can own.4 The situation in which a private individual/household is allowed to own a property.5 The rights given to a group (collective or krom samaki) to occupy and use land while the outputs
from the land were shared among all group members.6 This information was obtained from an interview on 23 June 1999 with Mr. Huy Phab, previously
Vice-Chief of the Land Conservation Office, and now Deputy-Director of the ConservationCadastre Department of the General Department of Cadastre and Geography.
7 The rights given to a private individual/household to have ownership for residential land/buildingsand possession for agriculture.

Cambodia Development Resource Institute Historical Background
5
1979.” Furthermore the occupation of land and residential buildings from 7 January 1979onward was recognised: “the State will not review and make a new division on land that isalready occupied from 7 January 1979 to the date of this instruction which shall be applieduntil there is a land law.” The instruction also defined three categories of land, as follows:
• land for domicile: shall be provided for ownership (kamaset) by the provincialcommittee or municipality;
• cultivation land (dey damdos)/agricultural land: is for production and exploitation.It is state land allocated for the farmers to manage (krupkrong) and use (praeaprass)for production and exploitation; and
• concession land (deysampatein): greater than 5 ha. Concessions provide the right tooccupy land (kankup) for large-scale crop production which will contribute to thenational economy.
Of these three land categories, private ownership rights could be obtained only on landfor domicile ; whereas on cultivation land and concession land respectively, only possessionand use rights and the right to exclusively occupy could be obtained.
Along with the reintroduction of private property rights, Sub-Decree No. 25 andInstruction No. 3 also redistributed land to private households. Land redistribution was basedon the number of family members and land availability in an area. Generally, redistributionwas implemented by the local authorities with full participation of the local communities. Thevillagers apparently gathered together to identify the number of members in each family andthe available land in the area. Then they divided the available land in accordance with thenumber of people in each family and land availability. They also took into account soilfertility and location so that each family received a few plots of agricultural land. Theredistribution system seemed fair to ordinary people, even returnees. As stated in theInstruction, Cambodian refugees, overseas returnees, and Khmer Rouge returnees, if returningto a village, were to be provided with land for housing, paddy for farming on land that wasfree or vacant claimable land (Meijers, 1994).
The amount of land distributed to households varied depending upon the populationdensity in an area. In some provinces with low population density, people could get up tothree ha/family (for example in Pursat); whereas in the high density areas they were givenonly 0.5-1.0 ha/family, e.g. Takeo (Huy Phab, 1999). Only residential/housing land andproductive land were redistributed to people to be owned and possessed. The remaining landwas kept as state/common land for future development.
In addition to Sub-Decree No. 25 and Political Instruction No. 3, the Land Law of 1992contains significant provisions such as Articles 1 and Article 2:
Article 1:All the land in Cambodia belongs to the State and shall be governed andprotected in agreement by the State. The State does not recognise landproperty rights existing before 1979. The property rights and any other rightsrelating to land shall be governed by this law.
Article 2:Cambodians have full right to possess and to use land and have the right toinheritance of the property provided by the State for living and for doingbusiness.
Again, this means that all land in Cambodia belongs to the State and that Cambodianscan have the right to possess, use, transfer and inherit land and that the ownership rightsexisting before 1979 will not be returned to the prior owners.


7
Chapter Three
Description of the Data
As stated earlier in this paper, attempts were made to analyse relevant land-issue indicatorsfrom available large-scale databases. Four large-scale household surveys were obtained fromvarious institutions – one from a Mekong River Commission (MRC) project, another onefrom the National Institute of Statistics (NIS) and two from the World Food Programme(WFP). It is important to bear in mind that all of these surveys had different characteristicssince they focused on different groups of people and were designed to fulfil differentpurposes. The questions relating to land asked in each survey are shown in Appendix A.
3.1 Household Socio-economic Survey in Fishing Communities (Socio-economicAssessment of Freshwater Capture Fisheries of Cambodia), MRC 1995-96(identified hereafter as the MRC Survey)
A Socio-economic Household Survey of Fishing Communities in Cambodia was conductedby the Mekong River Commission (MRC) under the project Management of FreshwaterCapture Fisheries of Cambodia . The primary purpose of the survey was to assess the socio-economic conditions of households living in fishing-dependent communes in order to providenecessary information and an appropriate perspective for the sustainable management offreshwater-capture fisheries in Cambodia.
The study identified eight provinces (Siem Reap, Battambang, Pursat, KampongChhnang, Kandal, Phnom Penh, Kampong Cham and Kampong Thom) with a population ofabout 4.19 million people in freshwater fisheries communities. This is more than 40 percentof the total population in these provinces. From those provinces, a total of 5,117 samplehouseholds covering 83 sample communes in 51 fishing districts were randomly selected torepresent 328 fishing-dependent communes. The selected communes also covered the twomajor water systems involved in freshwater-capture fisheries: the Great Lake and Tonle SapRiver system; and the Mekong-Bassac Rivers and adjoining flood-lands system.
3.2 Cambodia Socio-economic Survey 1997 (identified hereafter as the SES)
The Cambodia Socio-economic Survey, the first large-scale multi-objective householdsurvey, was conducted by the National Institute of Statistics (NIS) between May and June1997. The principal objective of the survey was to collect data needed for the measurement ofliving standards and for monitoring and analysis of poverty.
The survey was based on a two-stage stratified random sampling design, with villagesas primary sampling units, and households as secondary sampling units. The truncated frameused for the survey covered 100 percent of the villages in Phnom Penh, 91.2 percent ofvillages in other urban centres and 86.3 percent of villages in rural areas. For security reasons,however, two provinces and a number of communes in the other 15 provinces were excludedfrom the survey frame. The proportion of households excluded was low, amounting only to

Land Ownership, Sales and Concentration in Cambodia Working Paper 16
8
4.8 percent of the households in "other urban areas" and 1.6 percent of the households in ruralareas.
Based on the above criteria, 6010 households were selected for interview. These weredistributed as follows:
Phnom Penh, 120 sample villages and 1200 sample households
Other urban centres, 100 sample villages and 1000 sample households
Rural areas 254 sample villages and 3810 sample households
Total 474 sample villages and 6010 sample households
3.3 Cambodian 1998 Baseline Survey of Community Action for SocialDevelopment (CASD) Project and WFP Target Areas, UNICEF-WFP (identifiedhereafter as the Baseline Survey)
The Joint UNICEF-World Food Programme (WFP) Baseline Survey was conducted by WFPbetween May and June 1998. The main purpose of the survey was to provide a comprehensiveset of information for use in the development, targeting and evaluation of two of theirprogrammes: (1) the Community Action for Social Development (CASD) programme forhealth and nutritional status, and (2) the WFP programmes on food security and vulnerability.The survey focused on some provinces in which selected villages had a CASD or a WFPproject. The survey limited the target sample to those who had at least one child under fiveyears of age.
The survey was based on a multi-stage, random sampling procedure, with the village asthe sampling unit. A random sample of approximately 50 villages was selected from the sixCASD-UNICEF provinces. In addition, 13 villages of CASD-PFD were randomly selected inKratie and Stung Treng provinces. Another sample of 62 villages was drawn from five WFPfood economy zones, based on the national distribution of villages by zone. A total of 125villages were selected for the survey.
In these sampled villages, households with children under five years of age wererandomly selected as the target group. The number of households selected depended onvillage size. In some cases there were as many as 300 households. In others there were as fewas 50. The survey also limited the number of families to be interviewed to eight if the villagehad 80 households, 10 if the village had 80-120 households, and 12 if the village had morethan 120 households. Therefore, 1230 households were actually selected for interview.
3.4 Protracted Emergency Target Survey, UNWFP 1998 (identified hereafter asthe PET Survey)
The Protracted Emergency Target (PET) Survey was conducted by WFP in late 1998. Themain objective of this survey was to provide a baseline of information on social conditionsand on the nutritional status of returnees and internally-displaced persons (IDP)1 againstwhich programme impacts could be measured in the year 2000. Like the Baseline Survey, thePET survey targeted parts of selected provinces in which the surveyed villages were randomlyselected from PET communes. The targeted households were those which had at least onechild under five years of age and with the mother present.
Based on regional grouping, homogeneity of social conditions and IDP origin, thesample was stratified into four zones and a two-stage, random-sampling methodology wasused to select samples. In the first stage, five communes from each PET zone were randomly
1 WFP-Cambodia defined internally-displaced persons (IDP) as “those persons who have been
displaced from their normal place of living by fighting in the period since 1989”, Helmers andKenefick 1999:12.
Cambodia Development Resource Institute Description of the Data
9
selected. In the second stage, two villages per commune, which were eligible according toWFP criteria, were selected and non-PET villages were eliminated. Then the PET villageswere randomly selected for interview by using a random numbers table. However, communesand villages with unacceptable levels of risk from mine hazards, such as mines on the mainroad into the commune, were eliminated from the sample.
Within these sampled villages, 26 households were selected from each village in orderto produce a total sample of 1040 households. The households which fell within PET criteria,with at least one child under five years of age, and the mother of that child in the house, wererandomly chosen by interval selection. In the very few cases where villages were too small toprovide enough mothers and children to reach the target of 26 households, a third village wasrandomly selected and the remaining households were selected and included in the surveyprocess.
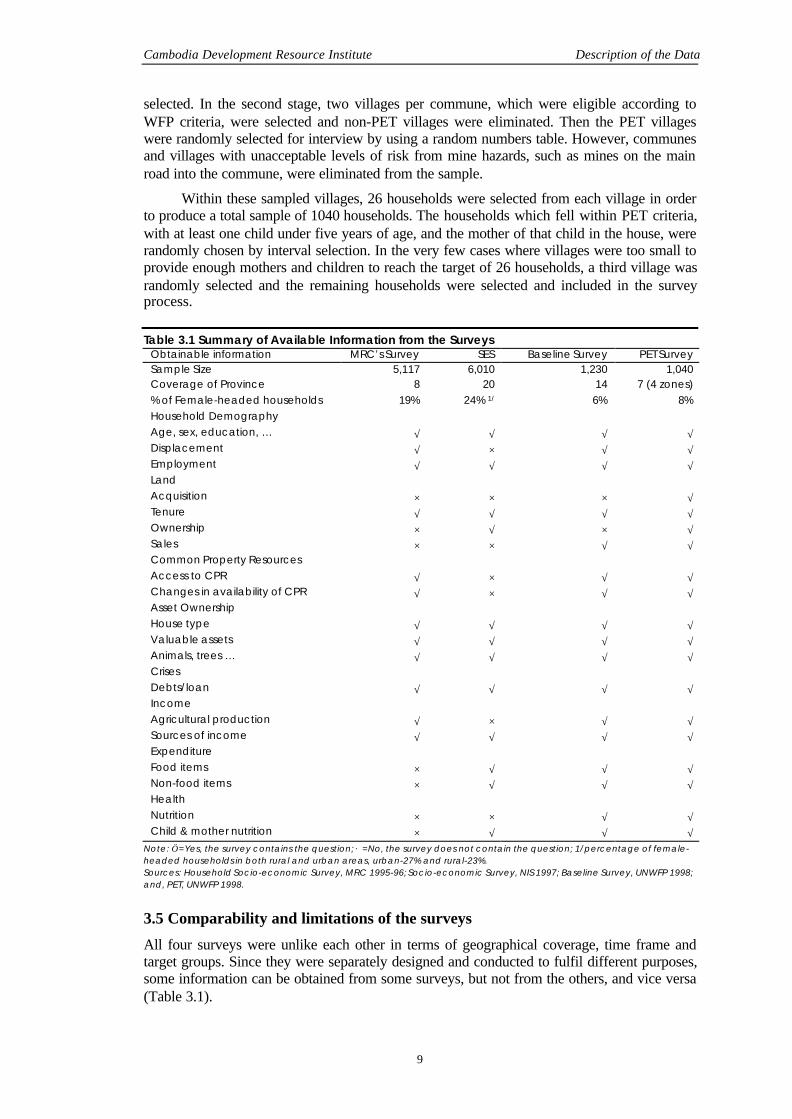
Table 3.1 Summary of Available Information from the SurveysObtainable information MRC’s Survey SES Baseline Survey PET SurveySample Size 5,117 6,010 1,230 1,040Coverage of Province 8 20 14 7 (4 zones)% of Female-headed households 19% 24% 1/ 6% 8%Household DemographyAge, sex, education, … √ √ √ √Displacement √ × √ √Employment √ √ √ √LandAcquisition × × × √Tenure √ √ √ √Ownership × √ × √Sales × × √ √Common Property ResourcesAccess to CPR √ × √ √Changes in availability of CPR √ × √ √Asset OwnershipHouse type √ √ √ √Valuable assets √ √ √ √Animals, trees … √ √ √ √CrisesDebts/loan √ √ √ √IncomeAgricultural production √ × √ √Sources of income √ √ √ √ExpenditureFood items × √ √ √Non-food items × √ √ √HealthNutrition × × √ √Child & mother nutrition × √ √ √
Note: √ =Yes, the survey contains the question; × =No, the survey does not contain the question; 1/percentage of female-headed households in both rural and urban areas, urban-27% and rural-23%.Sources: Household Socio-economic Survey, MRC 1995-96; Socio-economic Survey, NIS 1997; Baseline Survey, UNWFP 1998;and, PET, UNWFP 1998.
3.5 Comparability and limitations of the surveys
All four surveys were unlike each other in terms of geographical coverage, time frame andtarget groups. Since they were separately designed and conducted to fulfil different purposes,some information can be obtained from some surveys, but not from the others, and vice versa(Table 3.1).

Land Ownership, Sales and Concentration in Cambodia Working Paper 16
10
Since the Mekong River Commission (MRC) and NIS surveys randomly selected thesample population within the surveyed areas, the percentage of female-headed households ishigh (19 and 24 percent respectively). This figure is consistent (although slightly lower) thanthe results of the 1998 population census which was 25.7 percent (NIS, 1999:4). However, theproportion of female-headed households is quite low in the Baseline and the PET surveys (6and 8 percent respectively), given their selection of sampled households with at least onechild under five years old (the vast majority of children are born in wedlock). Therefore, thesehouseholds represent only those that have become female headed during the last five or sixyears, at most.
The main limitation of the surveys, from the point of view of this report, is thedifferentiation among the sampled groups. The Household Socio-economic Survey in fishingcommunities targeted the people who lived in fishing communes. The Socio-economicSurvey of NIS, on the other hand, focused on much broader samples, but excluded some areasfrom the sample frame due to security concerns. The stratification was based on three strataviz. Phnom Penh, other urban centres and rural areas. This distinction was defined by thePopulation Census Office and that constitutes another significant limitation. The Baselinesurvey targeted only the people in the CASD and WFP target areas. In the PET survey, thegroups of people in the PET communes and sampled households were exclusively those whohad at least one child under five years of age and the mother present.
In general, all four surveys provide valuable information, including detailed data onhousehold demography, land ownership, access to common property resources, other durableasset ownership, household income and expenditures and other facts. However, it is importantto keep in mind that not all four surveys cover the same questions. Furthermore the way inwhich the questionnaires were designed, and the questions were asked, differ.

11
Chapter Four
Land Acquisition,Tenure and Ownership
4.1 Land acquisition (PET survey data only)
Based on relevant regulations and on the land redistribution of the 1980s, the majority of theCambodian population could be reasonably assumed to have had access to land, bothresidential and agricultural, during the 1980s. As mentioned above, 1989 land distributionwas based on land availability in the villages and the number of family members. Apparentlythe redistribution was implemented by local authorities, with the participation of KromSamaki farmers in each village. To ensure fair distribution, the government ordered localauthorities to allocate 1-2 ha of agricultural land in each village, according to populationdensity and land availability. This was for future redistribution to returnees from bordercamps, demobilised or retired soldiers, and Cambodian returnees from overseas. Therefore, itis reasonable to assume that most of the people legally acquired land through redistribution in1989 and were officially recognised as landowners by local authorities.
Figure 4.1 Land Acquisition
Source: PET Survey (Question 601, Appendix A-4), UNWFP 1998
However, the results of the PET survey, which focused on internally-displaced persons,showed that PET households had commonly acquired land through different sources. Forty-three percent of the interviewed households reported that they acquired land from theirrelatives or friends (Figure 4.1). This high figure is suspected to have been the result of the
43%
28%
11%
10%5%
3%
given by relatives/friendsgiven by authorities purchasedcleared land themselvesgiven by Krom Samakiunused agricultural land

Land Ownership, Sales and Concentration in Cambodia Working Paper 16
12
high displacement rate of the sampled population: three-quarters of the surveyed householdshad been displaced by fighting since 1989, and hence, were vulnerable to loss of land in theirvillages of origin. They probably could not acquire land in the new resettlement villages(Table 4.1). The findings of the PET survey also show that 28 percent of the respondents weregiven land by local authorities, whereas only 5 percent obtained land through the 1989 KromSamaki distribution. This is a surprisingly low percentage, given that such a distribution wasprobably the principal means of acquiring land in Cambodia in the period before 1989. Afurther reason why many households in these areas have only come to own land since 1989may be the young average age of the sampled household heads, an assumption which isreinforced by the fact that many were given land by relatives.
Table 4.1 Household Mobility and SettlementHousehold Percentage
Displaced because of fighting since 1989 76%
Returned from Thai border camps with United Nations 8%
Lived in new village (which existed only after 1992) 11%
Currently displaced from normal place of living 4%
Moved more than 2 times since 1989 36%
Lived in more than 2 different settlements since 1989 28%Source: PET Survey, UNWFP 1998
4.2 Land tenure (SES and PET data only)
By law, only possession rights and occupation rights were available for agricultural land andagricultural concession land, respectively. In the first few months after the 1989 privatisationof land, large numbers of applications were made for ownership titles. However, only a smallproportion of applicants have so far been issued with ownership titles. According to theDepartment of Cadastre and Geography, only 14 percent out of a total of 4.5 millionapplicants have received certificates of possession rights. But those people who applied forpossession rights presumably still have the application receipts from the local authorities (seeAppendix B for details of the application process).
The Socio-economic Survey (SES) shows that the majority of households interviewedhad some form of land title: approximately 80 percent of the respondents in both urban andrural areas reported that they owned/occupied residential land and farmland with titles (Table4.2). Yet, the property rights referred to were not clearly defined: perhaps respondents werereferring to the application receipt that they received when they applied for possession rights.The Questionnaire also asked whether respondents still had application receipts or not(Question 24, Appendix A-2 of the SES). The high percentage of reported owners with titlesis probably the result of the vagueness of the question. The question only allows threecategories of answer “owned with title”, “ownership unsettled/held for free” and“rented/leased”, for those people who owned either residential or agricultural land. Inevitablythe respondents who owned land would report that they owned/possessed land with title ifthey did not hold land for free and/or lease land. Hence, the level of land ownership titlescannot be reliably estimated from the SES.
The PET survey questions about land ownership documentation,1 which attempted toidentify the form of entitlement held by people, shows a different picture. Only a small 1 Questions 603-604, which were designed by Shaun Williams (Oxfam GB), provide multiple options
for respondents to give the appropriate answer on the type of land ownership paper they held.However, the interviewers did not ask if the respondents still had those papers - receipt, applicationform, land investigation record or certificate.

Cambodia Development Resource Institute Land Acquisition, Tenure and Ownership
13
proportion of PET households had application receipts to prove their possession rights,whereas a mere 2 percent of the respondents had been issued official certificates for theirresidential land. One percent had certificates for agricultural land (Table 4.3). Thus, morethan 70 percent of the households had nothing to prove their possession rights for eitherresidential or agricultural land.
Table 4.2 Percentage of Urban and Rural Households Reported to Own Land with OwnershipStatus
Residential land Agricultural landOwnership Status
Urban Rural Urban Rural
Owned with title 77% 82% 79% 87%Ownership unsettled/held for free 22% 17% 19% 12%Rented/leased 1% 1% 2% 1%Total 100% 100% 100% 100%Source: Socio-economic Survey (Question 24.1-24.3), NIS 1997
The survey also reported that the proportion of female-headed households who hadapplied for title to their land was higher than that of male-headed households. Table 4.3shows that the proportion of female-headed households who had papers (either a receipt,application for possession or land investigation record) was slightly higher than for male-headed households. However, none of the female-headed families had certificates for the rightto possess their residential and agricultural land. This difference might be due to the smallnumber of female-headed households (only 72) in the sample population of the PET survey,and therefore might not be statistically significant.
Table 4.3 Percentage of Households Reported to Have Land Ownership TitleResidential land Agricultural land
Ownership Status male-headed
female-headed total1/ male-
headedfemale-headed total1/
n=934 n=72 n=1006 n=902 n=69 n=971No paper 74% 60% 73% 75% 62% 74%Receipt 14% 18% 15% 13% 16% 13%Application for
possession 2% 4% 2% 2% 6% 2%Land investigation
record 1% 3% 1% 1% 1% 1%
Certificate 2% 0% 2% 1% 0% 1%No land 7% 15% 7% 8% 15% 9%Total 100% 100% 100% 100% 100% 100%
Note:1/ weighted averageSource: PET Survey (Questions 603-604, Appendix A-4), UNWFP 1998
The PET survey also showed that female-headed families were more than twice aslikely to have no residential or agricultural land as male-headed households. To sum up, only2 percent of the male-headed households and none of female-headed households who ownedland had legal title for their residential or agricultural land.
4.3 Land ownership (all 4 surveys)
Issues related to land ownership are clearly vital for the livelihood of more than 80 percent ofthe population living and working in rural areas. Most of the rural population strive to own atleast a piece of land for subsistence in rice output and to pass on to their heirs. Land isgenerally classified differently depending upon its use and a distinction is made for differentland uses.

Land Ownership, Sales and Concentration in Cambodia Working Paper 16
14
The MRC’s survey classified land in fishing-dependent communities as residentialland, agricultural land, orchard land, fishpond and other land. The survey reported that mostof the sampled population owned residential land (nearly 100 percent) although they lived infishing communities. Additionally, a markedly-lower proportion (approximately 75 percent ofthe respondents), owned agricultural land (mainly rice fields), and a smaller proportionreported possessing other land such as orchard land and fishponds within and outsideresidential areas. The proportion of female-headed families who possessed any kind of landwas slightly lower than for male-headed households (Table 4.4).
Table 4.4 Percentage of Households Reported as Possessing Land
Land male-headedn=3999
female-headedn=953
total1/
n=4952Residential land 99.1% 99.2% 99.1%Agricultural land 76.9% 70.2% 75.6%Orchard land 15.4% 13.2% 15.0%Other type of land 0.5% 0.3% 0.5%Fishpond in homestead 3.6% 2.6% 3.4%Fishpond outside homestead 0.5% 0.1% 0.4%
Note: 1/ weighted averageSource: Household Socio-economic Survey, MRC 1995-96
The SES, on the other hand, grouped land into residential land and agricultural land andreported a high rate of residential land “owned” in the sampled areas. In both urban and ruralareas, more than 95 percent of the population reported “owning” residential land. Meanwhile,over 80 percent of the rural population possessed agricultural land. It is noteworthy that 27percent of the urban population possessed 25 percent of total agricultural land. The urbanpopulation in this survey was not clearly defined because some of the suburban population ofPhnom Penh, Sihanoukville or other provincial cities, could be classified as rural. Some ofthese people still lived in rural areas (although close to the cities), worked in the fields andpredominantly relied on farm work. Again a marginally lower rate of possession of bothresidential and agricultural land can be observed among households headed by women in bothurban and rural areas (Table 4.5). The significantly-lower rate of female-headed householdspossessing agricultural land in rural areas might indicate that female-headed households donot have enough adult labour to undertake land preparation or to claim more land.
Table 4.5 Percentage of Households in Urban and Rural Areas Reported as PossessingResidential and Agricultural Land
Urban RuralLand male-
headedfemale-headed total1/ male-
headedfemale-headed total1/
Residential land 95.7% 94.9% 95.4% 97.4% 97.3% 97.4%Agricultural land 27.6% 26.5% 27.3% 87.0% 83.7% 86.2%
Note: 1/ weighted averageSource: Socio-economic Survey, NIS 1997
The Baseline and PET surveys divided agricultural land into wet-season rice-growingland, dry-season rice-growing land and chamkar land (land with multi-cropping systemscomposed of various combinations of tree, vegetable and other non-rice crops, UNWFP1999:26). The majority of the households in the WFP target areas held house plots, rice-growing land or chamkar land. As wet-season rice is the most important crop in terms ofproduction volume, most of the sampled households reported possessing wet-season rice-growing land. Dry-season rice was not common in the Baseline and PET communes. Similarto the results of the SES, the proportion of female-headed households holding land wassmaller than that of male-headed households (Table 4.6).

Cambodia Development Resource Institute Land Acquisition, Tenure and Ownership
15
Table 4.6 Percentage of Households Reported as Possessing Rice and Chamkar LandBaseline PET
Land type male-headed
female-headed total 1 male-
headedfemale-headed total 1
Any land .. .. .. 93% 83% 92%Wet-season rice 82% 86% 82% 74% 62% 73%Dry-season rice 8% 8% 8% 2% 4% 2%Chamkar 24% 19% 24% 42% 31% 41%Home garden 32% 32% 32% 61% 62% 61%House plot .. .. .. 89% 78% 88%Other land outside
this settlement .. .. .. 4% 3% 4%Note: 1 weighted averageSources: Baseline and PET Surveys, UNWFP 1998

17
Chapter Five
Land Sales, Land Tenancyand Land Grabbing
5.1 Land sales (Baseline and PET data only)
Although a small proportion of the population has obtained official title to their land and onlyhave small plots of land, land transactions and speculation have emerged and developed in themarket. Since the reintroduction of land privatisation, a high volume of land sales and landspeculation can be observed in many areas of Cambodia.
The official figure for the number of land transactions since 1995 given by the GeneralDepartment of Cadastre and Geography is over 10,000, excluding transactions in PhnomPenh. But the actual figure is believed to be much higher. Transactions have affected all threecategories of land – residential land, agricultural land and common-property land.
All land transactions in Cambodia have to be approved by the relevant local authority.Both buyer and seller have to fill out a Definitive Sale Form1 (Appendix C). In practice,however, many transactions do not follow this procedure. The Definitive Sale Form is notnecessarily used. Instead, an informal transaction letter is mutually agreed upon and signedwith the endorsement of local authorities.
5.1.1 Residential land
Since the government reintroduced private ownership of residential land, land has changedhands at an increasing rate2, especially in the urban areas of Phnom Penh, Kompong Cham,Battambang, Sihanoukville, Siem Reap etc. Due to poverty and price incentives, some peoplewho live in the central areas of major cities have sold their houses or land and moved to otherareas.
Residential land transactions have also occurred in rural areas, particularly in the areaswith easy access to Phnom Penh and other major cities. Areas with fertile soil or nearrecreation areas are also affected by land speculation. Meijers (1994:10) stated that wealthyurban people like to buy some fertile land where they can plant some fruit trees and visit onSundays. This can be observed on the outskirts of major cities and towns.
According to the two surveys, Baseline and PET, land sales over a 12-month periodwere observed to be high. The Baseline survey results show that as much as 3 percent of the
1 One copy for the General Department of Cadastres and Geography and another to be kept by the
buyer and certified by local authorities.2 Renting of accommodation and land plots has also been observed to be high in urban areas, but the
extent of transactions is hard to estimate since none of the four surveys provided any information onresidential land transactions in urban areas.

Land Ownership, Sales and Concentration in Cambodia Working Paper 16
18
surveyed households sold their houses in 1997 to cope with large unexpected shortages offood or income for the household. Meanwhile, about 1 percent of the respondents in the PETsurvey reported having sold their land in 1998. This discrepancy was probably due to the factthat 94 percent of Baseline’s households had been in the same area since 1989. Hence theyseemed to have had more opportunity to acquire residential land in the 1989 redistributionthan those who had been displaced or had returned from border camps. The high level ofdisplacement (76 percent) of the households in the PET survey, as opposed to only 36 percentin the Baseline survey, could logically have resulted in low sales of house plots (Table 5.1).
A significant difference between female and male-headed households in the rate ofselling house plots also can be observed in both surveys. Female-headed households reportedthat they were vulnerable to selling their land when they faced unexpected crises. This surveyshowed that the percentage of house sales among female-headed households was double thatof male-headed households in 1997 (Table 5.1). The PET survey also reported a similardifference when comparing the rate of transactions between male- and female-headedfamilies.
Table 5.1 Percentage of Households Reported as Selling House PlotsBaseline Survey PET Survey
Percentage of households male-headed
female-headed total 1 male-
headedfemale-headed total 1
Sold house in 1997 2.6% 6.8% 2.8% .. .. ..Sold house plot since 1989 .. .. .. 1.0% 2.6% 1.2%Sold house plot in 1998 .. .. .. 0.8% 1.3% 0.9%
Note: 1 weighted averageSources: Baseline Survey and PET Survey, UNWFP 1998
It is not just private property that has been transferred: in the course of privatisation ofstate-owned property, buildings, land, cinemas, factories, hotels, etc. have also been sold orleased for long-term investment. For instance, almost all the cinemas in Phnom Penh havebeen demolished, many formerly-government factories have been closed down or rented toprivate companies, government facilities have been moved from expensive to less-expensiveareas, and so forth. All these assets are now privately owned or leased for the long term (up to99 years). Commenting on the sale of state properties, Greve (1993: 52) stated that “State ofCambodia officials have nonetheless sold, and may still sell, just about anything that can beexchanged for money, and pocket the proceeds.” The official figure for transactions of stateproperty has never been made available to the public.
In general, the price of residential land in rural areas, as defined in the SES, was muchlower than in urban areas. Information on land prices in specific markets in Cambodia is verylimited. Fortunately the 1997 SES provides some information on land prices in the 20provinces covered by the survey. Although it is unlikely that a relationship can be shownbetween price variation and transactions of land in the provinces covered by the survey, somesignificant information can be drawn from the data. Unfortunately though, Question 24 of theSES, which estimated land prices, was poorly designed. Respondents were asked to estimatethe price of all the land they owned in local currency (Riel). Out of fear of paying tax, theymay have under-stated the value of their land, which means the data they provided is ofquestionable validity.
With this caution in mind, one can look at variations in prices among differentprovinces. The price of land differs from one province to another depending upon the locationof the province and the location of the areas surveyed. Generally, land in major cities is moreexpensive than land in remote areas. The price of residential land in urban areas, such as inthe towns of Kandal province and Phnom Penh, was the highest in the country (ranging from0.5-1 million Riel per square meter [Riel/sq.m] in 1997). This was followed by the provincialtowns of Kompong Cham, Kompong Thom, Kampot and Battambang where land prices were
Cambodia Development Resource Institute Land Sales, Land Tenancy and Land Grabbing
19
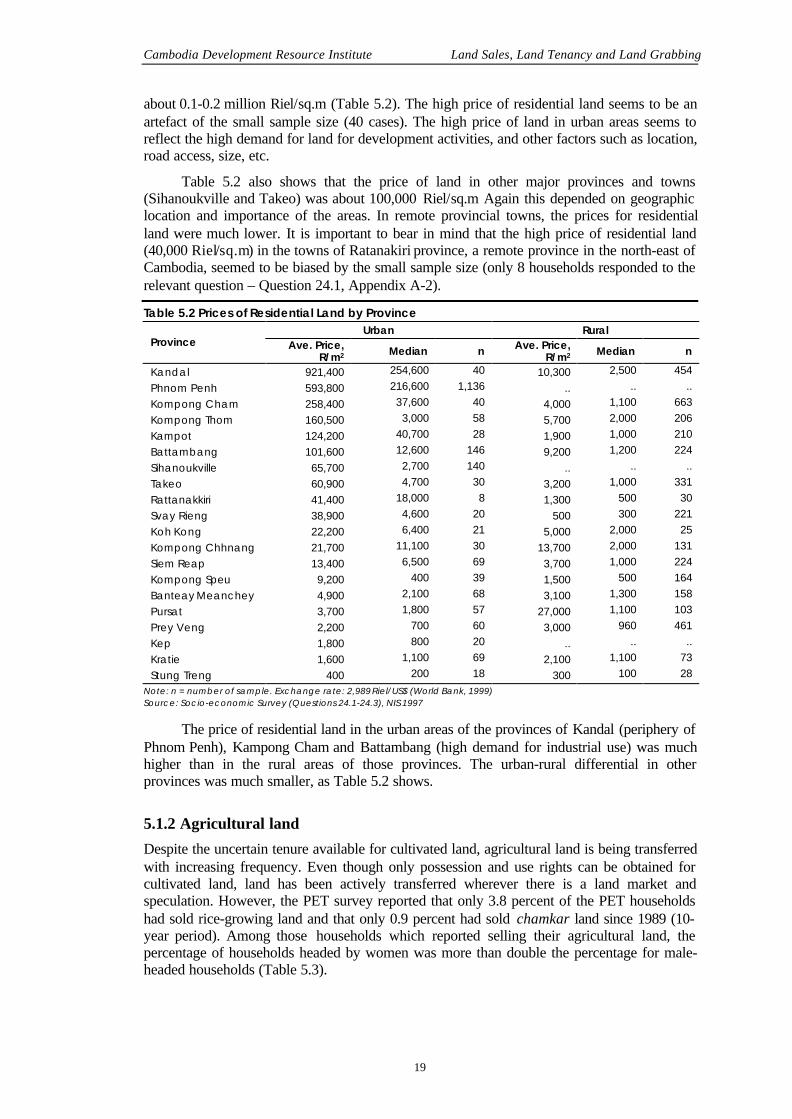
about 0.1-0.2 million Riel/sq.m (Table 5.2). The high price of residential land seems to be anartefact of the small sample size (40 cases). The high price of land in urban areas seems toreflect the high demand for land for development activities, and other factors such as location,road access, size, etc.
Table 5.2 also shows that the price of land in other major provinces and towns(Sihanoukville and Takeo) was about 100,000 Riel/sq.m Again this depended on geographiclocation and importance of the areas. In remote provincial towns, the prices for residentialland were much lower. It is important to bear in mind that the high price of residential land(40,000 Riel/sq.m) in the towns of Ratanakiri province, a remote province in the north-east ofCambodia, seemed to be biased by the small sample size (only 8 households responded to therelevant question – Question 24.1, Appendix A-2).
Table 5.2 Prices of Residential Land by ProvinceUrban Rural
Province Ave. Price,R/m2 Median n Ave. Price,
R/m2 Median n
Kandal 921,400 254,600 40 10,300 2,500 454Phnom Penh 593,800 216,600 1,136 .. .. ..Kompong Cham 258,400 37,600 40 4,000 1,100 663Kompong Thom 160,500 3,000 58 5,700 2,000 206Kampot 124,200 40,700 28 1,900 1,000 210Battambang 101,600 12,600 146 9,200 1,200 224Sihanoukville 65,700 2,700 140 .. .. ..Takeo 60,900 4,700 30 3,200 1,000 331Rattanakkiri 41,400 18,000 8 1,300 500 30Svay Rieng 38,900 4,600 20 500 300 221Koh Kong 22,200 6,400 21 5,000 2,000 25Kompong Chhnang 21,700 11,100 30 13,700 2,000 131Siem Reap 13,400 6,500 69 3,700 1,000 224Kompong Speu 9,200 400 39 1,500 500 164Banteay Meanchey 4,900 2,100 68 3,100 1,300 158Pursat 3,700 1,800 57 27,000 1,100 103Prey Veng 2,200 700 60 3,000 960 461Kep 1,800 800 20 .. .. ..Kratie 1,600 1,100 69 2,100 1,100 73Stung Treng 400 200 18 300 100 28
Note: n = number of sample. Exchange rate: 2,989 Riel/US$ (World Bank, 1999)Source: Socio-economic Survey (Questions 24.1-24.3), NIS 1997
The price of residential land in the urban areas of the provinces of Kandal (periphery ofPhnom Penh), Kampong Cham and Battambang (high demand for industrial use) was muchhigher than in the rural areas of those provinces. The urban-rural differential in otherprovinces was much smaller, as Table 5.2 shows.
5.1.2 Agricultural land
Despite the uncertain tenure available for cultivated land, agricultural land is being transferredwith increasing frequency. Even though only possession and use rights can be obtained forcultivated land, land has been actively transferred wherever there is a land market andspeculation. However, the PET survey reported that only 3.8 percent of the PET householdshad sold rice-growing land and that only 0.9 percent had sold chamkar land since 1989 (10-year period). Among those households which reported selling their agricultural land, thepercentage of households headed by women was more than double the percentage for male-headed households (Table 5.3).

Land Ownership, Sales and Concentration in Cambodia Working Paper 16
20
Table 5.3 Relationship between Land Sales and Incidence of LandlessnessBaseline Survey PET Survey
Percentage of HH male-headed
female-headed total 1 male-
headedFemale-headed total 1
sold rice land since 1989 .. .. .. 3.4% 7.8% 3.8%sold chamkar since 1989 .. .. .. 0.7% 2.6% 0.9%sold land in previous year 2 5.2% 12.3% 5.6% 3.2% 5.2% 3.4%- of which became landless 28.3% 22.2% 27.5% 22.6% 50.0% 25.7%
Note: 1 weighted average; 2 Baseline Survey referred to 1997, while PET referred to 1998.Sources: Baseline Survey and PET Survey, UNWFP 1998
Both the Baseline and PET surveys reported a high level of land sales in the sampledareas within a year interval 3. These surveys showed that 5.6 percent and 3.4 percent of totalrespondents sold land in 1997 and 1998, respectively, to cope with unexpected crises. Againthe rate of land transactions among female-headed households was observed to be aboutdouble that for male-headed families. This implies that female-headed families tend to bemore vulnerable to distress sales of their land when they experience unexpected crisis than isthe case for male-headed households.
Table 5.4 Prices of Agricultural LandProvince Price, Riel/sq.m Median nKandal 11,140 7,400 378Phnom Penh 4,750 4,000 140Kampot 440 130 224Kampong Cham 240 250 547Takeo 170 160 349Battambang 140 150 192Kompong Speu 110 90 186Kompong Thom 100 80 224Svay Rieng 100 60 224Banteay Meanchey .. .. ..Kompong Chhnang .. .. ..Kep .. .. ..Koh Kong .. .. ..Kratie .. .. ..Prey Veng .. .. ..Pursat .. .. ..Rattanakkiri .. .. ..Siem Reap .. .. ..Sihanoukville .. .. ..Stung Treng .. .. ..
Note: n = number of sampleSource: Socio-economic Survey, NIS 1997
Questions 149 of the Baseline survey and 2009 of the PET survey clearly asked “didthe household sell land because of these problems?” (the household has experienced one ormore crisis events or shocks). According to the question, which had the same wording butreferred to different years (1997 and 1998 respectively), all of land sales in the previous yearwere distress sales. Consequently, the distress sales of land assets appear to have a closerelationship with incidence of recent landlessness in the sampled areas. Both surveys reported
3 Questions 149 of the Baseline survey and 2009 of the PET survey did not clearly identify what kind
of land (residential or agricultural), was sold in 1998 and 1997 respectively.

Cambodia Development Resource Institute Land Sales, Land Tenancy and Land Grabbing
21
that over a quarter of the respondents who had sold land in the previous year were landless thenext year (Table 5.3). The proportion of female-headed families becoming landless wasobserved to be double that of male-headed households in the Baseline survey, but slightlylower in the PET survey. The surveys could only identify the relationship between land salesand the incidence of landlessness among those targeted groups who still lived in the sampledareas. The land sales data would probably show a much closer relationship with landlessnessif the survey had included those households which had sold land out of desperation and hadmigrated to urban or other areas.
As in the case of residential land, prices of agricultural land in the central provinceswere much higher than in remote provinces4. In 1997, the price of farmland in Kandalprovince, which is at the periphery of the capital Phnom Penh, was the highest (11,400Riel/sq.m on average). This was followed by Phnom Penh itself which was about 5,000Riel/sq.m (Table 5.4). Among the surveyed provinces, farmland in the rural areas of otherprovinces was as cheap as a few hundred Riels per square meter5. Again the reliability of thisinformation seemed to be low due to the poorly-designed question. In addition, as statedbefore, respondents normally under-priced their land for fear of paying taxes.
5.1.3 Common property resources (all surveys except SES)
Although common property in Cambodia is not clearly defined by existing regulations, it hasbeen observed to have been diverted to private ownership at an alarming rate. Considerableareas of common property resources, such as forests, rivers, lakes and agricultural land whichwere not redistributed in 1989, have become privately controlled. Millions of hectares offorests have been granted to private companies as concession forests. Many large plantationshave been developed. Many private fishing lots have been created along the banks of majorrivers and lakes; and a considerable amount of unallocated agricultural land has been illegallyencroached upon, and has dubiously become private property. As a result of privatisation,common property is becoming less accessible to other people, and hence, benefits to themajority have been reduced.
Even though it is believed that common property has been transferred to privateinterests for long-term use, information about this is very scarce. The 1989 land redistributionand the 1992 Land Law did not identify which land was common property. Moreover, none ofthe four surveys provided significant information on common property transactions. All thatis available is the official figure for forest concessions, agricultural-land concessions andfishing lots that have been allocated for private use. As stated previously, according to theMinistry of Agriculture, Forestry and Fisheries, nearly 5 million hectares of forest (includingthe 264,924 ha for three recently-cancelled concessions) and 0.7 million hectares ofagricultural land (including 46,600 ha for five recently-cancelled concessions) have alreadybeen granted to private companies for long-term investment. Another one million hectares offishing lots have been auctioned off to private companies and individuals or allocated forresearch stations.
The decreasing availability of products and benefits derived from common propertyresources is shown in three surveys. In general, the benefits from common property resourceshave been dramatically decreasing over time. The MRC survey classified land into fivecategories: inundated forests, big rivers/lakes, flooded rice fields, banks/beds of rivers/lakesand irrigation canals/dikes/small rivers. The survey critically analysed trends in availability of
4 The SES Questionnaire did not identify the location, province or town of farmland owned by the
urban or rural population. The urban population could obviously possess farmland outside the urbanareas where they lived.
5 The high price of farmland owned by the urban Ratanakiri respondent is an exceptional case due ton=1.

Land Ownership, Sales and Concentration in Cambodia Working Paper 16
22
products and benefits derived from common property. The findings showed that products andbenefits derived from common resources have significantly decreased in the last 10 years. Thevast majority (over 80 percent) of sampled households reported a decrease in the benefits andproducts from inundated forests, from big rivers/lakes and from banks/beds of river/lakes(Table 5.5). A somewhat smaller proportion of respondents reported decreasing availability ofproducts from flooded rice fields and irrigation canals/dikes/small rivers.
Table 5.5 Percentage of Households that Reported Change in Availability of Products andBenefits Derived from CPR in the last 10 Years
CPR Increasing Decreasing Constant
Inundated forests 1.7% 95.3% 3.0%Big river/lakes 5.6% 83.2% 11.2%Flooded rice fields 37.2% 40.0% 22.8%Bank/bed of river/lake 8.6% 81.9% 9.5%Irrigation canals/dike/small river 15.7% 62.3% 22.0%
Source: Household Socio-economic Survey, MRC 1995-96
The Baseline and PET surveys also reported that the trend in availability of productsand benefits derived from common property resources, forest and fishing activities, have beendeclining compared to the year before the survey. The majority of survey respondentsreported that availability of products and benefits derived from foraging in the forest had beendeclining. Thirty-seven percent of Baseline respondents and 65 percent of PET respondentsreported that they obtained fewer products and benefits from the forest than in the year beforethe interview. This difference is likely due to differences in the ecology of the surveyed areas.
Table 5.6 Percentage of Households that Reported Change in Availability of Products Derivedfrom CPR Over a One-year Period
CPR 1998-Baseline 1 1998-PET 2
Products derived from forest activities- less 37% 65%- more 19% 15%- same 44% 20%Products derived from fishing activities- less 49% 77%- more 10% 4%- same 41% 19%
Notes: 1 The Baseline survey compared the trend in availability between 1997 and 1996; 2 The PET survey compared thetrend in availability between 1998 and 1997Sources: Baseline Survey and PET Survey, UNWFP 1998
Similarly, the surveys showed that products and benefits derived from fishing haddeclined dramatically, compared to the previous year. Forty-nine percent of the respondents inthe Baseline survey and 77 percent in the PET survey reported that they had collected fewerproducts from their fishing activities than in the previous year6.
The declining trend in products and benefits derived from CPR has been attributedprimarily to overexploitation. The MRC survey reported that as many as 77 percent of therespondents thought that overexploitation was the main reason for the reduction in productsand benefits from common property (Table 5.7). The MRC survey, which took place in 1995-
6 The Baseline survey compared the availability of common property resources in 1996 and 1997.
The PET survey made the comparison for 1997 and 1998.

Cambodia Development Resource Institute Land Sales, Land Tenancy and Land Grabbing
23
96, indicated that only 5 percent of the respondents claimed that the conversion of commonproperty to private use was an important factor.
Table 5.7 The Most Important Factors Affecting Availability of CPRFactors Percentage of HouseholdsOverexploitation 77%Change of environment 7%Destruction of habitat 3%Increasing population pressure 7%Use of chemicals in the rice fields 1%Conversion of CPR to private use 5%Others 0%
Source: Household Socio-economic Survey, MRC 1995-96
Meanwhile, the 1998 PET survey showed that over 82 percent of the interviewedhouseholds complained about the declining availability of forest and fisheries resources.Similar to the MRC findings, the majority of the respondents (over 80 percent) reportedcollecting fewer products from forest and fishery activities due to a decline in the availabilityof these products. The restriction of access to forest resources was a complaint mentioned byover 10 percent of the respondents, as opposed to only 1 percent for fisheries resources (Table5.8). These responses are consistent with an increase in transference of common property landto private control.
Table 5.8 Reasons for Declining Benefits from CPRPET
ReasonsForest Fishing
Declining availability of forest/fisheries resources 82% 87%Lower prices for forest/fisheries products 2% 0%Traders buying fewer forest/fisheries products 1% 12%Restricted access imposed by other users 11% 1%Forest/fisheries becoming more insecure 4% ..
Sources: PET Survey, UNWFP 1998
5.2 Land tenancy
The empirical evidence suggests that large landowners are those who are rich or well-off,while the landless or small landholders are those who are worse-off, poor or extremely poor.The gap between rich and poor is exacerbated further by the inequalities of land distributionand ownership. The process results in increased tenancy as a common alternative to landpossession. Landless people and small landholders eventually have to rent land either in theform of fixed7 tenancy arrangements or sharecropping8. Fixed-rent tenancy in cash and inkind seems to be the most favored arrangement in rural areas.
The surveys clearly showed that the land-lease market was relatively active in thesurveyed areas. Nearly 10 percent of the population in the MRC survey reported renting land,while 3 percent in the SES did (Table 5.9). It is important to bear in mind that the MRCsurvey focused on fishing-dependent communities, while the SES was more representative ofthe whole country (covering 22 provinces). The rate of land rental was observed to be higheramong male-headed families.
7 Fixed rent – the tenant pays a fixed sum of money or fixed amount of produce to the landlord in
return for the right to cultivate the land (Ray 1998:419).8 Sharecropping – the tenant yields to the landlord an agreed-upon share of the crop (Ray 1998:419).

Land Ownership, Sales and Concentration in Cambodia Working Paper 16
24
Table 5.9 Tenancy of LandMRC Survey NIS SurveyPercentage of households
who: male-headed
female-headed total 1 male-
headedfemale-headed total 1
Rent land 10.7% 5.9% 9.8% 3.2% 2.2% 3.0%Rent-out land 5.1% 6.5% 5.4% .. .. ..
Note: 1 weighted averageSources: Household Socio-economic Survey, MRC 1995-96, Socio-economic Survey, NIS 1997
Tenancy of agricultural land is common, although not predominant relative to owners’cultivation. In both the Baseline- and the PET-sampled areas, both surveys reported that theproportion of rented wet-season rice-growing land was much higher than for dry-season rice-growing land and chamkar land (Table 5.10). This was obviously due to the small areas ofdry-season rice-growing land and chamkar land in the project areas. The proportion offarmers who rent land is higher than the proportion who rent out land, illustrating theinequalities in land distribution. Table 5.10 also provides more detail on the tenancy rates offemale-headed and male-headed households.
Table 5.10 Tenancy of Rice-growing land and Chamkar LandBaseline Survey PET Survey
Percentage of households who male-headed
female-headed total 1 male-
headedfemale-headed total 1
Rent wet-season rice land 9.7% 2.6% 6.7% 7.1% 2.6% 6.7%Rent out wet-season rice land .. .. .. 2.9% 1.3% 2.8%Rent dry-season rice land 0.9% 0% 0.8% 0.4% 0% 0.4%Rent out dry-season rice land .. .. .. 0.1% 0% 0.1%Rent chamkar land 1.2% 0% 1.1% 1.3% 0% 1.3%Rent out chamkar land .. .. .. 0.1% 0% 0.1%Rent out land 2 4.5% 11.0% 4.9% 2.5% 0% 2.3%
Note: 1 weighted average 2 Question 148 of the Baseline survey and Question 2008 of the PET survey did not identify whatkind of land was rented out to other farmers to cope with large and unexpected crises in 1997 and 1998 respectively.Sources: Baseline Survey, UNWFP 1998 and PET, UNWFP 1998
5.3 Land grabbing (PET survey)
Notwithstanding the operation of the land market, land grabbing has become a commonalternative method of land of acquisition in almost all provinces in recent years. According toShaun Williams (1999), “land grabbing is pervasive, and is dominated by people with morepower than their victims 9.” Since 1987, 217 large-scale land disputes affecting 50 familiesand 120 hectares on average, have been inventoried. The PET survey (Question 1601) showsthat 3 percent of the interviewed households reported a forced take over of agricultural land in1998.
9 Quoted in Vehaskari, (1999) “Land Problems to Cost Millions, Study Says”, The Cambodia Daily,
July 16, 1999.

25
Chapter Six
Land Pressure and Concentration(all four surveys)
Land pressure and concentration are likely to become some of the most challenging problemsin Cambodian economic policy. It is believed that the incidence of landlessness, affectingboth residential land and agricultural land, has been increasing in many urban and rural areas.This seriously affects the livelihood of many Cambodians since they do not have land to liveon and/or do not have enough land for food self-sufficiency.
The proportion of households without land for housing varied widely between surveys.The MRC survey showed that only 0.9 percent of the population in fishing-dependentcommunities had no residential land. The SES reported that 2.6 percent of rural and 4.6percent of urban dwellers had no residential land. The PET survey, which covers internallydisplaced persons, showed that in 1998 about 12 percent of the surveyed population had noresidential land (Figure 6.1). The figure takes into account only those people who had noresidential land or did not own the plots their houses were built on, but still lived in thesurveyed areas. Hence the figure would be much higher if we included those who have noresidential land and have moved to urban areas to find an alternative way to earn a living.Households with female heads were more likely to have no residential land.
The total supply of agricultural land, which is the most important means of productionand source of income for more than 80 percent of the Cambodian population, increased by 14percent between 1993 and 1998. However many farmers complain of not having enough landfor self-sufficient agricultural production. This is due to the combined effect of increasingpopulation and uncontrolled land concentration.
The average amount of land per household is quite small in Cambodia. According tothe surveys, the average piece of agricultural land for the rural population is around 1.0 ha perhousehold (similar to the national estimate of 1.3 ha/hh). Across the different surveys, averageagricultural land holdings were significantly different, ranging from 0.75 ha to 1.32 ha perhousehold, depending upon the survey. The average agricultural land holding was smallest(0.75 ha/hh), in the fishing communes of the MRC survey and was about 1 ha/hh in the otherthree surveys (Figure 6.2). Not surprisingly, the small average size of holdings found by theMRC survey seemed to be a consequence of the availability of alternative sources of income(either fishing or forest collection), in the sampled areas.
Furthermore, the gap in average agricultural land holdings between female-headed andmale-headed households was significant in the MRC and NIS surveys. The MRC and NISsurveys reported that female-headed households owned only just over 0.5 ha/hh on average.This is much lower than the overall average in the surveys (Figure 6.2). The smaller size ofagricultural land holdings among women-headed households was likely due to the fact that

Land Ownership, Sales and Concentration in Cambodia Working Paper 16
26
they lacked the adult labour to acquire more agricultural land or farm profitably, and hencewere under pressure to sell their land.
Figure 6.1 Average Size of Agricultural Land 1 Holding per Household
PETSES (urban)
SES (rural)MRC
Total
Male-headed
Female-headed
21.6
5.1
2.7
0.8
10.8
4.3
2.6
0.9
11.6
4.6 2.6
0.90
5
10
15
20
25
Perc
enta
ge
Notes: 1 Only agricultural land was calculated from the MRC survey, while in the Baseline and PET surveys, agricultural landwas the sum of wet-season rice-growing land, dry-season rice-growing land and chamkar land.Sources: Household Socio-economic Survey, MRC 1995-96; Socio-economic Survey, NIS 1997; Baseline Survey, UNWFP 1998;and, PET Survey, UNWFP 1998
The surveys show that the incidence of landlessness (which refers to those people whodo not have agricultural land for farming but might have other land (residential or garden)ranges from 11 percent to 30 percent, depending upon the geographical locations of thesurvey areas and the gender differentiation within the surveys. Both the SES and the Baselinesurveys indicated that just over 10 percent of total households interviewed were landless. TheSES, however, was much more comprehensive than the Baseline survey in its coverage, sincethe Baseline survey focused only on the population in CASD and WFP Target groups.Although these two surveys cover different populations, the rate for landless people wassimilar in both, implying that the rate of landlessness is over 10 percent in rural areas.
The MRC and PET surveys, which targeted specific sampled groups (fishing-dependent communities and internally-displaced persons under PET criteria) recorded muchhigher rates of landlessness – 24 and 17 percent respectively. These higher figures probablyreflect the fact that the MRC survey concentrated on fishing-dependent communities whichhad alternative sources of income from fishing, forest products or farming. The PET surveyconcentrated on those people who had been internally displaced since 1989 due to fighting,and those who returned from Thai border camps. Despite their limitations, these surveyssuggest that the rate of landlessness in Cambodia is relatively high.
The incidence of landlessness among female-headed households is generally higherthan among male-headed households (Figure 6.3). This might be due to the fact that female-headed households usually lack the strength to do heavy farm work such as land preparationor pay the high cost of having it done for them. Hence they tend to engage in other activitiesfor their living and sell off their land.
As agricultural land access is very important for the livelihood of rural populations,there has recently been a debate about levels of landlessness in rural areas. Recent studies byWFP and FAO report that the landlessness rate in rural Cambodia is over 20 percent (MAFF,1999).

Cambodia Development Resource Institute Land Pressure and Concentration
27
Figure 6.2 Percentage of Households without Residential Land
PETSES (rural)
BaselineMRC
Total
Female-headed
Male-headed
1.32
1.18
0.970.79
1.28
0.67
1.13
0.56
1.32
1.07
0.980.75
0
0.2
0.4
0.6
0.8
1
1.2
1.4
Ave
rage
size
of h
oldi
ng, h
a
Total Female-headed Male-headed
Sources: Household Socio-economic Survey, MRC 1995-96; Socio-economic Survey, NIS 1997; and, PET Survey, UNWFP 1998
Figure 6.3 Percentage of Households without Agricultural Land
MRCPET
SES (rural)Baseline
Total
Male-headed
Female-headed
30 30
15
11
23
16
1111
24
17
12
11
0
5
10
15
20
25
30
Perc
enta
ge
Sources: Household Socio-economic Survey, MRC 1995-96, Socio-economic Survey, NIS 1997, Baseline Survey, UNWFP 1998and PET Survey, UNWFP 1998

Land Ownership, Sales and Concentration in Cambodia Working Paper 16
28
Average agricultural land size per household and average incidence of landlessnessvary significantly across provinces (Table 6.1)1. However, as the surveys focused on differenttarget groups, Figure 8.3 shows great variation in average land size in the same province.Table 8.1 illustrates that the major provinces of Battambang, Kompong Cham, KompongChhnang and Kandal tended to have a relatively-high incidence of landlessness. But they donot show a significant relationship between land availability in the province and the incidenceof landlessness. For instance, although the population in Battambang province is low, the rateof landlessness is still high (over 25 percent). This might be due to the fact that the demandfor land in those provinces is higher than in the other remote provinces and that there aremore alternative income opportunities in those provinces than in the more remote provinces.According to the SES, landlessness in Koh Kong province was surprisingly high (50 percent).This is probably because the people of Koh Kong province are largely fishermen and havemore alternative-income opportunities, such as businesses with Thai partners and loggingactivities.
With the high level of landlessness and the small size of average agricultural landholdings, problems may be aggravated when the land is unevenly distributed. The minorityrich hold very large areas of agricultural land, leaving the poor majority little on which to liveand work. Farmers obviously have different starting points in terms of their economicresources. Some may have inherited wealth. Although during the Khmer Rouge periodnobody could own anything privately, some people were able to keep valuable assets and usethem afterwards. After 1979, some families may have had resources from relatives in thirdcountries. These groups are likely to be better off when facing large and unexpected crises.
Table 6.1 Average Farm Size1 and Landlessness 2 by Province1995-96 MRC 1997 SES 1998 BaselineProvince Pop.
density 3 Av. Size Landless Av. Size Landless Av. size LandlessBanteay Meanchey 86 .. .. 2.05 13% .. ..Battambang 64 1.76 25% 1.15 27% 1.32 29%Kompong Cham 171 0.51 20% 0.63 19% 0.91 4%Kompong Chhnang 79 0.81 25% 0.43 16% 0.44 17%Kompong Speu 88 .. .. 0.91 6% 0.71 7%Kompong Thom 46 0.97 16% 1.31 9% 0.91 1%Kampot 113 .. .. 0.77 2% 0.83 ..Kandal 301 0.45 35% 0.79 17% 0.55 13%Koh Kong 11 .. .. 4.38 50% .. ..Kratie 22 .. .. 1.23 23% 0.48 37%Phnom Penh 2,680 0.35 .. .. .. .. ..Prey Veng 196 .. .. 1.09 7% 1.21 8%Pursat 31 1.63 7% 1.81 13% .. ..Rattanakkiri 8 .. .. 0.42 3% .. ..Siem Reap 58 1.10 12% 0.97 8% 0.99 4%Sihanoukville 112 .. .. 0.40 .. .. ..Stung Treng 7 .. .. 1.87 .. 1.04 2%Svay Rieng 167 .. .. 1.28 4% 0.57 6%Takeo 226 .. .. 0.83 3% 0.92 8%Oddar Meanchey 13 .. .. .. .. 0.86 6%
Note: 1 average farm size is the agricultural land size in hectares per household. 2 landlessness is the percentage ofhouseholds without agricultural land. 3 census results.Sources: Household Socio-economic Survey, MRC 1995-96; Socio-economic Survey, NIS 1997; Baseline Survey, UNWFP 1998;and, Population Census, NIS 1999.
Depending upon the number of family members and the areas where they were livinguntil 1989, people received varying amounts of land and land with different soil quality. As 1 The way in which the surveys selected their target population was different, although they chose
their samples from the same provinces.

Cambodia Development Resource Institute Land Pressure and Concentration
29
mentioned earlier, people in densely-populated provinces such as Takeo, Prey Veng and SvayRieng, seemed to get smaller amounts of land than those in the north-eastern parts of thecountry, such as Battambang or Pursat. In addition, soil quality in Battambang and Pursatprovinces is higher than in Takeo, Prey Veng and Svay Rieng. As a result, the people in thoseparts of the country were likely to be able to produce more, and hence, to supply themselveswith sufficient food.
Consequently, some people have been able to expand their land holdings by buying upmore land while others have had to sell their land, and as a result, have become landless ornearly landless. High population growth and the poor land supply system have exacerbatedthis process. Current land market distortions not only cannot prevent land concentration, butalso accelerate the concentration in rural areas. Unfortunately, there is no comprehensive dataon land concentration in Cambodia in general.
Figure 6.4 Lorenz Curve for Agricultural Land Distribution
Note: 1 line of perfect equality corresponds to the value of 1 of Gini coefficient, denoting perfect land distribution. It showsthat the ratio of landholders shares the same percentage of land size. For example, 10 percent of the lowest group shares10 percent of land size and 10 percent of the highest group also shares only 10 percent of land size.Sources: Household Socio-economic Survey, MRC 1995-96; Socio-economic Survey, NIS1997; Baseline Survey, UNWFP 1998;and, PET, UNWFP 1998
Line of P
erfect E
quality (1
)
0
20
40
60
80
100
0 20 40 60 80 100Cumulative Percentage of Households
Cum
ulat
ive
Perc
enta
ge o
f Agr
icul
tura
l Lan
d
MRC SES (rural) Baseline PET

Land Ownership, Sales and Concentration in Cambodia Working Paper 16
30
Based on the survey data, it is possible to construct a Lorenz curve2 and calculate Ginicoefficients3 to represent the current degree of land concentration. The surveys show thatfarmers who owned farmland larger than 1 ha, controlled large areas of farmland, leaving therest too little for agricultural production. Table 6.2 and Figure 6.4 provide two illustrations ofthe inequality in land distribution in Cambodia. The Gini coefficient of overall inequality inland ownership based on the survey data, range from 0.47 to 0.66, denoting a high degree ofinequality. While the Lorenz curves of all four surveys represent the degree of inequality inland distribution, Table 6.2 provides more detail about the inequality in land ownership byillustrating the ratio of the percentage of owners to the percentage of land in each category ofsize.
Table 6.2 Percentage of Households and Average Agricultural Land Size HoldingsPercentage of Households Percentage of Agr. land holdings
Land size categories male-headed
female-headed total 1 male-
headedfemale-headed total 1
MRC Survey (Gini Coefficient of land concentration = 0.61)Landless 23% 30% 24% - - ->0-0.5 ha/hh 34% 37% 34% 12% 19% 13%>0.5-1.0 ha/hh 22% 20% 21% 24% 32% 22%> 1.0 ha/hh 21% 13% 21% 64% 49% 65%SES (rural) (Gini Coefficient of land concentration = 0.66)Landless 11% 15% 12% - - ->0-0.5 ha/hh 37% 48% 40% 8% 18% 10%>0.5-1.0 ha/hh 26% 23% 25% 19% 29% 20%> 1.0 ha/hh 26% 14% 23% 73% 53% 70%Baseline Survey (Gini Coefficient of land concentration = 0.50)Landless 11% 11% 11% - - ->0-0.5 ha/hh 34% 43% 35% 14% 14% 14%>0.5-1.0 ha/hh 32% 23% 31% 31% 18% 30%> 1.0 ha/hh 23% 23% 23% 55% 68% 56%PET Survey (Gini Coefficient of land concentration = 0.47)Landless 16% 30% 17% - - ->0-0.5 ha/hh 19% 17% 18% 7% 8% 7%>0.5-1.0 ha/hh 29% 23% 29% 24% 24% 24%>1.0 ha/hh 36% 30% 36% 69% 68% 69%
Note: 1 weighted averageSources: Household Socio-economic Survey, MRC 1995-96; Socio-economic Survey, NIS1997; Baseline Survey, UNWFP 1998;and, PET, UNWFP 1998
Land distribution in Cambodia is skewed and the minority who are rich/well off occupylarge areas of land, while the large majority of the poor/worse off have only small pieces ofland to live on. All three surveys, except the 1998 Baseline survey, indicate that the minority,about 20-30 percent of the total population, who had land greater than one hectare perhousehold (ha/hh) occupied nearly 70 percent of total agricultural land. This leaves about 10percent of farmland for the majority who have less than 0.5 ha/hh. The table shows that thefarmers who had 0-0.5 ha/hh occupied only about 10 percent of total agricultural land. Thetable, moreover, illustrates that about 30 percent of the total population who owned landbetween 0.5-1.0 ha/hh also occupied only 20 percent of total agricultural land. 2 This is indicative of the amount of unequal land distribution in the society it represents. The greater
the extent of inequality, the further the Lorenz curve will be from the line of perfect equality (45°line).
3 This is a summary statistic of inequality derived from the Lorenz curve which gives the areabetween the observed Lorenz curve and the line of perfect equality as a proportion of the total areaunder the line of perfect equality. This coefficient has a maximum value of 1 (absolute inequality)and a minimum of zero (perfect equality).

Cambodia Development Resource Institute Land Pressure and Concentration
31
It is likely that the more representative and/or larger the sample size, the greater thedegree of inequality of land distribution. All of the Lorenz curves and Gini coefficients ofland distribution in the four surveys show significant differences in the unevenness of landdistribution. It seems that large surveys such as the MRC and the SES, which are morenationally representative, produce a curve which is further to the right of the line of perfectequality and higher values of Gini coefficients (over 0.60). This implies that in general, landdistribution in Cambodia is very skewed.


33
Chapter Seven
Suggestions for Improvement of FutureQuestionnaires
To capture a clear picture of the land situation in Cambodia, questions should be carefully andprecisely defined. On the basis of the current, effective, land-related regulations, some of themost important assumptions about land access, acquisition and transactions are:
1) The land redistribution programme which took place in the 1980s was the mainsource of land for private ownership;
2) The vast majority of the rural population obtained agricultural land in the 1980sredistribution; and
3) All types of land have presumably been transferred and legally-recognisedsubsequent to the 1989 redistribution only.
Based on these assumptions, the following questions can be framed to investigate landaccess, ownership, tenure, tenancy and transactions in a specific area.
1. How long have you been living in this village? ................ years
2. Did you have land before 1989/90? €€ Yes €€ No
3. Do you own any land now? €€ Yes €€ No
4. How many square meters/are/hectares of land do you own?
4.1 Residential land ...………….. sq.m/are/ha.
4.2 Wet-season rice .......……….. sq.m/are/ha.
4.3 Dry-season rice ....………….. sq.m/are/ha.
4.4 Chamkar .....………….. sq.m/are/ha.
4.5 Other (specify) ......………….. sq.m/are/ha.
5. How did you get most of your land?
5.1 1980s distribution/Krom Samaki €€
5.2 Given by relatives/friends €€
5.3 Bought €€
5.4 Cleared land/occupied free €€
5.5 Given by authorities €€
5.6 Other (specify) ………….. €€

Land Ownership, Sales and Concentration in Cambodia Working Paper 16
34
6. In the case of 5.3, from whom did you buy the land?
a) Relative/friend (in the same village/area) €€
b) Urban people (outsider) €€
c) Other (specify) ………………… €€
7. What price did you pay? ................... Riel/$/Chi per sq.m/are/ha
8. When did you buy your land? 19 ........
9. Do you have any of the following ownership papers for your land?
Residential land
a) Certificate of possession rights €€
b) Application receipt €€
c) Certificate of ownership €€
d) None of the above €€
Agricultural land
a) Certificate of possession rights €€
b) Application receipt €€
c) Certificate of ownership €€
d) None of the above €€
10. In whose name is the title?
Residential land
a) Husband €€
b) Wife €€
c) Both €€
d) Someone else (specify) ...................... €€
Agricultural land
a) Husband €€
b) Wife €€
c) Both €€
d) Someone else (specify) ...................... €€
11. Did you rent any agricultural land to farm this year? €€ Yes €€ No
12. How many square meters/are/hectares of agricultural land do you rent?
a) Wet-season rice ………….. sq.m/are/ha.
b) Dry-season rice ………….. sq.m/are/ha.
c) Chamkar ………….. sq.m/are/ha.
d) Other (specify) ……………. ………….. sq.m/are/ha.
13. How do you pay the rent? €€ in cash €€ in kind
14. Did you rent any agricultural land to others this year? €€ Yes €€ No
15. How many square meters/are/hectares of agricultural land do you rent to others?

Cambodia Development Resource Institute Suggestions for Improvement of Questionnaire
35
a) Wet-season rice ………….. sq.m/are/ha.
b) Dry-season rice ………….. sq.m/are/ha.
c) Chamkar ………….. sq.m/are/ha.
d) Other (specify) ………….. sq.m/are/ha.
16. How do you receive the rent? €€ in cash €€ in kind
17. Have you sold any land since 1989/90? €€ Yes €€ No
18. When did you sell your land? 19 _ _
19. Why did you sell your land? (main cause)
a) Repaid heavy debts €€
b) Did new business (non-farm work) €€
c) Did not have enough labour to farm €€
d) Paid for medical treatment/accident €€
e) Bought food €€
f) Paid for son/daughter’s marriage €€
g) Sold land to gain profit €€
h) Others (specify) ……………… €€
20. Whom did you sell your land to?
a) Relative/friend (in the same village/area) €€
b) Urban people (outsider) €€
c) Other (specify) ………………… €€
21. Have you ever had your land taken by force by other persons for their own use?
€€ Yes €€ No
22. When did it happen? 19 _ _
23. Who did it?
a) Local authorities €€
b) Soldiers/police €€
c) Other (specify) ………………… €€
24. Are you involved in any kind of land dispute now? €€ Yes €€ No
The above questions are expected to provide more precise information related to land.Questions 1-4 will provide a clearer picture on land access in the past and present. Thesequestions will be able to identify trends in rural people’s land access since land wasredistributed in the 1980s. The rest of the questions will detect the current situation of landownership, land tenure status, land transactions, land tenancy, landlessness, landlords andothers in a specific area.


37
Chapter Eight
Conclusion
8.1 Summary of results
Although it is not entirely conclusive to compare different analyses from different surveyswith different sample populations, some generalisations can be drawn from the above results.First, the majority of the population does not have official documents to prove theirownership. Although the General Department of Cadastre and Geography has claimed thatover four million applicants have applied for ownership title for their land, only a smallproportion of the population has officially received the certificates. The situation is evenworse in rural areas, especially among female-headed households.
Second, all three types of land, residential land, agricultural land and common landhave actively changed hands at a high rate. Even though it is hard to find out the actualvolume of sales in residential land, agricultural land and common property, the surveys showthat sales have occurred in both rural and urban areas wherever there is a land market. Thesurveys also suggest that transactions in common property have reduced the availability of theproducts and benefits derived from common property, and hence, reduced supplementarysources of income and food security for the poor in rural areas.
Finally, one result of these transactions and development processes has been anincrease in homelessness, landlessness and land concentration, with the rich holding a greatdeal of land and the poor with only a little to live and work on. Again, female-headedhouseholds are the most vulnerable groups with respect to landlessness and have the smallestareas of land for farming.
8.2 Policy implications
A number of policy implications can be drawn from the above discussion. Land issues are aconcern for policy makers because they often lead to social, economic and political problems.Only a small proportion of landholders (mostly those who could afford the high cost ofregistration), have legal certificates for their land. The rest of the landholders, especially thepowerless, the poor and female-headed households, live under the threat of losing their landby encroachment. Insecure land ownership also discourages farmers from investing more intheir land. This discourages increased productivity and perpetuates food insecurity among therural poor. Therefore, land registration and titling are an urgent need for the government toaddress. Secure ownership will serve as a tool to protect the poor and will provide incentivesto invest in their land assets, which in turn will significantly increase agricultural productivity,and hence, improve food security.
The increasing rate of land transactions in both rural and urban areas has highlightedother worrisome problems. On the one hand, land transactions serve as a catalyst to increase

Land Ownership, Sales and Concentration in Cambodia Working Paper 16
38
land speculation in cities, along main roads and in areas where land is fertile. This in turnleads to under-utilisation of productive agricultural land and efficiency losses. On the otherhand, transactions serve as a means of increasing land concentration for the benefit of ahandful of the rich, while leaving the majority poor with no land to live and work on.Appropriate and effective controls over state-owned land are needed to reserve some land forfuture development and distribution.
The above processes contribute to uneven land distribution and land concentration. Asover 60 percent of rural households live on about 30 percent of total agricultural land, theyface a high risk of food insecurity. Again, the appropriate management of state-owned landand de-mined land would improve land distribution and help the poor to access land, ensuringhousehold food security.
The situation is worse still when land sales are due to crisis situations. Because of alack of credit and social services in rural areas, distress sales of productive assets, especiallyland, are commonly used as the only coping strategy during emergencies. The expansion ofrural credit accessibility and better and affordable social services, especially health care,would make the lives of the poor significantly different.
Natural resources, such as forests and fisheries constitute a significant source ofsubsistence income and food security in rural Cambodia. Their reallocation to private useaffects rural livelihoods. The allocation of 50 percent of the remaining forests to privatecompanies as forest concessions is greatly diminishing the well-being of Cambodians, as itlimits access for the majority. As far as beneficiary distribution is concerned, the reallocationof forests to local communities would both ensure the sustainability of the resources andimprove food security for the rural poor.
Likewise, the expansion of fishing lots allocated to private individuals or companiesresults in over-exploitation of the resources, leading to a rapid reduction in available products.It threatens food security for the majority of the poor, whose main source of daily protein isderived from fisheries products. The uneven reallocation and distribution of these resourcesbrings about frequent conflicts between local communities and lot holders, whichoccasionally end with serious violations of people’s rights. Here again, the reallocation offishery resources to community management might help to prevent future conflicts and ensuresustainability of the resources.
8.3 Suggestions for further research
The goal of this paper was limited to an examination of four existing data sources on landissues. Thus it cannot provide comprehensive conclusions and recommendations about landissues and their consequences, especially concerning the welfare of the landless and differentgroups of landholders. Further research should be done in these areas to investigate thefollowing questions in greater depth:
1) What are the economic activities of households in different farm-size categories?2) What are the linkages between land transactions and the socio-economic welfare of
rural households?3) Are the landless or near-landless worse off and are landowners better off, in terms
of social and economic welfare in rural areas?4) To what extent have common property resources been transferred to private control?
And how are farmers and local communities affected by the consequent restrictionto access?
5) To what extent does the price of agricultural land vary in different geographicalareas?
6) Do we still have available land for the poor and landless? Can land be betterutilised?

39
Appendix A
Land-related Questions
Appendix A-1. Household Socio-economic Survey in Fishing Communities
Section IV. Ownership of Land, Livestock and Trees
1. Land owned
Area (m2)a. homestead (include dwelling house and pond) _ _ _ _ _ _b. agricultural land _ _ _ _ _ _c. orchard _ _ _ _ _ _d. fish pond outside homestead _ _ _ _ _ _e. others (specify)................... _ _ _ _ _ _
2. Do you have fishpond in your homestead? Yes = 1 No = 03. If you have fish pond(s) in your homestead, what is the size (m2)? _ _ _ _ _ _4. Land currently under use by the household
a. agricultural land _ _ _ _ _ _b. orchard _ _ _ _ _ _c. fish pond outside homestead _ _ _ _ _ _d. others (specify) _ _ _ _ _ _
5. Leased in and leased out landa. leased in land _ _ _ _ _ _b. leased out land (m2) _ _ _ _ _ _
6. Do you have a trap-pond(s)/ditch within your ricefield? Yes = 1 No = 07. Do you raise fish in cage(s) Yes = 1 No = 0
Section V: Access to Common Property Resources
1. Do you have access to common property resources located within/outside your commune?[Yes = 1, No = 0]
2. If yes, what type of common property resources?
a. inundated forest ��b. big river/lakes ��c. flooded rice field ��d. bank/bed of rivers/lakes ��e. irrigation canals/dike/small river ��f. others ��

Land Ownership, Sales and Concentration in Cambodia Working Paper 16
40
3. What has been the trend of availability of products and benefits from the CPR in recentyears (last 10 years)?
[increasing = 1; decreasing = 2; remained constant =3]
a. Inundated forest ��b. Big river/lake ��c. Flooded rice field ��d. River/lake banks ��e. Irrigation canal/dike/small rivers ��f. Others (specify) ____________ ��
4. If the availability of products and benefits from common property resources for yourfamily are decreasing over time, what are the main reasons? [rank in order of importance,if applicable; put zero otherwise]
a. Overexploitation ��b. Change of environment ��c. Destruction of habitat (e.g., loss of inundated forest) ��d. Increasing pressure of population in the commune ��e. Use of pesticides/poisons in rice fields ��f. Conversion of common land/waters into crop lands for private use ��g. Others (specify) ��
Appendix A-2
Cambodia Socio-economic Survey 1997
A. To be completed by supervisors before interview
Urban (=1) / Rural (=2)
VII. Household Assets and Liabilities
1. Does the household own or occupy any residential lands or farm lands?
1.1. Residential lands Yes = 1 No = 21.2. Farm lands Yes = 1 No = 2
2. If you own or occupy any residential lands or farm lands please provide the followinginformation.
Residential lands/buildings Farm landsarea (sq.m) value (Riel) area (sq.m) value (Riel)Lands
(1) (2) (3) (4)2.1. Owned with title2.2. Ownership unsettled
/held for free2.3. Rented/leased

Cambodia Development Resource Institute Appendix-A
41
Appendix A-3
The Cambodian 1998 Joint UNICEF-WFP Baseline Survey of CASD Project and WFPTarget Areas
105 Did this household return from the Thai border camps with theUN in 1992/93? Yes ……. 1 No …... 2
Land Access
Write the amount in are or rai in the appropriate column – if no land,use ‘00’ Are Rai
109 Land area owned by the household for wet-season rice _ _ _ _ _ _ _ _ _ _ _ _ _ _
110 Land area rented or exchanged for this household to growwet-season rice _ _ _ _ _ _ _ _ _ _ _ _ _ _
111 Land area owned by the household for dry-season rice _ _ _ _ _ _ _ _ _ _ _ _ _ _
112 Land area rented or exchanged for this household to growdry-season rice _ _ _ _ _ _ _ _ _ _ _ _ _ _
113 Land area owned by the household to grow chamkar _ _ _ _ _ _ _ _ _ _ _ _ _ _
114 Land area rented or exchanged for this household to growchamkar rice _ _ _ _ _ _ _ _ _ _ _ _ _ _
115 Do you also have garden around the house? Yes …… 1 No ……. 2
116 Does your rice land or chamkar land contain land mines? Yes …… 1 No ……. 2
117 Does any member of your household have to go to forestareas with land mines for livelihood needs? Yes …… 1 No ……. 2
Crises or Shocks to Household Food and Income Access
127 In 1997, did you go to the forest more often, less often, or thesame as in 1996?
more(1)
less(2)
same(3) n.a. (8)
128 Did you collect more, less or the same amount of forestproducts in 1997 as you did in 1996?
more(1)
less(2)
same(3) n.a. (8)
129 In 1997, did you go fishing more often, less often, or the sameas in 1996?
more(1)
less(2)
same(3) n.a. (8)
130 Did you catch more, less or the same amount of forestproducts in 1997 as you did in 1996?
more(1)
less(2)
same(3) n.a. (8)
Coping Strategies Adopted to Meet Crises and ShocksComplete this section only if the household has experienced one or more crisis events or shocks listed in theprevious section. The crises or shocks experienced by the household could mean a large and unexpectedshortage of food or income for the household. Here we ask what the household did in 1997 because ofthese problems.In 1997, did you or your family:148 Rent out land to other farmers? Yes …… 1 No ……. 2
149 Sell land? Yes …… 1 No ……. 2150 Sell your house? Yes …… 1 No ……. 2

Land Ownership, Sales and Concentration in Cambodia Working Paper 16
42
Appendix A-4.
Protracted Emergency Targets Survey, 1998
Particular Household Circumstances
202 Did this household return from Thai border camps with theUN in 1992/93? Yes …… 1 No ……. 2
Household Mobility and Settlement
302 Is your household currently displaced from your normalplace of living? Yes …… 1 No ……. 2
304 Is this household now resettled in your normal living placeafter being displaced due to fighting in the past? Yes …… 1 No ……. 2
306How many times has your household moved its place of living in Cambodiasince 1989? (record number of times moved)(definition: this refers to moves to settlements involving most of the householdmembers for a minimum period of one month)
_ _ _ _ _ _
Land Access
501 Do you own any rice land or chamkar land or a house plot? Yes …… 1 No ……. 2
Rice LandWrite the amount in are or rai in the appropriate column – if no land,use ‘00’ Are Rai
502 Land area owned by the household for wet-season ricecrops + +
503 Land area rented or exchanged for this household to growwet-season rice + +
504 Area of wet-season land owned by the household rented orexchanged to other farmers to grow their rice - -
505 Land area owned by the household for dry-season ricecrops + +
506 Land area rented or exchanged for this household to growdry-season rice + +
507 Area of wet-season land owned by the household rented orexchanged to other farmers to grow their rice - -
Chamkar Land
508 Land area owned by the household to grow chamkar + +
509 Land area rented or exchanged for this household to growchamkar
+ +
510 Area of Chamkar land owned by the household rented orexchanged to other farmers to grow their chamkar - -
House Plot
511 Do you own the plot of land on which this house is built? Yes …… 1 No ……. 2
512 Do you have a garden near this house? Yes …… 1 No ……. 2
513 Do you sell any fruits or vegetables grown in your garden? Yes …… 1 No ……. 2
6. Land Acquisition and Tenure
1989 subdivision of commune Krom Samaki land ………………... 1
Occupied free/unused existing agricultural land ......................... 2601 How did you get mostof your land?
Cleared this land for agriculture yourself ....................................... 3

Cambodia Development Resource Institute Appendix-A
43
Bought this land…………………………….......................................... 4
Exchanged labor or goods for this land …..................................... 5
Given by relatives/friends …………………....................................... 6
Given by authorities ……………….………......................................... 7602 For how many years have you owned most of this land? (record number of years) ........ .................
Application for possession and use of land ................................... 1
Receipt …………………………….………............................................ 2
Land investigation form …………………........................................... 3
Certificate for the right to possession of real estate ……………… 4
None of the above papers …………………..................................... 5
603Which land ownershippapers do you have foryour house plot land?
No house plot land …………………………........................................ 6
Application for possession and use of land ................................... 1
Receipt …………………………….………............................................ 2
Land investigation form …………………........................................... 3
Certificate for the right to possession of real estate ……………… 4
None of the above papers …………………..................................... 5
604Which land ownershippapers do you have foryour agricultural land?
No agricultural land ……………….………......................................... 6
Land Asset Disposal
701 Since 1989 have you sold any rice land to purchase food,pay for medical treatment or to repay debts? Yes …… 1 No ……. 2
Are Rai702
What is the total area of rice land that you have sold in alllocations since 1989? (Write the amount in are or rai in theappropriate column) _ _ _ _ _ _ _ _ _ _ _ _
703 Since 1989 have you sold any chamkar land to purchasefood, pay for medical treatment or to repay debts? Yes …… 1 No ……. 2
Are Rai704
What is the total area of chamkar land that you have sold inall locations since 1989? (Write the amount in are or rai inthe appropriate column) _ _ _ _ _ _ _ _ _ _ _ _
705 Since 1989 have you sold your house plot? Yes …… 1 No ……. 2
706 How many times have you sold a house plot since 1989? (number of times) ……………....................
16. Shocks Affecting Agricultural Production
1601 Has land you farmed last year been taken overby force by other persons for their own use?
Yes …………… (1)No ………..….. (2)
17. Shocks Affecting Access to Common Resources
1701 Did you go to forest or scrub areas to get foodor other forest products in 1998?
Yes …………… (1)No ………..….. (2)
1702 In 1998, did you go to the forest more often,less often, or the same as in 1997 more … (1) less ….. (2) Same … (3)
1703 Did you collect more, less, or the same amountof forest products in 1998 as you did in 1997? more … (1) less ….. (2) Same … (3)

Land Ownership, Sales and Concentration in Cambodia Working Paper 16
44
Declining availability of forest resources ......... 11704
If your forest activities have given you lessresults of food and income over the last yearwhat are the reasons for this change? Lower prices for forest products ………............ 2
Traders buying fewer forest products …........... 3
Restricted access imposed by others .…......... 4
Forest becoming more insecure ………............ 5
1705 Did you fish to get food or income in 1998? Yes …………… (1)No ………..….. (2)
1706 In 1998, did you go fishing more often, lessoften, or the same as in 1997? more … (1) less ….. (2) same … (3)
1707 Did you catch more, less, or the same amountof fish in 1998 as you did in 1997? more … (1) less ….. (2) same … (3)
Declining availability of fisheries resources ..... 1
Lower prices for fisheries products .................... 2
Traders buying fewer fisheries products ........... 3Restricted access imposed by others .…......... 4
1708If your fishing activities have given you lessresults of food and income over the last year,what are the reasons for this change?
Fisheries becoming more insecure ……............ 5
20. Coping Strategies Adopted to Meet Crises and Shocks
Complete this section only if the household has experienced one or more crisis events or shocks listed inthe previous section. The crises or shocks experienced by the household could mean a large andunexpected shortage of food or income for the household. Here we ask what the household did in 1998because of these problems.
In 1998, did you or your family:2008 Rent out land to other farmers? Yes …… 1 No .…. 22009 Sell land? Yes …… 1 No ……. 22010 Sell your house? Yes …… 1 No ……. 2
21. Land Mines and UXOLand Mines on other Land Owned Outside this Settlement
2105 Do you have other agricultural or house plot land outside thissettlement? Yes …… 1 No ……. 2
2106 Are you using this land outside this settlement? Yes …… 1 No ……. 2

45
Appendix B
The Application Process for Land Occupationand Use Rights Certificate
The following procedure is obtained from Oxfam GB 1999, “The Application Process forLand Occupation and Use Right Certificate”, Cambodian Land Study Project.
1. The Application
An application form, entitled “Application for Possession and Use of Land,” is first obtainedfrom a village or commune chief, of the district land title office, and completed. Theapplication form identifies the kind of land, the village, commune, and district where it islocated, the size, the length of time the person has been using the land, and information toidentify the adjoining borders (i.e., the name of the neighbour, or natural landmark, such as astream). Three options for the description of the type of land are provided on theapplication-residential land, rice land, or farmland. The application formerly was signed byboth the village and commune leaders, though the newer form promulgated in 1994 requiresonly the commune chief’s signature.
2. Receipt
This application is sent through the commune or section chief, or the land title department, tothe district land title office. The applicant gets a receipt indicating that he has made theapplication, which is identified by a receipt number, and which repeats the basic identifyinginformation about the claimant and land. Roughly 90 percent of the more than 4.4 millionfamilies who applied for a land certificate by the end of 1995 have never been issued landcertificates, and therefore have only their receipt to verify their claim of ownership. Thesereceipts are frequently viewed by landowners as title certificates, and commonly areexchanged when land is sold or pledged as collateral for loans. However, because there are no“checks” on the authenticity or veracity of the applications, there are numerous disputes inwhich two or more parties have obtained receipts for the same piece of land.
3. Claim Investigation and Survey
The Land Title Office then appoints a sub-committee to investigate the claim for possession(technically a sub-committee of the District Central Committee for land titling). This sub-committee will consist of the commune and village chiefs, a representative of the district landtitle office, and at least one village elder. The sub-committee announces its investigation tothe village and completes a “Land Investigation Record” form. To complete the form, the sub-committee obtains complete identification concerning the applicant and his/her spouse andfamily, identifies any dispute concerning the land, measures the plot, obtains the thumbprintsfrom adjoining landowners, and provides its conclusion about the applicant’s claim. The formalso requires the signatures and opinions of the district chief and land title office, the

Land Ownership, Sales and Concentration in Cambodia Working Paper 16
46
provincial land title office, the forestry or fishery departments (if relevant to the claim), and ifthe claim is for residential land, the provincial governor.
4. Certificate Preparation
The district land title office will prepare a Certificate for the Right to Possession of RealEstate, which currently must be sent, together with the application for possession and therecord of the land investigation, to the provincial land title offices, the provincial governor,and then on the Land Title Department in Phnom Penh for checking, copying in theirrespective registers, and certification. (Up until year 1996, these documents did not have to besent to Phnom Penh. For agricultural land, the district office could issue the old version of theCertificate for agricultural land, and the provincial land title office could issue the card forresidential land.)
5. Issuance of Certificate
The Land Title Department, after keeping copies of the forms and certificate, returns thedocuments to the provincial land title office. The provincial office registers the documents inits register books, keeps a copy of the forms, and sends the documents to the district land titleoffice. That office also registers the certificate, and then gives it to the owner. Registration ofa sale of land, mortgage, or any other interest, is done at the district land title office, and thedocuments are forwarded to the provincial land title office and to Phnom Penh for checking,certification, and registration.

47
Appendix C
Land Sales Form
No: …………..
Definitive Sale
Seller-name: ……………… Age ……….. Nationality ………… Domicile ……………...
Commune ………………… District ……………………. Province ……………………...
Agrees to sell without any sign
Buyer-name: ……………… Age ……….. Nationality ………… Domicile ……………...
Commune ………………… District ……………………. Province ……………………...
Background
Husband Wife
Date of birth ……………. …………………………..
Commune……………….. …………………………..
Father …………………... …………………………..
Mother ………………….. …………………………..........................................
Form No. 1
Registered Book #

Land Ownership, sales and Concentration in Cambodia Appendix C
48
Marriage License No. …………………………………......................................................
Date ……................................................. Commune ……………......................................
……………. District …………………………………..
Agrees to buy without condition
Price ………....………………………………………………………………………………...
……………...…..………………………………………………………………………………
Stamp …………… original received
Seal ……………… Receipt ………… Date ………….. Date ………………...
Award Doc………. Receipt ………… Date ………….. Name ..……………...
(Abbr?) …………. Receipt ………… Date …………..
Total ............................................................... Thumbprint
Parcel of land and real property below are in the commune ………… district ………….........BoundariesSer. No. and
Map No. orClaim No.
Size LandType North South East West
Encumbrances onthe real property
Have made two copies on day ……. Month ………. Year …… In the presence of ……………………………………… have seen this name …………………………………………………………………….… and this name ……………………………………………....We have questioned both parties and found that both parties are the actual persons describedin this entire document in detail to both parties and both parties agreed that it is correct andagreed to sign and place their thumbprints below.
Have read this document to both parties before:
Name ……........ Age …..... Commune ………. District ……......... Province ……......
Witnesses
Name ……........ Age …..... Commune ………. District ……......... Province ……......
Right thumbprint Registered No. …………….............
Seller Buyer Witnesses Signature and seal of
Certifying Official
......... ........... .................. ....................

49
References
Ahmed, M., N. Hap, V. Ly, and M.Tiongco (1998), Socio-Economic Assessment of Freshwater CaptureFisheries of Cambodia: Report on a Household Survey (Phnom Penh: Mekong River Commission)
Greve, H.S. (1993-reprinted 1996), Land Tenure and Property Rights in Cambodia, (Phnom Penh: H.S.Greve)
Helmers, K. and E. Kenefick (1999), The UN World Food Programme Protracted Emergency Target(PET) Survey of Households in Cambodian Communes Affected by Civil Conflict Since 1989, WorldFood Programme-PET Baseline Survey Report (Phnom Penh: World Food Programme)
Kenefick, E. (1998), Report on the Cambodian 1998 Joint UNICEF-WFP Baseline Survey of CASDProject and WFP Target Areas (Phnom Penh: UNICEF-UNWFP/Ministry of Planning)
Meijers, H. (1994), Land Tenure and Agriculture in Cambodia: Historical Overview (Bangkok: AsianInstitute of Technology)
Ministry of Agriculture, Forestry and Fisheries (1999), Report on Donor’s Meeting, Wednesday, 27January 1999: Statement on Forestry (Phnom Penh: Ministry of Agriculture)
National Assembly (1992), Land Law, (Phnom Penh: National Assembly of Cambodia)
National Institute of Statistics (1998) Report on the Cambodia Socio-economic Survey 1997, (PhnomPenh: Ministry of Planning)
National Institute of Statistics (1999), General Population Census of Cambodia 1998: Final CensusResults, (Phnom Penh: Ministry of Planning)
Ray, D. (1998), Development Economics, (Princeton: Princeton University Press)
Williams, S. (1998), Where has all the land gone? A Review of Published and Unpublished MaterialsRelating to Land Rights and Access in Cambodia (Phnom Penh: Oxfam GB)


51
CDRI Working Papers
1) Kannan, K. P. (November 1995), Construction of a Consumer Price Index for Cambodia: AReview of Current Practices and Suggestions for Improvement (Working Paper No. 1) (outof print)
2) McAndrew, John P. (January 1996), Aid Infusions, Aid Illusions: Bilateral and MultilateralEmergency and Development Assistance in Cambodia, 1992–1995 (Working Paper No. 2)(out of print)
3) Kannan, K. P. (January 1997), Economic Reform, Structural Adjustment and Development inCambodia (Working Paper No. 3) (out of print)
4) Chim Charya, Srun Pithou, So Sovannarith, John McAndrew, Nguon Sokunthea, Pon Dorina& Robin Biddulph (June 1998), Learning from Rural Development Programmes in Cambodia(Working Paper No. 4) $7.50
5) Kato, Toshiyasu, Chan Sophal & Long Vou Piseth (September 1998), Regional EconomicIntegration for Sustainable Development in Cambodia (Working Paper No. 5) $6.00
6) Murshid, K. A. S. (December 1998), Food Security in an Asian Transitional Economy: TheCambodian Experience (Working Paper No. 6) $9.00
7) McAndrew, John P. (December 1998), Interdependence in Household Livelihood Strategies in TwoCambodian Villages (Working Paper No. 7) $9.00
8) Chan Sophal, Martin Godfrey, Toshiyasu Kato, Long Vou Piseth, Nina Orlova, Per Ronnås & TiaSavora (January 1999), Cambodia: The Challenge of Productive Employment Creation (WorkingPaper No. 8) $9.00
9) Teng You Ky, Pon Dorina, So Sovannarith & John McAndrew (April 1999), The UNICEF/Community Action for Social Development Experience—Learning from Rural DevelopmentProgrammes in Cambodia (Working Paper No. 9) $4.50
10) Gorman, Siobhan, with Pon Dorina & Sok Kheng (June 1999), Gender and Development inCambodia: An Overview (Working Paper No. 10) $6.00
11) Chan Sophal & So Sovannarith (June 1999), Cambodian Labour Migration to Thailand: APreliminary Assessment (Working Paper No. 11) $3.00
12) Chan Sophal, Toshiyasu Kato, Long Vou Piseth, So Sovannarith, Tia Savora, Hang Chuon Naron,Kao Kim Hourn & Chea Vuthna (September 1999), Impact of the Asian Financial Crisis on theSEATEs: The Cambodian Perspective (Working Paper No. 12) $4.50
13) Ung Bunleng, (January 2000), Seasonality in the Cambodian Consumer Price Index (WorkingPaper No. 13) $3.00
14) Toshiyasu Kato, Jeffrey A. Kaplan, Chan Sophal and Real Sopheap (May 2000), Enhancing Gov-ernance for Sustainable Development (Working Paper No. 14) $6.00

Land Ownership, Sales and Concentration in Cambodia Working Paper 16
52
15) Martin Godfrey, Chan Sophal, Toshiyasu Kato, Long Vou Piseth, Pon Dorina, Tep Saravy, TiaSavara and So Sovannarith (August 2000), Technical Assistance and Capacity Development in anAid-dependent Economy: the Experience of Cambodia (Working Paper No. 15) $10.00


56 Street 315, Tuol Kork, Phnom Penh, Cambodia(Postal address: PO Box 622, Phnom Penh, Cambodia)
Tel: (855-23) 881-701 / 881-916 / 881-384 Fax: (855-23) 880-734e-mail: [email protected] website: http://www.cdri.org.kh
$ 7.00
Land Ownership, Sales and Concentration in Cambodia:
A Preliminary Review of Secondary Data and Primary Data from FourRecent Surveys
Within ten years of the reintroduction of private ownership and the redistri-bution of land in Cambodia, land issues have become one of the most sen-sitive economic, social, and political issues in the country, demanding urgentsolutions. In the absence of comprehensive land-related data, this studyextensively analyses secondary and primary data from four large-scale sur-veys to better understand current land issues.
In conducting this study, CDRI asked questions about: the patternsof land acquisition; land tenure and land ownership; the magnitude of landtransactions in the market; trends in the availability of benefits derived fromcommon property resources; the incidence of land concentration and land-lessness; and the relationship between gender- and land-related issues. Thestudy also considered implications for future policy and how future studiesof land issues and their questionnaires might be improved.
In undertaking this research, CDRI analysed relevant land-issue in-dicators from four large-scale household surveys: one from a Mekong RiverCommission (MRC) project, another one from the National Institute of Sta-tistics (NIS) and two from the World Food Programme (WFP).
____________________
Sik Boreak is a researcher with the Cambodia Development Resource In-stitute.