land management style and soil erosion in the western area
TRANSCRIPT

Land management style and soil erosion in the
western area of Uruguay:
local farmers vs. foreign investors
M.Sc. Thesis
By Lucrezia Caon
International Land and Water Management
Land Degradation and Development Group

2

3
Author Lucrezia Caon
Student ID 880730-154-070
Supervisor Dr. Ir. Aad Kessler
Wageningen University, The Netherlands
Local supervisor Ing. Agr. Pedro Arbeletche
Universidad de la Republica, Uruguay
Wageningen, 8
th May, 2013

4

i
Abstract
Governments, companies and individuals with financial capital to invest, are worldwide buying or renting land in
developing or third world countries. The introduction of transgenic crops in agriculture, the intensification of the
production and the large amount of soybean demanded by the international market, are increasing the pressure on the
resource soil. To take the right land management decision is fundamental to avoid soil erosion and to preserve soil
productive capacity. Uruguay is a developing country whose economy is mainly based on agriculture. Since 2000
many foreigners started to invest in the agricultural sector and to practice intensive large scale agriculture in Uruguay.
Nowadays the main crop planted by both foreigners and locals is transgenic soya. It is commonly said that foreigners
investing in poor countries are exploiting the local natural resources aiming to get the highest possible profit from
them. Is this a valid assumption in Uruguay? The purpose of this study is to compare the land management style of
foreign and local farmers and to relate it to the soil erosion occurring in the study area. The land tenure (rented or
owned fields) and the type of farmer interviewed (individual farmer or anonymous society) are taken into
consideration during the analysis. Actual and future soil erosion rates are simulated and conclusions on the relation
between the nationality of the farmer and the loss of soil are provided.

ii

i
Table of contents
List of tables………………………………………………………………………………………...............
List of figures……………………………………………………………………………………….............
Acknowledgments…………………………………………………………………………………..............
List of abbreviations………………………………………………………………………………………...
1 Introduction ………………………………………………………………………………………………
2 Materials and method(s)…………………………………………………………………………………..
3 Uruguayan agriculture: an overview of its development with a focus on the actual agricultural .
system……………………………………………………………………………………………………….
3.1 Foreign investors in the agricultural sector…………………………………………………………..
3.2 Soya RR, fallow period and crop rotation: environmental issues…………………………………....
4 Land management legislative framework………………………………………………………………...
5 Soil erosion……………………………………………………………………………………………….
5.1 Sod seeding, stubbles and cover crops……………………………………………...……………...
5.2 Soil compaction…………………………………………………………………………………….
5.3 Actual and future soil erosion rate in the study area……………………………………………….
6 Land management style…………………………………………………………………….…………….
7 Discussion………………………………………………………………………………………………...
8 Conclusions……………………………………………………………………………………………….
9 Recommendations……………………………………………………………………………………..….
Bibliography……………………………………………………………………………………………......
Appendix 1: Questionnaire to the farmers……………………………...…………………………..............
Appendix 2: Erosion 6.0……………………………………………………………………………………
Appendix 3: Agricultural machineries……………………………………………………………………...
Appendix 4: Agrochemicals…………………………………………………………………………...……
Appendix 5: Extra graphs…………………………………………………………………………..............
ii
iv
vii
ix
1
3
6
7
9
13
17
18
20
22
26
30
34
35
37
41
47
58
61
63

ii
List of tables
Table 1. Number of farmers managing rented or owned fields only…………………………………..
Table 2. Crop rotation plans simulated………………………………………………………………...
Table 3. The most common crop rotation plans actually done by the interviewees (the abbreviation
“WC” refers to “winter crop”)……………………………………………………………………..….
Table 4. Simulated actual soil loss rates (ton/ha/year) in the soil unit “Canada Nieto”. N refers to
“no mitigation measures”, CF “conservation buffers”, T30 “terraces having a distance of 30
meters”, T50 “terraces having a distance of 50 meters” and T200 “terraces having a distance of 200
meters”…………………………………………………………………………………………...…….
Table 5. Crop rotation plans on rented and owned fields. “AC” refers to “actual crop rotation
plan”……………………………………………………..………………………………………….….
Table 6. Ideal crop rotation plans (IC)..…………………………………………………………….....
Table 7. Simulated future soil erosion rates (ton/ha/year) in the soil unit “Canada Nieto”. N refers to
“no mitigation measures”, CF “onservation buffers”, T30 “terraces having a distance of 30 meters”,
T50 “terraces having a distance of 50 meters” and T200 “terraces having a distance of 200 meters”.
“IC” refers to “ideal crop rotation plan”.…………………………………………………..................
Table 8. Crop distribution in the study area…………………………………………………………...
4
6
23
23
24
25
25
26
[Appendices]
Table 1. Characteristics of the soil units (Ministerio de Agricultura y Pesca, 1979)………...………
Table 2. K and R factors in the simulations……………………………………………………..……
Table 3. Three years crop rotation plans…………………………………………………………..…
Table 4. Two years crop rotation plans………………………………………………………………
Table 5. Crop rotation plans simulated…………………………………………………………….…
Table 6. Settings of the C factor for crop rotations 1 and 2…………………………………………..
Table 7. Settings of the C factor for crop rotations 3, 4 and 5………………………………………..
Table 8. Settings of the C factor for crop rotation 6………………………………………………….
Table 9. Settings of the C factor for crop rotation 7………………………………………………….
Table 10. C factor value (real crop rotation plans)…………………………………………………...
Table 11. Simulated actual soil erosion rates (Ton/ha/year) in the soil unit “Young”……………….
Table 12. Simulated actual soil erosion rates (Ton/ha/year) in the soil unit “Canada Nieto”………..
Table 13. Simulated actual soil erosion rates (Ton/ha/year) in the soil unit “Bequelo”……………...
Table 14. Simulated actual soil erosion rates (Ton/ha/year) in the soil unit “Risso”………………...
Table 15. P/C combinations exceeding the T value in “Young”……………………………………..
48
49
50
50
50
51
51
52
52
52
53
53
53
54
54

iii
Table 16. P/C combinations exceeding the T value in “Canada Nieto”…………………………..….
Table 17. P/C combinations exceeding the T value in “Bequelo”…………………………………...
Table 18. P/C combinations exceeding the T value in “Risso”………………………………………
Table 19. “Ideal” crop rotation plans…………………………………………………………………
Table 20. Settings of the C factor for the “ideal” crop rotation plans………………………………..
Table 21. C factor values (“ideal” crop rotation plans)………………………………………………
Table 22. Simulated future soil erosion rate (Ton/ha/year) in the soil unit “Young”………………..
Table 23. Simulated future soil erosion rate (Ton/ha/year) in the soil unit “Canada Nieto”………...
Table 24. Simulated future soil erosion rate (Ton/ha/year) in the soil unit “Bequelo”………………
Table 25. Simulated future soil erosion rate (Ton/ha/year) in the soil unit “Risso”…………………
Table 26. P/C combinations exceeding the T value in “Young”……………………………………..
Table 27. P/C combinations exceeding the T value in “Canada Nieto”……………………………...
Table 28. P/C combinations exceeding the T value in “Bequelo”…………………………………...
Table 29. P/C combinations exceeding the T value in “Risso”………………………………………
Table 30. List of the agrochemicals used by farmers and their chemical properties…………………
54
55
55
55
55
56
56
56
56
56
57
57
57
57
61
iv
List of figures
Figure 1. Uruguayan departments (EducaSitios, n.d.)…………………………………………...……
Figure 2. Percentage (%) of farmers managing rented or/and owned fields…………………….……
Figure 3. Percentage (%) of the study area managed by the different types of investors……….……
Figure 4. Fallow period (Ernst and Siri, 2008)……………………………………………………..…
Figure 5. Seeding and harvesting periods for soya “de primera”, soya “de segunda” and wheat……
Figure 6. Use of irrigation systems in the study area………………………………………………….
Figure 7. Ownership of the land in the study area…………………………………………………….
Figure 8. Duration of the crop rotation in the study area……………………………………………...
Figure 9. Percentage (%) of the study area occupied by the different crop types…………………….
Figure 10. Length of the rental contract and its relationship with the investor type………………….
Figure 11. CONEAT map (RENARE, 2008)………………………………………………………....
Figure 12. Soil chemical analysis……………………………………………………………………..
Figure 13. Trend of some soil erosion features……………………………………………………….
Figure 14. Big amount of stubbles…………………………………………………………………….
Figure 15. Stubbles moved by surface runoff…………………………………………………………
Figure 16. Inputs and outputs within the soil (Ernst, 2004)…………………………………………..
Figure 17. Rill erosion caused by mosquitos………………………………………………………….
Figure 18. Soil compaction trend……………………………………………………………………..
Figure 19. Machineries used on the field……………………………………………………………...
Figure 20. Soil types in Uruguay (SPI, n.d.)…………………………………………………………..
Figure 21. Digital elevation model (MGAP, 2013)…………………………………………………...
Figure 22. Mitigation measures taken by farmers nowadays…………………………………………
Figure 23. Mitigation measures that present a significant difference in value (at least 20%) between
local and foreign investors…………………………………………………………………………….
Figure 24. Reasons why farmers are not building terraces……………………………………………
Figure 25. Future mitigation measures………………………………………………………………..
Figure 26. “X shape” of the fields under conventional agriculture…………………………………...
Figure 27. Soil erosion caused by neighboring fields (details)………………………………………..
Figure 28. Soil erosion caused by neighboring fields………………………………………………
Figure 29. Shape of the fields: a) shape of the fields coming from cattle breeding; b) ideal shape of
the fields cutting the slope…………………………………………………………………………….
1
4
8
9
10
11
11
12
12
13
15
16
18
19
19
19
20
21
22
23
23
27
28
28
29
30
30
30
31

v
[Appendices]
Figure 1. Mosquito………………………………………………………….…………………………...
Figure 2. Fertilizing machinery………………………………………………………………………….
Figure 3. Planter………………………………….………………………….…………………………..
Figure 4. Harvester (Agroads, 2004)…………………………………………………………………….
Figure 5. Plane………………………………………………………………..……………………….…
Figure 6. Paratill (Bigham Brothers, 2009)……………………………………………………………...
Figure 7. Blade of the paratill (Agroads, 2008)………………………………………………………….
Figure 8. Subsoiler (Agriaffaires, 2013)………………………………………………………………....
Figure 9. Excentrica (Nievas, n.d.)………………………………………………………………………
Figure 10. Rastron (Agriocasion, 2007)…………………………………………………………………
Figure 11. Chisel (Mas poco vendo, 2013)……………………………………………………………...
Figure 12. Vibrocultor (Siderman, n.d.)…………………………………………………………………
Figure 13. Detail vibrocultor (ACA, n.d.)……………………………………………………………….
Figure 14. Landplane working (TractorByNet, 2012)…………………………………………………...
Figure 15. Landplane (Ratlam Business Guide, 2012)…………………………………………………..
Figure 16. Trend of the fertilization of soya “de primera”………………………………………………
Figure 17. Trend of the yield (promedio Kg/ha/year) of soya “de primera”…………………………….
Figure 18. Trend of the fertilization of soya “de segunda”……………………………………………...
Figure 19. Trend of the yield (promedio Kg/ha/year) of soya “de segunda”……………………………
Figure 20. Trend of the fertilization of wheat…………………………………………………………...
Figure 21. Trend of the yield (promedio Kg/ha/year) of wheat…………………………………………
Figure 22. Ownership of the land per type of investor…………………………………………………..
Figure 23. Construction of terraces in relation to the ownership of the land……………………………
Figure 24. Technique used to aerate the soil ……………………………………………………………
58
58
58
58
58
59
59
59
59
59
59
59
59
60
60
63
63
64
64
65
65
66
66
67

vi

vii
Acknowledgment
Although it might be more appropriate to write my acknowledgments in Spanish, I choose to write them in English,
because I want everyone to understand how grateful I am for all the following people cited.
Thanks, Pedro for picking me up at the bus station to officially start my adventure in Uruguay. How could I ever
forget your facial expression when you realized that I did not speak Spanish?!? “ahahah…lo siento”. I remember when
I arrived at the E.E.M.A.C. and I settled down in my small old house, the famous “cinco estrellas”. How also could I
forget my amazing house mates?! I remember how shocked you were when I told you that I had no idea how to set up
a proper fire or how to use a gas bottle. This “city girl” has to thank you a lot, Lorena and Maria Jose. Thank you to
Cintia and her “Dulce amor” (telenovela); I made use of your thesis darling and as promised I did not forget to cite
you “Coppola AND PALLADINO!!!”. I can never thank you enough, Christian, to have been such a good friend and
the best Spanish teacher ever. I miss our horse rides and your lessons on sheep breeding. What can I say about you
Daiana?! Thank you for making me part of your family, and for being one of my best friends. Thank you for the
parties and the trips, for all the good times we had together. Thank you for coming to my interviews and driving the
car, looking for fields in the middle of nowhere. Thanks to Hernan whom taught me how to use EROSION 6.0 and to
all of the professors and friends that helped me out during my research. Thanks to Pascal, Sara, Eva and Alessio for
their support from Europe. You might deserve a special thanks Pascal, your patience with me is something quite
unbelievable. Even though my parents thought that I was “going to die” in Uruguay, I want to thank them and add:
“Ve l’ho detto che ce l’avrei fatta”. A special thought to my grandmother who made this trip possible. There are no
words to describe how much you mean to me and how much you always help me.
Finally I would like to thank my supervisor from Wageningen. To learn Spanish was one of my greatest dreams and
you gave me the possibility to achieve it, thank you Aad. Thanks for your supervision and support, for your kindness
and availability. Thanks for your comments and reviews (I know that it has not been easy to read my thesis). Thank
you for understanding my “italian english” and for making me look at the paper from the reader’s perspective.
Lastly, thank you, Uruguay, the country with the most beautiful sky I have ever seen!

viii

ix
List of abbreviation
Soya RR
L.L.C.
P.L.C.
CONEAT
Soya RoundUp Ready
Limited Liability company
Public Limited Company
Comision Nacional de Estudio Agroeconomico de la Tierra

x

1
1 Introduction
In less than fifteen years (2000/2012) international market and
scientific developments changed significantly the agricultural system in
Uruguay. Transgenic soya (soya RR –Roundup Ready-) became the
main summer crop planted in Uruguay (Bravo, et al., 2010), counting
more than 1 000 000 hectares in 2010 (Sawchik, et al., 2012).
Glyphosate-resistant genotypes, sod-seeding, favorable international
prices and foreign investments made of soy crop the “engine” of the
crop rotation plan (Sawchik, et al., 2012; Coppola and Palladino, 2011).
The collapse of the soybean production in China due to the climate
change increased the price of soybeans on the international market
(Blasina and Tardaguila, n.d.). Moreover, the recent economic crisis in
Europe and United States of America promoted the expansion of this
crop in South America (n.d., 2012).
In 2002/2003 new investors (mainly Argentinian) showed up. They led to an increment in value of the land in
Uruguay. The price of the land (U$S 750 per hectare in 2000) passed to be U$S 2500 per hectare in 2007 and this
trend is not stopping (Coppola and Palladino, 2011). In the period 2000-2007, 30% of the Uruguayan agricultural land
has been sold; 50% of the land has been sold to anonymous societies (Universidad Nacional del Litoral, 2010). Bravo,
et al. (2010) claimed that transnational corporations (TNCs) are the main beneficiaries of soybeans production in
Uruguay. Furthermore in 2005/2006 the amount of rental contracts lasting from one to three years increased. Farmers
started preferring to rent the land rather than buy it and landlords are renting the fields for short period of time hoping
for a further increase in the price of the land (Coppola and Palladino, 2011).
The entrance of new investors in the Uruguayan agricultural system is mainly due to the absence of export taxes in
Uruguay and to the diffusion of new technologies such as soya RR and sod-seeding (Prechac, et al., 2010). All these
factors expanded agriculture toward not conventional agricultural areas (Coppola and Palladino, 2011) and led to
practice intensive large-scale agriculture (Prechac, et al., 2010). Indeed more than 35% of the agricultural land has
crop rotation plans with two crops per year (Universidad Nacional del Litoral, 2010). According to Hill and Clerici
(2011) not all the soils characterizing the new agricultural areas are suitable to practice intensive agriculture, which
can lead to soil erosion and loss of soil chemical and physical properties (no data have been found on the extension of
the land not suitable to intensive agricultural practices).
Since 2003 the majority of the farmers quitted their traditional crop rotation plan with pasture to produce grain for
export (Prechac, 2004; Castiglioni, et al., 2008). In this context agriculture changed from being focused on winter
crops toward summer crops with soy as dominant crop type. Summer and winter crops are planted using no-till
farming techniques such as sod-seeding, which can potentially reduce soil erosion (Coppola and Palladino, 2011;
Prechac, 2004). Soil erosion is a major problem in Uruguay since it affects 80% of the agricultural land (Chiappe, et
Figure 1. Uruguayan departments
(EducaSitios, n.d.)

2
al., 2008). According to national data, Chiappe, et al. (2008) claimed that 5 million hectares of agricultural land (on a
total of 16 million hectares) lost their productive capacity because of soil erosion. Inappropriate farming techniques,
overgrazing, monoculture and absence of crop rotation are some of the main causes of soil erosion in the country
(Chiappe, et al., 2008).
The efficiency of the sod-seeding technique to counteract soil erosion depends on the management of the fallow
period and on the crop types in the crop rotation plan. Indeed, essential elements of this farming practice are: the
quantity and quality of the crop residues and the presence of a good winter cover crop (Prechac, 2004). In intensive
agricultural system with soy as main crop, soil is highly exposed to erosion even using sod-seeding as planting
technique. The scarce amount of soy residues at the soil surface do not protect the soil from erosion agents such as the
rainfall (Jorge, et al., 2012). Besides the effects of soybean crop on soil erosion, the diffusion of transgenic crops
affects the biodiversity (Riaboi, 2012). Indeed biological control agents are negatively affected by the extended use of
no-selective agrochemicals (especially insecticides), which are largely used because cheap. As consequence more
resistant and secondary plagues show up on the fields and more toxic agrochemicals have to be applied to the crops
(Castiglioni, et al., 2008).
The study area is located in the southern-west region of Uruguay, which is the most fertile and agricultural productive
of the country (Prechac, et al., 2010; Coppola and Palladino, 2011). Referring to the departments of Soriano, Colonia,
Rio Negro and Paysandú (delimited in red in figure 1), almost 500 000 hectares up to 1 500 000 hectares of
agricultural land have been investigated. It means that the research interested almost one third of the total agricultural
land of the country. Due to the high fertility of the soil, intensive agriculture with soy as main crop is practiced in the
departments mentioned above (Prechac, et al., 2010). The soil has chiefly a clay loam structure and a pH around 7.0
(Ministerio de Agricultura y Pesca, 1979). The study area is hilly and characterized by slopes ranging from 1 to 10
degrees in steepness. Considering that the country is characterized by irregular rainfall and that in winter rains more
than in summer, the average rainfall is 1000 mm per year (Gimenez, et al., 2009).
The purpose of this research was initially to analyze the expected impact of continued expansion of intensive
agriculture on soil erosion in the occidental area of Uruguay. Nonetheless the main research question changed once in
the study area due to the high presence of foreign investors within the agricultural sector. Thus this study aims to
answer the following research question:
“What is the land management style of local and foreign farmers in the western area of Uruguay and how can the
differing land management style be related to the soil erosion rates occurring on agricultural lands?”
Three sub-questions help to answer the main research question:
1. Which are the main characteristics of the actual agricultural system used by local and foreign farmers in
western Uruguay?
Background information on the development of agriculture in Uruguay are reported in chapter 3. Moreover in the
same chapter the main reasons of the presence of foreigners within the agricultural sector are pointed out and the main
elements characterizing the actual agricultural system (soya RR, fallow period and crop rotation plan) are analyzed
3
according to data provided by the farmers interviewed. The legislation on the management of the agricultural land is
discussed in chapter 4.
2. Which differences in soil loss rates can be observed in the study area for local and foreign farming systems
respectively?
The main elements involved in the loss of soil in the study area (sod-seeding, stubbles and cover crops) are discussed
in chapter 5. Actual and future soil erosion rates (simulated with the software Erosion 6.0) are presented and analyzed
making a distinction between owned and rented fields in sub-chapter 5.3. The soil erosion rates are also related to the
nationality of the farmers, the choice of the crops and the crop rotation plan.
3. To what extent can differences in soil loss rates be explained by differences in local and foreign farming
systems in the study area?
The measures against soil erosion taken nowadays by the farmers interviewed are discussed in chapter 6. This chapter
also offers an overview of the mitigation measures that farmers are willing to take in the near future. During the
analysis a distinction is made between:
- foreign and local farmers;
- owned and rented fields;
- individual farmers (called “private farmers”) and anonymous societies.
If there are appreciable differences in the land management style between local and foreign “private” farmers and
between local and foreign anonymous societies, these are pointed out within the analysis.
Threats, theories coming from common knowledge and farmers opinions are reported in chapter 7. Chapter 8 resumes
the conclusions of the study at hand and chapter 9 provide recommendations and ideas for future researches on the
topic.
2 Materials and methods
This chapter explains the materials and method(s) used to address the main research question. Firstly a literature
research on the development of the agriculture in Uruguay was done underlining the key elements of the actual
agricultural system (soya RR and sod-seeding). Moreover it was researched on the reasons of the presence of foreign
investors in the agricultural sector and the principal causes of soil erosion in the study area. Whereupon a
questionnaire was designed to interview the thirty farmers selected. Even though the interviews have been done in
Spanish, the English version of the questionnaire is available in Appendix 1. Fifteen local and fifteen foreign farmers
have been selected on the base of the “nationality” of the financial capital with which they started to run their
business. It means that even though some foreign farmers recognized themselves as locals (especially foreign
anonymous societies), they have been classified as foreigners because the financial capital with which their business
started comes from abroad. The basic requirement to be interviewed was to manage not less than 500 hectares of land
within the study area. Defining the minimum size of the farms allows to exclude from the study small farmers and to
collect comparable data.
4
Among local farmers twelve private farmers and three anonymous societies have been interviewed. Among foreign
farmers six private farmers and nine anonymous societies have been interviewed. Even though the majority of the land
managed by the foreigners interviewed belonged to Argentinian investors, some of the landlords were Brazilians,
British and Germans. Moreover there were investors from the United States and from Spain. The term “private
farmers” refers to individual investors managing the land as L.L.C. (limited liability company) or in general
partnership. The term “anonymous societies” refers to P.L.C. (public limited company) whose shares are freely sold
and traded to the public. In order to extend the representativeness of the research, four “technical advisory offices”
have been interviewed as well. The purpose of a “technical advisory office” is to support farmer’s decisions (i.e.
amount and type of fertilizers and agrochemicals to use). In such an office agricultural engineers, veterinary and others
professionals work to manage at the best the land of their clients. Their main goal is to preserve the productive
capacity of the soil while getting high yields. According to that, experts look at the growth stage of the plants, the
presence of crop diseases and the quality of the soil. Furthermore they help farmers to define the crop rotation plan.
Such offices are also used by landlords that are not farmers or that live abroad; in this case the office is entirely
committed to manage the fields. By interviewing them I got information on the land management style of several
farmers at the same time, always making a distinction between foreign and local farmers. According to the data
provided, each technical advisory office has been classified as “local private farmer” and/or “foreign private farmer”.
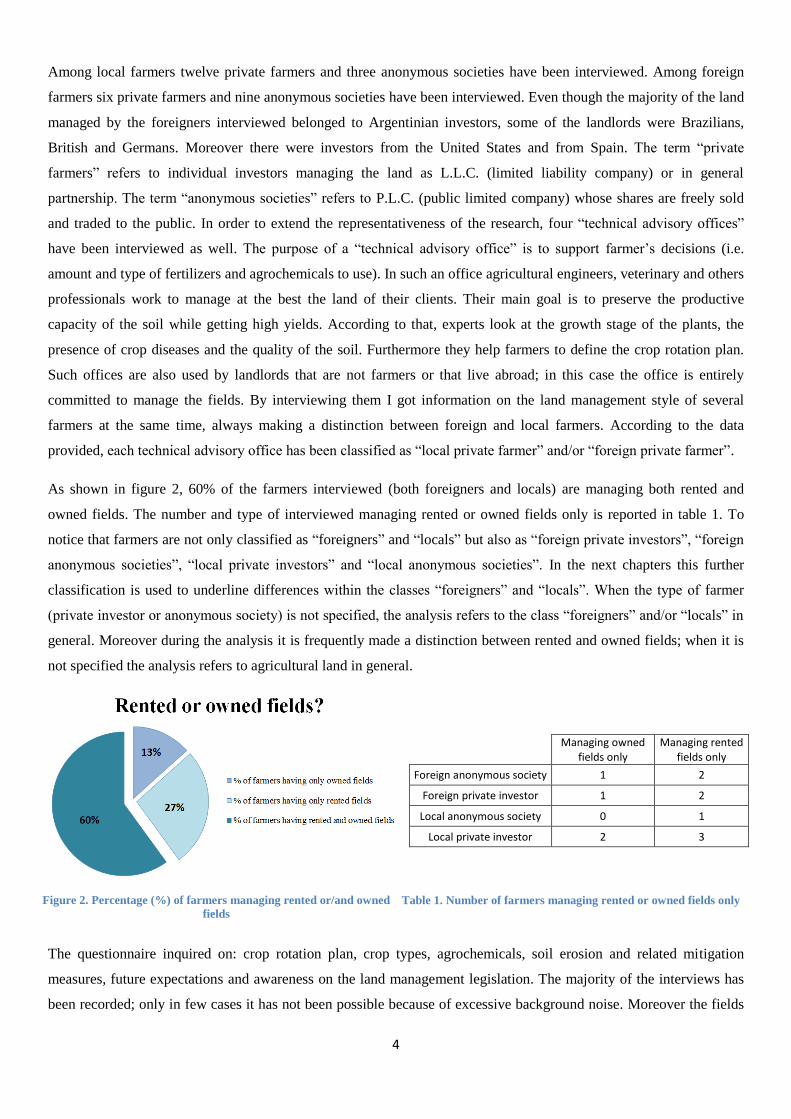
As shown in figure 2, 60% of the farmers interviewed (both foreigners and locals) are managing both rented and
owned fields. The number and type of interviewed managing rented or owned fields only is reported in table 1. To
notice that farmers are not only classified as “foreigners” and “locals” but also as “foreign private investors”, “foreign
anonymous societies”, “local private investors” and “local anonymous societies”. In the next chapters this further
classification is used to underline differences within the classes “foreigners” and “locals”. When the type of farmer
(private investor or anonymous society) is not specified, the analysis refers to the class “foreigners” and/or “locals” in
general. Moreover during the analysis it is frequently made a distinction between rented and owned fields; when it is
not specified the analysis refers to agricultural land in general.
Managing owned
fields only Managing rented
fields only
Foreign anonymous society 1 2
Foreign private investor 1 2
Local anonymous society 0 1
Local private investor 2 3
Table 1. Number of farmers managing rented or owned fields only
The questionnaire inquired on: crop rotation plan, crop types, agrochemicals, soil erosion and related mitigation
measures, future expectations and awareness on the land management legislation. The majority of the interviews has
been recorded; only in few cases it has not been possible because of excessive background noise. Moreover the fields
Figure 2. Percentage (%) of farmers managing rented or/and owned
fields
5
have been visited to check on reliability of the information provided by farmers and to get an insight of the soil
erosion occurring in the study area. The data collected have been processed using the program Excel. Data on type and
amount of agrochemicals used on the fields refer to soy and wheat crops, which are the main summer and winter crops
in Uruguay (Coppola and Palladino, 2011). Talking about agrochemicals, not all the data provided by the farmers have
been processed because some of them were not suitable to do statistical analysis. A list of the agrochemicals used by
the farmers interviewed is available in appendix 4. The appendix also shows the main chemical characteristics of the
agrochemicals reported. To simulate the actual and future soil erosion rate it has been used the software Erosion 6.0.
By “actual” soil erosion rate it is meant the soil erosion caused by the most common crop rotation plans actually done
by the farmers interviewed in the study area. By “future” soil erosion rate it is meant the soil erosion eventually
occurring in the area under study if three “ideal” crop rotation plans are practiced. The ideal crop rotation plans have
been designed to preserve soil quality and productivity while taking into account economic aspects such as the
profitability of the crops.
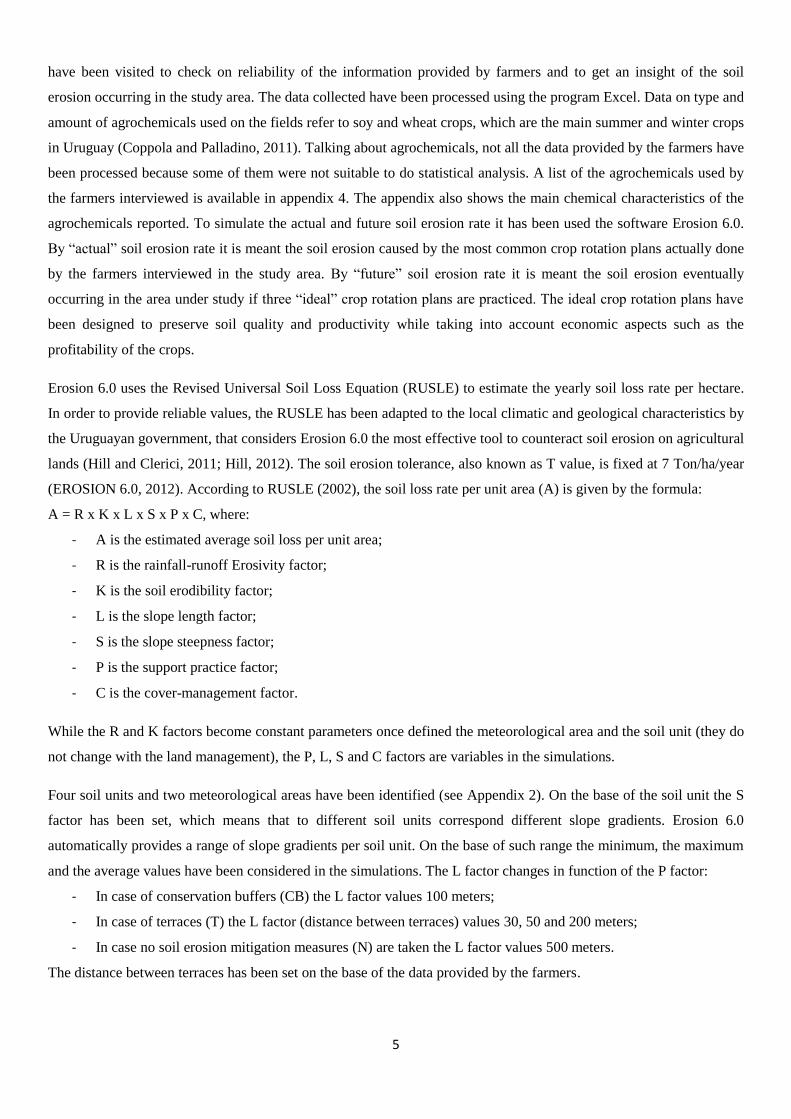
Erosion 6.0 uses the Revised Universal Soil Loss Equation (RUSLE) to estimate the yearly soil loss rate per hectare.
In order to provide reliable values, the RUSLE has been adapted to the local climatic and geological characteristics by
the Uruguayan government, that considers Erosion 6.0 the most effective tool to counteract soil erosion on agricultural
lands (Hill and Clerici, 2011; Hill, 2012). The soil erosion tolerance, also known as T value, is fixed at 7 Ton/ha/year
(EROSION 6.0, 2012). According to RUSLE (2002), the soil loss rate per unit area (A) is given by the formula:
A = R x K x L x S x P x C, where:
- A is the estimated average soil loss per unit area;
- R is the rainfall-runoff Erosivity factor;
- K is the soil erodibility factor;
- L is the slope length factor;
- S is the slope steepness factor;
- P is the support practice factor;
- C is the cover-management factor.
While the R and K factors become constant parameters once defined the meteorological area and the soil unit (they do
not change with the land management), the P, L, S and C factors are variables in the simulations.
Four soil units and two meteorological areas have been identified (see Appendix 2). On the base of the soil unit the S
factor has been set, which means that to different soil units correspond different slope gradients. Erosion 6.0
automatically provides a range of slope gradients per soil unit. On the base of such range the minimum, the maximum
and the average values have been considered in the simulations. The L factor changes in function of the P factor:
- In case of conservation buffers (CB) the L factor values 100 meters;
- In case of terraces (T) the L factor (distance between terraces) values 30, 50 and 200 meters;
- In case no soil erosion mitigation measures (N) are taken the L factor values 500 meters.
The distance between terraces has been set on the base of the data provided by the farmers.

6
Farmers also provided data on the actual crop rotation plans done on rented and owned fields. In this context, seven
crop rotation plans have been selected and simulated (table 2). Four of them are the most frequent crop rotation plans
made by farmers on rented and owned fields. The remaining three are “exceptional” cases (underlined in grey in table
2): two of them are crop rotations with pasture made on owned fields, the last one is a one year crop rotation made on
rented fields only. Moreover three “ideal” crop rotation plans have been designed and simulated (table 6). Since I
wanted to provide feasible solutions to the soil erosion problem by working on parameters that can be “easily”
changed on the field, the future scenarios have been created by changing the C factor only. Actual and future soil
erosion simulations have been done keeping the same settings for the P factor. “Ideal” and “exceptional” crop rotation
plans are considered important to further see the influence of the crop rotation plan on the soil erosion rate.
Crop rotation code Year 1 Year 2 Year 3 Year 4 Year 5 Year 6 Year 7
1 Soya 1 WC / Soya 2 WC/ Maize 2 - - - -
2 Soya 1 WC / Soya 2 WC / Sorghum 2 - - - -
3 WC / Maize 2 WC / Soya 2 - - - - -
4 WC / Soya 2 Soya 1 - - - - -
5 WC / Soya 2 - - - - - -
6 Soya 1 WC / Soya 2 Maize 1 Soya 1 Pasture Pasture Pasture
7 WC / Soya 2 WC / Soya 2 WC / Maize Soya 1 Pasture Pasture Pasture
Table 2. Crop rotation plans simulated
Sod seeding (“siembra directa”) has always been chosen as planting technique (“manejo del suelo”). Nonetheless, to
adjust the “% of soil covered by the residues of the previous crop after have sowed the new crop” value, some winter
crops have been considered sowed using the “reduced ploughing” technique (“laboreo reducido”). The yields of maize
and sorghum have been assessed at a medium level (4.500 Kg/ha). Exceptions and additional details on the simulation
process are available in Appendix 2.
3 Uruguayan agriculture: an overview of its development with a focus on the actual
agricultural system
Uruguay has a relatively short agricultural history. Since 1600 livestock production has been the major agricultural
activity (Universidad Nacional del Litoral, 2010). The European migration, occurred in the middle of the XIX century,
raised the knowledge on agricultural practices among Uruguayan farmers. Agricultural activities were emerging first
in the central-southern region of the country. It was only in 1950 that agriculture started to be practiced in the western
region of Uruguay, which was characterized by soils with high fertility, good physical properties and low soil erosion
rates (Prechac, et al., 2010). Till 2000 conventional tillage has been the principal farming technique, which means that
the soil was plowed every year and that crop residues tended to be buried (Bravo, et al., 2010).
In 1950/60 the modernization and mechanization of the agriculture occurred due to the so called “green revolution”.
Hybridized seeds, agrochemicals and new farming techniques have been introduced into the agricultural system to
increase and simplify crops production. This period is characterized by the diffusion of the monoculture (only one
crop type in the crop rotation plan) and the progressive disappearance of “small farmers” (Bravo, et al., 2010;
7
Universidad Nacional del Litoral, 2010). Problems of crop diseases, soil drainage capacity, soil erosion and
compaction appeared as consequence of the intensive use of agrochemicals, heavy machineries and continuous tillage.
The subsequent “biotech revolution” aimed to solve the environmental and production problems caused by the “green
revolution”. According to that, genetically modified organisms (GMOs) characterized by resistance to diseases and
adverse environmental conditions, tolerance to herbicides, and so on, have been introduced into the agricultural
system. Soya Roundup Ready (soya RR) quickly became the most important crop in the country (Bravo, et al., 2010;
Universidad Nacional del Litoral, 2010; Prechac, et al., 2010). The absence of export taxes led Argentinian investors
to invest on soybean production in Uruguay (Chiappe, et al., 2008). Furthermore the decision of the United States to
expand the area with maize to produce bio-fuel and the collapse of soybeans production in China because of the
climate change, increased the price of soybeans on the international market (Blasina and Taraguila, n.d.)
Since 2003, the diffusion of transgenic soya crops increased the price of the land and renting fields became a common
practice (Universidad Nacional del Litoral, 2010). Prechac, et al. (2010) stated that soya is mainly planted on rented
fields having short-medium terms rental contracts. In the period 2008/9, 65% of the soya crop has been planted on
rented land costing more than U$S 450 per hectare. The high cost of the rent pushed farmers to intensify crop
production, which means to plant two crops per year. Moreover the presence of new investors (mainly foreigners) led
agricultural practices to expand toward not conventional areas (not always suitable to crop production). In this context,
the extension of natural fields decreased (Moron, et al., 2012; Prechac, et al., 2010; Café and Tertulia, 2009). Despite
that, most of the soya is planted in the departments of Soriano, Colonia, Rio Negro and Paysandú, which have the
most fertile soils (Prechac, et al., 2010).
Since 2008 it is possible to talk about “intensive large-scale agriculture” in Uruguay. The percentage of soya fields
having more than 1000 hectares increased from 18% in 2000 to 57% in 2008 (Prechac, et al., 2010). According to
Coppola and Palladino (2011), farmers prefer to rent big fields even though the negotiation on the cost of the rent is
harder. Indeed the bargaining power of “big” landlords is higher than the one of “small” landlords (Coppola and
Palladino, 2011). In the same period livestock breeding has been progressively concentrated in “feedlots” and the
crop rotation plan has been redesigned to be able to grow two crops per year (Moron, et al., 2012; Prechac, et al.,
2010). The diffusion of transgenic crops, the disappearance of pasture in the crop rotation plans and the adoption of
sod-seeding (no-till) as farming technique led agriculture to change from being focused on winter crops toward
summer crops with soy as dominant crop type (this passage is called “vernizacion de la agricultura”) (Prechac, et al,.
2010). According to Saaredra (2011) the surface dedicated to winter crops production was 413 583 hectares in 1908
and 727 338 hectares in 2010. The surface dedicated to summer crops production was 257 113 hectares in 1908 and.
1 004 500 hectares in 2010. Intensive agricultural practices jointly to technological developments in the sector also led
crop yields (kilograms of grain per ha) to increase. The yearly average yield changed from being 445 Kg per hectare in
1908 to 2803 Kg per hectare in 2010 (Saaredra, 2011).
3.1 Foreign investors in the agricultural sector
84% of the study area is managed by foreign investors, the majority of which are anonymous societies (figure 3). Why
foreign investors are so involved in the agricultural sector and which consequences have their presence on Uruguayan

8
economy?
In 1991, the establishment of a Regional Trade Agreement, known
as Mercosur (“Mercado Comun del Sur” or “Southern Common
Market”), promoted “free trade and fluid movement of goods,
people and currency” in South America (IDW, 2012). The first
states to sign the agreement have been Argentina, Brazil, Paraguay
and Uruguay. Since that moment their economic systems became
strictly related each other (IDW, 2012; Rocca, 2002). Moreover, the
progressive elimination of financial and commercial controls
increased the amount of speculative activities within all the
economic sectors. As consequence, in 2001 Uruguay has been
negatively affected by the Brazilian and Argentinian economic crisis
and the majority of the local farmers sold their lands (Rocca, 2002;
Banco Mundial, 2007).
In this period, the low price of the land, the absence of export taxes and the high price of soybeans on the international
market attracted foreign investors in Uruguay. According to Blasina and Tardaguila (n.d.) the production of soybeans
is the main reason of the presence of foreigners in the country. By investing on soya production, foreign investors
helped Uruguay to get out the economic crisis. Indeed the agricultural sector, through the production and exportation
of meat, rice, sunflower and soya, has been essential for the restoration of the Uruguayan economy (IICA, 2004).
Nonetheless World Bank (2013) stated that the agricultural production needs to be diversified in order to lower the
economic vulnerability of the country.
In summary, foreign investors were attracted to the country by the possibilities to produce soybeans and started a
widespread distribution of soy production in the agricultural areas. The main consequence of the diffused production
of soybeans was the increase in price of the land. Moreover agricultural practices expanded toward not conventional
areas (Chiappe, et al., 2008; Blasina and Tardaguila, n.d.; Prechac, et al., 2010). According to Chiappe, et al. (2008)
foreign investors are mainly coming from Argentine, Brazil, Europe and United States. Nonetheless Argentinians and
Brazilians are the most involved in soybean production, as testified by the high percentage of big Argentinian
companies in the country (Ernst, 2004). To support this statement, only a few of the foreigners interviewed were not
Argentinian and/or anonymous societies.
Since 2000 the percentage of agricultural land owned by foreign investors increased from 10% to 30% by 2007. Since
50% of the land was bought by anonymous societies, it is difficult to identify the nationality of the buyers (Chiappe, et
al., 2008; Universidad Nacional del Litoral, 2010). Nonetheless Chiappe, et al. (2008) stated that they were most likely
foreigners, as supported by the increased presence of transnational corporations in Uruguay. Furthermore Argentinian
investors managed 100 000 hectares of soya fields in 2003-2004, it means 40% of the total area dedicated to soya crop
farming (Chiappe, et al., 2008). One of the most important threats related to foreign investments in agriculture is that
Figure 3. Percentage (%) of the study area managed by
the different types of investors

9
land management decisions are taken from outside the country, most likely by people that have never seen the fields
(Café and Tertulia, 2009).
3.2 Soya RR, fallow period and crop rotation: environmental issues
In order to analyze the soil erosion processes affecting the study area, background information on the key elements of
the actual agricultural system are required. This sub-chapter will focus on: crop rotation plan, fallow period, soya RR
and sod-seeding as no-till practice. According to Prechac, et al. (2010) it is the bad combination of these elements that
lead to soil erosion.
The fallow period (in Spanish “barbecho”) can be “green” (“barbecho verde”) or “chemical” (“barbecho quimico”). It
lasts from the death of a crop (harvesting time) until the seeding of the new crop. During this time crop residues
decompose, soil get unpacked and nutrients and water are stored into the soil (Ernst, et al., 2004). Figure 4 shows the
main physical and chemical processes occurring into the soil during this period. The “barbecho verde” occurs when
the plant is left decompose naturally after harvesting and usually characterized crop rotation plans having one crop per
year only. The “barbecho quimico” occurs when a broad-spectrum herbicide, such as glyphosate, is applied to the
plant after harvesting. In this case the fallow period is shortened and two crops per year can be grown using no-till
techniques (i.e. sod-seeding) (Coppola and Palladino, 2011).
The number of crops within the crop rotation plan affects the length of the fallow period, which is longer if only one
crop per year is planted (Ernst and Siri, 2008). Summer crops such as soya and maize can be classified in crops “de
primera” and crops “de segunda”. Crops “de primera” characterize crop rotation plans having one crop per year only.
Crops “de segunda” characterize crop rotation plans having two crops per year. The yield of a crop “de primera” is
usually higher than the yield of a crop “de segunda”. This is mainly due to the fact that a crop “de primera” is grown
under the best agricultural conditions (time of sowing, availability of nutrients and water, etc.). Crops “de segunda”
Figure 4. Fallow period (Ernst and Siri, 2008)

10
come after winter crops (i.e. wheat and barley), the seeding is usually rushed and nutrients and water deficiencies can
occur. Figure 5 shows the growing, seeding and harvesting periods of the main winter and summer crops in Uruguay.
A distinction is made between soya de primera and soya de segunda.
Figure 5. Seeding and harvesting periods for soya “de primera”, soya “de segunda” and wheat
Too short or too large fallow periods affect soil quality. On one hand fallow periods lasting more than 150 days leave
the soil bare, which is exposed to soil erosion agents (i.e. rainfall). Long lasting fallow periods are typical of crop
rotation plans having one crop per year. In such a situation the presence of crop residues (in Spanish “rastrojo”) and
winter cover crops are essential to protect the soil against soil erosion (Ernst and Siri, 2008; Sawchik, et al., 1012).
Since the quantity of “rastrojo” left on soil surface by soya is limited, planting soya enhances the risk of soil erosion,
especially in case of soya “de primera”. Moreover it decomposes quickly leaving the soil bare (Bravo, et al., 2010; Al-
Kaisi, et al., 2004). On the other hand short fallow periods do not allow the soil to store the water necessary to
guarantee a good soil moisture to the next crop. In this way crops are highly dependent by the weather (Ernst and Siri,
2008). This is a problem considering that Uruguay is affected by climate change (higher temperature, frequent
11
extreme events and change in precipitation rate and frequency) and that its weather is characterized by irregular
rainfall events. Even though the government is promoting the adoption of irrigation systems on agricultural lands to
minimize the “agro-climatic risk”, the majority of the fields are not irrigated in Uruguay (Gimenez, et al., 2009;
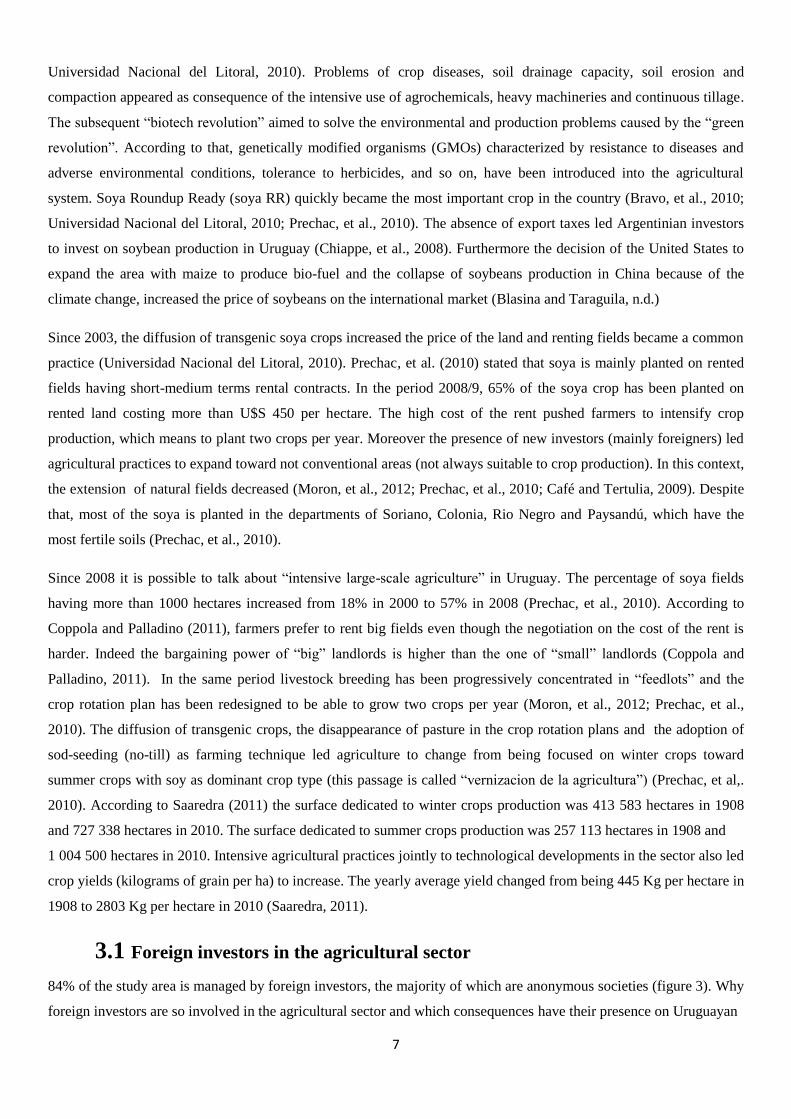
MGAP, 2012). Despite the majority of the interviewees are planning to install irrigation systems on the fields,
nowadays only 40% of them are irrigating the fields (figure 6). Attention: this percentage is influenced by the
production of rice in the study area. Even though to install an irrigation system is expensive, the major part of the
fields irrigated belongs to foreign investors (in particular anonymous societies) managing rented fields (figure 7).
Sprinkler irrigation with center pivots is the main irrigation technique used on the fields. “Represas” (small artificial
lakes) supply with water the irrigation systems.
Figure 7. Ownership of the land in the study area
Figure 6. Use of irrigation systems in the study area

12
Sod-seeding and intensive agriculture will not be possible without the existence of transgenic soya crop (soya
Roundup Ready) and the use of the herbicide glyphosate. Glyphosate is a broad-spectrum systemic herbicide that
shorten the fallow period and allows to plant two crops per year. Soya RR has been specifically developed to survive
to the herbicide glyphosate and to be planted using the sod-seeding technique (Chiappe, et al., 2008). According to
Bravo, et al. (2010) transgenic soya was supposed to:
- Reduce soil erosion;
- Improve soil physical (structure) and chemical (fertility) characteristics;
- Reduce the use of toxic agrochemicals such as 2,4-D, 2,4-DB, atrazine, metsulfuron-metyl and paraquat;
- Have two crops per year within the crop rotation plan;
- Expand the agriculture toward not conventional agricultural areas;
- Increase crop yield.
Nonetheless it did not reduce the amount of agrochemicals used on the field. Moreover transgenic crops in general can
affect biodiversity and become invasive species or weeds if their introduction in the ecosystem is not kept under
control (Prechac, et al., 2010).
Besides the introduction of soya RR, the progressive
exclusion of pasture from the crop rotation plan and the
adoption of no-till practices deeply changed Uruguayan
agriculture. The traditional crop rotation plan lasted six years
and counted of three years of pasture and three years in which
profitable crops were sown. Fields were plowed in order to
control plant diseases, maintain soil unpacked and increase
soil fertility (by tilling crops residues are incorporated into
the soil). The main crop was wheat and the fallow period
lasted five-six months (Ernst and Siri, 2008). Nowadays the
majority of the crop rotation plans lasts three years and the
main crops are soya and wheat (figure 8 and 9). To notice
that 13,3% of the interviewed declared to prefer planting
soya on rented rather than on owned fields. Additionally
51,3% of the soya grown in the study area is soya “de
primera”, which means that soya is the only crop planted in
the year in the majority of the fields. Data show that crop
rotation plans starting with soya “de primera” are 55,6% on
rented fields and 47,6% on owned fields.
In case of rented fields the duration of the crop rotation plan
can be related to the length of the rental contract. Even
though the majority of the rental contracts lasts from two to
Figure 8. Duration of the crop rotation in the study area
Figure 9. Percentage (%) of the study area occupied by the
different crop types

13
three years, 23% of the rental contracts signed by the interviewed last from six months to one year and only 12% of
them lasts from five to ten years (figure 10). By the analysis of the data collected it is possible to state that anonymous
societies get better rental contracts than private farmers. In particular, local anonymous societies show the highest
percentage of rental contracts lasting more than five years. The causes of this trend have not been investigated,
nonetheless it is possible that the size of the company and its stability on the market play a role during the negotiation
with the landlord. Both local and foreign private investors show a high percentage of contracts lasting from six months
to one year, which does not allow them to set up proper crop rotation plans.
Al-Kaisi, et al., (2009, p.1) stated that no-till practices are useful to counteract soil erosion especially on highly
erodible land because “the entire residue from the previous crop remains on the soil’s surface to protect it from soil
erosion”. Even though sod-seeding reduces the soil erosion rate, by practicing intensive agriculture it leads to a higher
incidence of crop diseases (Bravo, et al., 2010; Café and Tertulia, 2009). In this context a high amount of herbicides
and insecticides are applied to the crops. This trend led weeds and insects to develop resistance, with the consequence
that even higher amounts of toxic agrochemicals are used on the field (among these there is the insecticide endosulfan)
(Bravo, et al., 2010). Besides environmental pollution and loss of biodiversity, Chiappe, et al., (2008) stated that sod-
seeding also lead to soil compaction.
4 Land management: legislative framework
Since 1981 the Uruguayan government is trying to preserve soil and water resources through the promulgation of land
management laws. No-till practices, respect of the natural drainage systems and contour farming started to be
promoted on the field. Nevertheless the absence of an adequate control system compromised the efficiency of these
laws. The expansion of agriculture toward not conventional areas and the practice of intensive agriculture led the
RENARE (the governmental office responsible for the management of the natural renewable resources) to take
Figure 10. Length of the rental contract and its relationship with the investor type

14
additional measures to preserve agricultural lands from soil erosion (Hill and Clerici, 2011; RENARE, 2012). The
most recent law on land management is the N°18.564 of 2009. According to RENARE (2012) this law states that:
- The responsible for the management of the land is the landlord (even in case of rented fields);
- Each landlord has to present a land management plan (“Plan de uso y manejo del suelo”) to the Ministry of
Agriculture (“Ministerio de Ganaderia, Agricultura y Pesca”). The plan has to be signed by an agricultural
engineer and the soil loss rate has to be lower than 7 Ton/ha/year (soil erosion tolerance). The software
Erosion 6.0 (RUSLE) should be used to estimate the soil erosion rate;
- Who does not respect the law is subjected to sanctions. There are two kinds of sanctions: the payment of a fine
and the suspension of the license to practice agriculture.
Even though the legislation has been improved since 1981, it is still characterized by weaknesses that can compromise
its efficacy. The main critics to the law N°18.564/09 are:
- the actual cartography is not good enough to develop land use plans at small scale (field level) (Hill and
Clerici, 2011);
- the soil loss rate is the only parameter considered to approve the land use plans. The government does not
consider qualitative parameters to estimate soil quality. For instance, the C/N balance (fundamental to
determine soil fertility) is not taken in consideration;
- great importance is given to the crop rotation plan;
- the USLE/RUSLE is the only tool used to estimate soil loss (Moron, n.d.).
Furthermore Moron (2012) claimed that it is not clear how the government is going to check on the application of the
law.
Uruguayan land use choices are based on land productivity. Since the ‘60s land productivity is measured by the
CONEAT index, named as the office that developed it (Comision Nacional de Estudio Agroeconomico de la Tierra).
Even though the value of the index corresponds to the quantity of meat and wool producible on a specific plot, it has
been proved that such a value also reflects the suitability of the land to grow crops (Lanfranco and Sapriza, 2011).
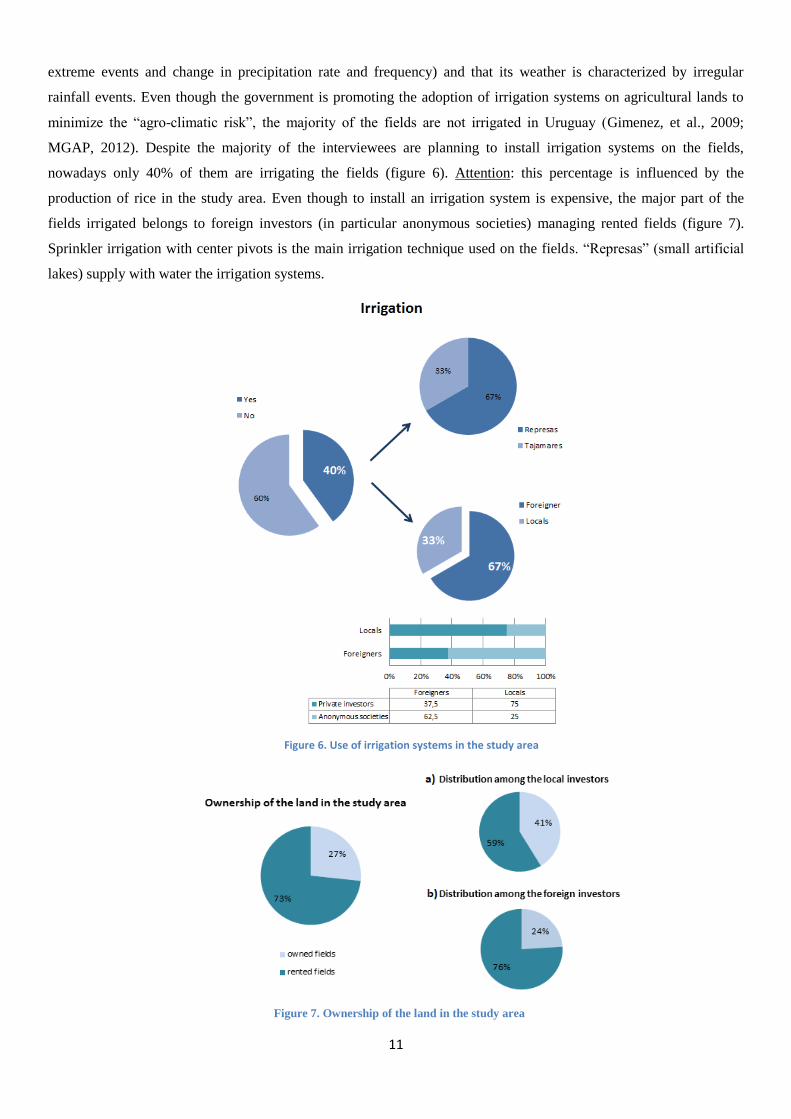
Only fields having a CONEAT index value higher than 120 are suitable for agriculture, see figure 11 (Uruguay lands,
n.d.). The CONEAT index is also related to the price of the land: higher the value of the index, higher the price of the
land (Moron, 2012).
Moron (2012) stated that the CONEAT index is not dynamic (its value never changed) and nowadays it does not
represent the real production capacity of the land. According to that, fields characterized by high CONEAT values in
the ‘60s and overexploited over time are still sold and/or rented as highly productive fields. This situation mostly
affects rented fields, which keep on being overexploited in order to get high yields and pay the rent. Moreover the
actual system does not stimulate farmers to invest in soil conservation practices and measures. Indeed farmers
investing in soil conservation and enhancing soil productivity still have fields characterized by low CONEAT index
values.
15
.
In order to improve the CONEAT index, Moron (2012) suggested multiplying its value for a “land use and
management” factor (in Spanish “factor de uso y manejo del suelo”). Besides land management choices (i.e. crop
rotation plan and support practices), this factor would also consider soil fertility parameters (i.e. organic carbon,
nitrogen) allowing to update the value of the index on the field. Expensive and inefficient control mechanisms will be
avoided thanks to the relationship existing between the CONEAT index and the price of the land. The economic
market itself will take care of soil conservation by awarding good land management styles and farmers will be
stimulated to preserve soil quality. Despite that, the suggestion of Moron has not been taken into account by the
Uruguayan government yet.
Since 2000 Uruguay is facing several issues mainly related to environmental quality and land ownership. The strong
presence of anonymous societies in the country and the amount of land they own, worried the Uruguayan government.
In 2006 a law established that only natural persons or anonymous societies with well-defined shareholders are allowed
to own land in Uruguay (Universidad Nacional del Litoral, 2010). In 1996 soya resistant to glyphosate (soya GTS 40-
3-2) started to be planted in the country. The fast diffusion of genetically modified organisms (GMOs) led the
Uruguayan government to increase the number of controls on the field in order to preserve the environment and the
Ü
Figure 11. CONEAT map (RENARE, 2008)
16
biodiversity. Moreover in 2001 Uruguay signed the Cartagena Protocol, an international agreement on biosafety
(Prechac, et al., 2010). Bravo, et al. (2010) claimed that the representatives of the signatory countries within the
Cartagena Protocol do not take into consideration social and environmental issues related to the diffusion of GMOs in
their own countries. Furthermore they do not consider that soya crop mostly enrich foreign investors rather than local
farmers.
Since soya Roundup Ready became the most
important summer crop in Uruguay, high amounts of
glyphosate and other toxic substances (i.e.
chlorpyrifos and 2,4-D) have been used on the field
(Bravo, et al., 2010). Chiappe, et al., (2008) claimed
that the import of agrochemicals and fertilizers for
the period 1997 to 2005 increased by 350%. This
trend led Uruguay to promulgate several national
laws in order to limit the risk of environmental
pollution. According to Coppola and Palladino
(2011), in 2010 the Uruguayan government further
improved the laws on the commercialization and use
of agrochemicals. Restrictions to the use of many
agrochemicals (i.e. endosulfan and fipronil) have
been introduced and limitations have been set to
spread the agrochemicals by plane and mosquito
(Modernel, 2009). Even though the country
committed itself internationally signing the
Stockholm Convention (in 2001) and the Rotterdam
Convention (in 2003), 43 agrochemicals worldwide
forbidden are still commercialized in Uruguay
(Stockholm Convention, 2008; Rotterdam
Convention, 2010; Chiappe, et al., 2008).
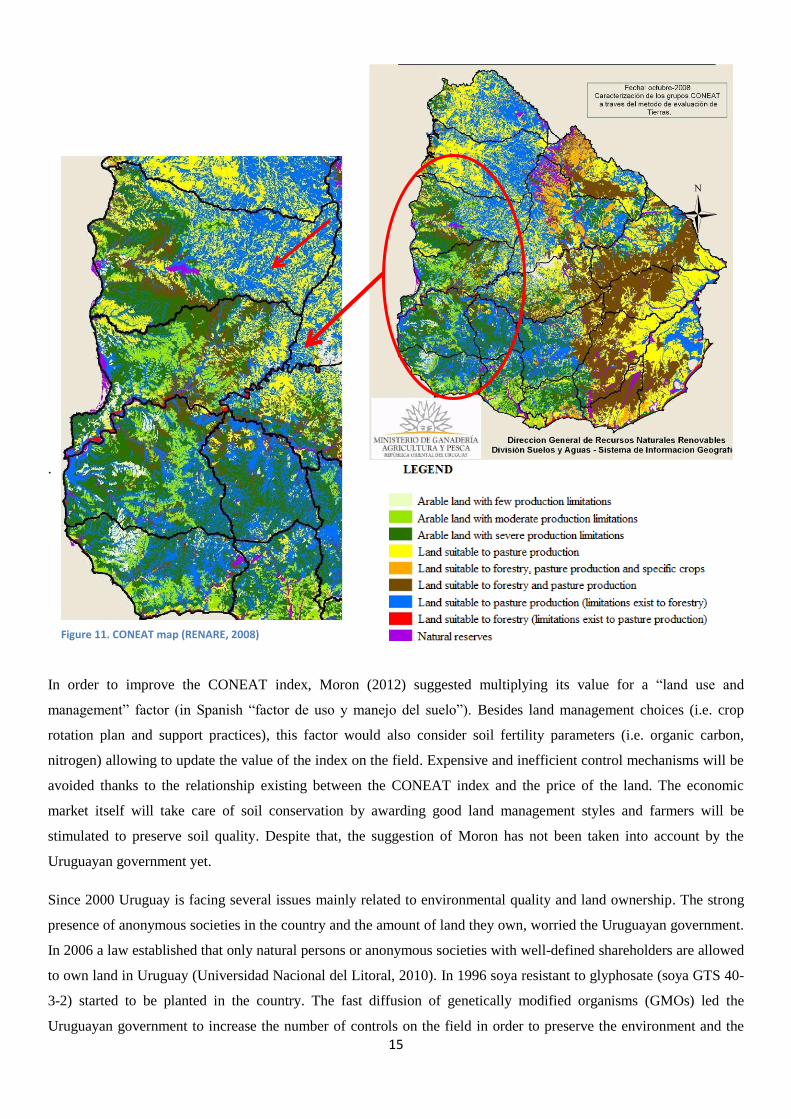
Chemical analysis are fundamental to determine the type and amount of fertilizer to apply to the crops. The
application of pesticides, insecticides and fungicides depends on the type of disease affecting the plants. Nonetheless
Chiappe, et al. (2008) stated that agrochemicals are overdosed and applied too often in Uruguay. As shown in figure
12, the majority of the farmers interviewed (97%) does soil chemical analysis mainly focusing on the amount of
phosphorus, nitrogen and potassium within the soil. The most important results coming from the analysis of figure 16-
21 in Appendix 5 are that potassium started to be applied on soya and wheat crops since 2004/2005 and that despite
the increased amount of inputs, the yield of soy and wheat reached a stable level. Acidification of the soil was
perceived by 47% of the farmers, proving that intensive agricultural practices are affecting soil quality. Amongst
farmers declaring a change in the pH, 36,4% of them are not measuring it.
Figure 12. Soil chemical analysis

17
Other issues regard the length of the rental contract and the design of the crop rotation plans on rented fields.
Especially foreign anonymous societies (77,8%), which are the main investors on rented fields (see figure 22 in
Appendix 5), are hoping in an improvement of the legislation on the rent followed by local anonymous societies
(33,3%), private local investors (33,3%) and foreign local investors (16,7%). Investments on irrigation systems, well
designed crop rotation plans and expensive mitigation measures against soil erosion (i.e. terraces) are made possible
by improving the legal framework.
5 Soil erosion
Soil vertical profile counts of three parts: topsoil (A-horizon), subsoil (B-horizon) and parental material (C-horizon).
The topsoil is the most superficial horizon and the most exposed to erosive agents (Al-Kaisi, et al., 2002). Soil erosion
is the process by which soil particles are removed from their original location and then transported and deposited in a
different place (Prechac, et al., 2010). Even though there are several kinds of soil erosion, Al-Kaisi (2000) stated that
sheet and rill erosion are the main responsible of sediment production. According to Prechac, et al. (2010) by
counteracting particles detachment and limiting particles transportation, it is possible to reduce soil erosion and avoid
off-site effects such as waterways pollution, eutrophication and silting of reservoirs.
Under normal conditions soil erosion is “a natural process occurring over geological timescales” (Thompson, 2007). It
is caused by natural agents such as wind, water, biological activities and temperature changes, nonetheless
anthropogenic activities can speed up this process leading to the loss of soil productivity (Thompson, 2007; Moron,
n.d.). According to Al-Kaisi, et al. (2002) the “topsoil is generally enriched with organic matter and has granular
aggregates that provide larger soil pores, reduce soil density, and enhance water infiltration and aeration”. Because of
that, when the topsoil is eroded lower yields are expected (Al-Kaisi, et al., 2002; Ernst and Siri-Prieto, 2008).
Until the ‘90s Uruguayan soil quality has been affected by the practice of conventional tillage, which was
characterized by high soil loss rates (Prechac, et al., 2010). Even though the adoption of sod seeding techniques
slowed down soil erosion on the field, this process still affects agricultural lands. Nowadays 30% of Uruguay is
affected by soil erosion, which is mainly caused by water erosion, intensive agriculture and monoculture (Moron, n.d.;
Chiappe, et al., 2008). Looking at agricultural land only (16 million hectares), 80% of the area has been affected by
erosion and 5 million hectares lost their productive capacity completely (Chiappe, et al., 2008). According to Prechac,
et al. (2010) to practice monoculture with soya is not sustainable because soil erosion is fostered and the amount of
organic matter within the soil is lowered. This statement is supported by data shown in figure 13, which represent
farmers’ point of view. Farmers have been asked to answer some questions about the thickness of the topsoil and the
presence of gullies within their fields. By asking the farmers to date the occurrence of gullies and the reduction in
thickness of the topsoil, it has been possible to estimate the trend of these erosive processes over time. While gullies
were most likely to occur under conventional agriculture, the thickness of the topsoil reduced since soya became the
main summer crop. Looking at figure 13 it is important to keep in mind that it was almost impossible to date the
occurrence of these erosive processes on rented fields because the tenant changes often. Moreover data are strictly
related to the respondent and to the year he started to manage the fields. These and more aspects of the research are
further discussed in chapter 7.

18
Figure 13. Trend of some soil erosion features
By managing some of the factors involved in the loss of soil, soil erosion can be controlled. For instance the soil
erosion rate is higher in presence of slopes and bare soil. Under these conditions raindrops can detach and splash soil
particles between 90 and 150 cm away (Al-Kaisi, 2000). After have described some of the main factors able to reduce
or foster soil erosion in the study area, the actual and future soil erosion rates will be analyzed in the last sub-chapter.
5.1 Sod seeding, stubbles and cover crops
Different farming techniques lead to different soil erosion rates. Taking as reference value the soil erosion rate related
to the practice of conventional agriculture (the most environmental damaging agricultural technique), Ernst and Siri-
Prieto (2008) stated that:
- the practice of conventional agriculture including a period of pasture within the crop rotation plan decreases
the soil erosion rate by 18%;
- no-till practices with the removal of the stubbles decrease the soil erosion rate by 22%;
- no-till practices characterized by keeping the stubbles on the soil surface or having cover crops within the crop
rotation plan, decrease the soil erosion rate by 97%.
Besides the reduction of the soil erosion rate, Al-Kaisi, et al. (2008) claimed that the adoption of no-till practices
preserves soil natural fertility by limiting the loss of organic matter. Indeed “in a no-tillage system, residue can
decompose slowly and release nutrients more efficiently into the soil system for crop use” (Al-Kaisi, et al., 2006). It
has been demonstrated that to reduce the loss of organic matter, the presence of pasture in the crop rotation plan is not
as crucial as the practice of sod seeding. Nonetheless better results can be obtained by combining no-till practices with
crop rotation plans having periods of pasture. Moreover, sod-seeding is more effective in counteracting soil erosion
only if crop residues are kept on the soil surface or a cover crop is planted during the fallow period (Ernst and Siri-
Prieto, 2008).

19
The design of the crop rotation plan is fundamental to keep the soil
covered. According to that, Ernst (2004) stated that crop rotation
plans having two crops per year lead to lower soil loss rates than
monoculture systems. Indeed higher amounts of stubbles are left on
the soil surface by planting two crops per year rather than one, see
figure 14. Even though the quantity and quality (time required by the
plant residue to decompose) of the stubbles is critical to protect the
soil from erosive agents, Al-Kaisi and Hanna (2008) stated that even
the finest material has a potential in reducing soil erosion.
Nonetheless soya as monoculture is not sustainable: the quantity and
quality of its residue is poor and decompose fast leaving the soil
bare. Keeping in mind that the Uruguayan government set the soil
loss tolerance at 7ton/ha/year, soya as monoculture leads to a soil
loss of 15ton/ha/year (Ernst, 2004).
Moreover crop residues are efficient counteracting soil erosion,
reducing soil crust formation and surface runoff only if they are well
distributed on the soil surface (Al-Kaisi, et Hanna., 2009; Hanna and
Al-Kaisi, 2009). Surface water runoff can move and concentrate the
stubbles (figure 15). If on one hand, the areas left without protection
(bare soil) are affected by erosive agents, on the other hand areas
characterized by concentrated residues “insulate the soil from the
sun, reduce seed-to-soil contact, and make it tougher to plant in the
spring, inhibiting crop growth” (Al-Kaisi and Hanna, 2008).
Organic matter has physical (i.e. soil aggregation), chemical (i.e. cation exchange capacity) and biological effects (i.e.
microorganisms’ activities) on soil quality, which can be referred to soil fertility (Al-Kaisi, 2008). Since the crop
rotation plan determines the amount of organic matter within the soil, it is also responsible to keep the balance
between inputs and outputs in it, see figure 16.
Figure 16. Inputs and outputs within the soil (Ernst, 2004)
Figure 14. Big amount of stubbles
Figure 15. Stubbles moved by surface runoff

20
If the crop rotation plan is not respected or high nutrient demanding crops are continuously planted, the outputs can
exceed the inputs. The balance can be restored by using crop rotation plans with pasture (Prechac, 2004). The amount
of outputs within the system is influenced by factors such as presence of slopes, weather, soil type and agricultural
practice (Ernst and Siri-Prieto, 2008). Even though the loss of organic carbon is lower in no-till systems compared to
conventional systems practicing tillage, soil erosion causes from 50 to 90% of the loss of organic carbon in
agricultural systems characterized by periods of pasture within the crop rotation plan (Clerici, et al., 2004). The
amount of organic carbon within the soil can be seen as indicator of land use sustainability (Prechac, 2004).
Another useful element to counteract soil erosion, is the inclusion of cover crops in the crop rotation plan. According
to Sawchik, et al. (2012) “while legume cover crops may enrich soil inorganic nitrogen, and reduce nitrogen fertilizer
needs for subsequent crops, no legume cover crops may also be effective in maintaining or increasing soil organic
matter”. Grasses as cover crops are not commonly used in Uruguay. Even though cover crops increase the infiltration
rate and improve soil resistance to water erosion, they are frequently blamed to subtract nutrients and water to the
other cash crops planted (Sawchik, et al., 2012).
5.2 Soil compaction
According to Hanna, et al. (2002) “soil compaction occurs when soil aggregates and particles are compressed into a
smaller volume”. Al-Kaisi and Hanna (2011) stated that soil compaction fosters soil erosion by reducing the
infiltration rate and increasing the surface runoff. Moreover it causes nutrient deficiencies and reduces soil porosity
and aeration (Al-Kaisi, 2010). Since soil structure is damaged and root growth is hampered, soil compaction leads to
lower yields (Al-Kaisi and Hanna, 2011; Al-Kaisi, 2010). Soil compaction is mainly caused by management mistakes,
field traffic and machineries (Hanna, et al., 2002). Al-Kaisi (2010) stated that field operations should be avoided when
soil moisture is near or at field capacity because water works as a lubricant among soil particles. According to Al-
Kaisi and Hanna (2008) soil compaction can be controlled by using “controlled traffic lanes for harvest and avoid
driving loaded grain carts randomly through the field”. Furthermore, machineries having “large tires with lower air
pressure allow for better flotation and reduce the load on the soil surface” (Al-Kaisi, 2010).
Uruguayan farmers are used to spread agrochemicals with mosquitos,
which are heavy machineries characterized by having small tires (see
Appendix 3). The plane is used by 73% of the farmers interviewed
mainly when it is not possible to go into the field with the mosquito.
Even though Moron, et al. (2012) claimed that the mosquito is more
efficient than the plane, it fosters soil erosion. By the analysis of the data
collected, mosquitos are used in average 7,7 times per year on the field.
Since the mosquito works with a GPS system and it is used to pass on
the same track, its footprint must be kept under control in order to avoid
the formation of rills and gullies. Figure 17 shows rills developed on
Figure 17. Rill erosion caused by mosquitos

21
mosquito’s track. Since maize was planted on such a field till the last year, rills caused by mosquito develop quickly.
According to Hanna, et al. (2002), factors such as slow infiltration and ponds of water, high surface runoff, soil
erosion under normal or light rainfall and so on, can indicate soil compaction. Figure 18 shows the soil compaction
trend in the study area, which has been obtained by processing farmers’ opinions. Farmers have been asked to date the
appearance of phenomena such as increased surface runoff and decreased capacity of the soil to retain and infiltrate
water. Data show that since 2006 more and more farmers started to notice soil compaction on their land. Even though
it has not been found literature proving the existence of a relationship between soil compaction and no-till practices,
many farmers stated that soil became more compact since they started to practice sod-seeding.
Figure 18. Soil compaction trend
Since these phenomena evolve slowly over time, farmers had problems to date their appearance on both rented and
owned fields. Moreover it is important to keep in mind that the tenant changes frequently on rented fields and that data
are influenced by the year in which the interviewed started to manage owned fields. These limits are further discussed
in chapter 7.
As shown in figure 19, more than 30% of the farmers interviewed declared to counteract soil compaction by using
machineries such as subsoilers, chisel, excentrica, rastron, paratill and vibrocultor together with landplane (appendix
3). These machineries are also used to counteract soil erosion symptoms (i.e. rills formation) and when new fields are
rented. To support the idea that the practice of sod-seeding only leads to soil compaction, some farmers declared that it
is possible to get higher yields by “plowing” the fields every four-five years. According to these farmers, it is possible
to see the beneficial effects of plowing by comparing their fields and yields with the ones of the neighbors.

22
Figure 19. Machineries used on the field
5.3 Actual and future soil erosion rate in the study area
The soil erosion rate is highly influenced by the soil type and the slope gradient and length (Jorge, et al., 2012). Even
though the simulations on the actual and future soil erosion rates have been done considering four soil types named
“Risso”, “Bequelo”, “Young” and “Canada Nieto” (see appendix 2), the dominant soil in the study area is brunisol
(figure 20). According to the description provided by the Geography Dictionary (2008), brunisol is usually a poor
developed and immature soil associated with forest vegetation. Figure 21 shows the digital elevation model of
Uruguay, which can be useful to get an idea of the topology of the country. The soil unit having the lowest slope
gradient is “Risso” (1-3 degrees), followed by “Young” (2-6 degrees), “Bequelo” (4-8 degrees) and “Canada Nieto”
(4-10 degrees). As conceivable, higher is the gradient of the slope, higher is the soil erosion expected. According to
the results of the simulations, “Canada Nieto” is the soil unit most affected by soil erosion in the study area. Indeed in
areas classified as “Canada Nieto” the soil erosion rate is below the T value only considering slopes having a
steepness of 4 degrees, practicing crop rotation with pasture and without soya “de primera” (i.e. crop rotation 7 in
table 3) and building terraces with a distance of 30 or 50 meters (table 4).

23
Figure 21. Digital elevation model (MGAP, 2013)
Crop rotation code Year 1 Year 2 Year 3 Year 4 Year 5 Year 6 Year 7
(AC) 1 Soya 1 WC / Soya 2 WC/ Maize 2 - - - -
(AC) 2 Soya 1 WC / Soya 2 WC / Sorghum 2 - - - -
(AC) 3 WC / Maize 2 WC / Soya 2 - - - - -
(AC) 4 WC / Soya 2 Soya 1 - - - - -
(AC) 5 WC / Soya 2 - - - - - -
(AC) 6 Soya 1 WC / Soya 2 Maize 1 Soya 1 Pasture Pasture Pasture
(AC) 7 WC / Soya 2 WC / Soya 2 WC / Maize Soya 1 Pasture Pasture Pasture
Table 3. The most common crop rotation plans actually done by the interviewees (the abbreviation “WC” refers to “winter crop”)
CANADA NIETO Gradient 4 Gradient 7 Gradient 10
N CF T30 T50 T200 N CF T30 T50 T200 N CF T30 T50 T200
Crop rotation 1 29 13,9 10 12 19,9 66,8 27,4 17,5 22,1 41,8 119,9 44,7 26,6 34,7 71,1
Crop rotation 2 28,5 13,4 9,6 11,6 19,1 65,6 26,3 16,8 21,3 40,2 117,6 43 25,6 33,3 68,3
Crop rotation 3 19,9 10 7,2 8,6 14,3 45,8 19,7 12,6 15,9 30,1 82,1 32,1 19,1 24,9 51,1
Crop rotation 4 43,8 22,3 16 19,3 31,8 100,9 43,9 28 35,4 67 180,9 71,6 42,6 55,5 113,9
Crop rotation 5 19,6 9,9 7,1 8,5 14,1 45,2 19,4 12,4 15,7 29,6 81 31,7 18,9 24,6 50,4
Crop rotation 6 22,3 11,2 8,1 9,7 16 51,4 22,1 14,1 17,8 33,7 92,1 36 21,5 27,9 57,3
Crop rotation 7 16,6 7,8 5,6 6,8 11,2 38,4 15,4 9,9 12,5 23,6 68,8 25,2 15 19,5 40
Table 4. Simulated actual soil erosion rates (ton/ha/year) in the soil unit "Canada Nieto". N refers to “no mitigation measures”, CF
“conservation buffers”, T30 “terraces having a distance of 30 meters”, T50 “terraces having a distance of 50 meters” and T200
“terraces having a distance of 200 meters”
Figure 20. Soil types in Uruguay (SPI, n.d.)

24
Actual and future soil erosion simulations confirm what is stated by literature so far, see appendix 2. It is possible to
see the influence of the crop rotation plan (also crop type) on the soil erosion rate by looking at the values related to
the application of no mitigation measures (N). Looking at the actual crop rotation plans (table 4), crop rotations having
one or more crops “de primera” (i.e. crop rotations 4 and 6) lead to higher soil erosion rates than crop rotations having
two crops per year. The rate is even higher when soya is the main crop within the crop rotation plan (Clerici, et al.,
2004). Nonetheless, considering the importance to keep the soil covered, the soil erosion rate can be lowered by
planting soya “de segunda” (i.e. crop rotations 5 and 7). Comparing crop rotations 1 and 2, the soil erosion rate seems
to be slightly lower when maize is planted rather than when sorghum is grown. Nonetheless the similarity of the
results leads to conclude that the soil erosion rate does not change preferring maize to sorghum. Since there is no
significant difference in the results coming from crop rotations 3 and 5, the presence of maize within the crop rotation
plan is not considered as important as the fact to keep the soil covered.
Besides the attempt to keep the soil covered, practice sod-seeding and control the traffic on the field, Al-Kaisi, et al.
(2009) claimed that grassed waterways, terraces, conservation buffers and contour farming can also be used as
mitigation measures against soil erosion. According to Al-Kaisi, et al. (2008) these conservation structures “help in
slowing water flow, settling out sediments and directing water away from the field to a suitable outlet”. Based on
national data, Coppola and Palladino (2011) stated that since farmers started to practice sod-seeding, the amount of
conservation buffers decreased in Uruguay. Despite that, many of the farmers interviewed declared to use
conservation buffers as mitigation measure against soil erosion. According to the results of the simulations (tables 11,
12, 13 and 14 in appendix 2), conservation buffers seems to be the best option as long as the slope gradient is lower
than two. When the slope gradient is higher than three, it is preferable to build terraces having a distance of thirty
meters. Since the crop rotation plan only is not sufficient to lower the soil erosion rate, it is always important to cut the
slope; even the construction of terraces having a distance of 200 meters helps counteracting soil erosion.
Looking at table 5, the crop rotation plan leading to the highest amount of soil loss in all the soil units considered is
the number 4 (AC4), which is practiced on rented fields only. Crop rotation 3 leads to the lowest soil erosion rates in
the study area and it is mainly done on owned (25%) rather than on rented (22,2%) fields. Comparing crop rotations 1
and 2, farmers prefer crop rotation 2 on both rented and owned fields. Even though crop rotations 5, 6 and 7 are
exceptional cases not reported in table 5 because not representative of the study area, crop rotation 7 leads to the
lowest soil loss rates among all the crop rotation plans simulated. It is inferable that this is due to the presence of three
years of pasture and three crops “de segunda” out of four summer crops within the crop rotation plan.
Crop
rotation code
Three years crop rotations % of farmers using the crop
rotation plan on
Year 1 Year 2 Year 3 Owned fields Rented fields
(AC) 1 Soya 1 Winter crop / Soya 2 Winter crop / Maize 2 15 30,8
(AC) 2 Soya 1 Winter crop / Soya 2 Winter crop / Sorghum 2 20 30,7
(AC) 3 Winter crop / Maize 2 Winter crop / Soya 2 - 25 22,2
(AC) 4 Winter crop / Soya 2 Soya 1 - 0 22,2
Table 5. Crop rotation plans on rented and owned fields. “AC” refers to “actual crop rotation plan”

25
Comparing the actual soil erosion rates with the ones obtained considering three ideal crop rotation plans (table 6), the
ideal crop rotation plans lead to lower soil loss rates only in comparison to crop rotation 4 and 6. Referring to the soil
unit “Canada Nieto”, table 7 shows the soil erosion rates for the ideal crop rotation plans.
Crop rotation code Year 1 Year 2 Year 3
(IC) 1 Winter crop / sorghum 2 Maize 1 -
(IC) 2 Winter crop / sorghum 2 Soya 1 -
(IC) 3 Winter crop / sorghum 2 Winter crop / soya 2 Maize 1
Table 6. Ideal crop rotation plans (IC)
CANADA NIETO Gradient 4 Gradient 7 Gradient 10
N CF T30 T50 T200 N CF T30 T50 T200 N CF T30 T50 T200
(IC) 1 20,4 10,4 7,5 9 14,9 47 20,5 13,1 16,5 31,3 84,3 33,4 19,9 25,9 53,2
(IC) 2 30,6 14,7 10,6 12,7 21 70,5 29 18,5 23,4 44,3 126,5 47,3 28,2 36,7 75,2
(IC) 3 24,2 12,2 8,7 10,5 17,4 55,7 23,9 15,3 19,3 36,5 99,9 39,1 23,3 30,3 62,1
Table 7: Simulated future soil erosion rate (Ton/ha/year) in the soil unit "Canada Nieto". N refers to “no mitigation measures”, CF
“conservation buffers”, T30 “terraces having a distance of 30 meters”, T50 “terraces having a distance of 50 meters” and T200
“terraces having a distance of 200 meters”. “IC” refers to “ideal crop rotation plan”
In order to simplify the reading of the analysis, the ideal crop rotations will be called “IC” and the actual crop
rotations will be called “AC”. Among the ideal crop rotation plans, IC1 leads to the lowest soil loss rates in the study
area. Since their results are pretty similar, IC1 can be compared to AC3. To notice that both these crop rotation plans
last two years and that AC3 is characterized by two crops “de segunda” (one of them is soy) while IC1 by maize “de
primera”. The similarity in the results can be related to the high amount of stubbles left by the maize “de primera”,
which protect the soil as well as the stubbles left by a winter crop and soy do. Moreover IC1 and IC3 are better than
AC1, AC2 and AC3, while IC2 is better than AC4 only. Comparing IC2 with the other crop rotation plans, it is
possible to see how much the soil erosion rate is influenced by soy “de primera”. Even though IC1 is the best crop
rotation among the ideal ones, it is still worse than AC3.
So far it is possible to state that crop rotation plans leading to high soil loss rates are most likely done on rented fields.
Since 73% of the fields under study are rented, the study area seems to be highly affected by soil erosion problems
(especially when the soil is classified as “Canada Nieto”). In relation to the ownership of the land (figure 9), around
313 500 hectares out of 358 000 hectares of rented fields are managed by foreigners. According to that foreign
investors are eventually fostering soil erosion by doing crop rotations leading to high soil loss rates. Such crop rotation
plans are used to last two-three years and have as main crop soya. Referring to the year 2011/2012, table 8 shows the
percentage of land planted with different crops per type of investor. Even though local farmers planted more soya than
foreign farmers (respectively 75,2% and 54,2 %), 52,27% of the soya planted by foreigners is soya “de primera” while
locals mainly planted soya “de segunda”. Looking at the values and considering that soya, maize and sorghum are
summer crops while wheat and barley are winter crops, it can be assumed that local farmers have mainly done crop
rotation plans with two crops per year while foreign farmers have crop rotation plans with only one crop per year. A
relation may exist between the design of the crop rotation plan, the cost of the rent and the length of the rental
contract.

26
Foreign investors Local farmers
% Soya tot 54,2 75,2
% Soya 1 52,27 47,7
% Soya 2 47,73 52,3
% Wheat 25,3 24,0
% Barley 8,3 32,2
% Maize 7,9 11,8
% Sorghum 7,8 6,7
Anonymous societies Private investors Anonymous societies Private investors
% Soya tot 67,3 31,8 82,2 72,9
% Soya 1 55,8 39,6 46,1 48,3
% Soya 2 44,2 60,4 53,9 51,7
% Wheat 30,7 16,2 24,9 23,8
% Barley 6,0 12,3 19,5 36,3
% Maize 11,1 2,4 10,0 12,4
% Sorghum 5,3 12,0 6,1 6,8
Table 8: Crop distribution in the study area
6 Land management style
Since the study area is affected by soil erosion, it is interesting to see how farmers are dealing with the problem.
According to what is stated by the farmers interviewed, figure 22 shows which mitigation measures are used on the
fields nowadays. It is possible to see that the most commonly adopted measures are the cheapest ones: design of the
crop rotation plan, practice of sod seeding, keep the soil covered (which also means to use a cover crop), contour
farming and respect of the drainage system. Even though foreign farmers are mainly managing rented fields, they are
the ones investing more money in the design of roads (roads running along the fields) and the construction of terraces
and conservation buffers, which are considered expensive. Moreover several foreign anonymous societies are doing
pilot projects while investing in research. They are mainly focusing on precision agriculture, effective microorganisms
and land mapping, which should buffer the negative effects related to the practice of agriculture while reducing
production costs. In particular, precision agriculture provides each plot with the most suitable crop rotation plan by
considering soil types and topographical characteristics of the field.

27
Figure 22. Mitigation measures taken by farmers nowadays

28
Among foreign investors, figure 23 shows that anonymous societies are the most willing to invest in the construction
of terraces and conservation buffers. Moreover they are the only group designing the roads, which form the basis of
the design of the terraces. It can be due to their high availability of financial capital and to the signature of rental
contract lasting minimum 3 years. Referring to figure 5, it is possible to observe that foreign anonymous societies are
the ones getting the highest percentage of rental contracts lasting from five to ten years. When soil moisture conditions
are high, foreign private investors seem to avoid field operations more compared to other groups. Nonetheless the
majority of the farmers declared to get into the fields when the soil is wet only if necessary or to harvest the crops.
Even though the majority of the terraces are built on
owned fields, both local and foreign anonymous societies
are building terraces on rented fields (figure 23 in
appendix 5). The decision whether to build terraces or
not, is not only related to the land tenure and the
availability of funds; several local farmers declared that
they do not construct terraces as they consider them not
efficient in counteracting soil erosion (figure 24). One of
the reasons of this mistrust is that in the past terraces
were built copying Argentinian projects in Uruguay.
Argentinian terraces were efficient counteracting soil
Figure 23. Mitigation measures that present a significant difference in value (at least 20%)
between local and foreign investors
Figure 24. Reasons why farmers are not building terraces

29
erosion in Argentine because they were specifically designed on the characteristics of the country. Since Uruguayan
soil, topology and weather are different from the Argentinian ones, Argentinian terraces built in Uruguay fostered soil
erosion and affected the productivity of some fields. Based on that farmers still doubt on the efficiency of terraces as
mitigation measure against soil erosion. Despite that, nowadays Argentinian investors in Uruguay declared to design
the terraces on the base of the characteristics of the plots. Additionally a high percentage of foreign investors declared
that the low soil erosion rate of some fields do not justify the construction of terraces.
Based on what farmers are actually doing to counteract soil erosion, figure 25 shows what farmers are aiming to do in
the future.
Figure 25. Future mitigation measures
The percentage of farmers aiming to design roads, build terraces and conservation buffers and improve fields
operations by cutting the slope is not high. On one hand foreign anonymous societies are more focused on the design
of roads and on the improvement of field operations, for instance by using more the plane. On the other hand private
investors are interested in building terraces and conservation buffers. Moreover the majority of the farmers are willing
to improve the crop rotation plan by increasing the number of crop types within the crop rotation, include a period of
pasture or a cover crop and planting more maize. Despite that many farmers are using maize to improve soil structure
and counteract soil compaction (figure 24 appendix 5), its importance for the preservation of soil quality is frequently
being discussed. Besides advances in the scientific knowledge, almost all the farmers interviewed are hoping in the
development of new agricultural technologies (GMOs, agrochemicals, farming techniques) which will allow them to
enhance the yields, reduce the costs and protect the environment. Despite some farmers (especially anonymous
societies) is already using the RUSLE formula to estimate the annual soil loss and take land management decisions,
many other farmers are going to use it to make the land use plans required by law.
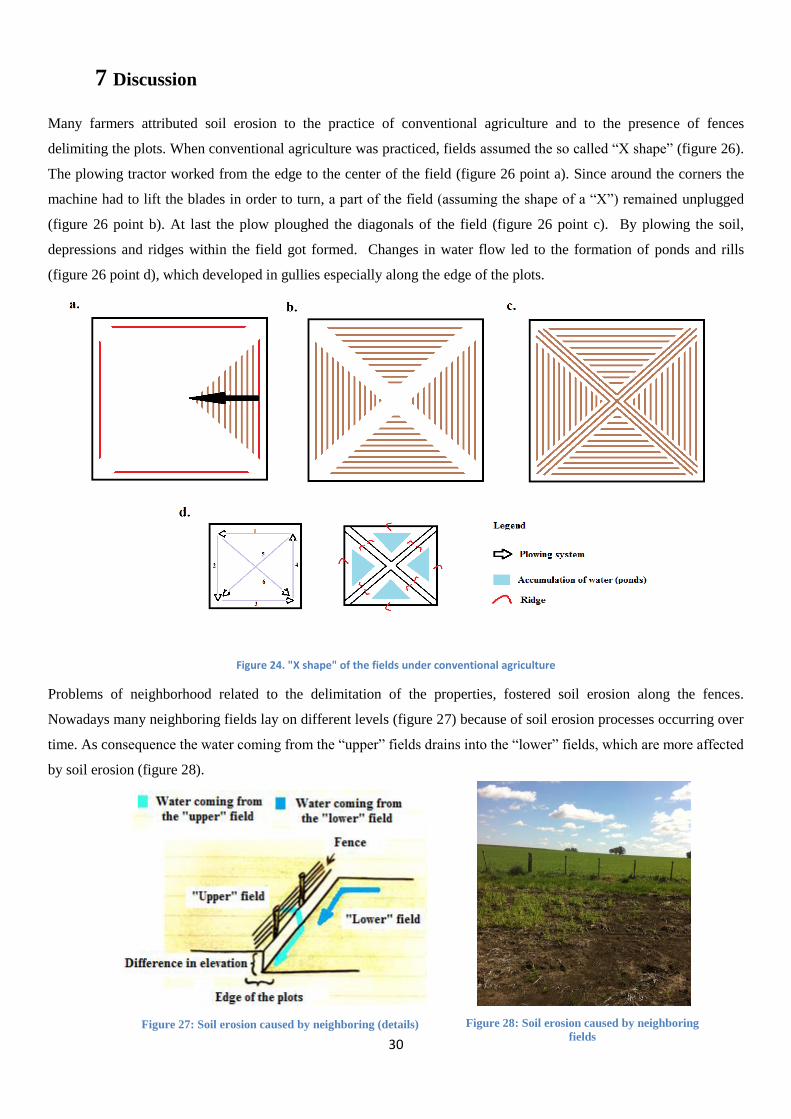
30
7 Discussion
Many farmers attributed soil erosion to the practice of conventional agriculture and to the presence of fences
delimiting the plots. When conventional agriculture was practiced, fields assumed the so called “X shape” (figure 26).
The plowing tractor worked from the edge to the center of the field (figure 26 point a). Since around the corners the
machine had to lift the blades in order to turn, a part of the field (assuming the shape of a “X”) remained unplugged
(figure 26 point b). At last the plow ploughed the diagonals of the field (figure 26 point c). By plowing the soil,
depressions and ridges within the field got formed. Changes in water flow led to the formation of ponds and rills
(figure 26 point d), which developed in gullies especially along the edge of the plots.
Figure 24. "X shape" of the fields under conventional agriculture
Problems of neighborhood related to the delimitation of the properties, fostered soil erosion along the fences.
Nowadays many neighboring fields lay on different levels (figure 27) because of soil erosion processes occurring over
time. As consequence the water coming from the “upper” fields drains into the “lower” fields, which are more affected
by soil erosion (figure 28).
Figure 28: Soil erosion caused by neighboring
fields Figure 27: Soil erosion caused by neighboring (details)
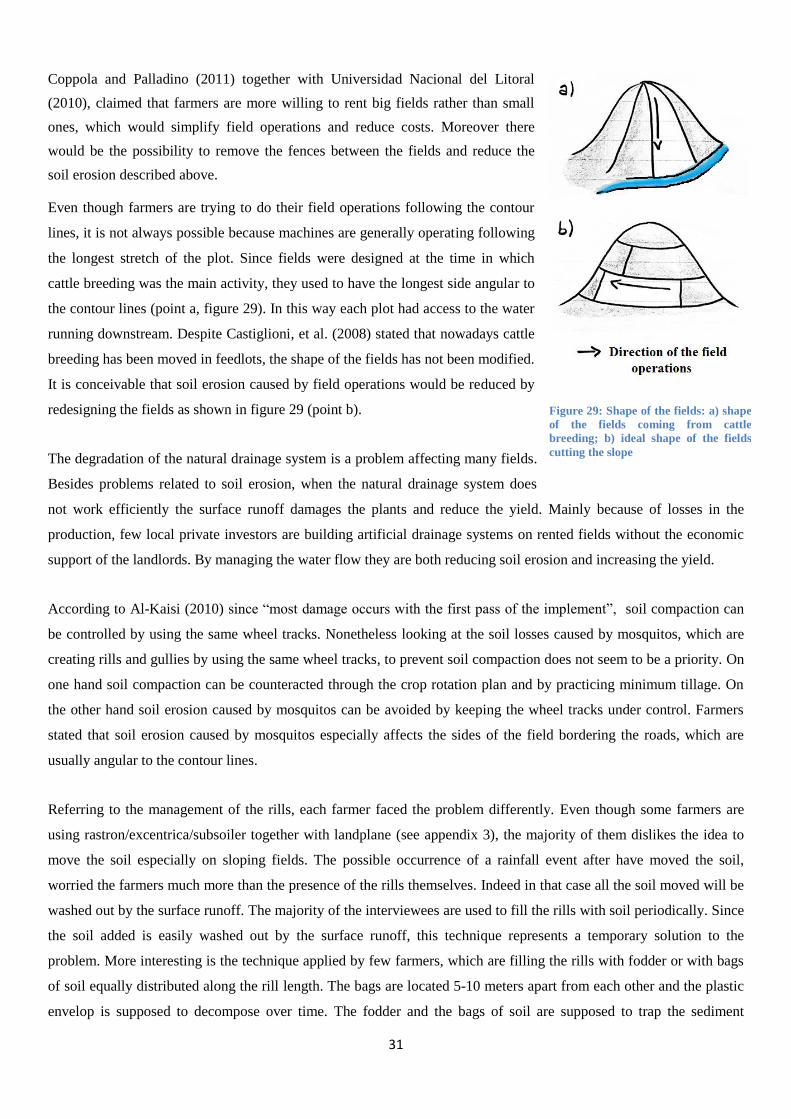
31
Coppola and Palladino (2011) together with Universidad Nacional del Litoral
(2010), claimed that farmers are more willing to rent big fields rather than small
ones, which would simplify field operations and reduce costs. Moreover there
would be the possibility to remove the fences between the fields and reduce the
soil erosion described above.
Even though farmers are trying to do their field operations following the contour
lines, it is not always possible because machines are generally operating following
the longest stretch of the plot. Since fields were designed at the time in which
cattle breeding was the main activity, they used to have the longest side angular to
the contour lines (point a, figure 29). In this way each plot had access to the water
running downstream. Despite Castiglioni, et al. (2008) stated that nowadays cattle
breeding has been moved in feedlots, the shape of the fields has not been modified.
It is conceivable that soil erosion caused by field operations would be reduced by
redesigning the fields as shown in figure 29 (point b).
The degradation of the natural drainage system is a problem affecting many fields.
Besides problems related to soil erosion, when the natural drainage system does
not work efficiently the surface runoff damages the plants and reduce the yield. Mainly because of losses in the
production, few local private investors are building artificial drainage systems on rented fields without the economic
support of the landlords. By managing the water flow they are both reducing soil erosion and increasing the yield.
According to Al-Kaisi (2010) since “most damage occurs with the first pass of the implement”, soil compaction can
be controlled by using the same wheel tracks. Nonetheless looking at the soil losses caused by mosquitos, which are
creating rills and gullies by using the same wheel tracks, to prevent soil compaction does not seem to be a priority. On
one hand soil compaction can be counteracted through the crop rotation plan and by practicing minimum tillage. On
the other hand soil erosion caused by mosquitos can be avoided by keeping the wheel tracks under control. Farmers
stated that soil erosion caused by mosquitos especially affects the sides of the field bordering the roads, which are
usually angular to the contour lines.
Referring to the management of the rills, each farmer faced the problem differently. Even though some farmers are
using rastron/excentrica/subsoiler together with landplane (see appendix 3), the majority of them dislikes the idea to
move the soil especially on sloping fields. The possible occurrence of a rainfall event after have moved the soil,
worried the farmers much more than the presence of the rills themselves. Indeed in that case all the soil moved will be
washed out by the surface runoff. The majority of the interviewees are used to fill the rills with soil periodically. Since
the soil added is easily washed out by the surface runoff, this technique represents a temporary solution to the
problem. More interesting is the technique applied by few farmers, which are filling the rills with fodder or with bags
of soil equally distributed along the rill length. The bags are located 5-10 meters apart from each other and the plastic
envelop is supposed to decompose over time. The fodder and the bags of soil are supposed to trap the sediment
Figure 29: Shape of the fields: a) shape
of the fields coming from cattle
breeding; b) ideal shape of the fields
cutting the slope

32
transported by the water runoff and to fill the rill progressively. This technique looks to be the most effective measure
to counteract the formation and development of the rills in the long term.
One of the biggest problems in Uruguay is the length and cost of the rent. As attested by the interviewees, nowadays
the majority of the landlords is not really interested in the crop rotation plan on their land and are just willing to get the
highest profit possible from the fields. In order to increase the price of the rent, they foster the signature of rental
contracts lasting short period of time (i.e. six months) that force farmers to plant soya “de primera”. Besides the desire
to plant more maize, farmers showed an interest in crops such as sorghum and colza. Even though the price of
sorghum on the market does not foster its expansion in Uruguay, some farmers are keeping it in the crop rotation plan
to preserve soil fertility of owned fields especially. Moreover Blasina and Tardiguila (n.d.) claimed that colza has the
potential to become one of the main crops in Uruguay. By literature (Coppola and Palladino, 2011; World Bank, 2013)
is known that the diversification of the production through the inclusion of more crop types within the crop rotation
plan, would benefit soil quality and reduce the economic vulnerability of the country.
Even though farmers are hoping for an improvement of the legislation on the rent, the majority does not trust in the
efficiency of the new law. Moreover it remains unclear how the Government is going to check on the application of
the law. As suggested by Moron (2012), Uruguayan land management can improve by reviewing the CONEAT map.
By updating the CONEAT value assigned to each plot, the price of the land will be related to its actual productive
capacity. The price of the land of those farmers preserving soil quality and counteracting soil erosion will increase
while bad management styles fostering soil erosion will be punished by the economic market itself with lower
incomes. Differences in the land management (crop rotation, application of mitigation measures against soil erosion,
etc.) between rented and owned fields will disappear and complex mechanisms of controls will not be necessary.
Despite that, the Government remains focused on the design of the crop rotation plan, which is supposed to
(indirectly) extend the length of the rental contracts.
Even though experimental studies on the effects of intensive agriculture with soya as main crop have not been
conducted in Uruguay, Prechac, et al. (2010) together with Jorge, et al. (2012) stated that models such as USLE,
RUSLE and CENTURY attested that the actual production system is not environmental sustainable. According to
Coppola and Palladino (2011) intensive agriculture is leading to the appearance of pests and diseases resistance to the
common agrochemicals, which are fostering the use of toxic substances. Moreover the several phytosanitary problems
affecting soya are requiring agrochemicals which are killing biological control agents as well (Ribeiro, et al., 2008;
Castiglioni, et al., 2008). If on one hand farmers showed to be aware of the problem, on the other hand they claimed
that at this moment soya is the only profitable crop in Uruguay. The results of this study supported what already stated
by several authors: even though farmers are not thinking to reduce soybean production in the near future, they are
willing to help the Government to preserve agricultural lands from soil erosion by practicing more sustainable
agriculture (Hill and Clerici, 2011). Indeed many farmers are already reducing the amount of agrochemicals by
monitoring the crops more and by buying selective products (Castiglioni, et al., 2008). By literature (n.d., 2012) is
known that the Uruguayan Government is taking into consideration the introduction of soya RR2 (genetic modified
soya resistant to glyphosate and lepidopteran insects) in the production system. On one hand this new technology may
reduce the amount of agrochemicals used in agriculture. On the other hand it can be a threat to the environment, since

33
its environmental effects in the long period have not been estimated. Moreover it is important to keep in mind the
environmental issues related to the cultivation of soya RR, which was also supposed to benefit the environment.
Despite Coppola and Palladino (2011) stated that foreign investors may take bad land management decisions because
living abroad, all the interviewees were Uruguayan. Foreign investors buying or renting fields, are used to commit the
management of the land to local agricultural engineers or other professionals within the agricultural sector. On one
hand, foreign anonymous societies count on several professionals within the company to manage the land. On the
other hand foreign private investors ask for advices to local technical advisory offices. In line with that, land
management decisions are supposedly taken according to the characteristics of the fields even though the legal
responsible for the plots is living abroad. Nonetheless it is true that few Argentinian companies declared to make also
use of Argentinian technical advisory offices. To notice that the majority of the foreign anonymous societies
interviewed recognized themselves as locals. This is due to the fact that the employees are Uruguayan and/or the
company is working in Uruguay since decades. Nonetheless they have been classified as foreigners because they have
been founded by foreigners and their profits go abroad.
Since this study relies on interviews and take into consideration rented fields, it is affected by several limitations. First
of all farmers have been required to generalize on their land management style due the extension of the study area. If
on one hand farmers claimed that it is not possible to generalize on soil erosion because it affects differently each plot,
on the other hand they were not able to express an opinion on the soil erosion occurring on rented fields. In this case
the ownership of the land influenced the possibility to track the history of the plots. Even considering owned fields,
farmers’ statements should be analyzed taking into account the year of acquisition of the land. The research is also
limited to the year in which the interviewee started to manage the fields, especially considering anonymous societies,
as the fields may be in use for a long time however the interviewee has limited knowledge about them. Moreover
some parameters (i.e. reduction in thickness of the topsoil) are difficult to date because their change over time is
progressive.
While reading this paper it is important to keep in mind that the majority of the foreigners interviewed were
anonymous societies while the majority of the locals were private investors. Especially referring to the investor types,
the statistical analysis may have been influenced by differences in the sample size. Unfortunately it has not been
possible to analyze all the data provided by farmers. The differences within the several crop rotation plans and their
quantity did not allow to relate soil loss rates coming from simulations to the type of investors. Moreover the lack of a
reliable tool of analysis did not allow to process data on the quantity of agrochemicals used on soy, wheat and barley.
Therefore it was not possible to estimate the risk of environmental pollution caused by the current practice of intensive
agriculture.

34
8 Conclusions
Soil erosion simulations showed that the study area is highly affected by soil erosion and that only a few combinations
of soil type, weather conditions, mitigation measures and crop rotation plan lead to soil loss rates lower than 7
Ton/ha/year. “Canada Nieto” resulted to be the soil most affected by soil erosion while “Risso” is the one in which the
soil loss rate is lower. Data showed that the presence of pasture and crops “de segunda” in the crop rotation plan are
fundamental to limit soil losses, which can be lower by planting more maize and sorghum as well.
The study revealed that there are much more differences in the land management style between rented and owned
fields rather than between foreign and local farmers. Indeed no significant differences have been found between the
land management style of foreign and local farmers. In relation to the ownership of the land (rented or owned),
foreigners and locals are adopting the same land management style. In general it is possible to state that owned fields
are better managed than rented fields. They are characterized by crop rotation plans lasting longer and including
unprofitable crops such as sorghum, which is useful to preserve soil quality. Moreover several landlords have periods
of pasture within the crop rotation plan, which increase soil fertility. On the other side, rented fields are overexploited
because of the high price of the rent. Besides that, short-term rental contracts lead farmers to intensify the production
and to plant soya “de primera”, which is the most profitable crop in Uruguay. Intensive agriculture with soya leads to
high soil loss rates, especially if the soil is classified as “Canada Nieto” and has high slope gradients. Since soya is the
main crop on owned fields as well, the entire study area resulted being affected by soil erosion to some extent.
Nonetheless, crop rotation plan and crop type cannot be considered as the only responsible for the occurrence of soil
erosion. The presence of mitigation measures, the soil type and agricultural decisions (i.e. seeding and harvesting time,
removal of the stubbles, field operations, application of agrochemicals, etc.) also affects the soil loss rate.
All farmers declared to practice sod-seeding, which is supposed to reduce soil erosion. Cheap mitigation measures
such as contour farming, respect of the natural drainage system and avoid field operations when the soil moisture is
high, are commonly practiced on both rented and owned fields. Expensive mitigation measures such as the
construction of terraces and conservation buffers, are mainly done on owned fields. Farmers claimed that they are
investing in mitigation measures on rented fields if there is an agreement with the landlord only (i.e. rental contract
lasting longer or payment of a lower rent). Nonetheless all the interviewees are willing to counteract soil erosion on
rented fields and are waiting for an improvement of the law on the rental conditions. According to the farmers, it will
be enough to have rental contracts lasting three years to improve the crop rotation plan and significantly reduce the
soil erosion rate on the fields.
Although the land management style does not change significantly with the nationality of the farmer, there are
differences within the investor types. Even though anonymous societies are mainly managing rented fields, their
management style is consider better than the management style of private investors. It is conceivable that their
availability of financial capital and their high bargaining power lead them to sign better rental contracts than private
investors do. By signing rental contracts lasting longer (i.e. ten years), they are more willing to invest in the
construction of terraces and conservation buffers, which have been proved to be fundamental in the reduction of the
soil erosion rate on all the soil types considered. Conservation buffers resulted to be the best options for slope

35
gradients equal or lower than two. Terraces resulted to be the best option in presence of slope gradients equal or higher
than three. Moreover anonymous societies are investing in research and are promoting pilot projects aiming to
increase the yields while preserving the environment. Besides the use of high technologies, some foreign anonymous
societies are applying new agricultural techniques such as precision agriculture. By taking into account the
characteristics of each plot (i.e. slope and soil type), they are designing specific crop rotation plans which are also
aiming to reduce the soil erosion rate. Many foreign anonymous societies renting fields, claimed to offer to the
landlords the opportunity to build terraces and conservation buffers on such fields. The company will take care of the
projection and construction of the structures while the landlords should pay for the construction costs only.
Private investors are mostly managing rented fields having a high percentage of rental contracts lasting from six
months to one year. The short-term of the rental contract can be referred to the low bargaining power of the investors,
which have to stand at landlords’ conditions. Terraces and conservation buffers are mainly built on owned fields.
Local private investors prefer to build terraces while foreigners prefer to invest in the construction of conservation
buffers. Such mitigation measures are applied on rented fields as well only if they are promoted by the landlord.
Nonetheless, few local private farmers built artificial drainage systems without the economic support of the landlords.
Based on what stated above, it is possible to conclude that foreign anonymous societies are the ones better managing
the land in the study area followed by local anonymous societies, local private investors and foreign private investors.
This classification mainly relies on the fact that anonymous societies are greatly investing on rented fields while
private investors are focused on owned fields only. Moreover foreign anonymous societies resulted to invest more
than others in research developing technology and coming up with new agricultural techniques.
9 Recommendations
In this chapter recommendations and ideas for future studies are provided on the base of the results of the study at
hand.
Since several agrochemicals (i.e. glyphosate) are used in high amounts to intensify the production, it is recommended
to use selective products. If on one hand selective products are expensive and slow killing pests and diseases, on the
other hand they are environmental friendly and may substitute several toxic substances in once. It is also
recommended to diversify the production by introducing more crop types and when possible include periods of
pasture within the crop rotation plan. In case of rented fields it is recommended to extend the length of the crop
rotation plan by signing long-term rental contracts and to prefer planting soya “de segunda” to soya “de primera”. The
“new” law on land management should take into consideration other parameters besides the design of the crop rotation
plan to preserve soil quality and improve the rental conditions. Fields should be redesigned to encourage the practice
of field operations cutting the main slope and the plane should be used more to reduce soil erosion and compaction.
The study demonstrated that land management decisions are highly influenced by the length and price of the rent,
which are still issues in Uruguay. Since the interviewees are doubting whether the new law on land management will
be effective improving the rental conditions, it will be interesting to check on the management of the rented fields in
the coming years. Considering that the climate change is fostering the installation of irrigation systems and that there

36
are constraints regarding the use of water for agricultural purposes, to research on water availability in the country
may be useful. Moreover the possible introduction of soya RR2 within the production system is a threat that must be
kept under control.

37
Bibliography
Al-Kaisi, M., 2000. Soil erosion: an agricultural production challenge. Integrated crop management news, Iowa State University Extension and
Outreach, [online]. Available at: <http://www.ipm.iastate.edu/ipm/icm/2000/7-24-2000/erosion.html> [Accessed 2 October 2012]
Al-Kaisi, M., 2008. Impact of tillage and crop rotation systems on soil C sequestration. Iowa State University, University Extension, [online].
Available at: <http://www.extension.iastate.edu/Publications/PM1871.pdf> [Accessed 25 September 2012]
Al-Kaisi, M., 2010. How and why to avoid soil compaction. Integrated crop management news, Iowa State University Extension and Outreach,
[online]. Available at: < http://www.extension.iastate.edu/CropNews/2010/0401alkaisi2.htm> [Accessed 29 September 2012]
Al-Kaisi, M., Hanna, H., 2008. Make the right tillage management decision, Integrated crop management news, Iowa State University Extension
and Outreach, [online]. Available at: <http://www.extension.iastate.edu/CropNews/2008/1002alkaisihanna.htm> [Accessed 1 October 2012]
Al-Kaisi, M., Hanna, M., 2008. Make the right tillage management decision. Integrated crop management news, Iowa State University Extension
and Outreach, [online]. Available at: <http://www.extension.iastate.edu/CropNews/2008/1002alkaisihanna.htm> [Accessed 1 October 2012]
Al-Kaisi, M., Hanna, M., 2009. Pay attention to soil crusting after heavy rain events. Integrated crop management news, Iowa State University
Extension and Outreach, [online]. Available at: <http://www.extension.iastate.edu/CropNews/2009/0430alkaisihanna.htm> [Accessed 2
October 2012]
Al-Kaisi, M., Hanna, M., 2011. Maximizing yield potential by optimizing soil management practices. Integrated crop management news, Iowa
State University Extension and Outreach, [online]. Available at: <http://www.extension.iastate.edu/CropNews/2011/0428alkaisihanna.htm>
[Accessed 1 October 2012]
Al-Kaisi, M., Hanna, M., Licht, M., 2009. Soil erosion and water quality. Iowa State University, University Extension, Resource conservation
practice, [online]. Available at: <http://www.extension.iastate.edu/Publications/PM1901E.pdf> [Accessed 25 September 2012]
Al-Kaisi, M., Hanna, M., Tidman, M., 2002. Soil erosion and water quality. Integrated crop management news, Iowa State University Extension
and Outreach, [online]. Available at: <http://www.ipm.iastate.edu/ipm/icm/2002/9-23-2002/erosion.html> [Accessed 2 October 2012]
Al-Kaisi, M., Helmers, M., 2008. Heavy rain, soil erosion and nutrient losses. Integrated crop management news, Iowa State University
Extension and Outreach, [online]. Available at: <http://www.extension.iastate.edu/CropNews/2008/0604MAlKaisiMHelmers.htm> [Accessed
29 September 2012]
Al-Kaisi, M., Licht, M., Hanna, M., 2006. Is tillage needed for your soybean crop? Integrated crop management news, Iowa State University
Extension and Outreach, [online]. Available at: <http://www.ipm.iastate.edu/ipm/icm/2006/4-3/tillage.html> [Accessed 1 October 2012]
Al-Kaisi, M., Yin, X., Hanna., M, Duffy, D.M., 2009. Considerations in selecting no-till. Iowa State University, University Extension, Resource
conservation practice, [online]. Available at: <http://www.extension.iastate.edu/Publications/PM1901D.pdf > [Accessed 25 September 2012]
Banco Mundial, 2007. Uruguay: que aprendimos de la crisis financiera de 2002? Banco Mundial, Ministerio de economia y finanzas.
Blasina and Tardaguila, n.d. Perspectiva agropecuarias 2008/09. Montevideo, Uruguay: Blasina & Tardaguila Consultores Asociados
Bravo, A.L., Centurion Mereles, H.F., Dominguez, D.I., Sabatino, P., Poth, C.M., Leonel Rodriguez, J., Bravo, M.E., 2010. Los senores de la
soja. La agricultura transgenicax en America Latina. Buenos Aires, Republica Argentina: Fundacion Centro de Integracion, Comunicacion,
Cultura y Sociedad - CICCUS; Consejo Latinoamericano de Ciencias Sociales – CLACSO
Cafe and Tertulia, 2009. Los cambios en la produccion agricola nacional. Un enfoque interdisciplinario.Coleccion 1/09. Uruguay: Universidad
de la Republica
Castiglioni, E., Ribeiro, A., Silva, H., Pereira, C., Cristino, M., 2008. Algunas interrogantes y respuestas para el manejo de plagas en los
sistemas agricolas intensificados. Cangue. Revista de la estacion experimental Dr. Mario A. Cassinoni. Facultad de agronomia, Paysandu.
Universidad de la Republica. Number 30, pp.25-29
Chiappe, M., Carambula, M., Fernandez, E., 2008. El campo uruguayo: una mirada desde la sociologia rural. Montevideo, Uruguay:
Universidad de la Republica, Facultad de agronomia
Clerici, C., Baethgen, W., Hill, M., Prechac, F.G., Ernst, O., 2004. El cultivo de soja y la conservacion del suelo. Cangue. Revista de la estacion
experimental Dr. Mario A. Cassinoni. Facultad de agronomia, Paysandu. Universidad de la Republica. Number 26, pp.20-22
Clerici, C., Baethgen, W., Hill, M., Prechac, F.G., Ernst, O., 2004. El cultivo de soja y la conservacion del suelo. Cangue. Revista de la estacion
experimental Dr. Mario A. Cassinoni. Facultad de agronomia, Paysandu. Universidad de la Republica. Number 26, pp.20-22
Coppola, M.L., Palladino, M.C., 2011. Estudio del funcionamiento de las nuevas empresas agricolas y la cadena logistica. Universidad de la
Republica, Facultad de agronomia.

38
Ernst, O., 2004. La soya en el sistema agricola uruguayo. Cangue. Revista de la estacion experimental Dr. Mario A. Cassinoni. Facultad de
agronomia, Paysandu. Universidad de la Republica. Number 26, pp.7-10
Ernst, O., Marchesi, E., Marchesi, Y., 2004. Manejo de barbecho para cultivos de verano de primera sembrados sin laboreo. Cangue. Revista de
la estacion experimental Dr. Mario A. Cassinoni. Facultad de agronomia, Paysandu. Universidad de la Republica. Number 26, pp.44-48
Ernst, O., Siri-Prieto, G., 2008. Sistemas de laboreo y rotacion de cultivos en Uruguay: resumen de resultados. Cangue. Revista de la estacion
experimental Dr. Mario A. Cassinoni. Facultad de agronomia, Paysandu. Universidad de la Republica. Number 30, pp.2-8
Erosion 6.0, 2012. Manual usuario. Sistema Erosiòn para Windows Version 6.0, [online]. Available at <http://www.fagro.edu.uy/~manejo/>
[Accessed 28 November 2012]
Gimenez, A., Castano, J.P., Baethgen, W.E., Lanfranco, B., 2009. Cambio climatico en Uruguay, posibles impactos y medidas de adaptacion en
el sector agropecuario. Serie tecnica 178. Montevideo, Uruguay: INIA
Hanna, M., Al-Kaisi, M., 2009. Understanding and managing soil compaction. Iowa State University, University Extension, Resource
conservation practice, [online]. Available at: <http://www.extension.iastate.edu/Publications/PM1901B.pdf > [Accessed 25 September 2012]
Hanna, M., Al-Kaisi, M., Tidman, M., 2002. Soil compaction may be cutting into your yield. Integrated crop management news, Iowa State
University Extension and Outreach, [online]. Available at: <http://www.ipm.iastate.edu/ipm/icm/2002/7-8-2002/soilcompact.html> [Accessed 2
October 2012]
Hill, M., 2012. Interview on the land management policies taken by the Uruguayan government. Interviewed by Lucrezia Caon, 27th September
2012, 11:00
Hill, M., Clerici, C., 2011. Planes de uso y manejo del suelo. Revista INIA Uruguay, n.26, pp. 65-69
IDW, 2012. Mercosur. International democracy watch, [online]. Available at:
<http://www.internationaldemocracywatch.org/index.php/mercosur> [Accessed 15 December 2012]
IICA, 2004. El agronegocio Uruguayo: pilar del pais productivo.Proyecto agropecuaria Uruguay 2020. Montevideo, Uruguay: Instituto
Interamericano de Cooperacion Agricola
IICA, 2009. La crisis economica internacional y su impacto en la agricultura regional (Argentina-Bolivia-Brasil-Chile-Paraguay-Uruguay).
Santiago, Chile: Instituto Interamericano de Cooperacion para la Agricultura (IICA)
Jorge, G., Perez, M., Terra, J., Sawchik, J., 2012. WEPP as a tool for enabling more comprehensive analysis of the environmental impacts of soil
erosion. Agrociencia Uruguay, ISSN 1510-0839, pp.268-273
Jorge, G., Perez, M., Terra, J., Sawchik, J., 2012. WEPP as a tool for enabling a more comprehensive analysis of the environmental impacts of
soil erosion. Agrociencia Uruguay, pp.268-273
Lanfranco, B., Sapriza, G., 2011. El indice CONEAT como medida de productividad y valor de la tierra. Serie tecnica 167. Montevideo,
Uruguay: INIA
Ministerio de Agricultura y Pesca, Direccion de suelos y fertilizantes,1979. Carta de reconocimiento de suelos del Uruguay. Descripcion de las
unidades de suelos. Tomo III. Montevideo, Uruguay: MGAP
Ministerio de Ganaderia, Agricultura y Pesca, 2012. Projecto desarrollo y adaptacion al cambio climatico –DACC-. Manejo sostenible de los
recursos naturales y adaptacion al cambio climatico. Manual de operaciones. Republica Oriental del Uruguay: MGAP
Modernel, P., 2009. 11° guia para la proteccion y fertilizacion vegetal. Uruguay: SATA
Moron, A., 2012. La calidad de los suelos bajo produccion lechera y produccion agricola en las principales regiones de Uruguay. In: IV SUCS
Meeting (Uruguayan Soil Science Society), 19th ISTRO (International Soil Tillage Research Organisation) conference on striving for
sustainable high productivity. Montevideo, Uruguay 24-28 September 2012. Uruguay: Fundacion Alberto Boerger
Moron, A., n.d. Como promover un uso sustentable del recurso suelo en Uruguay, Informaciones agronomicas n.3, [online]. Available at:
<http://www.ipni.net/publication/ia-lacs.nsf/0/07713B180B820CEC852579820073C1AD/$FILE/14.pdf> [Accessed 6 January 2013]
Moron, A., Quincke, A., Molfino, J., Ibanez, W., Garcia, A., 2012. Soil quality assessment of Uruguayan agricultural soils. Agrociencia
Uruguay, ISSN 1510-0839, pp.135-143
n.d., 2012. Precios, rindes y buen futuro: no hay con que darle a la soja. Agricultura. La soja les gana. Asociacion rural del Uruguay. Año CXL-
N.104, pp.8-12
Prechac, F., Ernst, O., Arbeletche, P., Bidegain, M., Pritsch, C., Ferenczi, A., Rivas, M., 2010. Intensificacion Agricola: oportunidad y amenazas
para un pais productive y natural. Coleccion articulo 2. Montevideo, Uruguay: Universidad de la Republica; CSIC
Prechac, F.G., 2004. Cultivo continuo en siembra directa o rotaciones de cultivos y pasturas en suelos pesados del Uruguay. Cangue. Revista de
la estacion experimental Dr. Mario A. Cassinoni. Facultad de agronomia, Paysandu. Universidad de la Republica. Number 26, pp.28-32

39
RENARE, 2012. Normativa suelos. [online]. Available at: <http://www.cebra.com.uy/renare/normativa/suelos/> [Accessed 21 December 2012]
Riaboi, J., 2012. Las ganancias del “yoyito”. Agricultura. La soja les gana. Asociacion rural del Uruguay. Año CXL-N.104, pp.14-16
Ribeiro, A., Silva, H., Castiglioni, E., Bartaburu, S., 2008. Efecto de la aplicacion de insecticidas sobre enemigos naturales de insectos plaga en
soja. Cangue. Revista de la estacion experimental Dr. Mario A. Cassinoni. Facultad de agronomia, Paysandu. Universidad de la Republica.
Number 30, pp.30-35
Rocca,J., 2002. Crisis viejas de un nuevo milenio, una mirada a la economia uruguaya. Montevideo, Uruguay: Nordan Comunidad
Rotterdam Convention, 2010. Rotterdam Convention, country profile. [online] Available at:
<http://www.pic.int/Countries/CountryProfile/tabid/1087/language/en-US/Default.aspx> [Accessed 6 January 2013]
RUSLE, 2002. RUSLE online soil erosion assessment tool. [online] Available at: <http://35.8.121.139/rusle/about.htm> [Accessed 28
November 2012]
Saaredra, C., 2011. Un siglo de agricultura. MGAP-DIEA. Revista del Plan Agropecuario n.137, [online]. Available at
<http://www.mgap.gub.uy/portal/hgxpp001.aspx?7,5,93,O,S,0,MNU;E;39;1;MNU> [Accessed 31 October 2012]
Sawchik, J., Perez, M., Garcia, C., 2012. Impact of winter cover crops on soil properties under soybean cropping systems. Agrociencia Uruguay,
ISSN 1510-0839, pp.288-293
Stockholm Convention, 2008. Stockholm Convention, status of ratification. [online] Available at:
<http://chm.pops.int/Countries/StatusofRatifications/tabid/252/Default.aspx> [Accessed 6 January 2013]
Thompson, D., 2007. Soil erosion. A workshop in support of the thematic strategies for soil protection [pdf] Available at:
<http://eusoils.jrc.ec.europa.eu/esbn/plenary_esbn_2007/workshop/esbn_soilerosion.pdf> [Accessed 6 January 2013]
Universidad Nacional del Litoral, 2010. Pampa 06. Revista interuniversitaria de estudios territoriales. Santa Fe, Republica Argentina:
Universidad de la Republica
Uruguay lands, n.d. Land characteristics. [online] Available at: <http://www.uruguaylands.com/caracteristicas.php> [Accessed 27 December
2012]
Geography Dictionary, 2008. Brunisol soil. [online] Available at: <http://geography.geography-dictionary.org/Physical-Geography-
Dictionary/Brunisol_Soil> [Accessed 17 January 2013]
World Bank, 2013. Uruguay [online] Available at: <http://www.worldbank.org/en/country/uruguay> [Accessed 20 January 2013]
Images
ACA, n.d. Brazo vibrocultor 32x10. [photograph] Available at: < http://www.accesoriosagricola.com/it/brazo-vibrocultor/66-brazo-vibrocultor-
32x10.html > [Accessed 16 October 2012]
Agriaffaires, 2013. Subsoiler. [photograph] Available at: <http://www.agriaffaires.co.uk/used/1/subsoiler.html> [Accessed 16 October 2012]
Agriocasion, 2007. Rastrones para la agricultura. [photograph] Available at: <http://agriocasion.net/product/show/id/371 > [Accessed 16
October 2012]
Agroads, 2004. Cosechadora Massey Ferguson M34. [photograph] Available at: <http://www.agroads.com.ar/detalle.asp?clasi=62508>
[Accessed 16 October 2012]
Agroads, 2008. Paratil Dolbi 8 Timones. [photograph] Available at: <http://www.agroads.com.ar/detalle.asp?clasi=150510> [Accessed 16
October 2012]
Bigham Brothers, 2009. Subsoilers V-Till. [photograph] Available at: < http://www.bighambrothers.com/v-till.htm> [Accessed 16 October
2012]
EducaSitios, n.d. Conociendo Uruguay. [map] Available at: <http://educasitios.educ.ar/grupo1270/?q=node/58> [Accessed 06 December 2012]
Mas poco vendo, 2013. Cincel 7 puntas. [photograph] Available at: <http://www.maspocovendo.com/agro/maquinarias/cincel_7_puntas.html >
[Accessed 16 October 2012]
MGAP, 2013. Mapa orografico del Uruguay. Modelo digital de terreno. [map] Available at: < http://www.cebra.com.uy/renare/wp-
content/files_mf/1341438086modelodigitaldelterrenoder.o.u128.jpg> [Accessed 15 January 2013]
Nievas, n.d. Rastra Excetrica RDV. [photograph] Available at:
<http://www.viarural.com.ar/viarural.com.ar/insumosagropecuarios/agricolas/arados/nievas/horticultura-y-fruticultura-rastra-excentrica-rdv-
01.html> [Accessed 16 October 2012]

40
Ratlam Business Guide, 2012. Land plane. [photograph] Available at: < http://ratlambusinessguide.com/page/46/ > [Accessed 16 October
2012]
Siderman, n.d. Vibroflex serie 32. [photograph] Available at: < http://www.siderman.it/vibroflex.html> [Accessed 16 January 2013]
SPI, n.d. Carta de reconocimiento de suelos generalizada por tipos de suelos. [map] Available at: <http://www.spiuruguay.com/invertir-en-
uruguay.php> [Accessed 15 January 2013]
TractorByNet, 2012. What size land plane for Kubota L3940 [photograph] Available at:
<http://www.tractorbynet.com/forums/attachments/170413-what-size-land-plane-kubota.html> [Accessed 16 October 2012]

41
Appendix 1: Questionnaire to the farmers
Date ___ /___ /____
Place: ___________
Interview n° _____
General information
Name of the interviewed:_______
Age: _______
Email address:________
Qualification :________
Company name:_______
Type of company (l.l.c., joint-stock company, etc.):________
Local farmer
Foreign farmer, nationality:
o Argentine
o Europe, country:________
o Other(s): _______
Landlord
Tenant
“Medianero”
Other(s): ________
Are your farming choices supported by an expert?
Yes, who? ________________________ (qualification)
No
Do you belong to some association?
Yes, which one? __________
No
How many hectares do you manage (total)? ________
How many hectares do you own?_________
How many hectares do you rent? _________
Length of the rental contract: ___________
How many hectares are rented as “medianeria”? ________
Do you practice intensive agriculture? (1 or 2 crops in the crop rotation, no fallow period and no pasture)
Yes, since:________
No
On how many hectares do you practice intensive agriculture?_________
Do you have livestock? Yes No
Do you cultivate soya?
No
Yes:
o Hectares:_______
o Under intensive agriculture? Yes No
o Since: _________
Have you ever cultivated soya before 2000?
o Yes, hectares:_________
o No, why?
o Do you cultivate “soya de primera”? Yes No Hectares (2011/2012):_________
o Do you cultivate “soya de secunda”? Yes No Hectares (2011/2012):_________
How did you manage the land before passing to practice intensive agriculture?
Conventional agriculture; crops:
o Barley
o Colza
o Wheat
o Moha
o Triticale
o Soya
o Sorghum destined to grain production
o Sorghum destined to fodder (silo) production
o Sunflower

42
o Maize destined to grain production
o Maize destined to fodder (silo) production
o Other(s): ______
Pasture
Natural fields
Other(s):_______
Do you manage differently the fields you own from the ones you rent?
No
Yes:
o Crop type:
Main crop(s) on rented fields:_____________
Main crop(s) on owned fields:_____________
o Do you apply more agrochemicals on rented fields rather than on owned fields? Yes No
o There are differences in the crop rotation? Yes No
If yes, specify:________
o Other(s): ______________
Machineries
Which kind of machines do you use?
Planter
Times per year
Harvester
Agrochemical sprayers
Fertilizing machinery
Plane (seeding)
Plane (agrochemicals spray)
Arado
Subsoiler
Excentrica
Other(s):_____________
Crop rotation
Crops in the crop rotation and their extension (2011/2012):
Winter crops
Barley (Hordeum vulgare L.)
Extension (hectares)
Colza (Brassica napus olerifera)
Wheat (Triticum aestivum L.)
Triticale (X Triticosecale Witt)
Oat (Avena Sativa)
Other(s):_______________
Summer crops
Sunflower (Helianthus annus L.)
Extension (hectares)
Maize (Zea mays L.)
Moha (Setaria italiaca)
Soya (Glycine max (L.) Merrill)
Sorghum (Sorghum spp.)
Other(s):_______________
Is your production intended to export?
Yes, toward which country?
Which crop(s)?
No
Do you practice crop rotation? Yes No
Did you practice crop rotation before cultivate soya? Yes No
Have you changed crop(s) since you started to cultivate soya?
No
Yes, which crop(s) have you quitted?_____________
Old crop rotation plan -before soya- (description): _____________________________
Actual crop rotation plan on rented and owned fields (description):________________

43
Do you plough the fields?
Did you plough the fields before starting to cultivate soya?
Is there a fallow period in your crop rotation plan?
Was there a fallow period in your crop rotation plan before cultivating soya?
Are you practicing a different crop rotation plan on rented and owned fields?
Do you prefer to cultivate soya on rented fields rather than on owned fields?
Do you remove the stubbles?
Do you use a cover crop?
Which one (leguminous crops, pasture, oat, other(s))?_____________
Yes
Yes
Yes
Yes
Yes
Yes
Yes
Yes
Yes
No
No
No
No
No
No
No
No
No
Sowing technique
Sod seeding
On which crop(s)?
Tillage
Minimum till-sowing
Other(s): _______________
Technique to aerate the soil:
Tillage
Subsoiler
Soil aerators (i.e. cincel)
Other(s): _________________
Irrigation
Do you irrigate the fields? Yes No
Did you irrigate the fields before 2000/before to cultivate soya? Yes No
Mainly which crop? ________
Source of water:
Rainfall water
Do you collect the rain on the fields? Yes No
Surface water (river, reservoirs)
Groundwater (use of springs or wells)
Have you always used the same source of water?
Yes
No:
Previous source of water ______ Used till (year) _______
Why have you changed water source?
o Resource exhausted
o Increase in price
o Pollution of the resource
o Other(s) _______
Do you have artificial pounds on the fields (“tajamares” or “represas”)? Yes No
Are these pounds connected to irrigation channels running over the field? Yes No
Are the pounds built for livestock drinking? Yes No
Irrigation technique:
Surface irrigation
o Furrow irrigation
o Borderstrip irrigation
o Basin irrigation
o Flood irrigation
Localized irrigation (piped network)
o spray irrigation and/or micro-sprinkler irrigation
center pivot irrigation (circular pattern)
lateral move (side roll, wheel line)
o drip irrigation
Other(s) ________
Do you use the same irrigation technique on all the crops?
Yes
No
If no, crop(s)_________ Irrigation technique(s) _________
Do you apply agrochemicals to the crops through the irrigation system?
No
Yes, on __________crop(s)

44
Do you apply fertilizers to the crops through the irrigation system?
No
Yes, on __________crop(s)
Soil erosion
Do you think that your fields are affected by soil erosion?
Have you noticed a reduction in the thickness of the topsoil?
Do you apply some mitigation measures against soil erosion?
Do you practice contour farming?
Do you sow against the slope? Do you have contour lines on the fields? Do you have conservation buffers on the fields? Do you sow following the contour lines?
Do you build terraces?
Yes No
Yes No
Yes No
Yes No
Yes No
Yes No
Yes No
Yes No
Yes No
If no, why? ________
If yes, which kind of terrace do you have on your fields?
o Wide base
o Narrow base
o Practicable
o Not practicable
Distance between terraces: __________
Other(s) mitigation measures taken:____________
Have you noticed one of the following?
Decreased soil capacity to retain the water
Since
That the topsoil (A horizon) became thinner
Necessity to apply more fertilizers to the crops to get normal or higher yields
Presence of rills
Presence of gullies
Increased surface runoff
Decreased biodiversity into the soil (flora/micro-fauna)
Presence of new or more resistant plagues
Soil compaction
Other(s)_________
Agrochemicals
Do you use agrochemicals? Yes No
Agrochemicals used in the period
2011/2012
Quantity used on "soya de
primera" (Kg or l ha-1)
Quantity used on "soya de
segunda"
(Kg or l ha-1)
Quantity used on wheat
(Kg or l ha-1)
Glyphosate
2,4 D amine
Metsulfuron-methyl
Banvel
AmistarXtra
Clorpirifos
Intrepid
Engeo
Tebuconazole
Cypermethrin
Triflumuron
Opera
Allegro
Methoxyfenozide
Fipronil

45
Venceweed
Dodecachlor
Endosulfan
Pentachlorophenol
Paraquat
Aldicarb
Sodium arsenite
Bromomethane
Carbofuran
Methomyl
Dithane
Sphere Max
Other(s)__________
Do you use fertilizers? Yes No
Quantity (Kg or l ha-1year-1)
NPK-S 00/01 01/02 02/03 03/04 04/05 05/06 06/07 07/08 08/09 09/10 10/11 11/12
10-50-50-0
12-61-0
0-34-0+Ca-S
3-30-30-0
0-22-0 +Ca-S
21-0-0-S
0-22-0-Ca-S
30-0-0
28-0-0+S
15-15-15
0-46-0
7-40-0+S
18-46-0
40-0-0+S
0-0-60
0-30-0+Ca
25-33-0
20-20-20
0-28-0+Ca-S
0-34-0-5(6)
4-30-0+Zn
10-0-12-2S
9-25-25
2-20-0
35-0-5
How do you apply the agrochemicals?
Plane
“Mosquito”
Tractor
Other(s)_________

46
Do make soil chemical analysis?
No
Yes, what do you measure?
o pH
o N
o K
o P
o Organic matter
o Zn
o S
o Other(s) ________
Have you noticed a change in the pH value since you started to practice intensive agriculture with soya?
Do not know
No
Yes, how did it change?
o Did it increase? Yes No If yes, how much? ________________
o Did it decrease? Yes No If yes, how much? ________________
Future perspective (time span 20 years)
According to you, till when the soil will be able to sustain the actual production system? (time horizon) ______________
What yields do you expect in twenty years from now?
They will increase, why? ___________
They will decrease, why? ___________
They will be the same, why? _________
If the price on the market is good, do you think you will keep on to crop soya? Yes No
Do you think that you will use more agrochemicals in twenty years from now?
Yes, why?_______
No, why? _______
Do you think that you will change crop type?
Yes, why? ___________
Which crops do you think you will change/include in your rotation plan? ___________
No, why? ____________
Do you think that you will change crop rotation plan (i.e. no more intensive agriculture, rotation with pasture etc.)?
Yes, why? ___________
No, why? ___________
Are your future perspectives related to the quality of the soil? Yes No
Which changes in soil quality do you expect in twenty years from now?
Change of the pH value
o Acidification
o Alkalinization
o Neutrality
Change of the amount of nitrogen in the soil
o It will decrease
o It will increase
o It will be the same than now
Change of the amount of phosphorus in the soil
o It will decrease
o It will increase
o It will be the same than now
Change in the amount of potassium in the soil
o It will decrease
o It will increase
o It will be the same than now
Soil capacity to retain water
o It will decrease
o It will increase
o It will be the same than now
Do you think that the soil erosion rate on the fields will increase? Yes No
Why?___________
Do you think to use some additional mitigation measure besides the ones you are already taking to mitigate soil erosion on the fields (i.e.
terraces, contour farming, use a cover crop etc.)?
No
Yes, which mitigation measures are thinking to take? ____________
What are you doing to fulfill the “new” law on land management? __________

47
Appendix 2: Erosion 6.0
According to the Ministry of Livestock, Agriculture and Fisheries (Ministerio de Ganaderia, Agricultura y Pesca),
EROSION 6.0 is actually the most effective tool to counteract soil erosion in Uruguay (Hill, 2012). The program has
been developed by the Faculty of Agronomy (Facultad de Agronomia) of the Universidad de la Republica and uses
the Revised Universal Soil Loss Equation (RUSLE) to estimate the yearly soil erosion. The parameters of the RUSLE
have been adapted to the geological and meteorological characteristics of Uruguay. The formula applied to estimate
the yearly soil erosion is: A = R x K x L x S x P x C, where:
- A is the rate of erosion per unit area;
- R is the erosive power of the rain;
- K is the soil erodibility;
- L is the land length;
- S is the land slope;
- P refers to the conservation practices applied on the land;
- C is the soil cover degree.
The soil erosion tolerated (T) by the Uruguayan Government is 7 Ton/ha/year (EROSION 6.0, 2012).
Simulation process:
Once established the appropriate meteorological area and soil unit, the R (rainfall energy) and K (soil erodibility )
factors assume the features of constant parameters (they do not change with the land management). The departments
of Soriano and Rio Negro refer to the meteorological area of “Mercedes”. The department of Paysandù refers to the
meteorological area of “Paysandú”. The soil erosion rate has been simulated on four soil units, which are the most
representative the study area. According to Ministerio de Agricultura y Pesca (1979), these soil units are characterized
by:
- Young “Brunosol Eutrico Tipico Fr”:
o Slope: from slight (1-3%)to moderate (3-6%)
o Rockiness and stoniness: none
o Natural fertility: really high
o Permeability: moderately slow
o Drainage capacity: moderate
o Drought risk: medium
o Erosion risk: practicing agriculture the soil erosion risk is medium
- Canada Nieto“Brunosol Subeutrico Tipico ArFr”:
o Slope: from moderate (3-6%) to severe (6-12%)
o Rockiness and stoniness: none
o Natural fertility: medium
o Permeability: moderately slow
o Drainage capacity: moderate

48
o Drought risk: medium
o Erosion risk: practicing agriculture the soil erosion risk is high
- Bequelo“Brunosol Eutrico Haplico/Tipico Fr/LAc v”:
o Slope: from moderate (3-6%) to severe (6-12%)
o Rockiness and stoniness: none
o Natural fertility: really high
o Permeability: moderately slow
o Drainage capacity: moderate
o Drought risk: medium
o Erosion risk: practicing agriculture the soil erosion risk is medium
- Risso “Brunosol Eutrico Tipico Fr”:
o Slope: slight (1-3%)
o Rockiness and stoniness: none
o Natural fertility: from high to really high
o Permeability: slow
o Drainage capacity: from moderate to poor
o Drought risk: medium
o Erosion risk: practicing agriculture the soil erosion risk is medium
Since the soil type is fundamental to take the right land management decisions, the soil units used in the simulations
are further described in table 1 (Ministerio de Agricultura y Pesca, 1979).
Soil unit Horizon Thickness Color Texture Structure Transition pH Organic
matter Other(s)
Young
A 20/25 cm Black/dark brown FAc/FAcL Bs m m G 6.0/6.6 7.8/5.0
Bt 50/70 cm Black/dark brown Ac/FAc Bs m m g/c 6.6/7.5 5.7/1.3
Cca Yellowish red Ac/FAc 8.2 Concretions of
CO3Ca
Canada
Nieto
A 25 cm Dark brown/brown FAcAr G 7.0/7.4 4.5/3.5
Bt 35-45 cm Black/dark brown AcAr Bs m f/m G 6.9/7.6 2.7/1.7
C Terry brown/
yellowish red FAcAr 8.0 0.7/1.0
Bequelo
A 33/38 cm Black FAcL/FAc/
Ac
Gr m f/Bs p
m g/c 6.5/6.9 8.8/7.0
It cracks when
it is dry
Bt o B 34/64 cm Dark brown/ very
dark grayish brown FAc/Ac Ba/Bs m m d/g 6.3/8.0 4.7/1.2
It cracks when
it is dry
Cca 0/200 and
more cm Light brown FAcL/FAc
7.0/8.5
Concretions of
CO3Ca
Risso
A
(A1,A3) 28/35 Black FAc/FAcL
Gr p/m
m/Bs gr m C 6.0/6.3 8.2/5.0
Bt 80 Black/dark
brown/brown Ac Bs gr m/f G 6.5/8.0 3.6/1.2 Sliding faces
Cca Brown AcL/Ac 8.0/8.5 0.6/0.5
Table 1: Characteristics of the soil units (Ministerio de Agricultura y Pesca, 1979)

49
Texture: clay loam soil (FAc), silty clay loam soil (FAcL), clay soil (Ac), sandy clay loam soil (FAcAr), sandy clay
soil (AcAr), silty clay soil (AcL)
Structure type: sub-angular blocks (Bs), granular (Gr), angular blocks (Ba)
Structure class:
o p (small): Ba/Bs (length) 10 mm; Gr (diameter) 1 mm
o m (medium): Ba/Bs (length) 10-50 mm; Gr (diameter) 1-5 mm
o gr (big): Ba/Bs (length) 50-100 mm; Gr (diameter) 5-10 mm
Structure degree: moderate (m), strong (f)
Transition: diffuse (d) >12.5 cm, gradual (g) 6.5 – 12.5 cm, clear (c) 2.5 – 6.6 cm
While the value of the R and K factors is constant (see table 2), the value of the P, LS and C factors changes in the
simulations.
Constant parameters
Department Paysandú Soriano & Rio Negro
Meteorological area Paysandù Mercedes
R factor 659 554
Soil unit Young Risso Canada Nieto Bequelo
K factor 0,19 0,22 0,34 0,18
Gradient range related to the soil unit 2 – 6 1 – 3 4 - 10 4 - 8
Table 2: K and R factors in the simulations
All the simulations have been done considering sod seeding (“siembra directa”) as planting technique (“manejo del
suelo”). Nonetheless in order to adjust the “% of soil covered by the residues of the previous crop after have sowed
the new crop” value, some winter crops have been considered sowed with the “reduced ploughing” technique
(“laboreo reducido”).
The yields of maize and sorghum have been assessed at the medium level (in Spanish: “MEDIO – 4.500 k/ha MS de
residuos en superficie en el momento del laboreo”), with the exception of crop rotation 6. In order to adjust the “% of
soil covered by the residues of the previous crop after have sowed the new crop” value, in this rotation the yield of
maize has been assessed at a regular level (in Spanish “REGULAR – 3.400 k/ha MS de residuos en superficie en el
momento del laboreo”). Moreover a medium yield of 4.5 – 6.75 Ton/ha/year of dry matter have been set for the years
of “pastura establecida” in crop rotation 6 and 7.
Actual soil erosion simulations
In order to estimate the actual soil erosion rates, the C and P factors have been set according to the data provided by
the farmers interviewed. Table 3 and 4 report the crop rotation plans done by the farmers interviewed on rented and
owned fields. The winter crop type is not specified because the software Erosion 6.0 does not make a clear distinguish
among winter crops. For such crops, the values of the crop phases (PC) have been set considering a general winter

50
crop. The tables only refer to crop rotation plans lasting two or three years. Since they are the most common crop
rotation plans done in the study area, the crop rotation plans underlined in grey have been simulated.
Three years crop rotations % of farmers using the crop rotation plan on
Year 1 Year 2 Year 3 Owned fields Rented fields
Soya 1 Winter crop / Soya 2 Winter crop / Maize 2 15 30,8
Soya 1 Winter crop / Soya 2 Maize 1 10 7,7
Soya 1 Winter crop / Soya 2 Winter crop / Soya 2 10 0,0
Soya 1 Winter crop / Soya 2 Sorghum 1 5 3,8
Soya 1 Winter crop / Soya 2 Winter crop / Sorghum 2 20 30,7
Soya 1 Winter crop / Soya 2 Winter crop / pasture 0 3,8
Soya 1 Winter crop / Maize 2 Soya 1 10 7,7
Soya 1 Winter crop / Sorghum 2 Soya 1 10 0,0
Winter crop / Soya 2 Winter crop / Soya 2 Winter crop / Soya 2 0 3,8
Winter crop / Soya 2 Winter crop / Soya 2 Winter crop/ Maize 2 5 0,0
Winter crop / Soya 2 Winter crop / Maize 2 Winter crop / Soya 2 5 3,8
Winter crop / Soya 2 Maize 1 Soya 1 10 7,7
Table 3: Three years crop rotation plans
Two years crop rotations % of farmers using the crop rotation plan on
Year 1 Year 2 Owned fields Rented fields
Soya 1 Winter crop / Soya 2 0 11,1
Soya 1 Winter crop / Sorghum 2 0 11,1
Winter crop / Maize 2 Winter crop / Soya 2 25 22,2
Winter crop / Soya 2 Maize 1 0 11,1
Winter crop / Soya 2 Winter crop / Maize 2 0 11,1
Winter crop / Sorghum 2 Winter crop / Soya 2 25 11,1
Winter crop / Sorghum 2 Maize 1 25 0,0
Winter crop / Soya 2 Sorghum 1 25 0,0
Winter crop / Soya 2 Soya 1 0 22,2
Table 4: Two years crop rotation plans
In order to compare the soil erosion caused by different land management choices, other three crop rotation plans have
been simulated (they are not frequent among the farmers). Two of them are mainly done on owned fields and include
three years of pasture. The third crop rotation plan lasts only one year and is mainly done on rented fields. Figure 5
resumes the seven crop rotation plans simulated. The winter crop is abbreviated as “WC”.
Crop rotation code Year 1 Year 2 Year 3 Year 4 Year 5 Year 6 Year 7
1 Soya 1 WC / Soya 2 WC/ Maize 2 - - - -
2 Soya 1 WC / Soya 2 WC / Sorghum 2 - - - -
3 WC / Maize 2 WC / Soya 2 - - - - -
4 WC / Soya 2 Soya 1 - - - - -
5 WC / Soya 2 - - - - - -
6 Soya 1 WC / Soya 2 Maize 1 Soya 1 Pasture Pasture Pasture
7 WC / Soya 2 WC / Soya 2 WC / Maize Soya 1 Pasture Pasture Pasture
Table 5: Crop rotation plans simulated

51
According to Erosion 6.0 (2012), each crop rotation is characterized by four crop phases (PC: “periodos del cultivo”):
- PC 1: from the seeding till the first month of growth;
- PC 2: from the first month of growth till the second month of growth;
- PC 3: from the second month of growth till the harvest;
- PC 4: from the harvest till the seeding of the next crop.
To each phase is related a “starting month” (MI: “mes inicial”) and a “final month” (MF: “mes final”). One of the
limitations of the program is that it does not consider the precise starting and final date of the different phases. It just
considers the first day of the “MI month” and the last day of “MF month”. The settings of the C factor is shown in
table 6, 7, 8 and 9.
Crop rotation 1 Crop rotation 2
Soya 1 Winter crop Soya 2 Winter crop Maize 2 Soya 1 Winter crop Soya 2 Winter crop Sorghum 2
% of soil covered by the
residues of the previous crop
after have sowing the new crop
50 70 90 65 80 60 60 90 65 80
% of soil covered by the crop
leaves in period 3 90 96 96 96 - 96 96 96 96 -
% of soils covered by crop
residues in period 4 - - - - - - - - - -
PC (Crop phase) MI MF MI MF MI MF MI MF MI MF MI MF MI MF MI MF MI MF MI MF
1 11 11 6 6 12 12 6 6 12 12 11 11 6 6 12 12 6 6 12 12
2 12 12 7 7 1 1 7 7 1 1 12 12 7 7 1 1 7 7 1 1
3 1 3 8 11 2 4 8 11 2 4 1 3 8 11 2 4 8 11 2 4
4 4 5 0 0 5 5 0 0 5 10 4 5 0 0 5 5 0 0 5 10
Table 6: Settings of the C factor for crop rotations 1 and 2
Crop rotation 3 Crop rotation 4 Crop rotation 5
Winter crop Maize 2 Winter crop Soya 2 Winter crop Soya 2 Soya 1 Winter crop Soya 2
% of soil covered by the residues of the
previous crop after have sowing the new
crop
65 80 75 90 50 90 20 65 90
% of soil covered by the crop leaves in
period 3 96 - 96 96 96 96 90 96 96
% of soils covered by crop residues in
period 4 - - - - - - - - -
PC (Crop phase) MI MF MI MF MI MF MI MF MI MF MI MF MI MF MI MF MI MF
1 6 6 12 12 6 6 12 12 6 6 12 12 11 11 6 6 12 12
2 7 7 1 1 7 7 1 1 7 7 1 1 12 12 7 7 1 1
3 8 11 2 4 8 11 2 4 8 11 2 4 1 3 8 11 2 4
4 0 0 5 5 0 0 5 5 0 0 5 10 4 5 0 0 5 5
Table 7: Settings of the C factor for crop rotations 3, 4 and 5

52
Crop rotation 6
Soya 1 Winter crop Soya 2 Maize 1 Soya 1 Pastura no
consociada
Pastura
establecida
Pastura
establecida
Pastura
establecida
% of soil covered by the residues of the
previous crop after have sowing the
new crop
50
50 90 50 40 85 - - -
% of soil covered by the crop leaves in
period 3
90 96 96 90 90 96 - - -
% of soils covered by crop residues in
period 4
- - - - - - - - -
PC (Crop phase) MI MF MI MF MI MF MI MF MI MF MI MF MI MF MI MF MI MF
1 11 11 6 6 12 12 9 9 11 11 5 5 0 0 0 0 0 0
2 12 12 7 7 1 1 10 10 12 12 6 6 0 0 0 0 0 0
3 1 3 8 11 2 4 11 3 1 3 7 12 1 12 1 12 1 10
4 4 5 0 0 5 8 4 10 4 4 0 0 0 0 0 0 0 0
Table 8: Settings of the C factor for crop rotation 6
Crop rotation 7
Winter crop Soya 2 Winter crop Soya 2 Winter crop Maize 2 Soya 1 Pastura no
consociada
Pastura
establecida
Pastura
establecida
% of soil covered by the
residues of the previous crop
after have sowing the new
crop
50 90 65 90 65 80 60 70 - -
% of soil covered by the
crop leaves in period 3 96 96 96 96 96 - 90 96 - -
% of soils covered by crop
residues in period 4 80 - - - - - - 90 - -
PC (Crop phase) MI MF MI MF MI MF MI MF MI MF MI MF MI MF MI MF MI MF MI MF
1 6 6 12 12 6 6 12 12 6 6 12 12 11 11 5 5 0 0 0 0
2 7 7 1 1 7 7 1 1 7 7 1 1 12 12 6 6 0 0 0 0
3 8 11 2 4 8 11 2 4 8 11 2 4 1 3 7 12 1 12 1 5
4 0 0 5 5 0 0 5 5 0 0 5 10 4 4 0 0 0 0 0 0
Table 9: Settings of the C factor for crop rotation 7
The final C factor value per soil type and crop rotation is resumed in table 10.
C factor value: Soil unit
Young Canada Nieto Bequelo Risso
Crop rotation 1 0,108 0,103 0,103 0,103
Crop rotation 2 0,106 0,099 0,099 0,099
Crop rotation 3 0,079 0,074 0,074 0,074
Crop rotation 4 0,163 0,165 0,165 0,165
Crop rotation 5 0,081 0,073 0,073 0,073
Crop rotation 6 0,086 0,083 0,083 0,083
Crop rotation 7 0,062 0,058 0,058 0,058
Table 10: C factor value (real crop rotation plans)
The conservation practices (P factor) considered in the simulations are:
- N: nothing (the farmer consider keep the stubbles, sod seeding and crop rotation as sufficient measures against
soil erosion). The length of the slope have been set at 500 meters;
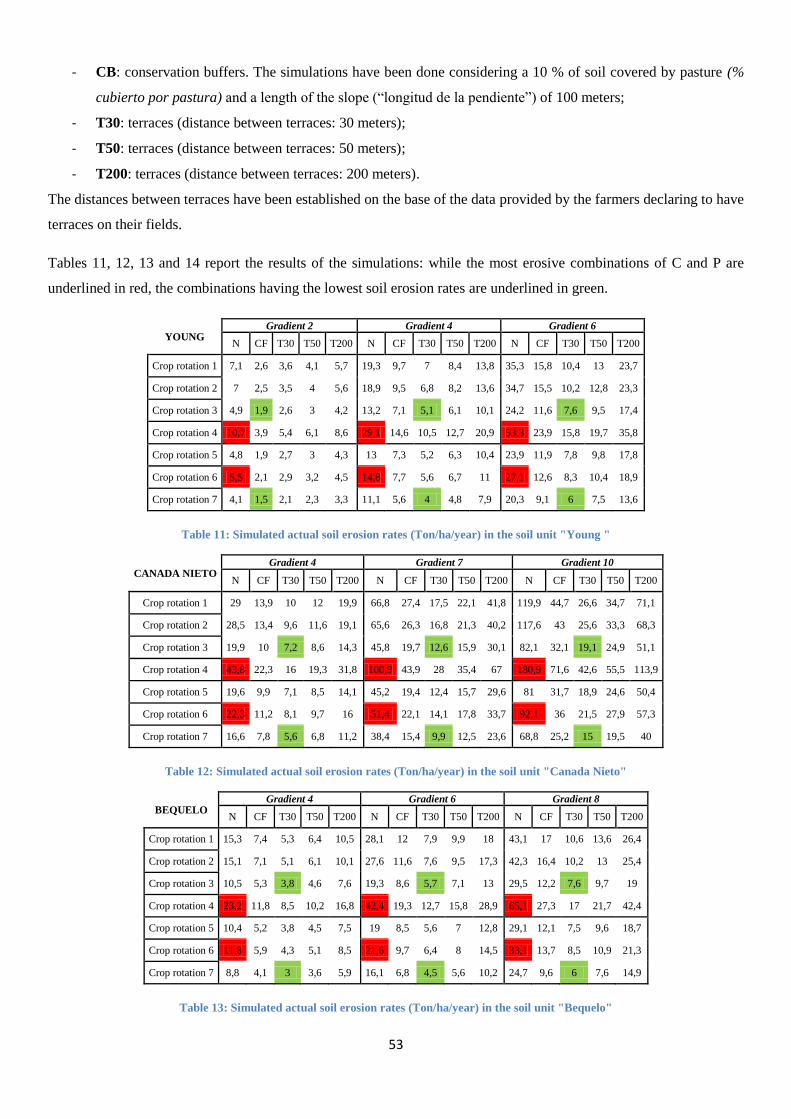
53
- CB: conservation buffers. The simulations have been done considering a 10 % of soil covered by pasture (%
cubierto por pastura) and a length of the slope (“longitud de la pendiente”) of 100 meters;
- T30: terraces (distance between terraces: 30 meters);
- T50: terraces (distance between terraces: 50 meters);
- T200: terraces (distance between terraces: 200 meters).
The distances between terraces have been established on the base of the data provided by the farmers declaring to have
terraces on their fields.
Tables 11, 12, 13 and 14 report the results of the simulations: while the most erosive combinations of C and P are
underlined in red, the combinations having the lowest soil erosion rates are underlined in green.
YOUNG Gradient 2 Gradient 4 Gradient 6
N CF T30 T50 T200 N CF T30 T50 T200 N CF T30 T50 T200
Crop rotation 1 7,1 2,6 3,6 4,1 5,7 19,3 9,7 7 8,4 13,8 35,3 15,8 10,4 13 23,7
Crop rotation 2 7 2,5 3,5 4 5,6 18,9 9,5 6,8 8,2 13,6 34,7 15,5 10,2 12,8 23,3
Crop rotation 3 4,9 1,9 2,6 3 4,2 13,2 7,1 5,1 6,1 10,1 24,2 11,6 7,6 9,5 17,4
Crop rotation 4 10,7 3,9 5,4 6,1 8,6 29,1 14,6 10,5 12,7 20,9 53,3 23,9 15,8 19,7 35,8
Crop rotation 5 4,8 1,9 2,7 3 4,3 13 7,3 5,2 6,3 10,4 23,9 11,9 7,8 9,8 17,8
Crop rotation 6 5,5 2,1 2,9 3,2 4,5 14,8 7,7 5,6 6,7 11 27,1 12,6 8,3 10,4 18,9
Crop rotation 7 4,1 1,5 2,1 2,3 3,3 11,1 5,6 4 4,8 7,9 20,3 9,1 6 7,5 13,6
Table 11: Simulated actual soil erosion rates (Ton/ha/year) in the soil unit "Young "
CANADA NIETO Gradient 4 Gradient 7 Gradient 10
N CF T30 T50 T200 N CF T30 T50 T200 N CF T30 T50 T200
Crop rotation 1 29 13,9 10 12 19,9 66,8 27,4 17,5 22,1 41,8 119,9 44,7 26,6 34,7 71,1
Crop rotation 2 28,5 13,4 9,6 11,6 19,1 65,6 26,3 16,8 21,3 40,2 117,6 43 25,6 33,3 68,3
Crop rotation 3 19,9 10 7,2 8,6 14,3 45,8 19,7 12,6 15,9 30,1 82,1 32,1 19,1 24,9 51,1
Crop rotation 4 43,8 22,3 16 19,3 31,8 100,9 43,9 28 35,4 67 180,9 71,6 42,6 55,5 113,9
Crop rotation 5 19,6 9,9 7,1 8,5 14,1 45,2 19,4 12,4 15,7 29,6 81 31,7 18,9 24,6 50,4
Crop rotation 6 22,3 11,2 8,1 9,7 16 51,4 22,1 14,1 17,8 33,7 92,1 36 21,5 27,9 57,3
Crop rotation 7 16,6 7,8 5,6 6,8 11,2 38,4 15,4 9,9 12,5 23,6 68,8 25,2 15 19,5 40
Table 12: Simulated actual soil erosion rates (Ton/ha/year) in the soil unit "Canada Nieto"
BEQUELO Gradient 4 Gradient 6 Gradient 8
N CF T30 T50 T200 N CF T30 T50 T200 N CF T30 T50 T200
Crop rotation 1 15,3 7,4 5,3 6,4 10,5 28,1 12 7,9 9,9 18 43,1 17 10,6 13,6 26,4
Crop rotation 2 15,1 7,1 5,1 6,1 10,1 27,6 11,6 7,6 9,5 17,3 42,3 16,4 10,2 13 25,4
Crop rotation 3 10,5 5,3 3,8 4,6 7,6 19,3 8,6 5,7 7,1 13 29,5 12,2 7,6 9,7 19
Crop rotation 4 23,2 11,8 8,5 10,2 16,8 42,4 19,3 12,7 15,8 28,9 65,1 27,3 17 21,7 42,4
Crop rotation 5 10,4 5,2 3,8 4,5 7,5 19 8,5 5,6 7 12,8 29,1 12,1 7,5 9,6 18,7
Crop rotation 6 11,8 5,9 4,3 5,1 8,5 21,6 9,7 6,4 8 14,5 33,1 13,7 8,5 10,9 21,3
Crop rotation 7 8,8 4,1 3 3,6 5,9 16,1 6,8 4,5 5,6 10,2 24,7 9,6 6 7,6 14,9
Table 13: Simulated actual soil erosion rates (Ton/ha/year) in the soil unit "Bequelo"
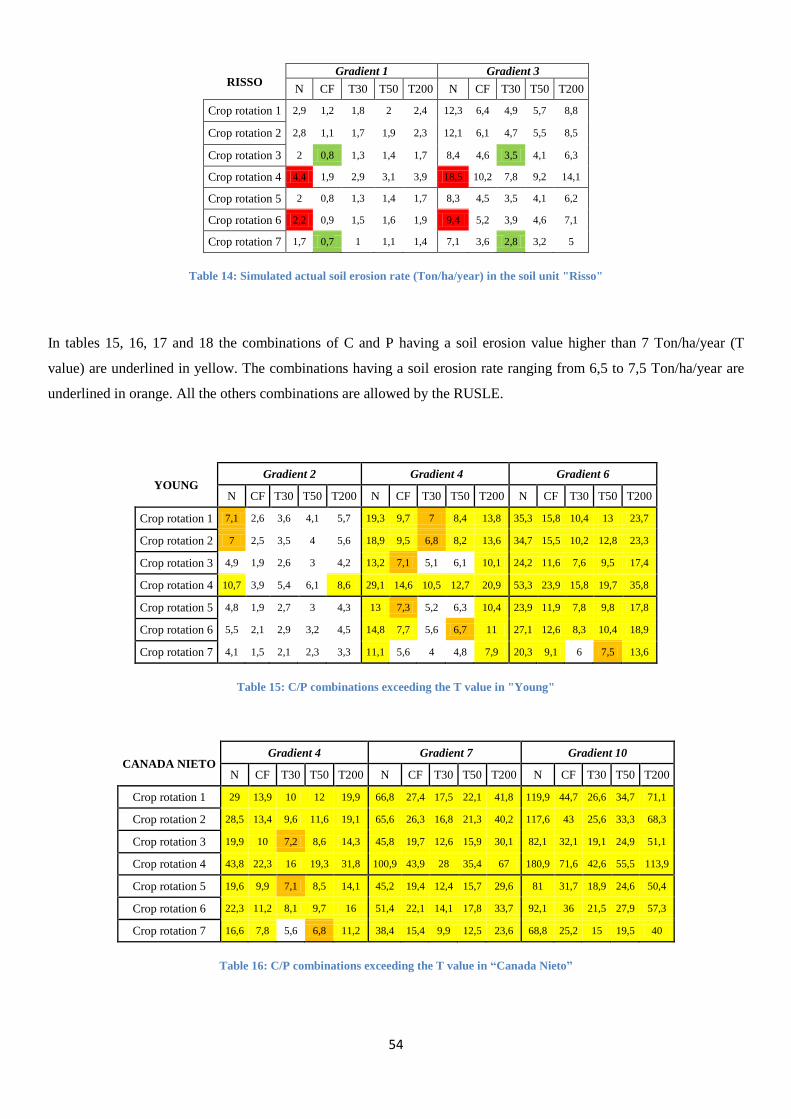
54
RISSO Gradient 1 Gradient 3
N CF T30 T50 T200 N CF T30 T50 T200
Crop rotation 1 2,9 1,2 1,8 2 2,4 12,3 6,4 4,9 5,7 8,8
Crop rotation 2 2,8 1,1 1,7 1,9 2,3 12,1 6,1 4,7 5,5 8,5
Crop rotation 3 2 0,8 1,3 1,4 1,7 8,4 4,6 3,5 4,1 6,3
Crop rotation 4 4,4 1,9 2,9 3,1 3,9 18,5 10,2 7,8 9,2 14,1
Crop rotation 5 2 0,8 1,3 1,4 1,7 8,3 4,5 3,5 4,1 6,2
Crop rotation 6 2,2 0,9 1,5 1,6 1,9 9,4 5,2 3,9 4,6 7,1
Crop rotation 7 1,7 0,7 1 1,1 1,4 7,1 3,6 2,8 3,2 5
Table 14: Simulated actual soil erosion rate (Ton/ha/year) in the soil unit "Risso"
In tables 15, 16, 17 and 18 the combinations of C and P having a soil erosion value higher than 7 Ton/ha/year (T
value) are underlined in yellow. The combinations having a soil erosion rate ranging from 6,5 to 7,5 Ton/ha/year are
underlined in orange. All the others combinations are allowed by the RUSLE.
YOUNG Gradient 2 Gradient 4 Gradient 6
N CF T30 T50 T200 N CF T30 T50 T200 N CF T30 T50 T200
Crop rotation 1 7,1 2,6 3,6 4,1 5,7 19,3 9,7 7 8,4 13,8 35,3 15,8 10,4 13 23,7
Crop rotation 2 7 2,5 3,5 4 5,6 18,9 9,5 6,8 8,2 13,6 34,7 15,5 10,2 12,8 23,3
Crop rotation 3 4,9 1,9 2,6 3 4,2 13,2 7,1 5,1 6,1 10,1 24,2 11,6 7,6 9,5 17,4
Crop rotation 4 10,7 3,9 5,4 6,1 8,6 29,1 14,6 10,5 12,7 20,9 53,3 23,9 15,8 19,7 35,8
Crop rotation 5 4,8 1,9 2,7 3 4,3 13 7,3 5,2 6,3 10,4 23,9 11,9 7,8 9,8 17,8
Crop rotation 6 5,5 2,1 2,9 3,2 4,5 14,8 7,7 5,6 6,7 11 27,1 12,6 8,3 10,4 18,9
Crop rotation 7 4,1 1,5 2,1 2,3 3,3 11,1 5,6 4 4,8 7,9 20,3 9,1 6 7,5 13,6
Table 15: C/P combinations exceeding the T value in "Young"
CANADA NIETO Gradient 4 Gradient 7 Gradient 10
N CF T30 T50 T200 N CF T30 T50 T200 N CF T30 T50 T200
Crop rotation 1 29 13,9 10 12 19,9 66,8 27,4 17,5 22,1 41,8 119,9 44,7 26,6 34,7 71,1
Crop rotation 2 28,5 13,4 9,6 11,6 19,1 65,6 26,3 16,8 21,3 40,2 117,6 43 25,6 33,3 68,3
Crop rotation 3 19,9 10 7,2 8,6 14,3 45,8 19,7 12,6 15,9 30,1 82,1 32,1 19,1 24,9 51,1
Crop rotation 4 43,8 22,3 16 19,3 31,8 100,9 43,9 28 35,4 67 180,9 71,6 42,6 55,5 113,9
Crop rotation 5 19,6 9,9 7,1 8,5 14,1 45,2 19,4 12,4 15,7 29,6 81 31,7 18,9 24,6 50,4
Crop rotation 6 22,3 11,2 8,1 9,7 16 51,4 22,1 14,1 17,8 33,7 92,1 36 21,5 27,9 57,3
Crop rotation 7 16,6 7,8 5,6 6,8 11,2 38,4 15,4 9,9 12,5 23,6 68,8 25,2 15 19,5 40
Table 16: C/P combinations exceeding the T value in “Canada Nieto”
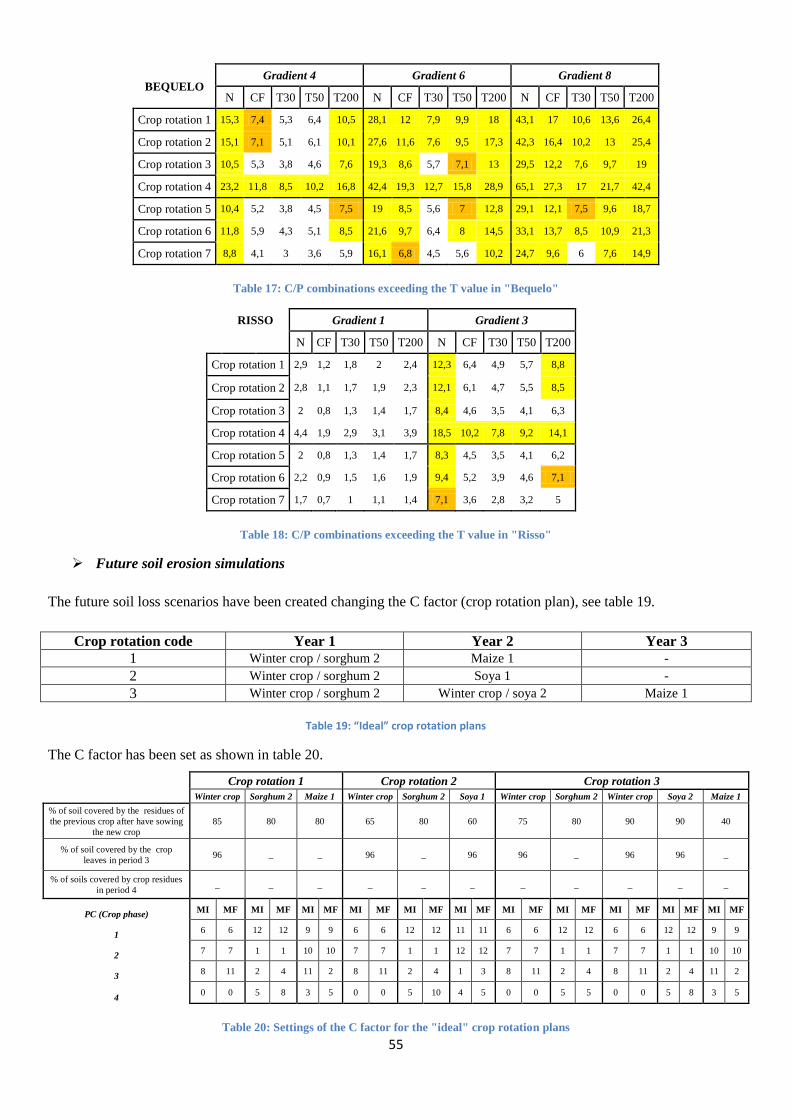
55
BEQUELO Gradient 4 Gradient 6 Gradient 8
N CF T30 T50 T200 N CF T30 T50 T200 N CF T30 T50 T200
Crop rotation 1 15,3 7,4 5,3 6,4 10,5 28,1 12 7,9 9,9 18 43,1 17 10,6 13,6 26,4
Crop rotation 2 15,1 7,1 5,1 6,1 10,1 27,6 11,6 7,6 9,5 17,3 42,3 16,4 10,2 13 25,4
Crop rotation 3 10,5 5,3 3,8 4,6 7,6 19,3 8,6 5,7 7,1 13 29,5 12,2 7,6 9,7 19
Crop rotation 4 23,2 11,8 8,5 10,2 16,8 42,4 19,3 12,7 15,8 28,9 65,1 27,3 17 21,7 42,4
Crop rotation 5 10,4 5,2 3,8 4,5 7,5 19 8,5 5,6 7 12,8 29,1 12,1 7,5 9,6 18,7
Crop rotation 6 11,8 5,9 4,3 5,1 8,5 21,6 9,7 6,4 8 14,5 33,1 13,7 8,5 10,9 21,3
Crop rotation 7 8,8 4,1 3 3,6 5,9 16,1 6,8 4,5 5,6 10,2 24,7 9,6 6 7,6 14,9
Table 17: C/P combinations exceeding the T value in "Bequelo"
RISSO Gradient 1 Gradient 3
N CF T30 T50 T200 N CF T30 T50 T200
Crop rotation 1 2,9 1,2 1,8 2 2,4 12,3 6,4 4,9 5,7 8,8
Crop rotation 2 2,8 1,1 1,7 1,9 2,3 12,1 6,1 4,7 5,5 8,5
Crop rotation 3 2 0,8 1,3 1,4 1,7 8,4 4,6 3,5 4,1 6,3
Crop rotation 4 4,4 1,9 2,9 3,1 3,9 18,5 10,2 7,8 9,2 14,1
Crop rotation 5 2 0,8 1,3 1,4 1,7 8,3 4,5 3,5 4,1 6,2
Crop rotation 6 2,2 0,9 1,5 1,6 1,9 9,4 5,2 3,9 4,6 7,1
Crop rotation 7 1,7 0,7 1 1,1 1,4 7,1 3,6 2,8 3,2 5
Table 18: C/P combinations exceeding the T value in "Risso"
Future soil erosion simulations
The future soil loss scenarios have been created changing the C factor (crop rotation plan), see table 19.
Crop rotation code Year 1 Year 2 Year 3
1 Winter crop / sorghum 2 Maize 1 -
2 Winter crop / sorghum 2 Soya 1 -
3 Winter crop / sorghum 2 Winter crop / soya 2 Maize 1
Table 19: “Ideal” crop rotation plans
The C factor has been set as shown in table 20.
Crop rotation 1 Crop rotation 2 Crop rotation 3
Winter crop Sorghum 2 Maize 1 Winter crop Sorghum 2 Soya 1 Winter crop Sorghum 2 Winter crop Soya 2 Maize 1
% of soil covered by the residues of
the previous crop after have sowing
the new crop
85 80 80 65 80 60 75 80 90 90 40
% of soil covered by the crop
leaves in period 3 96 _ _ 96 _ 96 96 _ 96 96 _
% of soils covered by crop residues
in period 4 _ _ _ _ _ _ _ _ _ _ _
PC (Crop phase) MI MF MI MF MI MF MI MF MI MF MI MF MI MF MI MF MI MF MI MF MI MF
1 6 6 12 12 9 9 6 6 12 12 11 11 6 6 12 12 6 6 12 12 9 9
2 7 7 1 1 10 10 7 7 1 1 12 12 7 7 1 1 7 7 1 1 10 10
3 8 11 2 4 11 2 8 11 2 4 1 3 8 11 2 4 8 11 2 4 11 2
4 0 0 5 8 3 5 0 0 5 10 4 5 0 0 5 5 0 0 5 8 3 5
Table 20: Settings of the C factor for the "ideal" crop rotation plans

56
Attention: Sorghum and Maize have been selecting having a production level of 4500 Kg/year.
The C factor value is reported in table 21.
C factor value: Soil unit
Young Canada Nieto Bequelo Risso
Crop rotation 1 0,076 0,077 0,077 0,077
Crop rotation 2 0,114 0,109 0,109 0,109
Crop rotation 3 0,090 0,090 0,090 0,090
Table 21: C factor values (“ideal” crop rotation plans)
Tables 22, 23, 24 and 25 report the results of the simulations: while the most erosive combinations of C and P are
underlined in red, the combinations having the lowest soil erosion rates are underlined in green.
YOUNG Gradient 2 Gradient 4 Gradient 6
N CF T30 T50 T200 N CF T30 T50 T200 N CF T30 T50 T200
Crop rotation 1 5 1,8 2,5 2,9 4 13,6 6,8 4,9 5,9 9,7 24,8 11,1 7,3 9,2 16,7
Crop rotation 2 7,5 2,7 3,8 4,3 6 20,3 10,2 7,4 8,9 14,6 37,3 16,7 11 13,7 25,1
Crop rotation 3 5,9 2,2 3 3,4 4,7 16,1 8,1 5,8 7 11,5 29,4 13,2 8,7 10,9 19,8
Table 22: Simulated future soil erosion rate (Ton/ha/year) in the soil unit "Young"
CANADA NIETO Gradient 4 Gradient 7 Gradient 10
N CF T30 T50 T200 N CF T30 T50 T200 N CF T30 T50 T200
Crop rotation 1 20,4 10,4 7,5 9 14,9 47 20,5 13,1 16,5 31,3 84,3 33,4 19,9 25,9 53,2
Crop rotation 2 30,6 14,7 10,6 12,7 21 70,5 29 18,5 23,4 44,3 126,5 47,3 28,2 36,7 75,2
Crop rotation 3 24,2 12,2 8,7 10,5 17,4 55,7 23,9 15,3 19,3 36,5 99,9 39,1 23,3 30,3 62,1
Table 23: Simulated future soil erosion rate (Ton/ha/year) in the soil unit "Canada Nieto"
BEQUELO Gradient 4 Gradient 6 Gradient 8
N CF T30 T50 T200 N CF T30 T50 T200 N CF T30 T50 T200
Crop rotation 1 10,8 5,5 4 4,8 7,9 19,8 9 5,9 7,4 13,5 30,3 12,7 7,9 10,1 19,8
Crop rotation 2 16,2 7,8 5,6 6,7 11,1 29,7 12,7 8,4 10,5 19,1 45,5 18 11,2 14,3 28
Crop rotation 3 12,8 6,4 4,6 5,6 9,2 23,4 10,5 6,9 8,6 15,8 35,9 14,9 9,3 11,8 23,1
Table 24: Simulated future soil erosion rate (Ton/ha/year) in the soil unit "Bequelo"
RISSO Gradient 1 Gradient 3
N CF T30 T50 T200 N CF T30 T50 T200
Crop rotation 1 2 0,9 1,4 1,5 1,8 8,6 4,8 3,7 4,3 6,6
Crop rotation 2 3,1 1,2 1,9 2,1 2,6 13 6,8 5,2 6,1 9,3
Crop rotation 3 2,4 1 1,6 1,7 2,1 10,2 5,6 4,3 5 7,7
Table 25: Simulated soil erosion rate (Ton/ha/year) in the soil unit "Risso"
In tables 26, 27, 28 and 29 the combinations of C and P having a soil erosion value higher than 7 Ton/ha/year (T
value) are underlined in yellow. The combinations having a soil erosion rate ranging from 6,5 to 7,5 Ton/ha/year are
underlined in orange. All the others combinations are allowed by the RUSLE.

57
YOUNG Gradient 2 Gradient 4 Gradient 6
N CF T30 T50 T200 N CF T30 T50 T200 N CF T30 T50 T200
Crop rotation 1 5 1,8 2,5 2,9 4 13,6 6,8 4,9 5,9 9,7 24,8 11,1 7,3 9,2 16,7
Crop rotation 2 7,5 2,7 3,8 4,3 6 20,3 10,2 7,4 8,9 14,6 37,3 16,7 11 13,7 25,1
Crop rotation 3 5,9 2,2 3 3,4 4,7 16,1 8,1 5,8 7 11,5 29,4 13,2 8,7 10,9 19,8
Table 26: P/C combinations exceeding the T value in “Young”
CANADA NIETO Gradient 4 Gradient 7 Gradient 10
N CF T30 T50 T200 N CF T30 T50 T200 N CF T30 T50 T200
Crop rotation 1 20,4 10,4 7,5 9 14,9 47 20,5 13,1 16,5 31,3 84,3 33,4 19,9 25,9 53,2
Crop rotation 2 30,6 14,7 10,6 12,7 21 70,5 29 18,5 23,4 44,3 126,5 47,3 28,2 36,7 75,2
Crop rotation 3 24,2 12,2 8,7 10,5 17,4 55,7 23,9 15,3 19,3 36,5 99,9 39,1 23,3 30,3 62,1
Table 27: P/C combinations exceeding the T value in "Canada Nieto"
BEQUELO Gradient 4 Gradient 6 Gradient 8
N CF T30 T50 T200 N CF T30 T50 T200 N CF T30 T50 T200
Crop rotation 1 10,8 5,5 4 4,8 7,9 19,8 9 5,9 7,4 13,5 30,3 12,7 7,9 10,1 19,8
Crop rotation 2 16,2 7,8 5,6 6,7 11,1 29,7 12,7 8,4 10,5 19,1 45,5 18 11,2 14,3 28
Crop rotation 3 12,8 6,4 4,6 5,6 9,2 23,4 10,5 6,9 8,6 15,8 35,9 14,9 9,3 11,8 23,1
Table 28: P/C combinations exceeding the T value in "Bequelo"
RISSO Gradient 1 Gradient 3
N CF T30 T50 T200 N CF T30 T50 T200
Crop rotation 1 2 0,9 1,4 1,5 1,8 8,6 4,8 3,7 4,3 6,6
Crop rotation 2 3,1 1,2 1,9 2,1 2,6 13 6,8 5,2 6,1 9,3
Crop rotation 3 2,4 1 1,6 1,7 2,1 10,2 5,6 4,3 5 7,7
Table 29: P/C combinations exceeding the T value in "Risso"

58
Appendix 3: Agricultural machineries
To support the argumentation on soil compaction and land management in Uruguay, it can be useful to describe some
characteristics of the main machineries used by the farmers. The most sold machineries by John Deere have been
taken as reference. Since the tire pressure changes with the farmer, it is not indicated in this appendix. Nonetheless a
common agricultural machinery usually has a tire pressure around 1,5-2 bar. Please keep in mind that the planter also
fertilizes while sowing. The pictures shown in this appendix are not related to the brand and model described.
Sprayer “Mosquito” (John Deere Mosquito 4730)
Ideal parameters values:
Weight: n.d.
Tire width: 38 cm
Fertilizing machinery (John Deere Tractor Series 8R -8270R- plus the cart)
Ideal parameters values:
Weight: 11.734 kg + weight of the cart
Tractor tire width:
- frontal tires 42 cm (1 wheel)
- back tires 62 cm (2 wheels)
Planter (John Deere Tractor Series 8R -8270R- plus “Plantadora” 1740)
Ideal parameters values:
Weight: 11.734 kg + 7.595 kg
Tractor tires width:
- frontal tires 42 cm (1 wheel)
- back tires 62 cm (2 wheels)
“Plantadora” tires width:
- 40 cm (4 wheels on line)
Harvester (John Deere 9670 STS)
Ideal parameters values:
Weight: 17.515 kg (14.815 kg + 2.700 kg)
Frontal tires width: 80 cm (2 wheels)
Back tires width: 80 cm (1 wheel)
Plane
Ideal parameters values:
Weight: none
Tire width: none
Tire pressure: none
Figure 1: Mosquito
Figure 2: Fertilizing machinery
Figure 3: Planter
Figure 4: Harvester (Agroads, 2004)
Figure 5: Plane

59
Machineries to aerate the soil used against soil compaction and erosion
Paratill
Subsoiler Excentrica
Rastron Chisel (or cincel)
Vibrocultor
Figure 12: Vibrocultor (Siderman, n.d.)
Figure 6: Paratill (Bigham Brothers, 2009) Figure 7: Blade of the paratill (Agroads, 2008)
Figure 9: Excentrica (Nievas, n.d.) Figure 8: Subsoiler (Agriaffaires, 2013)
Figure 10: Rastron (Agriocasion, 2007) Figure 11: Chisel (Mas poco vendo, 2013)
Figure 13: Detail vibrocultor (ACA, n.d.)

60
Machineries to smooth the soil surface
Landplane
Figure 14: Landplane working (TractorByNet, 2012) Figure 15: Landplane (Ratlam Business Guide, 2012)

61
Appendix 4: Agrochemicals
The list of the agrochemicals used by the farmers interviewed on soy and wheat crops is reported in table 30. In the
table are also indicated the Ksp (solubility in water of the product), Koc (chemical sorption by organic carbon) and T1/2
(half-life of the product) values per each product. Moreover the concentration of the product and the DL50 (lethal dose
for 50% of the lab rats population) are reported. All these chemical parameters are useful to estimate the toxicity of the
single agrochemicals and their impact on the environment and human health. According to the data collected,
glyphosate, 2,4 D, methsulfuron-methyl and chlorpyrifos are the most used active ingredients on the field (they are
used in high amounts).
Commercial name Active ingredient Ksp Koc T 1/2 DL50
(mg Kg-1) Concentration Unit of measure
Amina Dow AgroSciences 2,4 D 3 5 2 850 500 gr/lt
Alfatak 10 EC Alpha-cypermethrin 1 2 3 57 100 gr/lt
Allegro Epoxiconazole + 1 3 5 3160 125 gr/lt
Kresoxim-methyl 1 4 2 5000 125 gr/lt
Alystin 480 SC Triflumuron 2 2 2 5000 480 gr/lt
Amistar Xtra Azoxystrobin + 1 4 3 5000 200 gr/lt
Cyproconazole 2 4 4 500 80 gr/lt
Atrazina Dow AgroSciences Atrazine 2 4 3 1537,5 500 gr/lt
Axial 050 EC Cloquintocet-mexyl + 1 3 1 2000 12,5 gr/lt
Pinoxaden 3 4 1 5000 50 gr/lt
Banvel Dicamba 4 5 2 3451 480 gr/lt
Campero 304 SL 2,4 D + 5 4 2 469 240 gr/lt
Picloram 3 5 5 5000 64 gr/lt
Caramba Metconazole 2 5 3 595 90 gr/lt
Clorimuron Calister 75 WG Chlorimuron-ethyl 4 4 2 3600 75 %
Glean Chlorsulfuron 5 5 5 5000 75 %
Connect Beta cyfluthrin + 1 2 2 776 12,5 gr/lt
Imidacloprid 3 4 5 131 100 gr/lt
Coragen Chlorantraniliprole 1 5 5 5000 200 gr/lt
Curyon 550 CE Lufenuron + 2 2 2 150 50 gr/lt
Profenofos 2 3 1 358 500 gr/lt
Cypertec Cypermethrin 1 1 3 287 250 gr/lt
Diflubenzuron 48 Agrin Diflubenzuron 2 2 2 4640 480 gr/lt
Dragon 5 WG Iodosulfuron-methyl-sodium 4 4 4 5000 5 %
+ Mefenpyr 2 4 2 5000 15 %
Thionex 3 EC Endosulfan 1 3 3 130 1060 gr/lt
Engeo 247 SC Lambda-cyhalothrin + 1 2 3 25,6 106 gr/lt
Thiamethoxam 2 2 2 3000 141 gr/lt
Equs-D Deltamethrin + 1 3 3 1000 50 gr/lt
Thiamethoxam 2 2 2 3000 110 gr/lt
Escolta Triflumuron 2 2 2 5000 480 gr/lt
Eskoba Glyphosate 5 1 3 5600 360 gr/lt
Dupont Finesse Chlorsulfuron + 5 5 5 5000 62,5 %
Metsulfuron-methyl 4 5 3 5000 12,5 %
Fiproon 80 WP Fipronil 1 4 4 92 80 %

62
Fullback 80 WDG Triflumuron 2 2 2 5000 80 %
Geonex Lambda-cyhalothrin + 1 2 3 25,6 106 gr/lt
Thiamethoxam 2 2 2 3000 141 gr/lt
Glifotec Glyphosate 5 1 3 5600 360 gr/lt
Gliserb LS o 48 LS Glyphosate 5 1 3 5600 360 gr/lt
Hussar OD Iodosulfuron-methyl-sodium + 4 4 4 5000 100 gr/lt
Mefenpyr 2 4 2 5000 300 gr/lt
Tropero Imazethapyr 2 2 2 5000 70 %
Bagual Imidacloprid 2 2 2 450 350 gr/lt
Inhiquit 48 SC Triflumuron 2 2 2 5000 480 gr/lt
Intrepid SC Methoxyfenozide 2 2 2 5000 240 gr/lt
Karate 50 EC Lambda-cyhalothrin 1 2 3 25,6 50 gr/lt
Lontrel Clopyralid 5 5 3 2675 360 gr/lt
Lorsban 48 E Chlorpyrifos 1 3 3 223 480 gr/lt
Match 050 EC Lufenuron 2 2 2 150 50 gr/lt
Merit OD Cloquintocet-mexyl + 1 3 1 2000 90 gr/lt
Pyroxsulam 4 5 1 2000 45 gr/lt
Metsulfuron 60 FS Metsulfuron-methyl 4 5 3 5000 60 %
Mirenex-Sulf Sulfuramid 1 1 4 534 0,3 %
Nativo 300 SC Tebuconazole + 2 2 2 4000 200 gr/lt
Trifloxystrobin 1 3 1 5000 100 gr/lt
Nomolt SC Teflubenzuron 2 2 2 5000 150 gr/lt
Opera Epoxiconazole + 1 3 5 3160 50 gr/lt
Pyraclostrobin 1 3 3 5000 133 gr/lt
Pampa Glyphosate 5 1 3 5600 360 gr/lt
Panzer Glyphosate 5 1 3 5600 360 gr/lt
Panzer Gold Glyphosate 5 1 3 5600 480 gr/lt
Superquat Paraquat 2 1 5 150 275 gr/lt
Power Rango Glyphosate 5 1 3 5600 500 gr/lt
Prodigy 1.8 EC Abamectin 1 3 5 500 18 gr/lt
Rango NF o 480 Cibeles Glyphosate 5 1 3 5600 360 gr/lt
Roundup Full II Glyphosate 5 1 3 5600 540 gr/lt
Roundup UltraMax Glyphosate 5 1 3 5600 68 %
SphereMax Cyproconazole + 2 4 4 500 160 gr/lt
Trifloxystrobin 1 3 1 5000 375 gr/lt
Spider Diclosulam 2 2 2 5000 84 %
Starane Xtra Fluroxypyr-meptyl 1 2 1 2000 480 gr/lt
Touchdown IQ Glyphosate 5 1 3 5600 500 gr/lt
Treflan Trifluralin 1 3 3 5000 480 gr/lt
Tronador Max Aminopyralid + 4 2 3 5000 88,8 %
Metsulfuron-methyl 4 5 3 5000 60 %
Uppercut Lambda-cyhalothrin + 1 2 3 25,6 106 gr/lt
Thiamethoxam 2 2 2 3000 141 gr/lt
Venceweed Extra 100 2,4 DB 4 4 2 877 93,1 %
Table 30: List of the agrochemicals used by farmers and their chemical properties

63
Appendix 5: Extra graphs
Figure 16: Trend of the fertilization of soya "de primera"
Figure 17: Trend of the yield (promedio in Kg/ha/year) of soya "de primera"

64
Figure 18: Trend of the fertilization of the soya "de segunda"
Figure 19: Trend of the yield (promedio in Kg/ha/year) of soya "de segunda"

65
Figure 20: Trend of the fertilization of wheat
Figure 21: Trend of the yield (promedio in Kg/ha/year) of wheat

66
Figure 22: Ownership of the land per type of investor
Figure 23: Construction of terraces in relation to the ownership of the land
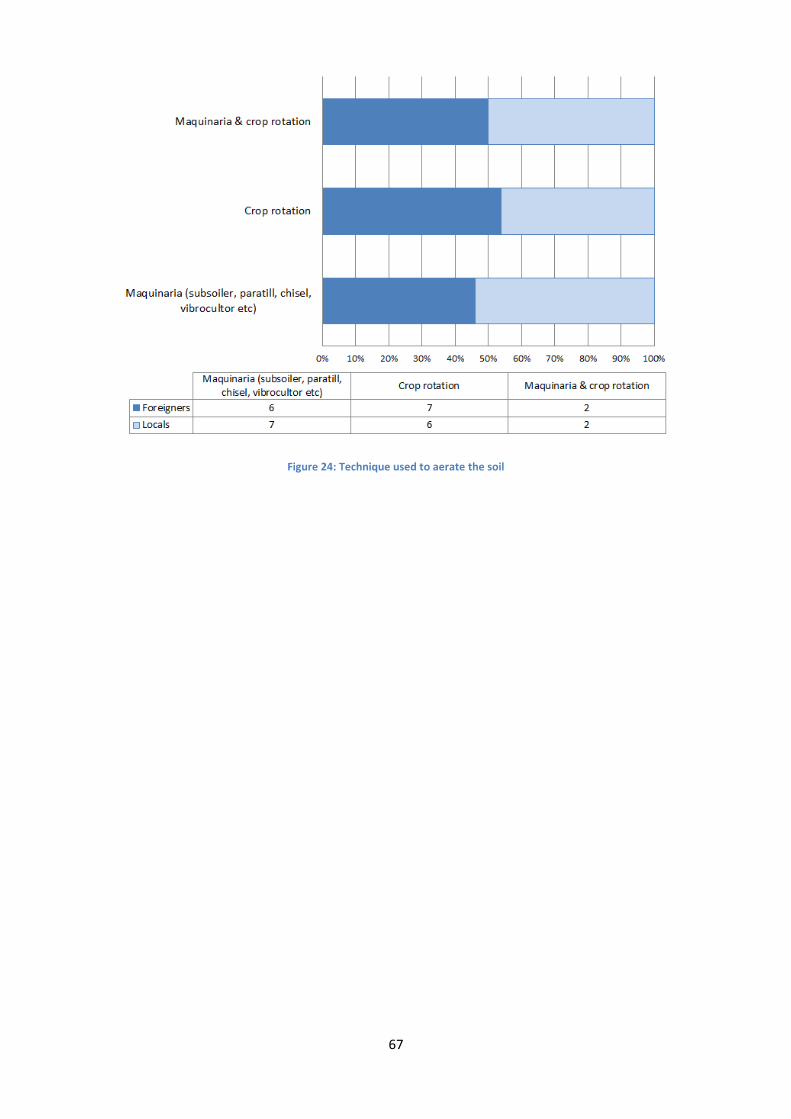
67
Figure 24: Technique used to aerate the soil