laid recipe mixed bituminous material in utility
TRANSCRIPT
Reliability of using air void content for assessing the performance of a handlaid recipe mixed bituminous material in utility reinstatement
Monower Sadique1, a, Hassan Al-Nageim1, b, Karl Stopps2, c
1 Department of Civil Engineering, Liverpool John Moores University, Liverpool, United Kingdom2 Carillion Telent, Warwick, United Kingdom
a [email protected] [email protected]
ABSTRACTResults obtained from this research suggest that due to the method and nature of utility reinstatement construction, thehomogeneity of the asphalt mixtures is likely to be distorted and as a consequence resulting maximum density will be variedwithin the reinstatement. The wide-ranging maximum density reported in every instance in the comparison pair coringexperiments meaningfully rationalizes the distorted homogeneity of materials. Although not only maximum density but also bulkdensity of adjacent cores located only 100 mm apart were found to be varied in the case of every pair in this study. At 95% levelof significance, there exists enough evidence to conclude that, due to high uncertainty, very low repeatability and reproducibilityand poor reliability with high chances of bias, the assessment of hand laid reinstatement work by air void (AV) testing willexpose both the contractor and the client to unacceptable risk.
Keywords:Density, Patching, Performance testing, Testing, Voids
E&E Congress 2016 | 6th Eurasphalt & Eurobitume Congress | 1-3 June 2016 | Prague, Czech Republic

1. Introduction
In 2013, a consortium of 23 members, representing utility undertakers, contractors,
bituminous material suppliers, and a compaction equipment supplier instigated a university
lead research project on utility reinstatement in partnership with Liverpool John Moores
University (LJMU). Membership of the consortium includes representation from the gas,
water, electric and telecommunications sectors in the UK.
Coring (the taking of samples of asphalt materials) programmes of utility reinstatements
initiated by Local Authorities have been identifying consistent failure in respect of air voids
(AV) content in surface course material of footways when assessed against the requirement
of the Specification for the Reinstatement of Openings in Highways (SROH) (Department for
Transport, 2010) for air voids content compliance only. This is an issue which currently
affects all National Joint Utility Group (NJUG) members, presenting a significant and
growing challenge as more Local Authorities apply the SROH air voids content standard to
utility reinstatements.
Initial research focussed on critical analysis of the available published Standards and previous
reinstatements trial results in the UK and the findings resulted in the publication of a white
paper in 2014. The key features of the white paper was accepted as a technical article in a
peer reviewed international journal (Sadique et al., 2015). This enabled the findings to be
disseminated to a wider community, both in the UK and internationally. Among various
findings, one significant outcomes of this initial research was;
The use of air voids content determination on single cores is so inaccurate as to make
compliance largely a matter of chance, as a result of compounding errors in the
measurement of bulk density and maximum density. The use of air voids content
other than for design mixtures, does not comply with UK best practice as outlined in
BS594987: 2010, due to the within mix variability for recipe mixtures and the use of
hand laying as the principal method of installation. The use of a measured in-situ air
voids content criteria in a Specification for Footway reinstatements cannot be
sustained on technical grounds;
In order to further understand whether the current Air Voids criteria is consistently
achievable as per the methodologies within the SROH and to understand if the current AV
compliance criterion in the SROH is able to provide a reliable indication of structural
resilience throughout its service period this second stage research was conducted and the this
paper is reporting the findings. Hence following objectives were identified for further
investigation within this research project:
To identify if AV content varied significantly in a small reinstatement, pairs of cores
were collected by two different independent laboratories from different reported failed
(in terms of AV compliance) reinstatement sites;
E&E Congress 2016 | 6th Eurasphalt & Eurobitume Congress | 1-3 June 2016 | Prague, Czech Republic
Page 2 of 15
To collect and review information from utility undertakers and contractors relating to
in-situ performance of the reinstatement that previously reported failed (in terms of
AV compliance) by the Highways Authority.
The comparison sites for coring were selected in such a way that a range of road categories as
well as differentials in degrees of failure from minor to extensive were examined. The
comparison cores were all taken in close proximity (within 100 mm) to ensure that both cored
test sites had been similarly compacted with similar (almost identical) material. In-situ
performance of a number of reinstatements (footway and carriageway) of varying ages and
varying only non-compliant AV contents were visually inspected by the respective
undertakers/contractors and evidence were collated.
2. Uncertainty and reliability of AV content testing in hand laid reinstatement
The general approach to evaluating and expressing uncertainty in testing outlined in UKAS
publication reference 12 (United Kingdom Accreditation Service, 2000) was based on the
recommendation produced in the guide by the International Bureau of Weights and Measures
(BIPM et al., 2008). Providing a measure of uncertainty that defines an interval about the
measurement result that may be expected to encompass a large fraction of the distribution of
values that could reasonably be attributed to the measurand was stated in this guide.
Moreover, the general requirement for the estimation and reporting of uncertainty of
measurement by all accredited laboratories has been specified with the implementation of the
International Standard ISO/IEC 17025 (Birch, 2003), encompassing a number of influence
quantities that affect the result obtained for the measurand in the case of uncertainty
evaluation process.
To quantify the agreement and reliability of measurements made by any particular method or
observer/s, a repeatability and reproducibility study of that measurement should be
investigated (Bartlett and Frost, 2008). The repeatability and reproducibility interval for
testing air voids content has been specified in the Standard BS EN 12697-8 (European
Committee For Standardization, 2003) by multiplying the respective standard deviation with
2.77. It is similar to the statistical estimate of a 95% confidence interval for the difference
between two readings stated by ASTM Standard (Ullman, 2009). Based on this, the
reproducibility statement for single coring results on identical test material reported by two
laboratories, the air void contents should differ by no more than 2.2% on average on 95% of
occasions (British Standards Institution, 1987, Bartlett and Frost, 2008).
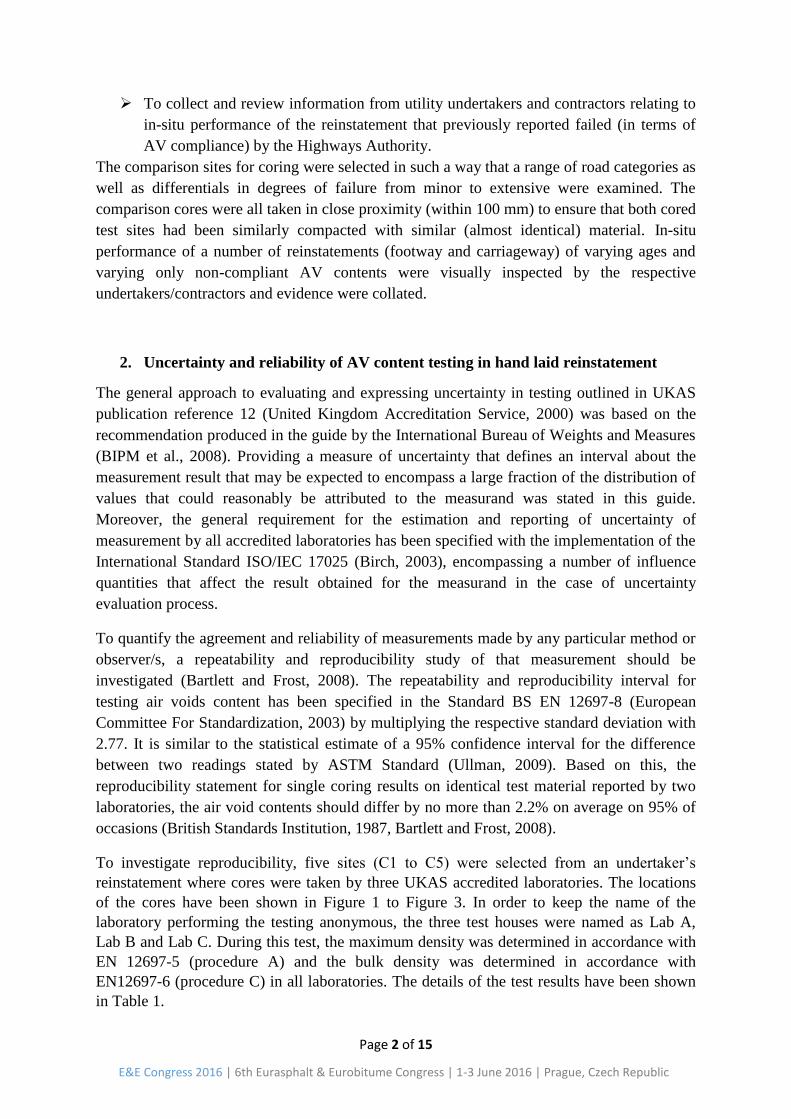
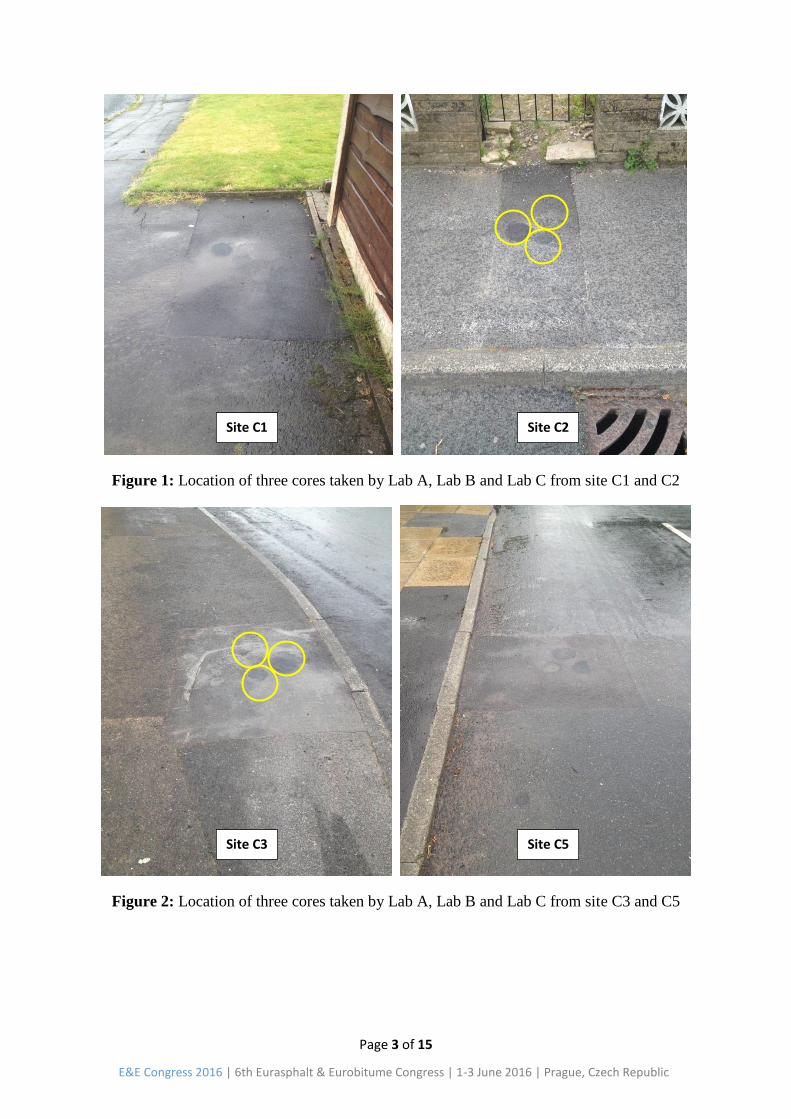
To investigate reproducibility, five sites (C1 to C5) were selected from an undertaker’s
reinstatement where cores were taken by three UKAS accredited laboratories. The locations
of the cores have been shown in Figure 1 to Figure 3. In order to keep the name of the
laboratory performing the testing anonymous, the three test houses were named as Lab A,
Lab B and Lab C. During this test, the maximum density was determined in accordance with
EN 12697-5 (procedure A) and the bulk density was determined in accordance with
EN12697-6 (procedure C) in all laboratories. The details of the test results have been shown
in Table 1.
E&E Congress 2016 | 6th Eurasphalt & Eurobitume Congress | 1-3 June 2016 | Prague, Czech Republic
Page 3 of 15
Figure 1: Location of three cores taken by Lab A, Lab B and Lab C from site C1 and C2
Figure 2: Location of three cores taken by Lab A, Lab B and Lab C from site C3 and C5
Site C1 Site C2
Site C3 Site C5
E&E Congress 2016 | 6th Eurasphalt & Eurobitume Congress | 1-3 June 2016 | Prague, Czech Republic

Page 4 of 15
Figure 3: Location of three cores taken by Lab A, Lab B and Lab C from site C4
Table 1: The core test results obtained from five sites from an undertaker’s reinstatements
Lab A Lab B Lab C
Site
Ref
Reinstatement
Materials
Depth
(mm)
Voids
(%)
Max
(Mg/m3)
Bulk
(Mg/m3)
Depth
(mm)
Voids
(%)
Max
(Mg/m3)
Bulk
(Mg/m3)
Depth
(mm)
Voids
(%)
Max
(Mg/m3)
Bulk
(Mg/m3)
C1 AC6 DSC 69.0 20.7 2.554 2.027 113.0 12.2 2.467 2.165 110.0 15.4 2.472 2.092
C2 AC6 DSC 90.0 19.2 2.564 2.074 95.0 13.2 2.486 2.157 87.5 9.0 2.477 2.255
C3 AC6 DSC 92.0 21.8 2.496 1.953 89.0 6.3 2.39 2.239 90.0 10.7 2.45 2.188
C4 AC6 DSC 53.0 14.7 2.497 2.132 61.0 7.0 2.361 2.195 60.0 10.1 2.406 2.163
C5
AC10 DSC 102.0 15.0 2.561 2.179 80.0 8.0 2.507 2.306 50.0 8.0 2.451 2.254
AC20 DBC 49.0 8.7 2.6 2.375 70.0 5.5 2.543 2.402 105.0 7.0 2.5 2.325
Site C4
E&E Congress 2016 | 6th Eurasphalt & Eurobitume Congress | 1-3 June 2016 | Prague, Czech Republic

Page 5 of 15
The wide variation of results relating to bulk and maximum densities as well as layer depths
obtained from three cores (located approximately 100 mm apart) are evident from Table 1,
although the three test houses followed the same Standards and procedure stated in SROH.
Figure 4: The relation between AV content and layer depth variation
In order to understand the extent of variation between pair of core results, a statistical tool
“paired sample T-Test” was used. The paired sample test results of Lab A-B, Lab B-C and
Lab C-A have been shown in Table 2-4 respectively. It is evident from the t-test results that,
statistically significant, p<0.05 (p = 0.005 and 0.006, t = 4.75 and 4.58) differences of
measured air void were revealed in the case of core results of Lab A-B and Lab A-C when
compared. Furthermore, the 95% confidence interval of the difference lies in the range of
3.6% to 12.3% and 2.9% to 10.3% respectively (as shown in Table 2 and 3). However, non-
significant, p>0.05 (p=0.342, t = 1.05) difference together with a lower range of the 95%
confidence interval of the difference was reported in the case of Lab B-C (Table 4). Figure 4
illustrates no recurring correlation was exists between the variation of layer depth and
corresponding air void content. This intensifies the significance of the reliable difference
values that were observed in the t-test analysis for core results of Lab A-B and Lab A-C.
Table 2: Paired t-test for Laboratory A and B
Paired Differences
t df Significance
(2-tailed)
Mean Standard
Deviation
Standard
Error
Mean
95% Confidence
Interval of the
Differences
Lower Upper
Pair 1
Lab A – Lab B 7.98 4.11 1.68 3.66 12.30 4.75 5 0.005
Table 3: Paired t-test for Laboratory A and C
E&E Congress 2016 | 6th Eurasphalt & Eurobitume Congress | 1-3 June 2016 | Prague, Czech Republic

Page 6 of 15
Paired Differences
t df Significance
(2-tailed)
Mean Standard
Deviation
Standard
Error
Mean
95% Confidence
Interval of the
Differences
Lower Upper
Pair 1
Lab A – Lab C 6.65 3.55 1.45 2.92 10.37 4.58 5 0.006
Table 4: Paired t-test for Laboratory B and C
Paired Differences
t df Significance
(2-tailed)
Mean Standard
Deviation
Standard
Error
Mean
95% Confidence
Interval of the
Differences
Lower Upper
Pair 1
Lab B – Lab C -1.33 3.11 1.27 -4.56 1.93 -1.05 5 0.342
In order to make the analysis more assured and representative, further a total of 68 pairs of
comparison cores were taken (including the above 5 sites) from the reinstatements
constructed by different undertakers within different parts of the country following the same
procedure stated above. In this case, comparisons were made between the cores taken by Lab
A (same as above) and those taken by different laboratories (here termed as Lab X). The
distribution of differences of AV content between the two laboratories in 68 reinstatement
sites was found to be approximately normal as shown in Figure 5.
Figure 5: Histogram of differences in AV content between Lab A and Lab X
E&E Congress 2016 | 6th Eurasphalt & Eurobitume Congress | 1-3 June 2016 | Prague, Czech Republic

Page 7 of 15
The repeatability and reproducibility interval for testing AV content has been specified in the
Standard BS EN 12697-8 (European Committee For Standardization, 2003) is similar to the
statistical estimate of a 95% confidence interval for the difference between two readings
stated by ASTM Standard (Ullman, 2009). Based on this, the reproducibility statement for
single coring result on identical test material reported by two laboratories should differ by no
more than 2.2% on average on 95% of occasions (British Standards Institution, 1987, Bartlett
and Frost, 2008). However, in practice, acceptance (pass or fail against SROH AV content
requirement) are evaluated based on the result from single core.
Table 5: Paired t-test for Laboratory A and X from 68 reinstatement sites
Paired Differences
t df Significance
(2-tailed)
Mean Standard
Deviation
Standard
Error
Mean
95% Confidence
Interval of the
Differences
Lower Upper
Pair 1
Lab A – Lab X 3.36 4.13 0.501 2.36 4.37 6.71 67 0.000
The data from a t-test analysis of the all 68 pairs of cores has been recorded in Table 5. A
closer examination to the “paired sample T-Test” among the pairs taken from 68 different
sites reveals that, not only statistically significant (T = 6.7 and p = 0.000) difference between
the AV content measured by two laboratories exists, but also the range of difference at 95%
confidence level lies between 2.3% to 4.3%.This wide range exceeds the 2.2% reproducibility
limit set by the British Standard. Moreover, acknowledging the proficiency relating to coring
and testing procedures of the UKAS accredited test houses in this research, the extremely low
intra-class correlation coefficient from reliability analysis (as shown in Table 6) of 68 pairs of
air void content results inevitably indicates the poor reliability of the coring method.
Table 6: Intra-class correlation coefficient (ICC) analysis of 68 pairs of AV content for
reliability test
95% Confidence
Interval F Test with True Value 0
Intra-class
Correlation
Lower
Bound
Upper
Bound Value df1 df2 Significance
Single Measures 0.399 0.035 0.640 3.190 67 67 0.000
Average Measures 0.571 0.068 0.780 3.190 67 67 0.000
In order to assess agreement between the measurements and presence of any bias within the
reported AV content results produced by two test houses, a Bland-Altman plot was conducted.
E&E Congress 2016 | 6th Eurasphalt & Eurobitume Congress | 1-3 June 2016 | Prague, Czech Republic
Page 8 of 15
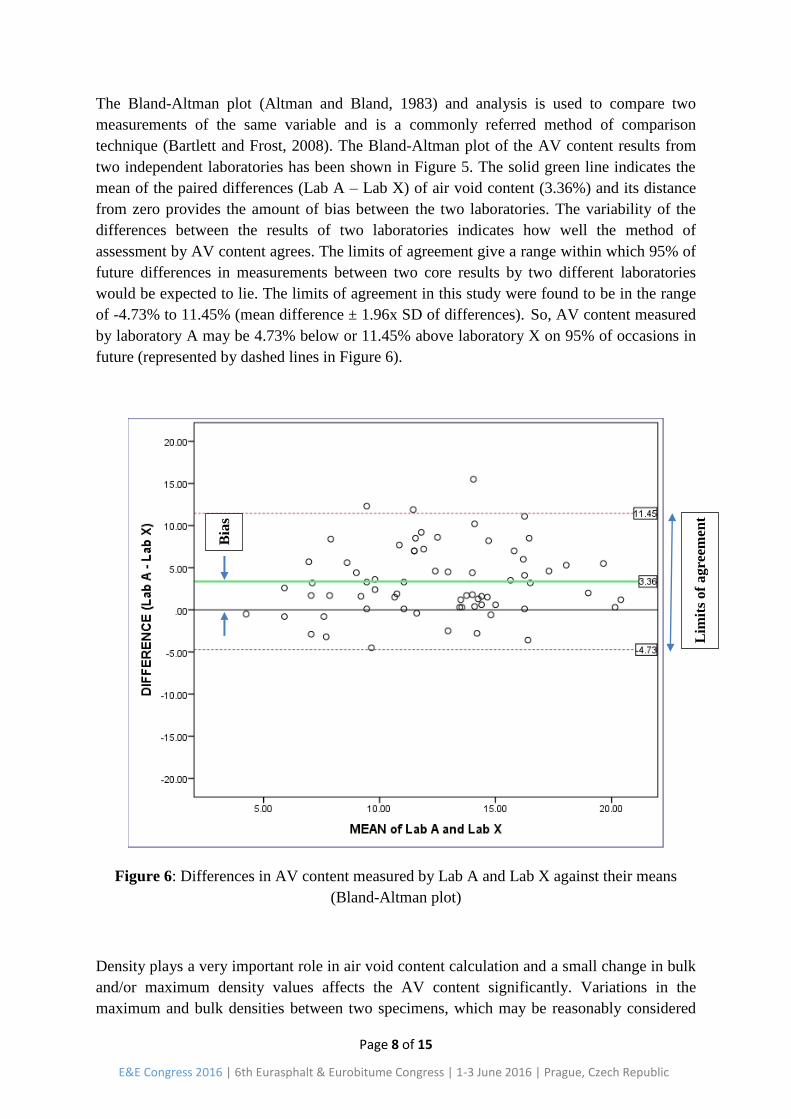
The Bland-Altman plot (Altman and Bland, 1983) and analysis is used to compare two
measurements of the same variable and is a commonly referred method of comparison
technique (Bartlett and Frost, 2008). The Bland-Altman plot of the AV content results from
two independent laboratories has been shown in Figure 5. The solid green line indicates the
mean of the paired differences (Lab A – Lab X) of air void content (3.36%) and its distance
from zero provides the amount of bias between the two laboratories. The variability of the
differences between the results of two laboratories indicates how well the method of
assessment by AV content agrees. The limits of agreement give a range within which 95% of
future differences in measurements between two core results by two different laboratories
would be expected to lie. The limits of agreement in this study were found to be in the range
of -4.73% to 11.45% (mean difference ± 1.96x SD of differences). So, AV content measured
by laboratory A may be 4.73% below or 11.45% above laboratory X on 95% of occasions in
future (represented by dashed lines in Figure 6).
Figure 6: Differences in AV content measured by Lab A and Lab X against their means
(Bland-Altman plot)
Density plays a very important role in air void content calculation and a small change in bulk
and/or maximum density values affects the AV content significantly. Variations in the
maximum and bulk densities between two specimens, which may be reasonably considered
Lim
its
of
agre
emen
t
Bia
s
E&E Congress 2016 | 6th Eurasphalt & Eurobitume Congress | 1-3 June 2016 | Prague, Czech Republic

Page 9 of 15
as the same (100 mm apart in this case) should rarely if ever occur and if they do they should
be such a minimal amount that they do not impact on the integrity of the test results. However,
it was revealed in this research that, in the case of algebraic difference of measured densities
between two test houses, the Lab A measured maximum density values were higher than Lab
X for the same parameter in 88% of cases, whereas in 72% of cases, Lab A measured bulk
density values were lower than Lab X (as shown in Table 7). It was also observed that the
differences (Lab A-Lab X) of densities were not compensating each other when total 68 sites
were considered. As a consequence of this compounding difference of densities, a statistically
significant difference between the AV content measured by two laboratories was revealed in
a t-test analysis and the amount of bias in Bland-Altman analysis was in accordance with this
finding. However, as both test houses were UKAS accredited and followed the same
procedures stated in the relevant British standards and SROH, the absolute difference
between each pair (locating 100 mm apart) were measured as shown in Table 7. Furthermore,
applying “Microsoft Excel Data Solver” tool was employed to investigate the sensitivity of
the results obtained from 68 sites summarised in Table 7. Based on the reported pattern of
differences of maximum and bulk densities, 0.066 Mg/m³ (as close as possible to 0.0644
Mg/m3) decrease of maximum density and 0.057 Mg/m³ (as close as possible to 0.0634 Mg/m3)
increase of bulk density was used during the AV content sensitivity (nearest to one decimal
place) test and the following sensitivity were reported:
Only 0.100 Mg/m³ decrease of maximum density decreases AV by 3.6%
Only 0.100 Mg/m³ increase of bulk density decreases AV by 4.0%
Combined, 0.066 Mg/m³ decrease of maximum density and 0.057 Mg/m³ increase of
bulk density , decreases AV by 4.7%
Table 7: Summary of density measurements from 68 sites measured by Lab A and Lab X.
Lab A – Lab X
Average algebraic
difference
Maximum
Density 0.0576 Mg/m3
In 88% cases, Lab A measured
maximum density values were higher
than Lab B
Average algebraic
difference Bulk Density -0.0321 Mg/m3
In 72% cases, Lab A measured bulk
density values were lower than Lab B
Average absolute
difference
Maximum
Density 0.0644 Mg/m3
Average absolute
difference
Bulk Density 0.0634 Mg/m3
E&E Congress 2016 | 6th Eurasphalt & Eurobitume Congress | 1-3 June 2016 | Prague, Czech Republic
Page 10 of 15
Through implementing the 2nd Edition of the SROH, the Department for Transport introduced
an end result specification (ERS) in place of method specification for assessing asphalt
material. However, the compaction for asphalt material for major road construction in British
Standards BS 594987 (European Committee For Standardization, 2010) is assessed by stating
the following:
“End result compaction shall be applied to designed dense base and binder AC
mixtures which have been type tested in accordance with BS EN 13108-20. A method
of compaction shall be adopted and detailed in a suitable quality plan so as to ensure
that the void content of the finished mat conforms to the required limits on void
content.
NOTE: This method is applicable for works intended to carry heavy traffic. The scale
of works should be such as to justify the cost of testing and control (clause 9.5.1.1).”
Though, the following note has been quoted concerning the compaction of asphalt materials
in BS 594987:
“End result compaction is more appropriate for machine‑laid work on major road
contracts” (clause 9.1).
According to SROH A2.0, the reinstatement work in footways and carriageways is
considered to be carried out in confined or restricted areas. Hence, it is highly anticipated that,
due to the method and nature of utility reinstatement construction (transportation from plant,
unloading, laying and compaction in restricted areas), the homogeneity of the asphalt
mixtures is likely to be distorted and as a consequence resulting maximum density will be
varied within the reinstatement. The wide-ranging maximum density (average difference =
0.0481 Mg/m3) reported in every instance in the above comparison pair coring experiments
also meaningfully rationalizes the distorted homogeneity of materials. Material homogeneity
was also specified as main criteria to consider a spot sample as average sample in relevant
British Standards (European Committee For Standardization, 2001). Although not only
maximum density but also bulk density of adjacent cores located only 100 mm apart were
found to be varied in the case of every pair (average difference = 0.0474 Mg/m3) in this study.
So it can be stated that within a pair of adjacent cores, the variation of maximum density
originates from the distorted material homogeneity whereas, due to intrinsic biasness within
the bulk density testing procedure in the relevant Standard, the bulk density diverges from
each other.
The lack of material homogeneity is very unlikely in the case of any machine‑laid asphalt
work on major construction. Therefore, appropriateness relating to the compliance assessed
only by measuring in-situ AV content using the material and method of construction quoted
in the SROH is not justified. Moreover, the use of air voids content requirement and
associated testing regime for recipe mixed hand laid reinstatement works is acknowledged to
be not totally suitable in the relevant British Standard due to service load (footways), scale of
work (utility reinstatement), nature of construction (hand laid) and material used (recipe
mixed).
E&E Congress 2016 | 6th Eurasphalt & Eurobitume Congress | 1-3 June 2016 | Prague, Czech Republic

Page 11 of 15
Hence, at 95% level of significance, there exists enough evidence to conclude that, due to
high uncertainty, very low repeatability and reproducibility and poor reliability with high
chances of bias, the assessment of hand laid reinstatement work by AV testing will expose
both the contractor and the client to unacceptable risk.
3. In-situ performance of non-compliant AV reinstatement
In-situ performance of a number of reinstatements (footway and carriageway) of varying ages
and varying only non-compliant AV contents were visually inspected by the respective
undertakers/contractors across five various parts of the country (as shown in Figure 8) and
reports were collated. The samples were selected at random and include reinstatements with
air voidage in the range of 14.4% to 25.9% and in-situ performance life was in the range of
1.5 years to 10 years. During this range of assessment period, the UK experienced various
extreme weather events including record rainfall, flood, wettest winter, record low
temperatures, exceptionally heavy snow fall and warmest month on record (Met Office,
2015).
Evidence was collated from approaching 50 sites across various areas of the country and no
visual failures were recorded that would have breached the performance tolerance permitted
by section S2 of SROH. Moreover, in many instances the reinstated area was performing
better than the surrounding highway and none of the reinstatements were found to be inferior
in any respect to the condition of the adjacent surface. Three typical visual in-situ
assessments have been shown in Figure 9 and the location of the reports are available from all
assessments, as are the associated UKAS air void testing certificates (from the original core
tests). Hence the resilience shown during this in-situ performance assessment by these non-
compliant reinstatements across the country in service performance against ageing,
weathering, oxidation, wear and different extreme environmental loading predictably
indicates that either the linkage between the reinstatement with non-compliant AV and its
impact on footways durability is non-proven or the reported AV content is extremely over
estimated.
E&E Congress 2016 | 6th Eurasphalt & Eurobitume Congress | 1-3 June 2016 | Prague, Czech Republic

Page 12 of 15
Figure 8: Location of visually assessed in-situ performance of reinstatement across the UK
Figure 9: Visual in-situ performance of different reinstatement containing non-compliant AV
5
Carriageway Footway Footway
E&E Congress 2016 | 6th Eurasphalt & Eurobitume Congress | 1-3 June 2016 | Prague, Czech Republic

Page 13 of 15
4. UKAS Position Statement
Based on the above findings, this research forwarded a letter to the Technical Advisory
Committee for Construction Industry in UKAS requesting their thoughts on the issues
outlined above with focus on the inconstancies highlighted within UKAS accredited
providers. Accordingly a two team delegate from UKAS visited Liverpool John Moores
University on 14th January 2016 and the research team shared the research findings as stated
in this report above. After the discussion on the above findings from this research, the UKAS
Technical Advisory Committee provided the following statement focusing the unreliability of
air void testing for reinstatement works:
“A representative core sample taken and subjected to testing by a UKAS an accredited
laboratory in accordance with BS EN 12697 for hand laid recipe mixtures may only provide
confidence in the sample tested meeting the requirements of the Specification for
Reinstatement of Openings in Highways, and may therefore not be considered for the
integrity in conformity of the whole reinstatement. In contrast, machine laid work is
generally homogeneous and so the analysis of a single core is may provide a result that is
representative of the material in the whole reinstatement than would be the case for hand laid
material. However, whatever the method of laying, test results can only accurately represent
the sample that has been analysed and cannot validly be used to represent the composition of
adjacent material” (Giles and Chapman, 2016).
5. Conclusion
The comparison pairs of cores (each 100mm apart) from 68 reinstatements sites from various
parts of the UK revealed that, the compounding consequences of generic non-homogeneous
characteristics of hand laid recipe mixed materials and high likeliness of being biased during
AV testing makes the coring method extremely unreliable with very low repeatability and
reproducibility. The position statement provided by UKAS technical committee (as reported
in the previous section) also absolutely in accordance with the above findings (distorted
homogeneity of hand laid recipe mixed material).
Furthermore, the in-situ performance shown by from 50 reinstatements after experiencing 1.5
years to 10 years real life aging from various parts of the UK predictably indicates that either
the linkage between the reinstatement with non-compliant AV and its impact on footways
durability is non-proven or the reported AV content is extremely over estimated. The
resilience shown by the non-compliant AV content reinstatement to withstand structural
loading as well as extreme environmental loading beyond the guarantee period across the
country validates the above finding.
It is envisaged that numerous reinstatements will have to be reworked based on an assessment
method which is itself not only unreliable but also suffering from non-compliant precision
relating to the British Standards. The revealed inherent embedded biasness as well as
E&E Congress 2016 | 6th Eurasphalt & Eurobitume Congress | 1-3 June 2016 | Prague, Czech Republic

Page 14 of 15
unreliability of current assessment method of SROH, for a hand laid bituminous work where
non-homogenous materials are likely, situating both the contractor and the client at
unacceptable risk and costing utilities, contractors and the community without any additional
benefit in performance.
A specification should be realistic, practical, and sustainable and be able to predict
performance. The current specification for a hand laid recipe mixed material based upon
coring for air void content, fails on all of these basic requirements. It could lead to a very
wide range of unpredicted outcomes, putting both the contractor and the client at
unacceptable risk.
6. Acknowledgements
The authors wish to thank the National Joint Utilities Group (NJUG) and consortium
members who provided invaluable support to this research project during the study. Their
support is thankfully acknowledged.
References
ALTMAN, D. G. & BLAND, J. M. 1983. Measurement in medicine: the analysis of method comparison studies. The statistician, 307-317.
BARTLETT, J. & FROST, C. 2008. Reliability, repeatability and reproducibility: analysis of measurement errors in continuous variables. Ultrasound in Obstetrics & Gynecology, 31, 466-475.
BIPM, IEC, IFCC, ILAC, ISO, IUPAC, IUPAP & OIML 2008. Evaluation of measurement Data-Guide to the expression of uncertainty in measurement-JCGM 100:2008. Joint Committee for Guides in Metrology.
BIRCH, K. 2003. Estimating Uncertainties in Testing - An Intermediate Guide to Estimating and Reporting Uncertainty of Measurement in Testing, Measurement Good Practice Guide No. 36. Middlesex: British Measurement and Testing Association.
BRITISH STANDARDS INSTITUTION 1987. Precision of test methods-Part 1: Guide for the determination of repeatability and reproducibility for a standard test method by inter-laboratory tests - BS 5497-1: 1987.
DEPARTMENT FOR TRANSPORT 2010. Specification for the Reinstatement of Openings in Highways (SROH), 3rd Edition. The Stationery Office (TSO).
EUROPEAN COMMITTEE FOR STANDARDIZATION 2001. Bituminous mixtures -Test methods for hot mix asphalt, Part 27: Sampling, BS EN 12697-27:2001.
EUROPEAN COMMITTEE FOR STANDARDIZATION 2003. Bituminous mixtures -Test methods for hot mix asphalt : Part 8: Determination of void characteristics of bituminous specimens, BS EN 12697-8:2003. Brussels: British Standards Institutions.
E&E Congress 2016 | 6th Eurasphalt & Eurobitume Congress | 1-3 June 2016 | Prague, Czech Republic

Page 15 of 15
EUROPEAN COMMITTEE FOR STANDARDIZATION 2010. Asphalt for roads and other paved areas – Specification for transport, laying, compaction and type testing protocols, BS 594987:2010. London: British Standard Insititution.
GILES, S. & CHAPMAN, P. 2016. United Kingdom Accreditation Service (UKAS) Statement Regarding Core Samples to BS EN 12697.
MET OFFICE. 2015. Historical Weather [Online]. Available: http://www.metoffice.gov.uk/learning/library/publications/historical-facts [Accessed 01/06/2015 2015].
SADIQUE, M., AL-NAGEIM, H. & STOPPS, K. 2015. To investigate the fundamental causes of utility air voids content failures in asphalt layers to achieve Specification for the Reinstatement of Openings in Highways (SROH) compliant performance. Construction and Building Materials, 93, 595-607.
ULLMAN, N. 2009. What Are Repeatability and Reproducibility? Part 2: The E11 Viewpoint. Magazines & Newsletters / ASTM Standardization News
UNITED KINGDOM ACCREDITATION SERVICE 2000. The Expression of Uncertainty in Testing. Middlesex: UKAS.
E&E Congress 2016 | 6th Eurasphalt & Eurobitume Congress | 1-3 June 2016 | Prague, Czech Republic