laguna irrigation district 2015 update agricultural … irrigation district 2015 update agricultural...
TRANSCRIPT
Laguna Irrigation District
2015 UpdateAgricultural Water Management Plan
Update Prepared Pursuant to Water Code Section 10826 and Executive Order B-29-15
Laguna Irrigation District5065 19 1/2 AvenueRiverdale, CA 93656
Phone (559) 923-4239
Adopted January 22, 2016
Board of DirectorsFrank Zonneveld, President
John Oliveira, Vice PresidentTony Thomas, Secretary/Treasurer
Jake MillerScot Goble
District RepresentativeScott Sills, General Manager
i
Index
Section 1: Plan Preparation and Adoption ................................................................ 1
Section 2: Description of the Agricultural Water Supplier and Service Area ............ 3
Section 3 Description of Quantity of Water Uses
of the Agricultural Water Supplier ......................................................... 10
Section 4: Description of Quantity and Quality of the Water Resources
of the Agricultural Water Supplier ...........................................................15
Section 5: Water Accounting and Water Supply Reliability ..................................... 21
Section 6: Climate Change ....................................................................................... 24
Section 7: Drought Management Plan .................................................................... 31
Section 8: Water Use Efficiency Information ........................................................... 32
Section 9: Supporting Documentation
Public Notice ........................................................................................ SD-1
Notice to Kings County ......................................................................... SD-2
Notice to Fresno County ...................................................................... SD-3
Resolution 16-01 .................................................................................. SD-4
Hydrologic Soils Map ........................................................................... SD-5
Rules and Regulations .......................................................................... SD-6
Resolution 14-07 certifying Prop 18 election results ........................ SD-17
Water Order Forms ............................................................................ SD-19
Meter Maintenance Program ............................................................ SD-21
Meter Test Records ............................................................................ SD-23

1
Section 1: Plan Preparation and Adoption
A. Description of Previous Water Management Activities
This Agricultural Water Management Plan (AWMP) represents the first update to the 2012 Planprepared by Laguna Irrigation District (District) to comply with the requirements of SB X7-7 (theWater Conservation Act of 2009). The District has, however, been involved in other watermanagement efforts throughout the years as noted below.
In 1992, the District adopted an AB 1658 Groundwater Management Plan
In 1993, the District prepared an AB 255 Groundwater Management Plan
In 2005, the District participated in the preparation of an SB 1938 Groundwater ManagementPlan, which was adopted.
In 2012, the District prepared and submitted the “2012 Agricultural Water Management Plan” incompliance with SB X7-7. The 2012 report concluded that the District had fully implemented allof the critical and applicable conditional EWMPs.
The purposes for preparing the 2015 update to the 2012 Plan for the District are to:1. Incorporate the requirements from the Governor’s April 1, 2015 Executive Order (B-29-
15) to include in the AWMP a drought management plan in addition to quantification ofwater supplies and demands for the 2013, 2014, and 2015 years to the extent data isavailable.
2. Continue to evaluate the District’s water management practices.3. Identify areas to improve the efficiency of water use within the District.4. Consider past and future water management strategies to increase the reliability of
water deliveries to the District.
B. Coordination Activities
1. Notification of AWMP Preparation
Interested Parties:
County of KingsDate of Notification of Plan Preparation: January 6, 2016Notice attached in Section 9: Supporting Documents.
Copy of Adopted Plan Date Sent: January 25, 2016
County of FresnoDate of Notification of Plan Preparation: January 6, 2016Notice attached in Section 9: Supporting Documents.
Copy of Adopted Plan Date Sent: January 25, 2016
Local Newspaper:
Hanford SentinelNotification of Public Meeting Published January 8, 2016, and January 15, 2016, noticingthat the “DRAFT” updated AWMP was available at District Office for public review on

2
January 8, 2016, with a Hearing to be held on January 22, 2016, at 9:30 am at the samelocation.
Notification of Public Meeting is attached in Section 9: Supporting Documents.
C. Plan Adoption
At a hearing on January 22, 2016, The Laguna Board of Directors adopted the AWMP.A copy of the Resolution is attached in Section 9: Supporting Documents.

3
Section 2: Description of the Agricultural Water Supplier and Service Area
History of the District:
A public agency, the Laguna Irrigation District was formed in 1920 and serves an area of southernFresno County and northern Kings County west of Laton and south, southeast and southwest ofRiverdale. The service area includes a substantial portion of the historic Laguna de Tache Land Grant.The District's southerly boundary is generally along the South Fork of the Kings River. Laguna IrrigationDistrict has multiple points of diversion that supply the Grant Canal, A Ditch, Island Canal and SummitLake Ditch.
Laguna Irrigation District’s surface water supply is from the Kings River, with approximately 56,000 acrefeet of storage at Pine Flat Reservoir and other reservoirs in the Kings River Watershed. Due to thelimited ability to store water, the Kings River water users depend upon storage in the Sierra NevadaMountains in the form of snow to capture surface water that then melts in the spring and summermonths when water requirements increase.
Historically, in flood years where surface water is abundant, the Laguna Irrigation District takesadvantage of that available water and recharges as much as possible in groundwater storage forsubsequent dry years. The District owns and operates six regulation/recharge reservoirs where watercan be captured and banked as groundwater or temporarily held and reused as surface water.
Due to the unpredictable nature of Laguna Irrigation District’s surface water supply, it is necessary topoint out that conjunctive use is a very important part of District operations. The District does notoperate any groundwater wells, but its landowners use their own groundwater wells to supply waterfor their crop needs when surface water supplies are not available.
The plan document will demonstrate that the District is very unique in the Lower Kings River Sub-Basinbecause its groundwater supply is fairly stable. Due to the proximity to the Kings River and permeablesoils within the District, it is possible to replenish subsurface storage in wet years after drought cycles.
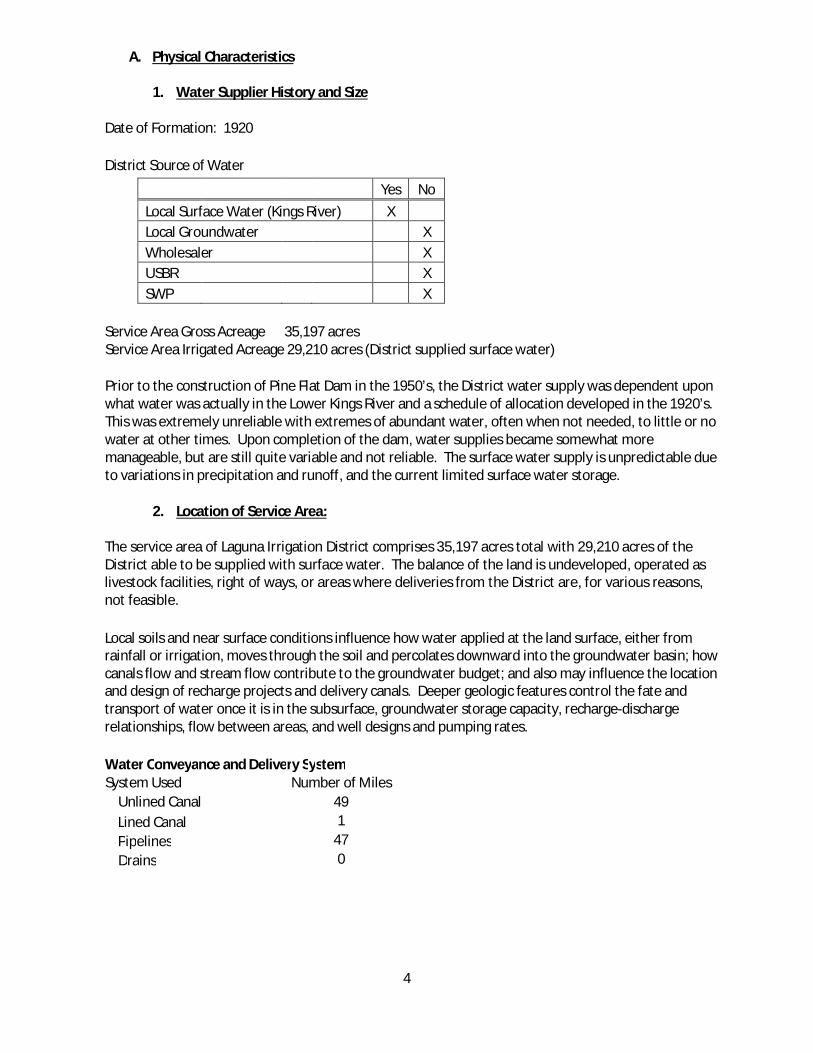
The District is also exceptional in that it has a very extensive distribution system consisting of about 50miles of open canals and 47 miles of pipeline. Due to the placement of the delivery system,approximately 86 percent of the District can be supplied with surface water.
4
A. Physical Characteristics
1. Water Supplier History and Size
Date of Formation: 1920
District Source of Water
Yes NoLocal Surface Water (Kings River) XLocal Groundwater XWholesaler XUSBR XSWP X
Service Area Gross Acreage 35,197 acresService Area Irrigated Acreage 29,210 acres (District supplied surface water)
Prior to the construction of Pine Flat Dam in the 1950’s, the District water supply was dependent uponwhat water was actually in the Lower Kings River and a schedule of allocation developed in the 1920’s.This was extremely unreliable with extremes of abundant water, often when not needed, to little or nowater at other times. Upon completion of the dam, water supplies became somewhat moremanageable, but are still quite variable and not reliable. The surface water supply is unpredictable dueto variations in precipitation and runoff, and the current limited surface water storage.
2. Location of Service Area:
The service area of Laguna Irrigation District comprises 35,197 acres total with 29,210 acres of theDistrict able to be supplied with surface water. The balance of the land is undeveloped, operated aslivestock facilities, right of ways, or areas where deliveries from the District are, for various reasons,not feasible.
Local soils and near surface conditions influence how water applied at the land surface, either fromrainfall or irrigation, moves through the soil and percolates downward into the groundwater basin; howcanals flow and stream flow contribute to the groundwater budget; and also may influence the locationand design of recharge projects and delivery canals. Deeper geologic features control the fate andtransport of water once it is in the subsurface, groundwater storage capacity, recharge-dischargerelationships, flow between areas, and well designs and pumping rates.
Water Conveyance and Delivery SystemSystem Used Number of Miles Unlined Canal 49
Lined Canal 1Pipelines 47Drains 0
5
6
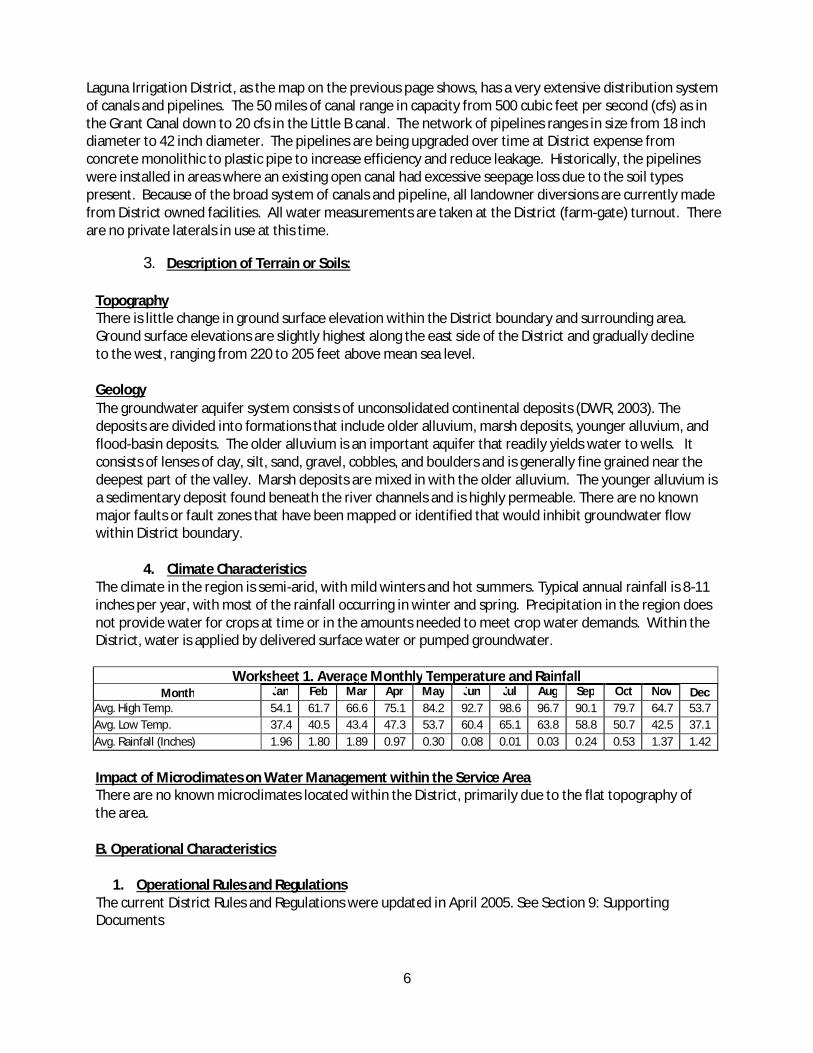
Laguna Irrigation District, as the map on the previous page shows, has a very extensive distribution systemof canals and pipelines. The 50 miles of canal range in capacity from 500 cubic feet per second (cfs) as inthe Grant Canal down to 20 cfs in the Little B canal. The network of pipelines ranges in size from 18 inchdiameter to 42 inch diameter. The pipelines are being upgraded over time at District expense fromconcrete monolithic to plastic pipe to increase efficiency and reduce leakage. Historically, the pipelineswere installed in areas where an existing open canal had excessive seepage loss due to the soil typespresent. Because of the broad system of canals and pipeline, all landowner diversions are currently madefrom District owned facilities. All water measurements are taken at the District (farm-gate) turnout. Thereare no private laterals in use at this time.
3. Description of Terrain or Soils:
TopographyThere is little change in ground surface elevation within the District boundary and surrounding area.Ground surface elevations are slightly highest along the east side of the District and gradually declineto the west, ranging from 220 to 205 feet above mean sea level.
GeologyThe groundwater aquifer system consists of unconsolidated continental deposits (DWR, 2003). Thedeposits are divided into formations that include older alluvium, marsh deposits, younger alluvium, andflood-basin deposits. The older alluvium is an important aquifer that readily yields water to wells. Itconsists of lenses of clay, silt, sand, gravel, cobbles, and boulders and is generally fine grained near thedeepest part of the valley. Marsh deposits are mixed in with the older alluvium. The younger alluvium isa sedimentary deposit found beneath the river channels and is highly permeable. There are no knownmajor faults or fault zones that have been mapped or identified that would inhibit groundwater flowwithin District boundary.
4. Climate CharacteristicsThe climate in the region is semi-arid, with mild winters and hot summers. Typical annual rainfall is 8-11inches per year, with most of the rainfall occurring in winter and spring. Precipitation in the region doesnot provide water for crops at time or in the amounts needed to meet crop water demands. Within theDistrict, water is applied by delivered surface water or pumped groundwater.
Worksheet 1. Average Monthly Temperature and RainfallMonth Jan Feb Mar Apr May Jun Jul Aug Sep Oct Nov Dec
Avg. High Temp. 54.1 61.7 66.6 75.1 84.2 92.7 98.6 96.7 90.1 79.7 64.7 53.7Avg. Low Temp. 37.4 40.5 43.4 47.3 53.7 60.4 65.1 63.8 58.8 50.7 42.5 37.1Avg. Rainfall (Inches) 1.96 1.80 1.89 0.97 0.30 0.08 0.01 0.03 0.24 0.53 1.37 1.42
Impact of Microclimates on Water Management within the Service AreaThere are no known microclimates located within the District, primarily due to the flat topography ofthe area.
B. Operational Characteristics
1. Operational Rules and RegulationsThe current District Rules and Regulations were updated in April 2005. See Section 9: SupportingDocuments
7
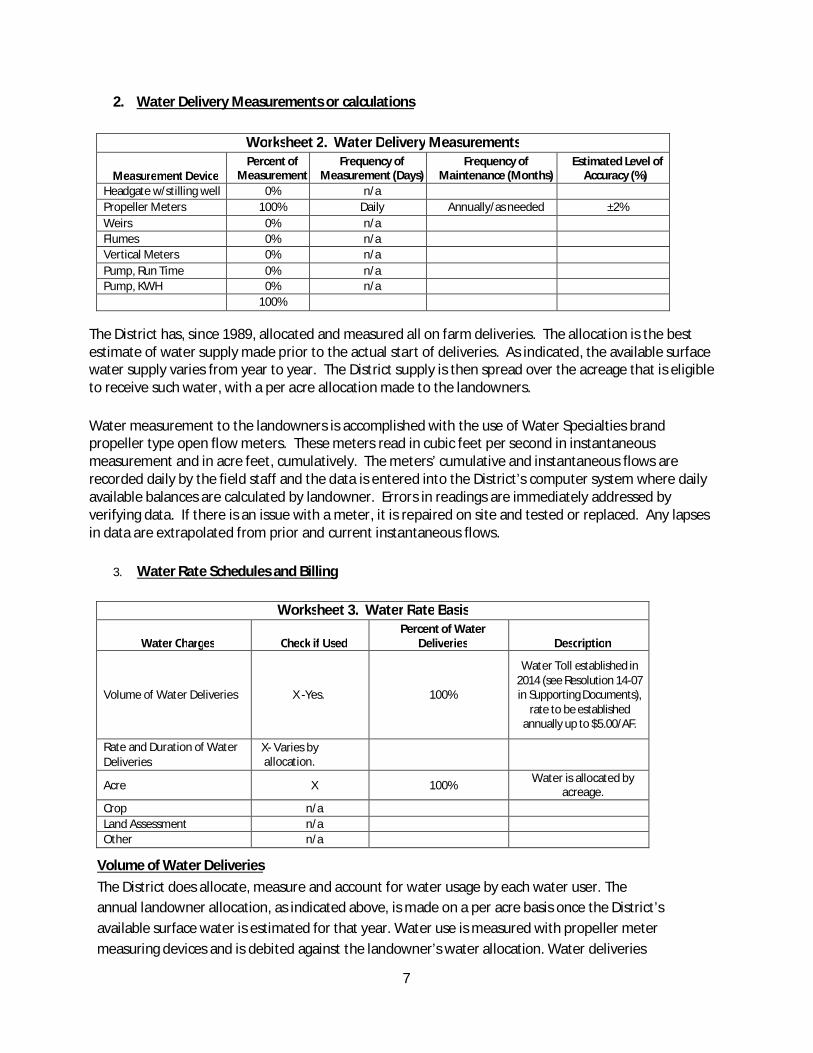
2. Water Delivery Measurements or calculations
Worksheet 2. Water Delivery Measurements
Measurement DevicePercent of
MeasurementFrequency of
Measurement (Days)Frequency of
Maintenance (Months)Estimated Level of
Accuracy (%)Headgate w/stilling well 0% n/aPropeller Meters 100% Daily Annually/as needed ±2%Weirs 0% n/aFlumes 0% n/aVertical Meters 0% n/aPump, Run Time 0% n/aPump, KWH 0% n/a
100%
The District has, since 1989, allocated and measured all on farm deliveries. The allocation is the bestestimate of water supply made prior to the actual start of deliveries. As indicated, the available surfacewater supply varies from year to year. The District supply is then spread over the acreage that is eligibleto receive such water, with a per acre allocation made to the landowners.
Water measurement to the landowners is accomplished with the use of Water Specialties brandpropeller type open flow meters. These meters read in cubic feet per second in instantaneousmeasurement and in acre feet, cumulatively. The meters’ cumulative and instantaneous flows arerecorded daily by the field staff and the data is entered into the District’s computer system where dailyavailable balances are calculated by landowner. Errors in readings are immediately addressed byverifying data. If there is an issue with a meter, it is repaired on site and tested or replaced. Any lapsesin data are extrapolated from prior and current instantaneous flows.
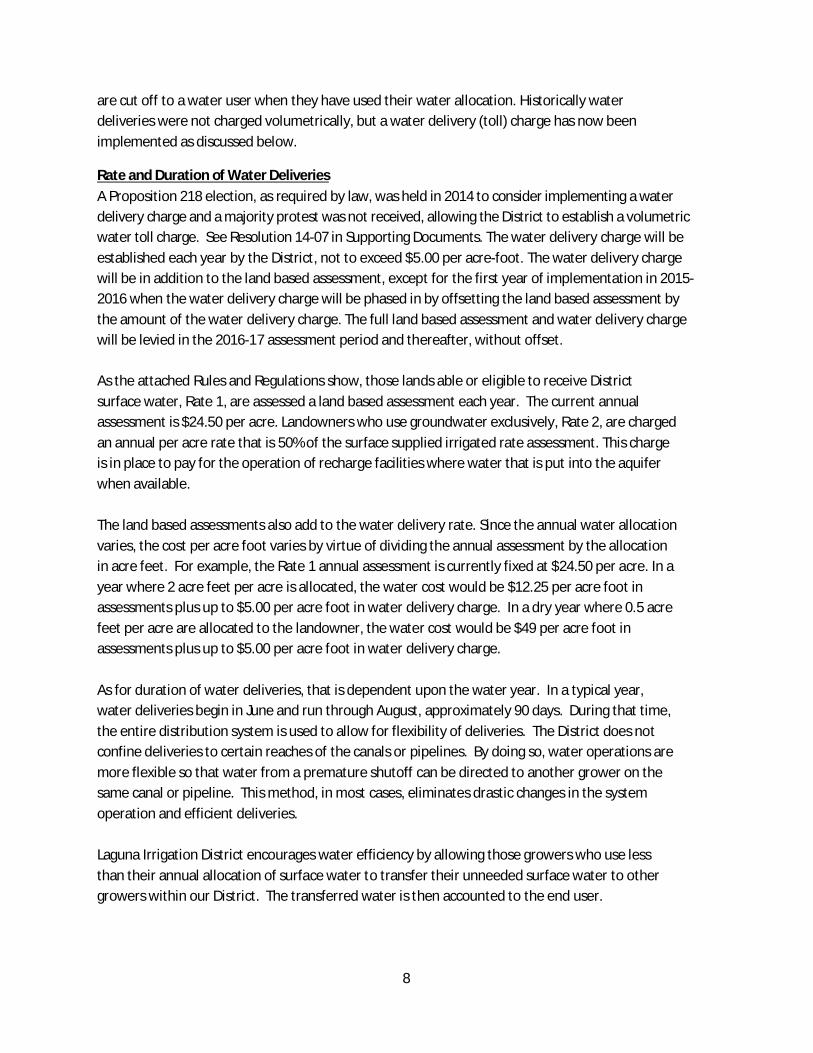
3. Water Rate Schedules and Billing
Worksheet 3. Water Rate Basis
Water Charges Check if UsedPercent of Water
Deliveries Description
Volume of Water Deliveries X -Yes. 100%
Water Toll established in2014 (see Resolution 14-07in Supporting Documents),
rate to be establishedannually up to $5.00/AF.
Rate and Duration of WaterDeliveries
X- Varies byallocation.
Acre X 100% Water is allocated byacreage.
Crop n/aLand Assessment n/aOther n/a
Volume of Water DeliveriesThe District does allocate, measure and account for water usage by each water user. Theannual landowner allocation, as indicated above, is made on a per acre basis once the District’savailable surface water is estimated for that year. Water use is measured with propeller metermeasuring devices and is debited against the landowner’s water allocation. Water deliveries
8
are cut off to a water user when they have used their water allocation. Historically waterdeliveries were not charged volumetrically, but a water delivery (toll) charge has now beenimplemented as discussed below.
Rate and Duration of Water DeliveriesA Proposition 218 election, as required by law, was held in 2014 to consider implementing a waterdelivery charge and a majority protest was not received, allowing the District to establish a volumetricwater toll charge. See Resolution 14-07 in Supporting Documents. The water delivery charge will beestablished each year by the District, not to exceed $5.00 per acre-foot. The water delivery chargewill be in addition to the land based assessment, except for the first year of implementation in 2015-2016 when the water delivery charge will be phased in by offsetting the land based assessment bythe amount of the water delivery charge. The full land based assessment and water delivery chargewill be levied in the 2016-17 assessment period and thereafter, without offset.
As the attached Rules and Regulations show, those lands able or eligible to receive Districtsurface water, Rate 1, are assessed a land based assessment each year. The current annualassessment is $24.50 per acre. Landowners who use groundwater exclusively, Rate 2, are chargedan annual per acre rate that is 50% of the surface supplied irrigated rate assessment. This chargeis in place to pay for the operation of recharge facilities where water that is put into the aquiferwhen available.
The land based assessments also add to the water delivery rate. Since the annual water allocationvaries, the cost per acre foot varies by virtue of dividing the annual assessment by the allocationin acre feet. For example, the Rate 1 annual assessment is currently fixed at $24.50 per acre. In ayear where 2 acre feet per acre is allocated, the water cost would be $12.25 per acre foot inassessments plus up to $5.00 per acre foot in water delivery charge. In a dry year where 0.5 acrefeet per acre are allocated to the landowner, the water cost would be $49 per acre foot inassessments plus up to $5.00 per acre foot in water delivery charge.
As for duration of water deliveries, that is dependent upon the water year. In a typical year,water deliveries begin in June and run through August, approximately 90 days. During that time,the entire distribution system is used to allow for flexibility of deliveries. The District does notconfine deliveries to certain reaches of the canals or pipelines. By doing so, water operations aremore flexible so that water from a premature shutoff can be directed to another grower on thesame canal or pipeline. This method, in most cases, eliminates drastic changes in the systemoperation and efficient deliveries.
Laguna Irrigation District encourages water efficiency by allowing those growers who use lessthan their annual allocation of surface water to transfer their unneeded surface water to othergrowers within our District. The transferred water is then accounted to the end user.
9
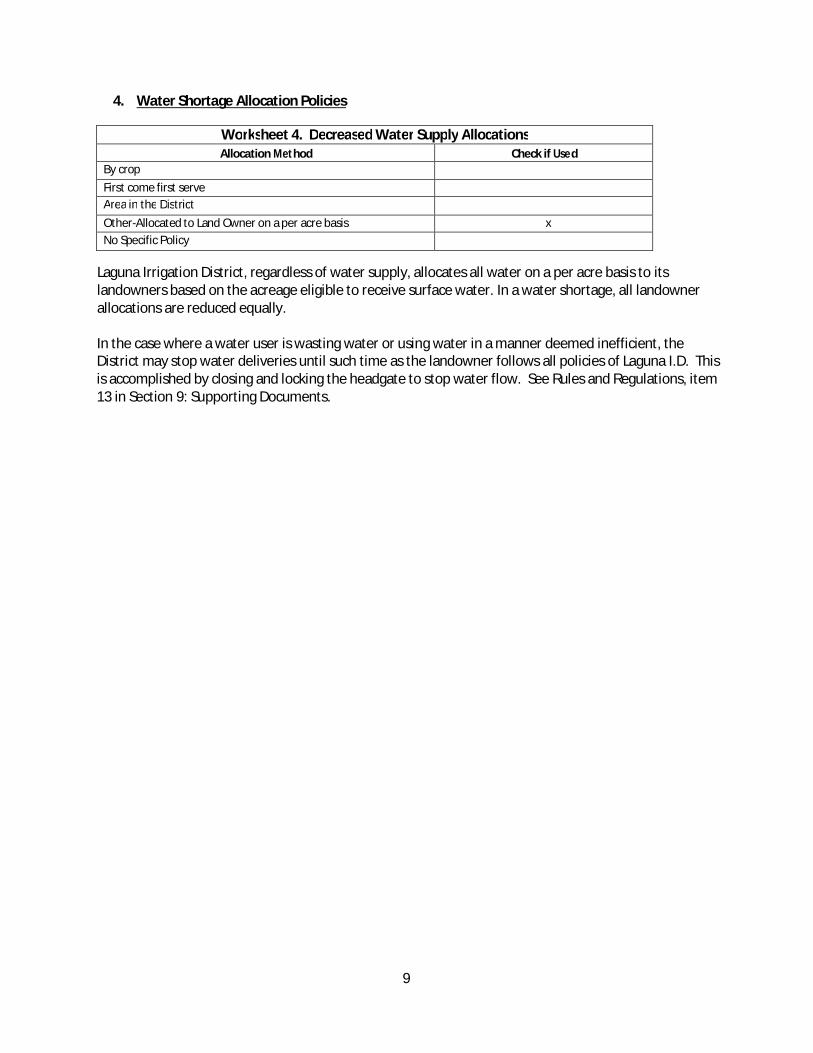
4. Water Shortage Allocation Policies
Worksheet 4. Decreased Water Supply AllocationsAllocation Method Check if Used
By cropFirst come first serveArea in the DistrictOther-Allocated to Land Owner on a per acre basis xNo Specific Policy
Laguna Irrigation District, regardless of water supply, allocates all water on a per acre basis to itslandowners based on the acreage eligible to receive surface water. In a water shortage, all landownerallocations are reduced equally.
In the case where a water user is wasting water or using water in a manner deemed inefficient, theDistrict may stop water deliveries until such time as the landowner follows all policies of Laguna I.D. Thisis accomplished by closing and locking the headgate to stop water flow. See Rules and Regulations, item13 in Section 9: Supporting Documents.
10
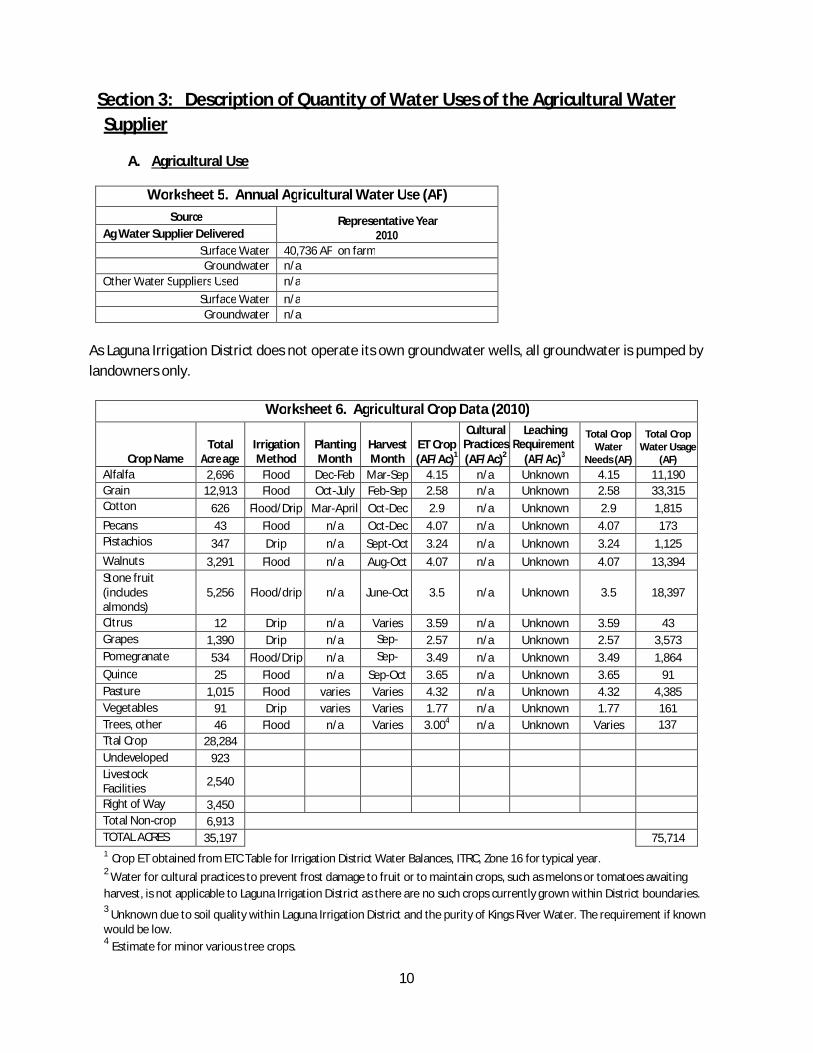
Section 3: Description of Quantity of Water Uses of the Agricultural WaterSupplier
A. Agricultural Use
Worksheet 5. Annual Agricultural Water Use (AF)Source Representative Year
2010Ag Water Supplier DeliveredSurface Water 40,736 AF on farmGroundwater n/a
Other Water Suppliers Used n/aSurface Water n/aGroundwater n/a
As Laguna Irrigation District does not operate its own groundwater wells, all groundwater is pumped bylandowners only.
Worksheet 6. Agricultural Crop Data (2010)
Crop NameTotal
Acre ageIrrigationMethod
PlantingMonth
HarvestMonth
ET Crop(AF/Ac)1
CulturalPractices(AF/Ac)2
LeachingRequirement
(AF/Ac)3
Total CropWater
Needs (AF)
Total CropWater Usage
(AF)Alfalfa 2,696 Flood Dec-Feb Mar-Sep 4.15 n/a Unknown 4.15 11,190Grain 12,913 Flood Oct-July Feb-Sep 2.58 n/a Unknown 2.58 33,315Cotton 626 Flood/Drip Mar-April Oct-Dec 2.9 n/a Unknown 2.9 1,815Pecans 43 Flood n/a Oct-Dec 4.07 n/a Unknown 4.07 173Pistachios 347 Drip n/a Sept-Oct 3.24 n/a Unknown 3.24 1,125Walnuts 3,291 Flood n/a Aug-Oct 4.07 n/a Unknown 4.07 13,394Stone fruit(includesalmonds)
5,256 Flood/drip n/a June-Oct 3.5 n/a Unknown 3.5 18,397
Citrus 12 Drip n/a Varies 3.59 n/a Unknown 3.59 43Grapes 1,390 Drip n/a Sep-
Nov2.57 n/a Unknown 2.57 3,573
Pomegranate 534 Flood/Drip n/a Sep-Nov
3.49 n/a Unknown 3.49 1,864Quince 25 Flood n/a Sep-Oct 3.65 n/a Unknown 3.65 91Pasture 1,015 Flood varies Varies 4.32 n/a Unknown 4.32 4,385Vegetables 91 Drip varies Varies 1.77 n/a Unknown 1.77 161Trees, other 46 Flood n/a Varies 3.004 n/a Unknown Varies 137Ttal Crop 28,284Undeveloped 923LivestockFacilities 2,540
Right of Way 3,450Total Non-crop 6,913TOTAL ACRES 35,197 75,7141 Crop ET obtained from ETC Table for Irrigation District Water Balances, ITRC, Zone 16 for typical year.2 Water for cultural practices to prevent frost damage to fruit or to maintain crops, such as melons or tomatoes awaitingharvest, is not applicable to Laguna Irrigation District as there are no such crops currently grown within District boundaries.3 Unknown due to soil quality within Laguna Irrigation District and the purity of Kings River Water. The requirement if knownwould be low.4 Estimate for minor various tree crops.
11
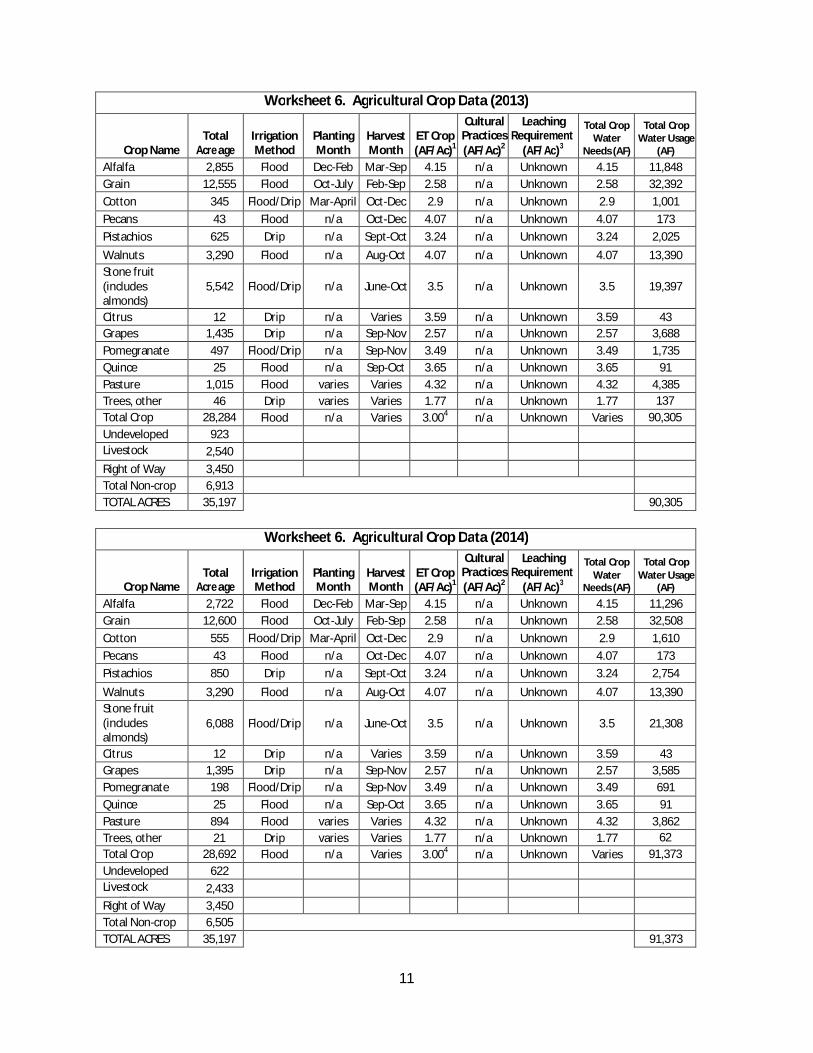
Worksheet 6. Agricultural Crop Data (2013)
Crop NameTotal
Acre ageIrrigationMethod
PlantingMonth
HarvestMonth
ET Crop(AF/Ac)1
CulturalPractices(AF/Ac)2
LeachingRequirement
(AF/Ac)3
Total CropWater
Needs (AF)
Total CropWater Usage
(AF)Alfalfa 2,855 Flood Dec-Feb Mar-Sep 4.15 n/a Unknown 4.15 11,848Grain 12,555 Flood Oct-July Feb-Sep 2.58 n/a Unknown 2.58 32,392Cotton 345 Flood/Drip Mar-April Oct-Dec 2.9 n/a Unknown 2.9 1,001Pecans 43 Flood n/a Oct-Dec 4.07 n/a Unknown 4.07 173Pistachios 625 Drip n/a Sept-Oct 3.24 n/a Unknown 3.24 2,025Walnuts 3,290 Flood n/a Aug-Oct 4.07 n/a Unknown 4.07 13,390Stone fruit(includesalmonds)
5,542 Flood/Drip n/a June-Oct 3.5 n/a Unknown 3.5 19,397
Citrus 12 Drip n/a Varies 3.59 n/a Unknown 3.59 43Grapes 1,435 Drip n/a Sep-Nov 2.57 n/a Unknown 2.57 3,688Pomegranate 497 Flood/Drip n/a Sep-Nov 3.49 n/a Unknown 3.49 1,735Quince 25 Flood n/a Sep-Oct 3.65 n/a Unknown 3.65 91Pasture 1,015 Flood varies Varies 4.32 n/a Unknown 4.32 4,385Trees, other 46 Drip varies Varies 1.77 n/a Unknown 1.77 137Total Crop 28,284 Flood n/a Varies 3.004 n/a Unknown Varies 90,305Undeveloped 923LivestockFacilities
2,540Right of Way 3,450Total Non-crop 6,913TOTAL ACRES 35,197 90,305
Worksheet 6. Agricultural Crop Data (2014)
Crop NameTotal
Acre ageIrrigationMethod
PlantingMonth
HarvestMonth
ET Crop(AF/Ac)1
CulturalPractices(AF/Ac)2
LeachingRequirement
(AF/Ac)3
Total CropWater
Needs (AF)
Total CropWater Usage
(AF)Alfalfa 2,722 Flood Dec-Feb Mar-Sep 4.15 n/a Unknown 4.15 11,296Grain 12,600 Flood Oct-July Feb-Sep 2.58 n/a Unknown 2.58 32,508Cotton 555 Flood/Drip Mar-April Oct-Dec 2.9 n/a Unknown 2.9 1,610Pecans 43 Flood n/a Oct-Dec 4.07 n/a Unknown 4.07 173Pistachios 850 Drip n/a Sept-Oct 3.24 n/a Unknown 3.24 2,754Walnuts 3,290 Flood n/a Aug-Oct 4.07 n/a Unknown 4.07 13,390Stone fruit(includesalmonds)
6,088 Flood/Drip n/a June-Oct 3.5 n/a Unknown 3.5 21,308
Citrus 12 Drip n/a Varies 3.59 n/a Unknown 3.59 43Grapes 1,395 Drip n/a Sep-Nov 2.57 n/a Unknown 2.57 3,585Pomegranate 198 Flood/Drip n/a Sep-Nov 3.49 n/a Unknown 3.49 691Quince 25 Flood n/a Sep-Oct 3.65 n/a Unknown 3.65 91Pasture 894 Flood varies Varies 4.32 n/a Unknown 4.32 3,862Trees, other 21 Drip varies Varies 1.77 n/a Unknown 1.77 62Total Crop 28,692 Flood n/a Varies 3.004 n/a Unknown Varies 91,373Undeveloped 622LivestockFacilities
2,433Right of Way 3,450Total Non-crop 6,505TOTAL ACRES 35,197 91,373
12
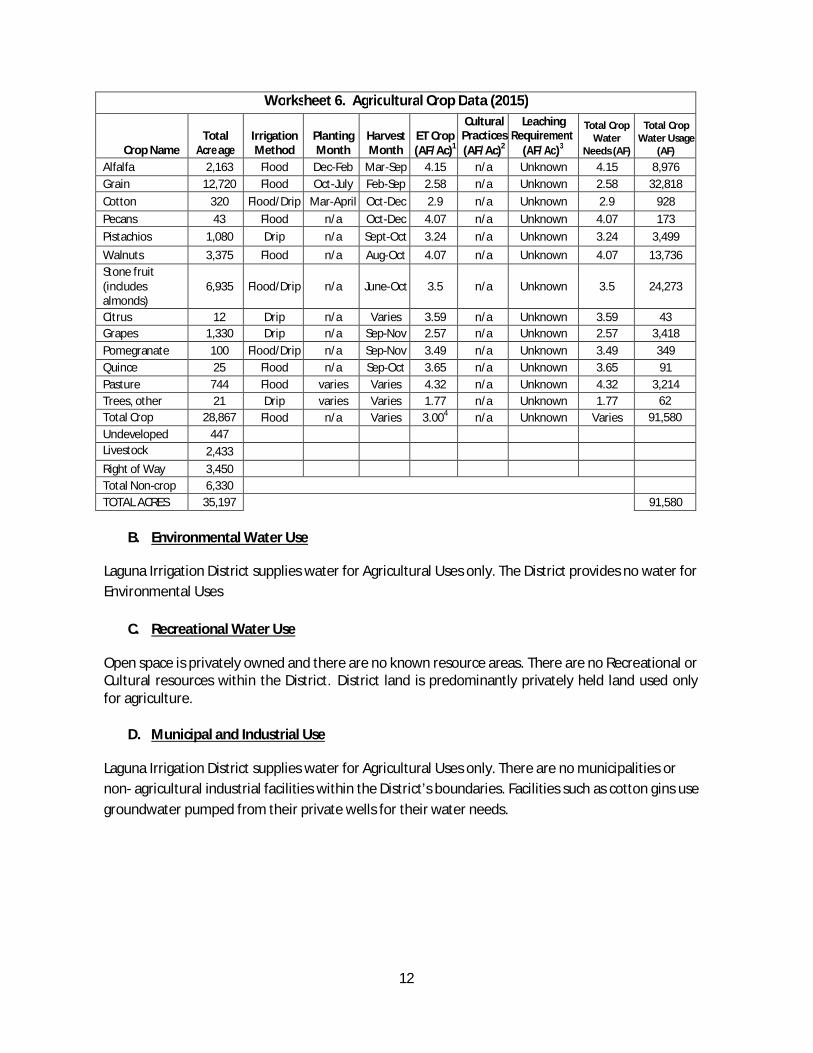
Worksheet 6. Agricultural Crop Data (2015)
Crop NameTotal
Acre ageIrrigationMethod
PlantingMonth
HarvestMonth
ET Crop(AF/Ac)1
CulturalPractices(AF/Ac)2
LeachingRequirement
(AF/Ac)3
Total CropWater
Needs (AF)
Total CropWater Usage
(AF)Alfalfa 2,163 Flood Dec-Feb Mar-Sep 4.15 n/a Unknown 4.15 8,976Grain 12,720 Flood Oct-July Feb-Sep 2.58 n/a Unknown 2.58 32,818Cotton 320 Flood/Drip Mar-April Oct-Dec 2.9 n/a Unknown 2.9 928Pecans 43 Flood n/a Oct-Dec 4.07 n/a Unknown 4.07 173Pistachios 1,080 Drip n/a Sept-Oct 3.24 n/a Unknown 3.24 3,499Walnuts 3,375 Flood n/a Aug-Oct 4.07 n/a Unknown 4.07 13,736Stone fruit(includesalmonds)
6,935 Flood/Drip n/a June-Oct 3.5 n/a Unknown 3.5 24,273
Citrus 12 Drip n/a Varies 3.59 n/a Unknown 3.59 43Grapes 1,330 Drip n/a Sep-Nov 2.57 n/a Unknown 2.57 3,418Pomegranate 100 Flood/Drip n/a Sep-Nov 3.49 n/a Unknown 3.49 349Quince 25 Flood n/a Sep-Oct 3.65 n/a Unknown 3.65 91Pasture 744 Flood varies Varies 4.32 n/a Unknown 4.32 3,214Trees, other 21 Drip varies Varies 1.77 n/a Unknown 1.77 62Total Crop 28,867 Flood n/a Varies 3.004 n/a Unknown Varies 91,580Undeveloped 447LivestockFacilities
2,433Right of Way 3,450Total Non-crop 6,330TOTAL ACRES 35,197 91,580
B. Environmental Water Use
Laguna Irrigation District supplies water for Agricultural Uses only. The District provides no water forEnvironmental Uses
C. Recreational Water Use
Open space is privately owned and there are no known resource areas. There are no Recreational orCultural resources within the District. District land is predominantly privately held land used onlyfor agriculture.
D. Municipal and Industrial Use
Laguna Irrigation District supplies water for Agricultural Uses only. There are no municipalities ornon- agricultural industrial facilities within the District’s boundaries. Facilities such as cotton gins usegroundwater pumped from their private wells for their water needs.
13
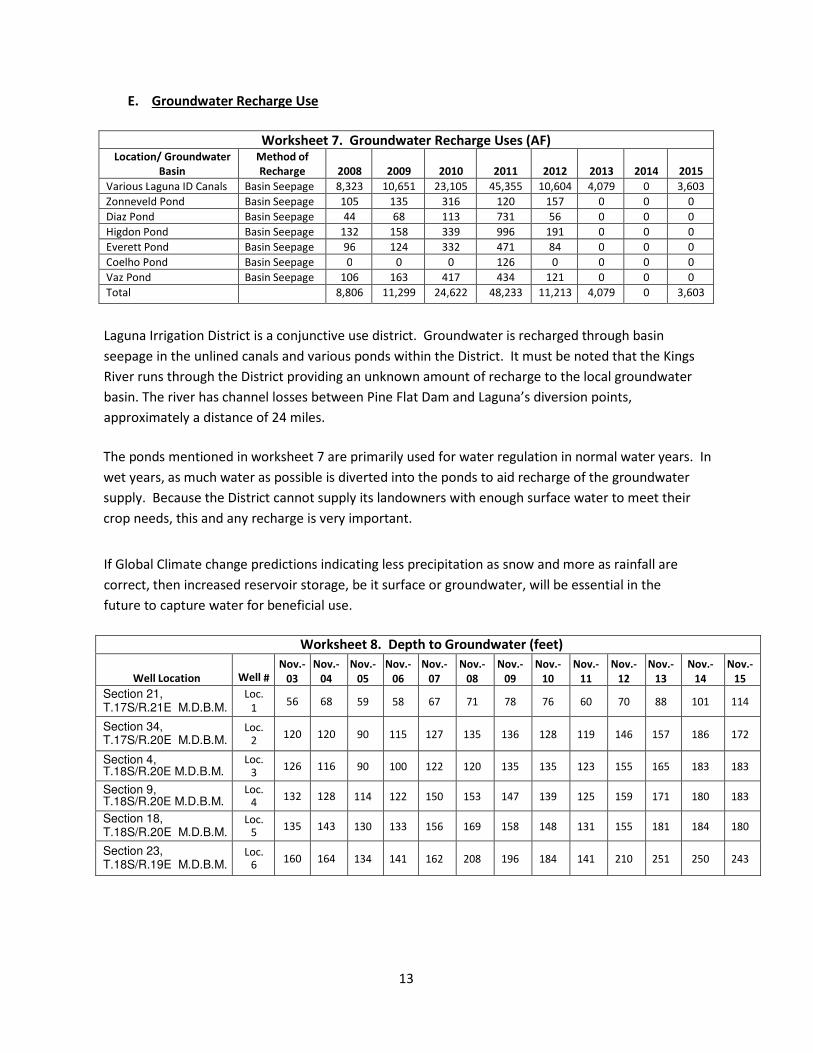
E. Groundwater Recharge Use
Worksheet 7. Groundwater Recharge Uses (AF) Location/ Groundwater
Basin Method of
Recharge 2008 2009 2010 2011 2012 2013 2014 2015
Various Laguna ID Canals Basin Seepage 8,323 10,651 23,105 45,355 10,604 4,079 0 3,603
Zonneveld Pond Basin Seepage 105 135 316 120 157 0 0 0
Diaz Pond Basin Seepage 44 68 113 731 56 0 0 0
Higdon Pond Basin Seepage 132 158 339 996 191 0 0 0
Everett Pond Basin Seepage 96 124 332 471 84 0 0 0
Coelho Pond Basin Seepage 0 0 0 126 0 0 0 0
Vaz Pond Basin Seepage 106 163 417 434 121 0 0 0
Total 8,806 11,299 24,622 48,233 11,213 4,079 0 3,603
Laguna Irrigation District is a conjunctive use district. Groundwater is recharged through basin
seepage in the unlined canals and various ponds within the District. It must be noted that the Kings
River runs through the District providing an unknown amount of recharge to the local groundwater
basin. The river has channel losses between Pine Flat Dam and Laguna’s diversion points,
approximately a distance of 24 miles.
The ponds mentioned in worksheet 7 are primarily used for water regulation in normal water years. In
wet years, as much water as possible is diverted into the ponds to aid recharge of the groundwater
supply. Because the District cannot supply its landowners with enough surface water to meet their
crop needs, this and any recharge is very important.
If Global Climate change predictions indicating less precipitation as snow and more as rainfall are
correct, then increased reservoir storage, be it surface or groundwater, will be essential in the
future to capture water for beneficial use.
Worksheet 8. Depth to Groundwater (feet)
Well Location Well # Nov.-
03 Nov.-
04 Nov.-
05
Nov.-
06
Nov.-
07
Nov.-
08
Nov.-
09
Nov.-
10
Nov.-
11
Nov.-
12
Nov.-
13
Nov.-
14
Nov.-
15
Section 21,
T.17S/R.21E M.D.B.M. Loc.
1 56 68 59 58 67 71 78 76 60 70 88 101 114
Section 34,
T.17S/R.20E M.D.B.M. Loc.
2 120 120 90 115 127 135 136 128 119 146 157 186 172
Section 4, T.18S/R.20E M.D.B.M.
Loc. 3
126 116 90 100 122 120 135 135 123 155 165 183 183
Section 9, T.18S/R.20E M.D.B.M.
Loc. 4
132 128 114 122 150 153 147 139 125 159 171 180 183
Section 18,
T.18S/R.20E M.D.B.M. Loc.
5 135 143 130 133 156 169 158 148 131 155 181 184 180
Section 23,
T.18S/R.19E M.D.B.M. Loc.
6 160 164 134 141 162 208 196 184 141 210 251 250 243
14
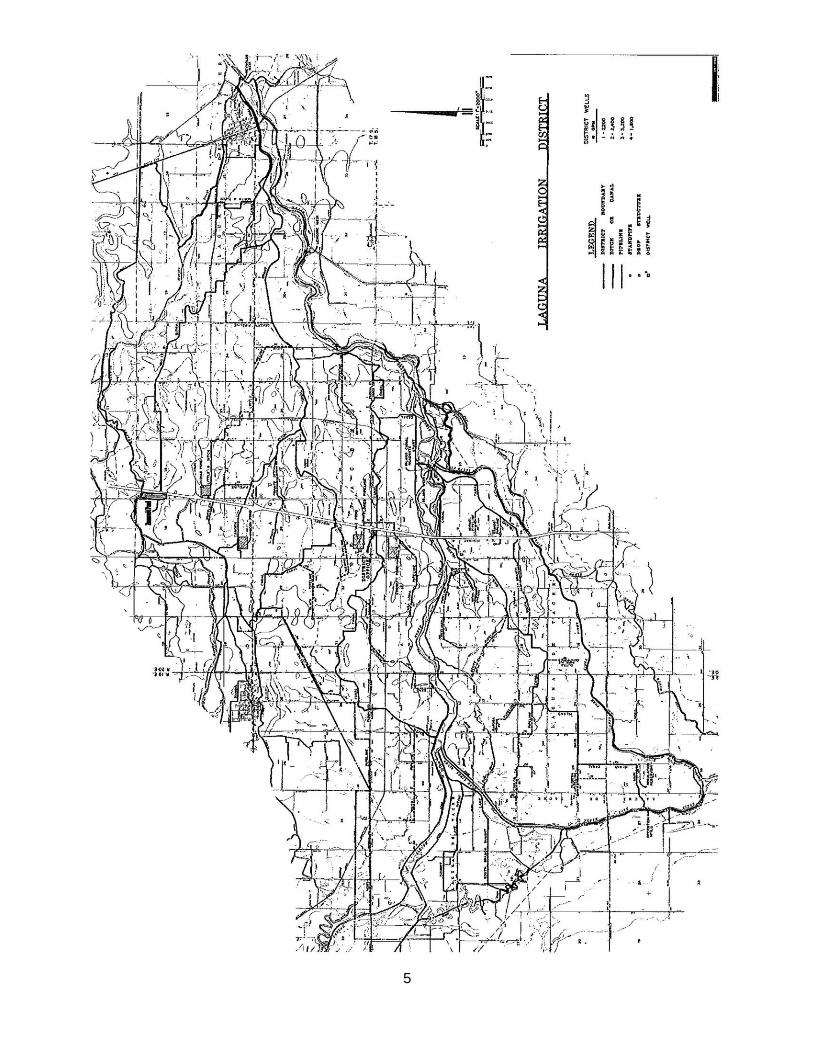
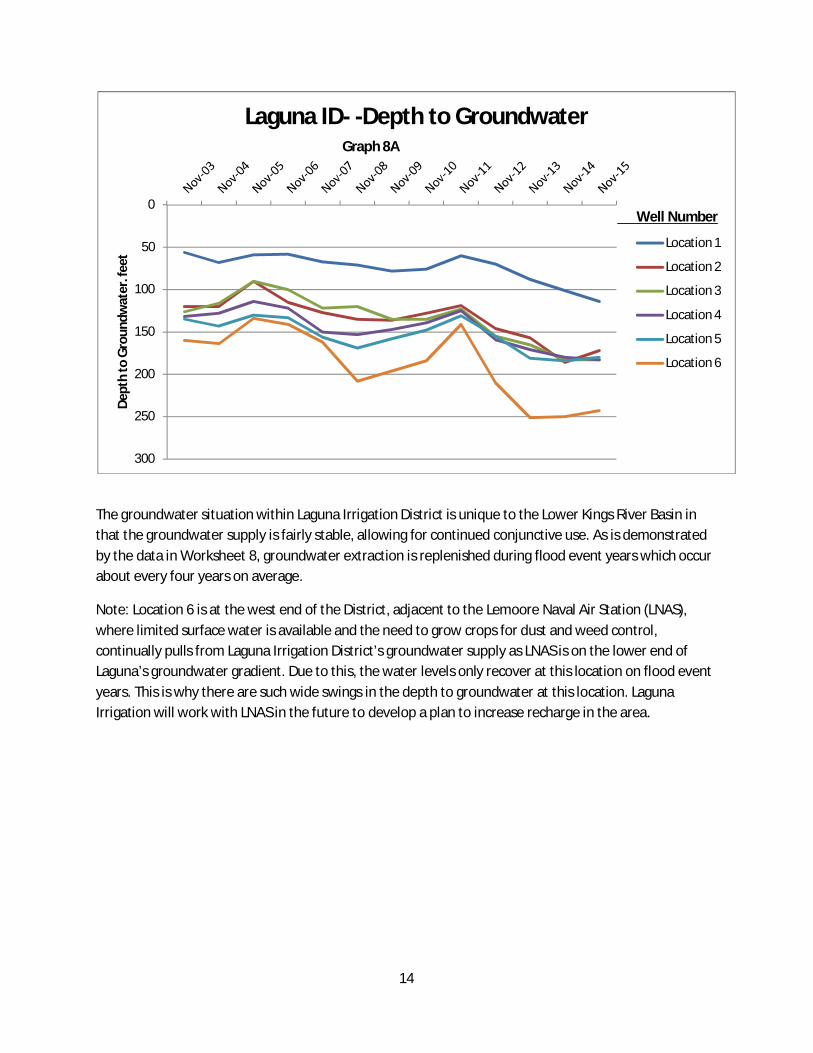
The groundwater situation within Laguna Irrigation District is unique to the Lower Kings River Basin inthat the groundwater supply is fairly stable, allowing for continued conjunctive use. As is demonstratedby the data in Worksheet 8, groundwater extraction is replenished during flood event years which occurabout every four years on average.
Note: Location 6 is at the west end of the District, adjacent to the Lemoore Naval Air Station (LNAS),where limited surface water is available and the need to grow crops for dust and weed control,continually pulls from Laguna Irrigation District’s groundwater supply as LNAS is on the lower end ofLaguna’s groundwater gradient. Due to this, the water levels only recover at this location on flood eventyears. This is why there are such wide swings in the depth to groundwater at this location. LagunaIrrigation will work with LNAS in the future to develop a plan to increase recharge in the area.
0
50
100
150
200
250
300
Dept
hto
Gro
undw
ater
.fee
tLaguna ID- -Depth to Groundwater
Location 1
Location 2
Location 3
Location 4
Location 5
Location 6
Graph 8A
Well Number
15
Section 4: Description of Quantity and Quality of the Water Resources of theAgricultural Water Supplier
A. Water Supply Quantity
1. Surface Water Supply
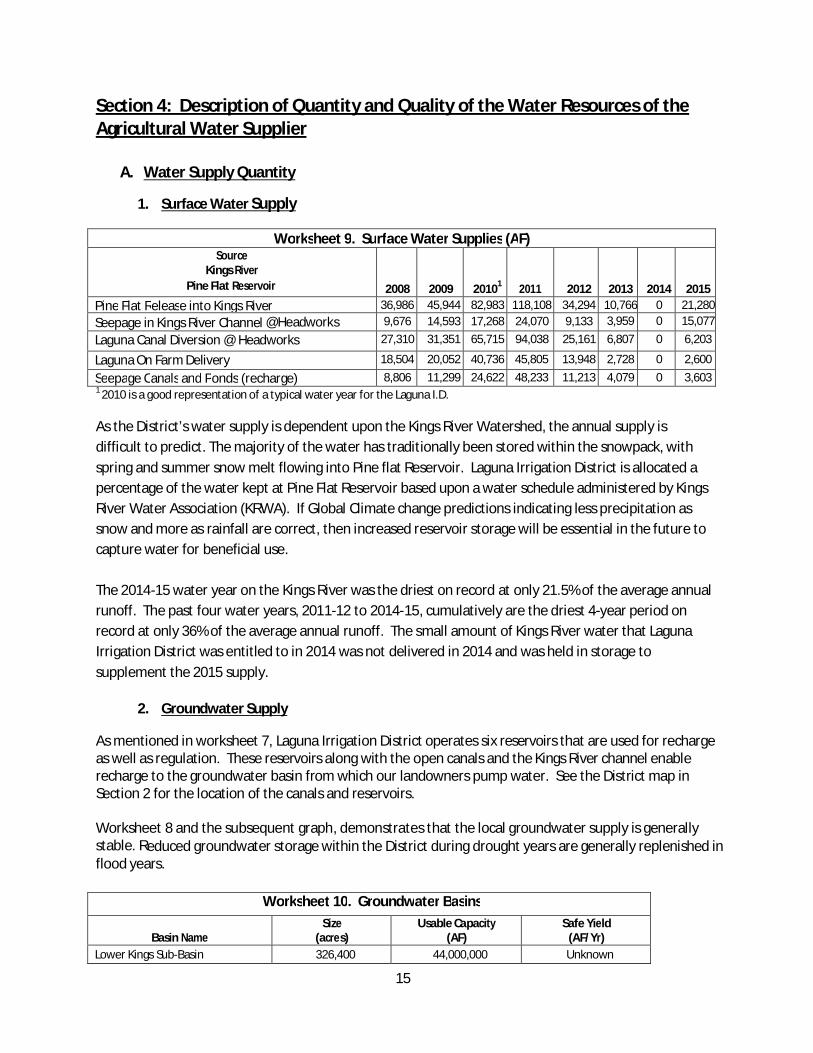
Worksheet 9. Surface Water Supplies (AF)Source
Kings RiverPine Flat Reservoir 2008 2009 20101 2011 2012 2013 2014 2015
Pine Flat Release into Kings River 36,986 45,944 82,983 118,108 34,294 10,766 0 21,280Seepage in Kings River Channel @Headworks 9,676 14,593 17,268 24,070 9,133 3,959 0 15,077
Laguna Canal Diversion @ Headworks 27,310 31,351 65,715 94,038 25,161 6,807 0 6,203
Laguna On Farm Delivery 18,504 20,052 40,736 45,805 13,948 2,728 0 2,600
Seepage Canals and Ponds (recharge) 8,806 11,299 24,622 48,233 11,213 4,079 0 3,6031 2010 is a good representation of a typical water year for the Laguna I.D.
As the District’s water supply is dependent upon the Kings River Watershed, the annual supply isdifficult to predict. The majority of the water has traditionally been stored within the snowpack, withspring and summer snow melt flowing into Pine flat Reservoir. Laguna Irrigation District is allocated apercentage of the water kept at Pine Flat Reservoir based upon a water schedule administered by KingsRiver Water Association (KRWA). If Global Climate change predictions indicating less precipitation assnow and more as rainfall are correct, then increased reservoir storage will be essential in the future tocapture water for beneficial use.
The 2014-15 water year on the Kings River was the driest on record at only 21.5% of the average annualrunoff. The past four water years, 2011-12 to 2014-15, cumulatively are the driest 4-year period onrecord at only 36% of the average annual runoff. The small amount of Kings River water that LagunaIrrigation District was entitled to in 2014 was not delivered in 2014 and was held in storage tosupplement the 2015 supply.
2. Groundwater Supply
As mentioned in worksheet 7, Laguna Irrigation District operates six reservoirs that are used for rechargeas well as regulation. These reservoirs along with the open canals and the Kings River channel enablerecharge to the groundwater basin from which our landowners pump water. See the District map inSection 2 for the location of the canals and reservoirs.
Worksheet 8 and the subsequent graph, demonstrates that the local groundwater supply is generallystable. Reduced groundwater storage within the District during drought years are generally replenished inflood years.
Worksheet 10. Groundwater Basins
Basin NameSize
(acres)Usable Capacity
(AF)Safe Yield
(AF/Yr)Lower Kings Sub-Basin 326,400 44,000,000 Unknown

16
As for the larger Sub-Basin, please refer to the Kings Basin Integrated Regional Water ManagementPlan. This can be accessed at: http://krcd.org/_pdf_ukbirwma/20121017_KB_IRWMP.pdf
Worksheet 11. Groundwater Management PlanWritten By Water Resources & Information Management Engineering (WRIME)
Compliance SB 1938
Year April 2005
Website forDocument
http://krcd.org/_pdf/Lower%20Kings%20Basin%20SB%201938%20GWMP_lowres.pdf
Groundwater is pumped by private landowners. The landowners have no restriction from the District onthe amount of groundwater they can pump, other than their ability to pay for their own facilities andenergy costs.
3. Other Water Supplies
Laguna Irrigation District has no other water supplies than the Kings River supply.
4. Drainage From the Water Supplier’s Service Area
Laguna Irrigation District does not drain waters out of its service area. Laguna Irrigation District has areturn and regulation system to ensure no loss of water within district’s facilities.
Surface applied waters within the District, if not drained into the soil profile are returned within theparcel of use and reused. Most landowners have an irrigation return system where appropriate.
Due to the quality of the soils within the District, there are no subsurface drainage facilities to removesaline water. What subsurface drainage that currently exists in the District is located near or along theKings River to remove river seepage during flood events. These facilities are operated, in most cases bythe Kings River Conservation district.
B. Water Supply Quality
1. Surface Water Supply
Surface Water Quality measurements have been collected as part of the Central Valley Regional WaterQuality Control Board’s (Regional Board) Irrigated Lands Regulatory Program (ILRP) since the program’sinception in 2006. This data has been collected by the staff of the Kings River Conservation District(KRCD), acting on behalf of the Kings River Sub-Watershed (KRSW) and the Southern San Joaquin ValleyWater Quality Coalition (SSJVWQC). The number of monitored constituents and frequency of samplinghas changed as the ILRP has evolved, but several monitoring sites have remained relatively constantthroughout the program. The program is expected to continue to operate in its current form until therevised program is implemented in 2014.
17
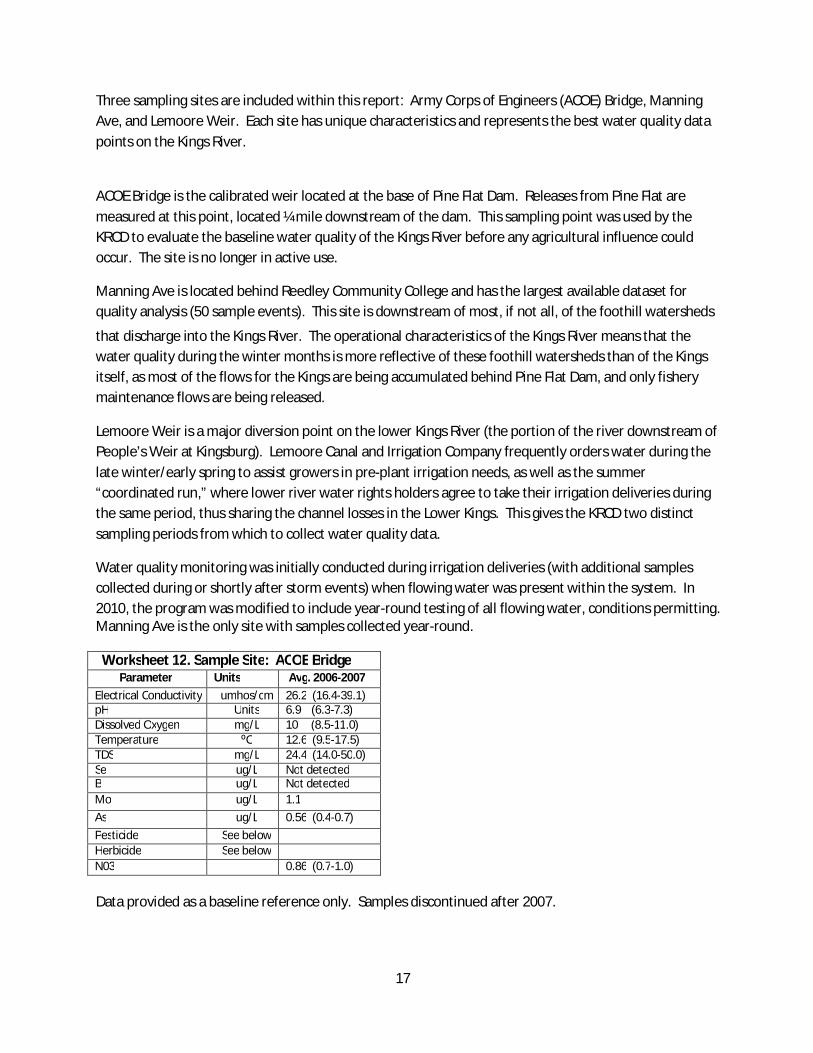
Three sampling sites are included within this report: Army Corps of Engineers (ACOE) Bridge, ManningAve, and Lemoore Weir. Each site has unique characteristics and represents the best water quality datapoints on the Kings River.
ACOE Bridge is the calibrated weir located at the base of Pine Flat Dam. Releases from Pine Flat aremeasured at this point, located ¼ mile downstream of the dam. This sampling point was used by theKRCD to evaluate the baseline water quality of the Kings River before any agricultural influence couldoccur. The site is no longer in active use.
Manning Ave is located behind Reedley Community College and has the largest available dataset forquality analysis (50 sample events). This site is downstream of most, if not all, of the foothill watersheds
that discharge into the Kings River. The operational characteristics of the Kings River means that thewater quality during the winter months is more reflective of these foothill watersheds than of the Kingsitself, as most of the flows for the Kings are being accumulated behind Pine Flat Dam, and only fisherymaintenance flows are being released.
Lemoore Weir is a major diversion point on the lower Kings River (the portion of the river downstream ofPeople’s Weir at Kingsburg). Lemoore Canal and Irrigation Company frequently orders water during thelate winter/early spring to assist growers in pre-plant irrigation needs, as well as the summer“coordinated run,” where lower river water rights holders agree to take their irrigation deliveries duringthe same period, thus sharing the channel losses in the Lower Kings. This gives the KRCD two distinctsampling periods from which to collect water quality data.
Water quality monitoring was initially conducted during irrigation deliveries (with additional samplescollected during or shortly after storm events) when flowing water was present within the system. In2010, the program was modified to include year-round testing of all flowing water, conditions permitting.Manning Ave is the only site with samples collected year-round.
Worksheet 12. Sample Site: ACOE BridgeParameter Units Avg. 2006-2007
Electrical Conductivity umhos/cm 26.2 (16.4-39.1)pH Units 6.9 (6.3-7.3)Dissolved Oxygen mg/L 10 (8.5-11.0)Temperature ⁰C 12.6 (9.5-17.5)TDS mg/L 24.4 (14.0-50.0)Se ug/L Not detectedB ug/L Not detectedMo ug/L 1.1As ug/L 0.56 (0.4-0.7)Pesticide See belowHerbicide See belowN03 0.86 (0.7-1.0)
Data provided as a baseline reference only. Samples discontinued after 2007.
18
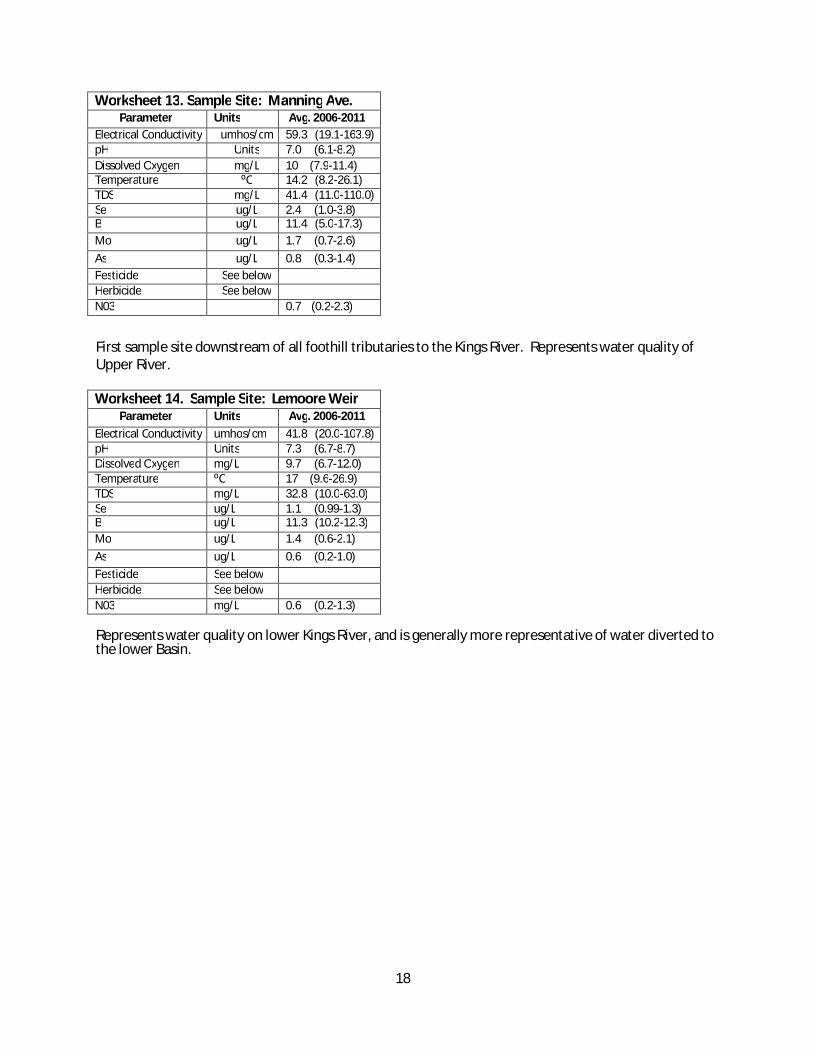
Worksheet 13. Sample Site: Manning Ave.Parameter Units Avg. 2006-2011
Electrical Conductivity umhos/cm 59.3 (19.1-163.9)pH Units 7.0 (6.1-8.2)Dissolved Oxygen mg/L 10 (7.9-11.4)Temperature ⁰C 14.2 (8.2-26.1)TDS mg/L 41.4 (11.0-110.0)Se ug/L 2.4 (1.0-3.8)B ug/L 11.4 (5.0-17.3)Mo ug/L 1.7 (0.7-2.6)As ug/L 0.8 (0.3-1.4)Pesticide See belowHerbicide See belowN03 0.7 (0.2-2.3)
First sample site downstream of all foothill tributaries to the Kings River. Represents water quality ofUpper River.
Worksheet 14. Sample Site: Lemoore WeirParameter Units Avg. 2006-2011
Electrical Conductivity umhos/cm 41.8 (20.0-107.8)pH Units 7.3 (6.7-8.7)Dissolved Oxygen mg/L 9.7 (6.7-12.0)Temperature ⁰C 17 (9.6-26.9)TDS mg/L 32.8 (10.0-63.0)Se ug/L 1.1 (0.99-1.3)B ug/L 11.3 (10.2-12.3)Mo ug/L 1.4 (0.6-2.1)As ug/L 0.6 (0.2-1.0)Pesticide See belowHerbicide See belowN03 mg/L 0.6 (0.2-1.3)
Represents water quality on lower Kings River, and is generally more representative of water diverted tothe lower Basin.

19
Worksheet 15. Pesticides/Herbicides included in Surface Water TestingConstituent Units Constituent Units
Aldicarb ug/L Carbaryl ug/LCarbofuran ug/L Methiocarb ug/LMethomyl ug/L Thiobencarb ug/LOxamyl ug/L DDD ug/LDDE ug/L DDT ug/LDicofol ug/L Dieldrin ug/LEndrin ug/L Methoxychlor ug/LToxaphene ug/L Azinphos-methyl ug/LChlorpyrifos ug/L Diazinon ug/LDichlorvos ug/L Dimethoate ug/LDemeton-S ug/L Disulfoton ug/LMalathion ug/L Methamidophos ug/LMethidathion ug/L Methyl Parathion ug/LPhorate ug/L Phosmet ug/LAtrazine ug/L Simazine ug/LCyanazine ug/L Diuron ug/LMolinate ug/L Glyphosate ug/LParaquat ug/L Linuron ug/LTrifluralin ug/L Bifenthrin ug/LCyfluthrin ug/L Cypermethrin ug/LEsfenvalerate ug/L Fenpropathrin ug/LPermethrin ug/L Lambda Cyhalothrin ug/L
The above listed pesticides are currently tested for in a One year, high intensity sampling regime followedby Two years of lower intensity testing. For the most part, none of the above chemistries have beendetected in reportable/actionable quantities.
C. Water Quality Monitoring Practices
1. Source Water
Worksheet 16. Water Quality Monitoring PracticesMonitoring Program Analysis Performed Frequency of Analysis
ILRP (Surface Water) See above Monthly when flowing water is available
ILRP (Ground Water) TBD TBD
The Kings River Conservation District (KRCD) through its management of the Irrigated Lands RegulatoryProgram (ILRP) for the Kings River Service Area (Kings Basin and Tulare Lake Basin) monitors surfacewater quality within the basin on a monthly basis. The constituents monitored are specified by theRegional Water Quality Control Board (Regional Board). Project specific Quality Assurance and QualityControl (QA/QC) is outlined in the Quality Assurance Project Plan (QAPP) that has been prepared by theSouthern San Joaquin Valley Water Quality Coalition (SSJVWQC) and submitted for Regional Boardapproval. This document outlines detection limits (detection and reporting limits), methods used todetect the constituent in question, and the laboratory procedures used to process the submittedsamples. The QAPP also outlines sample collection and handling procedures and required actionsshould problems arise.
Sampling of surface water is not limited to chemical constituents; basic physical parameters
20
(conductivity, pH, temperature, dissolved oxygen) are measured and bacterial and water column toxicitysamples are collected as well. Bacteria samples are analyzed for E. coli and fecal coliform, water columntoxicity is a combination of tests of indicator species (algae, minnow, crustacean) to evaluate toxicitywithin the food chain.
Sampling is conducted once per month on a fixed schedule (approximately the same time each month,adjusted for holidays.
Groundwater monitoring under the ILRP is a yet to be implemented program and is still in draft form. Ascurrently proposed, sampling would be done a minimum of once per year and include basic physicalparameters with chemical tests for nitrate + nitrite levels, total nitrogen, some key metals, and specificconstituents of concern (on a once per five year basis). Areas identified as being impacted by nitrateswould have higher frequency and density of monitoring activities.
The Laguna Irrigation District and KRCD already measures depth to groundwater on a Spring and Fallmeasurement schedule, and coordinates the data collection for several cooperating agencies forreporting under the CASGEM program.
21
Section 5: Water Accounting and Water Supply Reliability
A. Quantifying Water Supplier’s Water Supplies
1. Agricultural Water Supplier Water Quantities
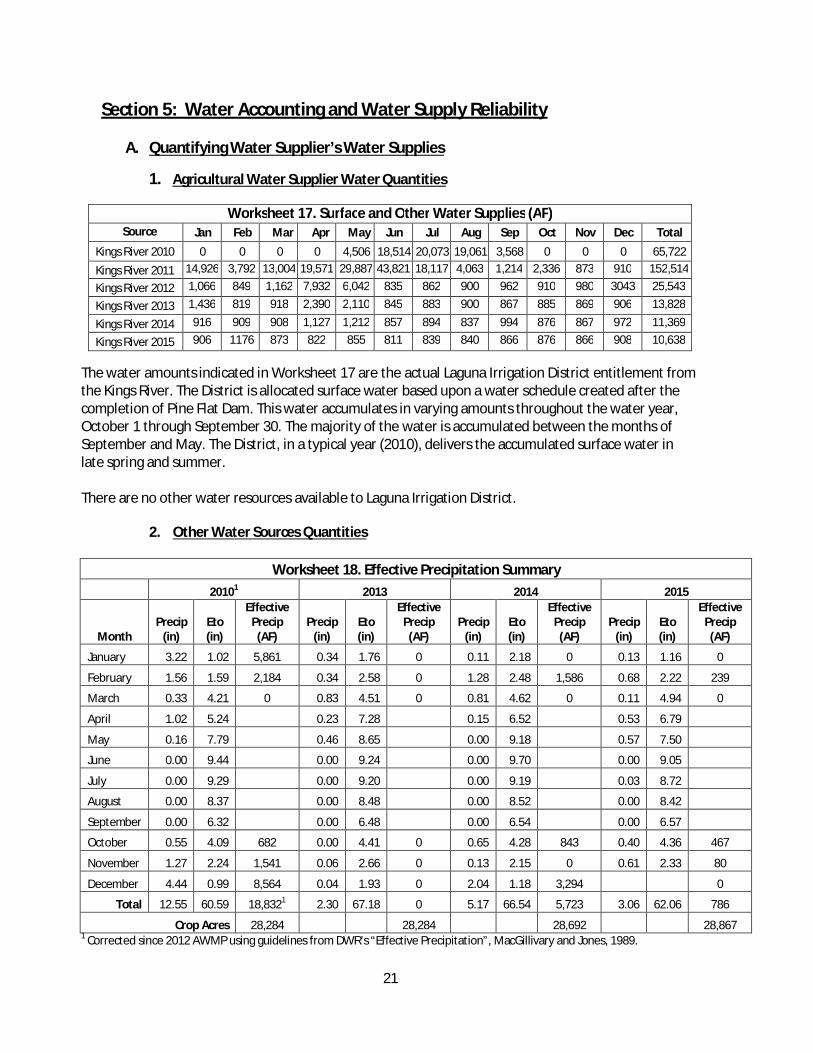
Worksheet 17. Surface and Other Water Supplies (AF)Source Jan Feb Mar Apr May Jun Jul Aug Sep Oct Nov Dec Total
Kings River 2010 0 0 0 0 4,506 18,514 20,073 19,061 3,568 0 0 0 65,722Kings River 2011 14,926 3,792 13,004 19,571 29,887 43,821 18,117 4,063 1,214 2,336 873 910 152,514
Kings River 2012 1,066 849 1,162 7,932 6,042 835 862 900 962 910 980 3043 25,543
Kings River 2013 1,436 819 918 2,390 2,110 845 883 900 867 885 869 906 13,828
Kings River 2014 916 909 908 1,127 1,212 857 894 837 994 876 867 972 11,369
Kings River 2015 906 1176 873 822 855 811 839 840 866 876 866 908 10,638
The water amounts indicated in Worksheet 17 are the actual Laguna Irrigation District entitlement fromthe Kings River. The District is allocated surface water based upon a water schedule created after thecompletion of Pine Flat Dam. This water accumulates in varying amounts throughout the water year,October 1 through September 30. The majority of the water is accumulated between the months ofSeptember and May. The District, in a typical year (2010), delivers the accumulated surface water inlate spring and summer.
There are no other water resources available to Laguna Irrigation District.
2. Other Water Sources Quantities
Worksheet 18. Effective Precipitation Summary20101 2013 2014 2015
MonthPrecip
(in)Eto(in)
EffectivePrecip(AF)
Precip(in)
Eto(in)
EffectivePrecip(AF)
Precip(in)
Eto(in)
EffectivePrecip(AF)
Precip(in)
Eto(in)
EffectivePrecip(AF)
January 3.22 1.02 5,861 0.34 1.76 0 0.11 2.18 0 0.13 1.16 0
February 1.56 1.59 2,184 0.34 2.58 0 1.28 2.48 1,586 0.68 2.22 239
March 0.33 4.21 0 0.83 4.51 0 0.81 4.62 0 0.11 4.94 0
April 1.02 5.24 0.23 7.28 0.15 6.52 0.53 6.79
May 0.16 7.79 0.46 8.65 0.00 9.18 0.57 7.50
June 0.00 9.44 0.00 9.24 0.00 9.70 0.00 9.05
July 0.00 9.29 0.00 9.20 0.00 9.19 0.03 8.72
August 0.00 8.37 0.00 8.48 0.00 8.52 0.00 8.42
September 0.00 6.32 0.00 6.48 0.00 6.54 0.00 6.57
October 0.55 4.09 682 0.00 4.41 0 0.65 4.28 843 0.40 4.36 467
November 1.27 2.24 1,541 0.06 2.66 0 0.13 2.15 0 0.61 2.33 80
December 4.44 0.99 8,564 0.04 1.93 0 2.04 1.18 3,294 0
Total 12.55 60.59 18,8321 2.30 67.18 0 5.17 66.54 5,723 3.06 62.06 786
Crop Acres 28,284 28,284 28,692 28,8671 Corrected since 2012 AWMP using guidelines from DWR’s “Effective Precipitation”, MacGillivary and Jones, 1989.

22
Average yearly rainfall for the District is 8-12 inches of rain. As shown by the table, themajority of the rainfall occurs in December, January and February, when it can only be used forpre-irrigation, vegetables, and other winter crops.
Land owners within Laguna Irrigation District use private wells to pump necessary groundwaterfor their crops to supplement surface water deliveries from the District. The amount ofgroundwater pumped varies with the availability of surface water. For instance, in 2013, a verydry year, landowners would have to have pumped approximately 87,577 acre feet ofgroundwater, which is calculated by subtracting on- farm delivery (worksheet 9) from total cropwater usage (worksheet 6). In 2010, approximately 34,978 acre feet of groundwater was needed.
B. Quantification of Water Uses
Worksheet 19. Applied Water (AF)2010 2013 2014 2015
Applied Water (worksheet 9) 40,736 2,728 0 2,600
Worksheet 20. Quantify Water Use (AF)Water Use 2010 2013 2014 2015
Crop Water Use1 Crop Evapotranspiration (worksheet 6) 75,714 90,305 91,373 91,5802 Leaching N/A N/A N/A N/A3 Cultural Practices N/A N/A N/A N/AConveyance & Storage System4 Conveyance seepage (worksheet 7) 23,105 4,079 0 3,6035 Conveyance evaporation 197 35 0 317 Reservoir evaporation 160 0 0 08 Reservoir seepage (worksheet 7) 1,517 0 0 0Conjunctive Use9 Groundwater recharge Only during flood years
Subtotal 100,693 94,419 91,373 95,214
C. Overall Water Budget
Worksheet 21. Quantify Water Supplies (AF)Water Supplies 2010 2013 2014 2015
Surface Water On-Farm Deliveries (worksheet 9) 40,736 2,728 0 2,600District Ground Water 0 0 0 0Annual Effective Precipitation (total worksheet 18) 18,832 0 5,723 786
Subtotal 59,568 2,728 5,723 3,386
Worksheet 22. Budget Summary (AF)Water Accounting 2010 2013 2014 2015
Subtotal of Water Supplies (worksheet 21) 59,568 2,728 5,723 3,386Subtotal of Water Use (worksheet 20) 100,693 94,419 91,373 95,214
Total Estimated Groundwater Needed 41,125 91,691 85,650 91,828
Worksheet 9, under representative year 2010, demonstrates that through conveyance and reservoirseepage the District recharged 24,622 acre feet. The Budget Summary, Worksheet 22 above, shows agroundwater need of 41,125 acre feet. This indicates a slight overdraft of 16,503 acre feet. Additional

23
groundwater recharge is achieved by Kings River Channel seepage, which was 17,628 acre feet in 2010.This indicates that groundwater use and recharge is essentially balanced in a typical year. Please referto Worksheet 8 for depth to groundwater within the District to exhibit that conjunctive use is workingeffectively.

24
Section 6: Climate Change
Climate Change – Kings River Service Area and Surrounding Counties
In general, climate change models are predicting annual average statewide temperature rises of up to 4degrees Celsius and up to 5 degrees Celsius for individual months. The changes will differ by locationwith the smallest increases forecast for the Tulare Lake Hydrologic Region. February, March and Mayare shown to have the largest temperature increase. The net result is milder winter temperature andearlier arrival of spring and increased summer temperatures. Snow accumulation is significantlydecreased in all months, with snow accumulation still beginning in November but with lower monthlyaccumulations and ending about one month earlier. The impact would be much less in the highelevations of southern Sierra. Translated to the San Joaquin River and Tulare Lake Hydrologic regions,about 70 percent of the snow zone would remain. It is anticipated that the overall levels ofevapotranspiration will increase while soil moisture will generally decline except in areas whereprecipitation will significantly increase. The higher water consumption with warmer temperatures willlikely only be partially offset by carbon dioxide-base reductions, thus the net result could be slightlyhigher agricultural water requirements. It is expected that warmer winter temperatures betweenstorms would increase evapotranspiration, thereby drying out the soil between storms. Changes ingroundwater recharge would likely result from changes in effective rainfall as well as a change in thetiming of the recharge season (journal of the American Water Resources).
Total Demand Change Does Not Meet the Regional Goals - Primarily a Maintenance Issue for Fire
The changes in total water demand in the Tulare Lake Hydrologic Region were cast into three scenarios:
1. Current TrendsCurrent trends are assumed to continue into the future. California’s population is projected toreach nearly 60 million by 2050. Affordable housing draws families to the interior valley.Through the passage of time, areas where urban development and natural resources restorationincreases, irrigated crop lands decreases.
2. Slow and Strategic GrowthPopulation growth is assumed to be slower than currently projected – a California population ofabout 45 million by 2025. Californians implement water and energy conservation measures.Conversion of agricultural land to urban development has slowed. State governmentimplements comprehensive programs to improve water quality, protect fish and wildlife andprotect communities from flooding.
3. Expansive Growth
Future conditions are assumed to occur at a more rapid pace than currently projected and arethus more resource exhaustive. California population is projected to reach approximately 70million by 2050. Families prefer low-density housing, and may pursue rural rather than urban
25
residential properties increasing the footprints of urban areas. Minor changes to water andenergy conservation programs are offered but are adopted at a slower rate than trends earlierin the century. Irrigated crop land decreases significantly whereas urban development andenvironmental habitat restoration increase.
Changes in water demand are based on the difference between the historical average (1998-2005) andfuture estimated average (2043-2050) water demands. Future water demand relative to the historicalaverage applied to a no climate change scenario indicates a reduction of about 550,000 acre feet undercurrent trends. The reduction was even more significant under the Slow and Strategic Growth scenario.The Expansive Growth scenario nets a decrease in water demand (150,000 acre-feet). When comparedagainst 12 climate change sequences, the Current Trends scenario shows a lower reduction in waterdemand - 435,000 acre-feet to an increase of almost 200,000 acre-feet. The Slow and Strategic Growthscenario also shows a lower future water demand than historical demands across the 12 climatesequences. Under the Expansive Growth scenario, the range of possible future water demand variesacross the 12 climate sequences; from a decrease of 35,000 acre-feet to an increase of 650,000 acre-feet.
Agricultural Demand Change
Agricultural water demands in the Kings River Service Area will be generally lower under futureconditions estimates due to the reduction in irrigated acreage, increase in water conservation andutilization of water use efficiency products. The Slow and Strategic Growth scenario had a slightly largerreduction followed by the Current Trends and Expansive Growth scenarios. When climate change is theassumed outcome, there is a smaller reduction in future water demand under all three trends.
In an August 2009 paper prepared by the California Climate Change Center entitled “Climate ChangeImpacts on Water Supply and Agricultural Water Management In California’s Western San JoaquinValley and Potential Adaptation Strategies” results of an analysis conducted using the Water Evaluationand Planning (WEAP) modeling system were presented. WEAP was developed for the SacramentoRiver and Delta export region of the San Joaquin and was expanded to include agricultural areas in theTulare Lake Basins that receive water pumped from the Delta. The model is an integratedrainfall/runoff water resources systems modeling framework that can be applied directly from timeseries of climatic scenarios as well as the water management ramifications of hydrologic change to beassessed.
Future climate scenarios were developed based on downscaling of two general circulation models – theGeophysical Fluid Dynamic Laboratory model and the Parallel Climate Model – run under two emissionsscenarios. The results suggested that increased agricultural demand under climate change due toincreased evapotranspiration (ET) would place additional stress on the effectiveness of two agriculturaladaptations; improved on-farm efficiency and crop shifts toward lower consumption/higher value cropsin times of shortage. These practices were considered to be effective at reducing supply shortfalls inagriculture.
26
Water Supply
Most of the water users within the Tulare Lake Basin receive surface water deliveries from snowmelt inthe Sierra Nevada Mountains designed around a system which is dependent on occasional above normalsnow pack. In normal years and depending on previous years’ storage carry-over, local reservoirs withinthe region are able store all snow melt during periods of low/no demand. Flood releases occur on theKings River on average once every 4 years as a result of above average snow melt. During these floodevents, flood water typically exits the region because of the lack of banking and groundwater rechargefacilities to store the water.
Laguna Irrigation District in an effort to prepare for such events where flood events occur has a series ofregulation reservoirs which can be used to temporarily store water for near term use and to rechargethe groundwater though percolation. Additional facilities that will greatly increase the District’s annualgroundwater recharge capacity in flood years are planned.
Future climate change impacts may result in reduced snowpack, more precipitation as rain than snowand higher temperatures leading to higher evaporation. Over an extended period of time, conditionscould potentially exacerbate the declines in surface and groundwater supplies in the region. Climatechange may also alter the total amounts of runoff in watersheds. While precipitation projections do notshow a clear trend in the future, an ensemble of twelve climate models shows a trend of decreasingrunoff for Southern California between the end of the twentieth and twenty first centuries (IPCC 2008).
Water Demand
Water users receiving Kings River water generally hold much of their water in storage behind Pine FlatDam for delivery during the coordinated summer irrigation run period. The intent of the summer waterrun is to provide the most effective and efficient method of water delivery when local demands are attheir peak. In the summer the majority of water consumed in the region is applied towards irrigatingcrops. Surface and groundwater demands are very low in the winter months during which time mostpermanent crops are dormant, a large percentage of row crop farmland is idle, and typical winterprecipitation provides most of the needed moisture. Historically, water users have been able tosupplement surface water supplies with groundwater, resulting in continuous and uninterruptedavailability of water.
However, with or without the future impacts from climate change the region will continue to struggle tomeet water demands without the addition of new ground and surface water projects. Waterconservation and irrigation management will also help reduce water demands. The seasonal componentof water demands (e.g., irrigation and other water uses) will likely increase with climate change asdroughts become more common and more severe, temperatures alter evapotranspiration rates, andgrowing seasons become longer. Without accounting for changes in evapotranspiration rates,agricultural crop and urban outdoor demands are expected to increase in the Sacramento Valley, forexample, by as much as 6% (Chung et al 2009).
Water QualitySurface water in the region predominately comes from Sierra snowmelt and is cold and of extremely highquality. Local surface water supplies are able to meet all beneficial uses, which include agricultural,
27
industrial, recreation, aquatic habitat and municipal water use. If future climates impacts result in morefrequent flood events then flood water will become more readily available for groundwater recharge.This would allow for the capture of extremely high quality surface water and improve the existinggroundwater quality in the region. Agricultural management practices and irrigation management willalso continue to play an important role in the improvement of water quality. Higher temperatures arelikely to increase the rates of chemical reactions in water generally, increasing rates of algal growth anddecay, perhaps adding problems and instability to the water quality throughout the region.
Water quality can be impacted by both extreme increases and decreases in precipitation. Increases instorm event severity may result in increased turbidity in surface water supplies (DWR 2008). Loweredsummertime precipitation may also leave contaminants more concentrated in stream flows. Higherwater temperatures may exacerbate reservoir water quality issues associated with dissolved oxygenlevels; and increased algal blooms (DWR 2008).
Sea Level Rise
The Kings Basin is at an average elevation of about 300 feet above mean sea level and is approximately100 miles from the ocean. Based upon current estimates of sea level rise due to global climate change,the region is under no threat of impact.
Flooding
Most of the floodplains in the Kings River Service Area are farmland. Some houses, roads, and watersupply infrastructure (wells, canals, etc.) are located in the floodplains. Friant Dam along the northernboundary on the San Joaquin River is considered to be in good condition. Major flooding would notlikely cause serious disruptions to essential emergency-response services.
Future Climate Conditions in Kings Basin and the Surrounding Counties
The Service Area has a reliable water supply, largely because groundwater is a dependable backupsupply during droughts and dry season. However, groundwater levels may continue to decline as aresult of below normal snowpack and increased groundwater demands if climate changes reducesprecipitation or causes earlier spring run-off that cannot be stored. If groundwater levels decline toomuch then groundwater will become a less reliable supply, and groundwater quality may also beadversely impacted. Susceptibility to climate change can be measured with several parametersincluding groundwater overdraft, groundwater level decline, groundwater remaining in storage, andchanges in well yields.
Adaptation to climate change within the agricultural sector is likely to occur naturally in response toeconomic signals that are driven by public policy, market conditions and the availability of irrigationwater supply. As a result of existing and anticipated future pressures, growers will increase their use ofwater use efficiency products such that most corps will employ drip or micro sprinklers in the future.
28
As an example, Laguna Irrigation District has already seen the impact of water use efficiency inpermanent crops. Almost all of the Grapes are currently under drip irrigation and nearly all of the newAlmond plantings are micro sprinkled or under some form of drip irrigation. Recent improvements insubsurface irrigation have also allowed for reduced water use in Tomatoes, Cotton and now Alfalfa.The water savings has been evident in the District being able to extend the internal water supply by upto 7 days in a “normal” water year.
Improvements in irrigation efficiency will likely be achieved applying less water to allow soils tobecome dryer through properly managed irrigation scheduling. This would reduce the lower thresholdsupply requirement because the irrigation is less frequent and similar reductions in the upperthreshold imply that the same depth of water will be applied at the scheduled irrigation. This practicewould help reduce irrigation losses to surface water run-off. However, as a result of reduced soilmoisture, percolation to groundwater is also reduced and thus reducing the water table in the region.The net effects of climate warming on total runoff volumes are still unclear and highly uncertain(Dettinger 2005). It is likely to be decades before we know if and by how much precipitation andrunoff volumes are changing (Klemes 2000a, b).
Higher temperatures could reduce losses for some crops based on fewer occurrences of winterfreezes, but may negatively impact other crops that rely on winter freezes to kill pests and triggereffective dormancy. Higher temperatures could also result in lower yields. Currently there are noadaptation measures available for these impacts, other than changing crop types, which may not beeconomically viable if permanent crops are impacted.
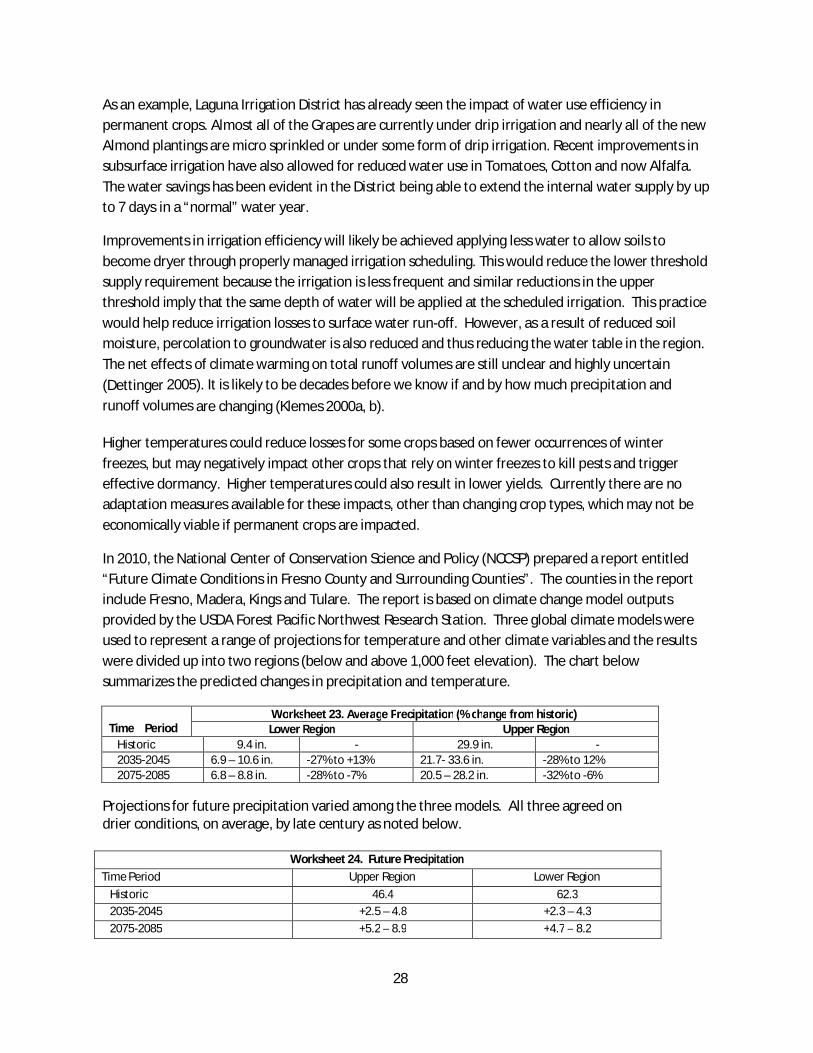
In 2010, the National Center of Conservation Science and Policy (NCCSP) prepared a report entitled“Future Climate Conditions in Fresno County and Surrounding Counties”. The counties in the reportinclude Fresno, Madera, Kings and Tulare. The report is based on climate change model outputsprovided by the USDA Forest Pacific Northwest Research Station. Three global climate models wereused to represent a range of projections for temperature and other climate variables and the resultswere divided up into two regions (below and above 1,000 feet elevation). The chart belowsummarizes the predicted changes in precipitation and temperature.
Time PeriodWorksheet 23. Average Precipitation (% change from historic)Lower Region Upper Region
Historic 9.4 in. - 29.9 in. -2035-2045 6.9 – 10.6 in. -27% to +13% 21.7- 33.6 in. -28% to 12%2075-2085 6.8 – 8.8 in. -28% to -7% 20.5 – 28.2 in. -32% to -6%
Projections for future precipitation varied among the three models. All three agreed ondrier conditions, on average, by late century as noted below.
Worksheet 24. Future PrecipitationTime Period Upper Region Lower Region
Historic 46.4 62.32035-2045 +2.5 – 4.8 +2.3 – 4.32075-2085 +5.2 – 8.9 +4.7 – 8.2
29
General Climate Change Predictions
“In the most general sense, climate change is the long-term change in the statistical distribution ofweather patterns over periods ranging from decades to millions of years. It is well documentedand widely accepted that the Earth’s climate has fluctuated and changed throughout history.Global warming is the name given to the increase in the average temperature of the Earth's near-surface air and oceans that has been observed since the mid-20th century and is projected tocontinue. Warming of the climate system is now considered to be unequivocal (InternationalPanel on Climate Change 2007). Global warming, therefore, refers to a specific type of rapidclimate change occurring over the last 60 years and projected to continue into the future whichfalls outside of the normal range of historic climate variation.” – Climate Change Handbook forRegional Water Planning
The California Department of Water Resources (DWR), 2008, “Climate Change Adaptation Strategiesfor California’s Water” notes that water managers should use a drought component that assumes,until more accurate information becomes available, a 20% increase in the frequency and duration offuture dry conditions. DWR projects the Sierra snowpack will experience a 25 to 40 percentreduction from its historic average by 2050.
The Sierra Nevada Alliance, in their second addition of the Sierra Climate Change Toolkit, predict (inmost cases) the total annual streamflow into major Sierra Nevada reservoirs is projected to dropabout 10 to 20 percent before mid-century and 20 to 30 percent before the end of the century.
The Ahwannee Principles for Climate Change, produced by the Local Government Commission in2009, indicate the State’s largest reservoir (snowpack) is predicted to lessen by one third over thenext 50 years and to half by the end of the century.
Adaptation Measures
The Upper Kings Integrated Regional Water Management Authority (UKBIRWMA) is a collaborativeeffort amongst 53 public, private and non-governmental agencies to manage water resources withinthe region. Laguna Irrigation District serves as interested party to the Authority. As part of the plan, aworkgroup was formed to address climate change adaptation and concluded that no-regret strategiesshould comprise the majority of adaptation measures. The following management strategies weredeemed the most practical and effective for climate change adaptation in the Kings Basin:
· Improve urban and agricultural water efficiency· Increase use of recycled water (where energy efficient)· Revise land use planning policies to encourage conservation· Develop groundwater recharge and banking projects· Develop storage project inside and outside of the Kings Basin· Increase ability to capture floodwater both for flood control and water supply· Restore mountain meadows, wetlands, and riparian areas to regulate flows resulting in more
summer runoff· Change crop types to accommodate climate change.
The primary adaptation objective in the region and surrounding counties addressing water supply
30
impacts from climate change is to eliminate or reduce groundwater overdraft.
Monitoring
The Kings Basin has an extensive network for monitoring the hydrology, meteorology, water demands,water use, crop yields and wildlife. Monitoring programs are continually evaluated and upgraded aswell as the need for improvements to assess climate change will also be periodically evaluated. Eventhough certain changes with respect to hydrology are unclear based on some scientific models as towhether the region will have a wet or dry future climate, future projects will continue to be sought outbased on historical hydrology until more decisive predictions are available.
As new technology continues to mitigate and adapt to climate, CDWR (California Department of WaterResources) will continue to provide revised estimates of changes in sea levels, drought, and floodingthat may occur over the following 25 years.
Mitigation of Greenhouse Gas Emissions (GHG)
Promoting and developing water projects that reduce energy demand and enhance ecosystemrestoration will reduce emissions help mitigate climate change. As an example, riparian habitatrestoration area can sequester carbon and create habitat for species effect by climate change. Bypromoting water conservation efforts using best management irrigation practices will also help toconserve water and reduce energy demands.

31
Section 7: Drought Management Plan
As a conjunctive use district with a highly variable surface water supply, the District and its water usersare constantly juggling supply and demand and landowners must pump groundwater to make up forthe deficit between demand and available surface water supplies. In accordance with the Rules andRegulations, the District allocates all available water supply each year among water users whose landsare classified as Irrigation Rate (and are not delinquent on any payments) on a pro-rata equal amountper acre in so far as practical. In most years, there is usually more demand for surface water than thereis supply, so proper water management is critical. Water users in the District must have a private deepgroundwater well in order to supplement surface water available from the District. For decades, theDistrict has taken a multi-year approach to drought management by developing and operatingnumerous recharge basins that capture water in average and wet years. Then, during below averageyears, growers utilized their private wells to meet demands. The District captures as much floodwateras possible during wet years to deliver water to growers and recharge basins.
In most years, especially average and below normal years, the District coordinates with the other lowerriver units to deliver water down the lower Kings River system to maximize water deliveries and minimizeriver seepage losses. The “coordinated water run” can be several months long or only a couple of weekslong, depending on the river runoff and water supply available to the lower river units. The Districtprovides early communication and periodic updates to water users on the projected water supply andallocation, when the coordinated run will start, and the projected duration of the coordinated run.
Laguna Irrigation District encourages water efficiency by allowing those growers who use less than theirannual allocation of surface water to transfer their unneeded surface water to other growers within ourDistrict. The transferred water is then accounted to the end user.
In the case where a water user is wasting water or using water in a manner deemed inefficient, theDistrict may stop water deliveries until such time as the landowner follows all policies of Laguna I.D.This is accomplished by closing and locking the headgate to stop water flow. See Rule #13, Rules andRegulations in Section 9: Supporting Documents.
In below normal and drought years, the District will minimize expenditures as much as possible toreduce operating costs. The District historically has collected revenue through acreage basedassessments and will be collecting additional revenue through volumetric water charges based on thequantity of water delivered, measured in acre-feet. The volumetric water rate is established by theDistrict each year to cover projected expenditures that exceed the revenue collected through theacreage based assessments.
32
Section 8: Water Use Efficiency Information
Report of EWMPs
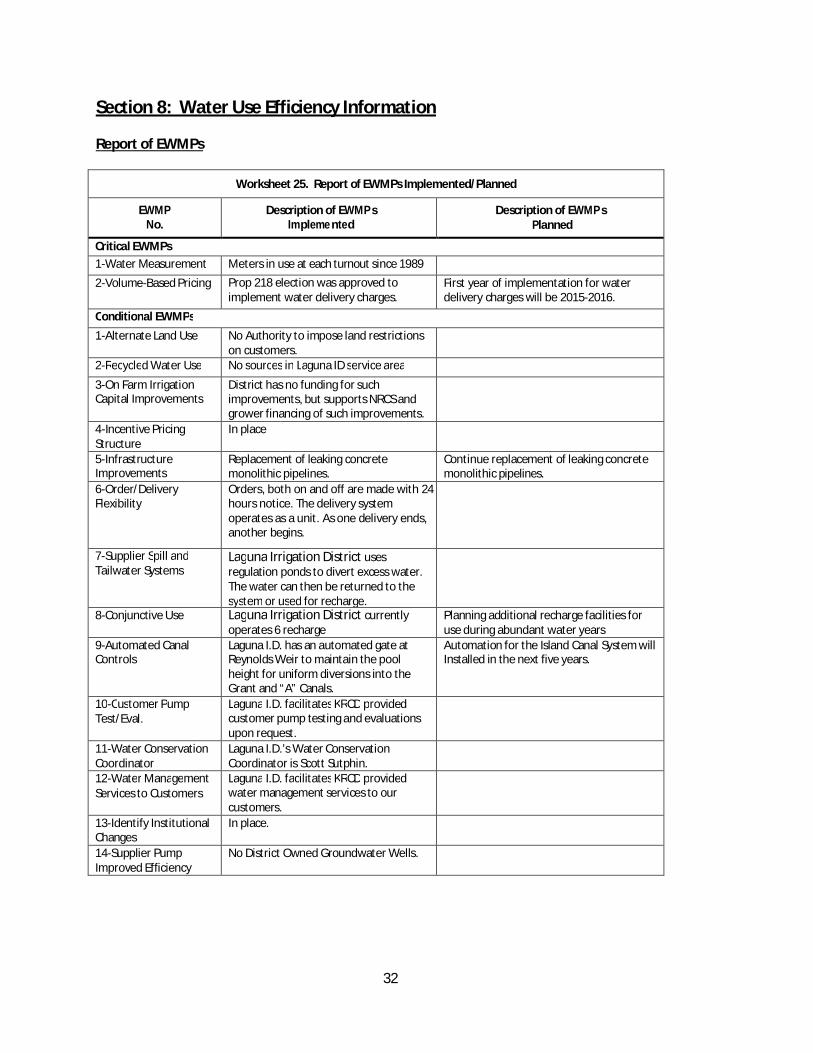
Worksheet 25. Report of EWMPs Implemented/Planned
EWMPNo.
Description of EWMP sImpleme nted
Description of EWMP sPlanned
Critical EWMPs1-Water Measurement Meters in use at each turnout since 19892-Volume-Based Pricing Prop 218 election was approved to
implement water delivery charges.First year of implementation for waterdelivery charges will be 2015-2016.
Conditional EWMPs1-Alternate Land Use No Authority to impose land restrictions
on customers.2-Recycled Water Use No sources in Laguna ID service area
3-On Farm IrrigationCapital Improvements
District has no funding for suchimprovements, but supports NRCS andgrower financing of such improvements.
4-Incentive PricingStructure
In place
5-InfrastructureImprovements
Replacement of leaking concretemonolithic pipelines.with Plastic
Continue replacement of leaking concretemonolithic pipelines.pipelines with plastic6-Order/Delivery
FlexibilityOrders, both on and off are made with 24hours notice. The delivery systemoperates as a unit. As one delivery ends,another begins.
7-Supplier Spill andTailwater Systems
Laguna Irrigation District usesregulation ponds to divert excess water.The water can then be returned to thesystem or used for recharge.
8-Conjunctive Use Laguna Irrigation District currentlyoperates 6 rechargefacilities
Planning additional recharge facilities foruse during abundant water years
9-Automated CanalControls
Laguna I.D. has an automated gate atReynolds Weir to maintain the poolheight for uniform diversions into theGrant and “A” Canals.
Automation for the Island Canal System willInstalled in the next five years.
10-Customer PumpTest/Eval.
Laguna I.D. facilitates KRCD providedcustomer pump testing and evaluationsupon request.
11-Water ConservationCoordinator
Laguna I.D.’s Water ConservationCoordinator is Scott Sutphin.
12-Water ManagementServices to Customers
Laguna I.D. facilitates KRCD providedwater management services to ourcustomers.
13-Identify InstitutionalChanges
In place.
14-Supplier PumpImproved Efficiency
No District Owned Groundwater Wells.
33
Critical EWMPs
1. Water MeasurementThe District has, since 1989, primarily used Water Specialties propeller type meters. Thesedevices are made to deliver readings to an accuracy of 98% by volume. These meters areused for all of the farm delivery measurements within the District.
Laguna Irrigation District considers that it has adequately implemented this EWMP.
2. Volume base pricingLaguna Irrigation District, as required by law, sought approved from the landowners througha Prop 218 election in 2014 to impose a water toll charge based on the volume of waterdelivered. The water delivery charge will be established each year by the District, not toexceed $5.00 per acre-foot. The water delivery charge will be in addition to the land basedassessment, except for the first year of implementation in 2015-2016 when the waterdelivery charge will be phased in by offsetting the land based assessment by the amount ofthe water delivery charge. The full land based assessment and water delivery charge will belevied in the 2016-17 assessment period and thereafter, without offset.
Conditional EWMPs
1. Alternate Land UseLaguna Irrigation District does not have the authority to impose land restrictions onlandowners in the District. However, the District has no lands with exceptionally highshallow water tables or whose irrigation contributes to on farm or recognizeddownstream drainage issues.
No action on this EWMP is required.
2. Recycled Water UseCurrently, there are no sources of this type of water within the District.
No action on this EWMP is required.
3. On-Farm Irrigation Capital ImprovementsLaguna Irrigation District does not have the funding necessary to facilitate suchimprovements, but supports NRCS and grower financing of such improvements. District Staffdoes help facilitate and offers technical help with drip and micro sprinkler irrigation as wellas assistance in design of surface water delivery facilities for such projects.
Laguna Irrigation District considers that it has adequately implemented this EWMP.
34
4. Incentive Pricing StructureThe current pricing structure of the District allocates available water on a per acre basis.Therefore, the price of the water increases in dry years because the landowners receive lesswater per acre. The price effectively decreases in wet years as there is more wateravailable. In these years, surface water use is encouraged to aid with recharge for future dryyears as the District is a conjunctive use entity.
No action on this EWMP is required.
5. Infrastructure ImprovementsLaguna Irrigation District has been replacing existing broken or leaking concrete monolithicpipelines with plastic pipe. The District continues this practice as funds allow. The currentpipeline system replaced high seepage canals in the 1960’s through the 1980’s. The balanceof the Laguna Irrigation District canals are of relatively good soil type, and due to the District’sconjunctive use nature, it would not be beneficial to line additional canals or convert them topipeline.
Laguna Irrigation District considers that it has adequately implemented this EWMP.
6. Order/Delivery FlexibilityLaguna Irrigation District’s delivery system works as a complete unit. Customers order water aminimum of 24 hours before their desired delivery start. Customers give 24 hours prior to theirshutoff in order to deliver that water to another customer. In effect, one customer finishesirrigating and another is able to take that water and begin his irrigation. This minimizes thefluctuation of water and reduces the possibility of water loss. Any errors in shut off times by acustomer can be compensated for with early start by another customer or temporary diversionto a District regulation reservoir.
Laguna Irrigation District considers that it has adequately implemented this EWMP.
7. Supplier Spill and Tailwater SystemsLaguna Irrigation District uses regulation ponds to divert excess water to eliminatespillage. The short term stored water can then be returned to the system or used forrecharge.
Laguna Irrigation District considers that it has adequately implemented this EWMP.
8. Conjunctive UseThe proximity to the Kings River and the soil types in the area are one facet of conjunctive usein the District. Laguna Irrigation District currently operates six recharge facilities along with 49
35
miles of open canal. The District could not survive without conjunctive use as its surface watersupply is generally not sufficient to meet the water needs of its landowners.
In order to take full advantage of abundant water years, the District plans to construct additionalrecharge facilities as property and funding allow.
Laguna Irrigation District considers that it has adequately implemented this EWMP.
9. Automated Canal ControlsLaguna Irrigation District has an automated gate at the Reynolds Weir to maintain the poolheight for uniform diversions into the Grant and “A” Canals. The District plans to installautomation controls for the Island Canal System.
Laguna Irrigation District considers that it has adequately implemented this EWMP.
10. Customer Pump Test/EvaluationLaguna Irrigation District facilitates customer pump testing and evaluations by theKings River Conservation District, upon request.
Laguna Irrigation District considers that it has adequately implemented this EWMP.
11. Water Conservation CoordinatorLaguna Irrigation District has designated Steven Sutphin as water conservation coordinator.
Steven SutphinLaguna Irrigation District office (559) 923-42395065 19 ½ Avenue cell (559) 352-7903Riverdale, CA 93656 e-mail [email protected]
Laguna Irrigation District considers that it has adequately implemented this EWMP.
12. Water Management Services to CustomersThe District works in cooperation with the Kings River Conservation District to assist valleyfarmers with finding the most efficient and cost-effective use of water. Growers can schedulean appointment for a member of the KRCD staff to visit the location to review currentirrigation practices.
Laguna Irrigation District considers that it has adequately implemented this EWMP.
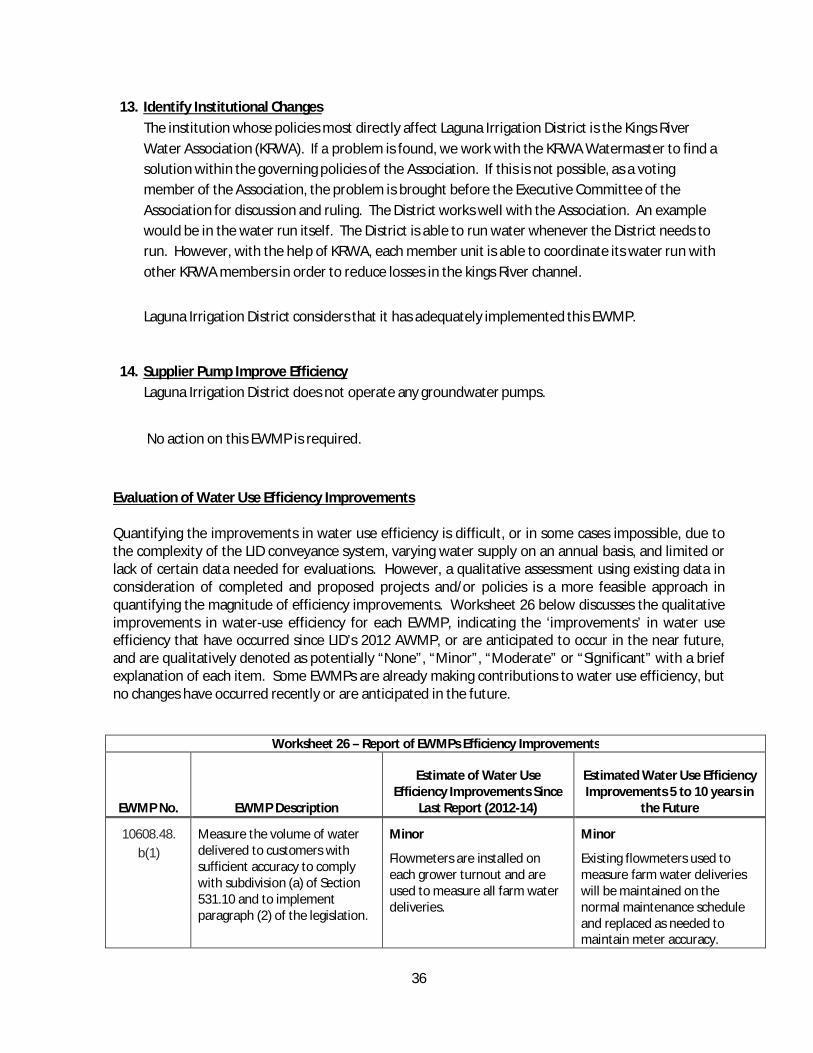
36
13. Identify Institutional ChangesThe institution whose policies most directly affect Laguna Irrigation District is the Kings RiverWater Association (KRWA). If a problem is found, we work with the KRWA Watermaster to find asolution within the governing policies of the Association. If this is not possible, as a votingmember of the Association, the problem is brought before the Executive Committee of theAssociation for discussion and ruling. The District works well with the Association. An examplewould be in the water run itself. The District is able to run water whenever the District needs torun. However, with the help of KRWA, each member unit is able to coordinate its water run withother KRWA members in order to reduce losses in the kings River channel.
Laguna Irrigation District considers that it has adequately implemented this EWMP.
14. Supplier Pump Improve EfficiencyLaguna Irrigation District does not operate any groundwater pumps.
No action on this EWMP is required.
Evaluation of Water Use Efficiency Improvements
Quantifying the improvements in water use efficiency is difficult, or in some cases impossible, due tothe complexity of the LID conveyance system, varying water supply on an annual basis, and limited orlack of certain data needed for evaluations. However, a qualitative assessment using existing data inconsideration of completed and proposed projects and/or policies is a more feasible approach inquantifying the magnitude of efficiency improvements. Worksheet 26 below discusses the qualitativeimprovements in water-use efficiency for each EWMP, indicating the ‘improvements’ in water useefficiency that have occurred since LID’s 2012 AWMP, or are anticipated to occur in the near future,and are qualitatively denoted as potentially “None”, “Minor”, “Moderate” or “Significant” with a briefexplanation of each item. Some EWMPs are already making contributions to water use efficiency, butno changes have occurred recently or are anticipated in the future.
Worksheet 26 – Report of EWMPs Efficiency Improvements
EWMP No. EWMP Description
Estimate of Water UseEfficiency Improvements Since
Last Report (2012-14)
Estimated Water Use EfficiencyImprovements 5 to 10 years in
the Future
10608.48.b(1)
Measure the volume of waterdelivered to customers withsufficient accuracy to complywith subdivision (a) of Section531.10 and to implementparagraph (2) of the legislation.
Minor
Flowmeters are installed oneach grower turnout and areused to measure all farm waterdeliveries.
Minor
Existing flowmeters used tomeasure farm water deliverieswill be maintained on thenormal maintenance scheduleand replaced as needed tomaintain meter accuracy.
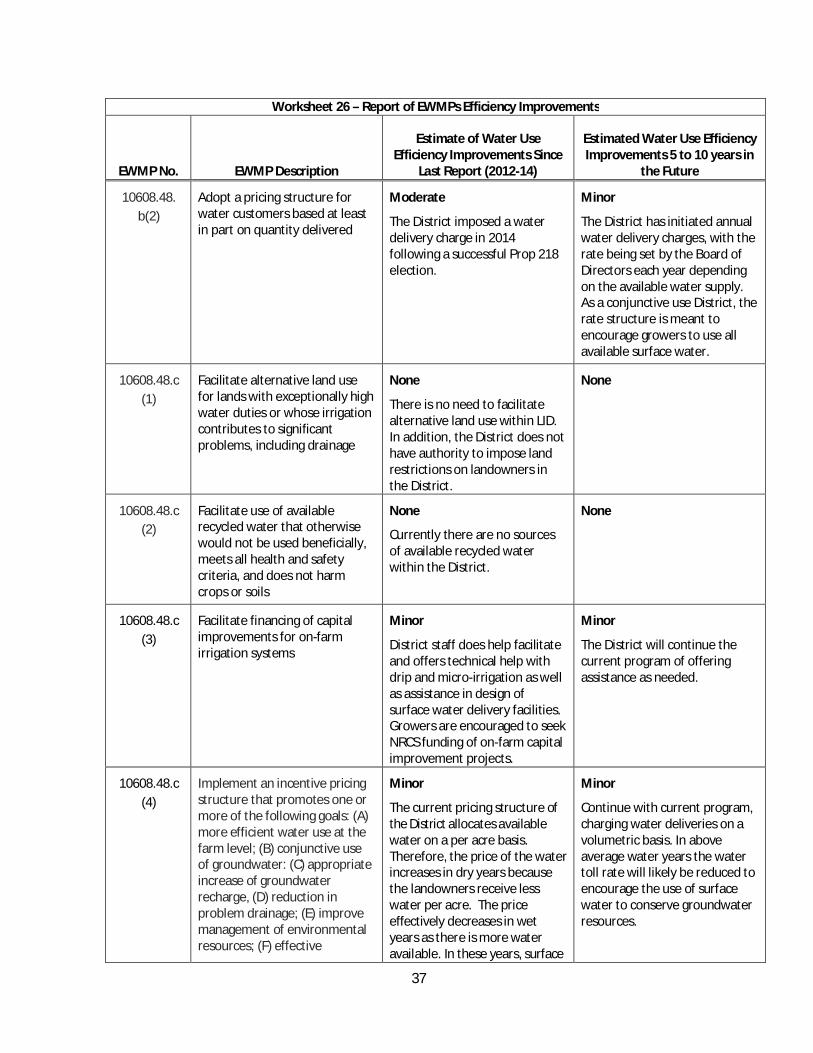
37
Worksheet 26 – Report of EWMPs Efficiency Improvements
EWMP No. EWMP Description
Estimate of Water UseEfficiency Improvements Since
Last Report (2012-14)
Estimated Water Use EfficiencyImprovements 5 to 10 years in
the Future
10608.48.b(2)
Adopt a pricing structure forwater customers based at leastin part on quantity delivered
Moderate
The District imposed a waterdelivery charge in 2014following a successful Prop 218election.
Minor
The District has initiated annualwater delivery charges, with therate being set by the Board ofDirectors each year dependingon the available water supply.As a conjunctive use District, therate structure is meant toencourage growers to use allavailable surface water.
10608.48.c(1)
Facilitate alternative land usefor lands with exceptionally highwater duties or whose irrigationcontributes to significantproblems, including drainage
None
There is no need to facilitatealternative land use within LID.In addition, the District does nothave authority to impose landrestrictions on landowners inthe District.
None
10608.48.c(2)
Facilitate use of availablerecycled water that otherwisewould not be used beneficially,meets all health and safetycriteria, and does not harmcrops or soils
None
Currently there are no sourcesof available recycled waterwithin the District.
None
10608.48.c(3)
Facilitate financing of capitalimprovements for on-farmirrigation systems
Minor
District staff does help facilitateand offers technical help withdrip and micro-irrigation as wellas assistance in design ofsurface water delivery facilities.Growers are encouraged to seekNRCS funding of on-farm capitalimprovement projects.
Minor
The District will continue thecurrent program of offeringassistance as needed.
10608.48.c(4)
Implement an incentive pricingstructure that promotes one ormore of the following goals: (A)more efficient water use at thefarm level; (B) conjunctive useof groundwater: (C) appropriateincrease of groundwaterrecharge, (D) reduction inproblem drainage; (E) improvemanagement of environmentalresources; (F) effective
Minor
The current pricing structure ofthe District allocates availablewater on a per acre basis.Therefore, the price of the waterincreases in dry years becausethe landowners receive lesswater per acre. The priceeffectively decreases in wetyears as there is more wateravailable. In these years, surface
Minor
Continue with current program,charging water deliveries on avolumetric basis. In aboveaverage water years the watertoll rate will likely be reduced toencourage the use of surfacewater to conserve groundwaterresources.
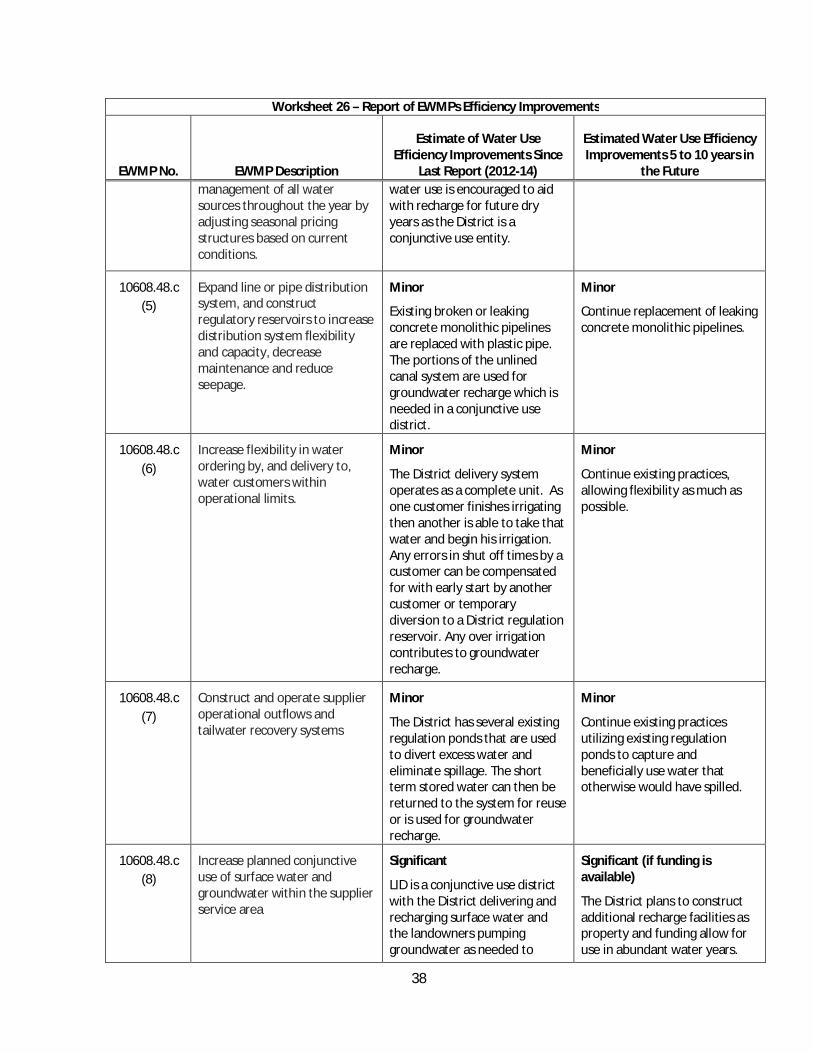
38
Worksheet 26 – Report of EWMPs Efficiency Improvements
EWMP No. EWMP Description
Estimate of Water UseEfficiency Improvements Since
Last Report (2012-14)
Estimated Water Use EfficiencyImprovements 5 to 10 years in
the Futuremanagement of all watersources throughout the year byadjusting seasonal pricingstructures based on currentconditions.
water use is encouraged to aidwith recharge for future dryyears as the District is aconjunctive use entity.
10608.48.c(5)
Expand line or pipe distributionsystem, and constructregulatory reservoirs to increasedistribution system flexibilityand capacity, decreasemaintenance and reduceseepage.
Minor
Existing broken or leakingconcrete monolithic pipelinesare replaced with plastic pipe.The portions of the unlinedcanal system are used forgroundwater recharge which isneeded in a conjunctive usedistrict.
Minor
Continue replacement of leakingconcrete monolithic pipelines.
10608.48.c(6)
Increase flexibility in waterordering by, and delivery to,water customers withinoperational limits.
Minor
The District delivery systemoperates as a complete unit. Asone customer finishes irrigatingthen another is able to take thatwater and begin his irrigation.Any errors in shut off times by acustomer can be compensatedfor with early start by anothercustomer or temporarydiversion to a District regulationreservoir. Any over irrigationcontributes to groundwaterrecharge.
Minor
Continue existing practices,allowing flexibility as much aspossible.
10608.48.c(7)
Construct and operate supplieroperational outflows andtailwater recovery systems
Minor
The District has several existingregulation ponds that are usedto divert excess water andeliminate spillage. The shortterm stored water can then bereturned to the system for reuseor is used for groundwaterrecharge.
Minor
Continue existing practicesutilizing existing regulationponds to capture andbeneficially use water thatotherwise would have spilled.
10608.48.c(8)
Increase planned conjunctiveuse of surface water andgroundwater within the supplierservice area
Significant
LID is a conjunctive use districtwith the District delivering andrecharging surface water andthe landowners pumpinggroundwater as needed to
Significant (if funding isavailable)
The District plans to constructadditional recharge facilities asproperty and funding allow foruse in abundant water years.

39
Worksheet 26 – Report of EWMPs Efficiency Improvements
EWMP No. EWMP Description
Estimate of Water UseEfficiency Improvements Since
Last Report (2012-14)
Estimated Water Use EfficiencyImprovements 5 to 10 years in
the Futuresupplement the surface water.LID currently operates sixrecharge facilities along with 49miles of open canal. A largerecharge basin is currentlyunder construction and will beoperational in 2016.
10608.48.c(9)
Automate canal controlstructures
None
The District previously installedan automated gate at theReynolds Weir to maintain thewater level for uniformdiversions into the Grant and“A” Canals.
Significant (if funding isavailable)
The District plans to installautomation controls for theIsland Canal System.
10608.48.c(10)
Facilitate or promote customerpump testing and evaluation
None
LID facilitates customer pumptesting and evaluations by theKings River Conservation Districtupon request, which can lead tomore efficient pumping and lessenergy use.
None
10608.48.c(11)
Designate a water conservationcoordinator who will developand implement the watermanagement plan and prepareprogress reports
Minor
A District staff member servesas the Water ConservationCoordinator and oversees waterconservation measures andprograms.
Minor
Continue existing program.
10608.48.c(12)
Provide for the availability ofwater management services towater users.
Minor
LID works in cooperation withthe Kings River ConservationDistrict to assist growers withimplementing efficient and cost-effective measures to improvewater management.
Minor
Continue existing program.
10608.48.c(13)
Evaluate the policies of agenciesthat provide the supplier withwater to identify the potentialfor institutional changes toallow more flexible waterdeliveries and storage.
Minor
The institution whose policiesmost directly affect LID is theKings River Water Association(KRWA). The Districtcooperatively works with KRWAand other member units toresolve issues and manage
Minor
Continue existing cooperativeefforts.
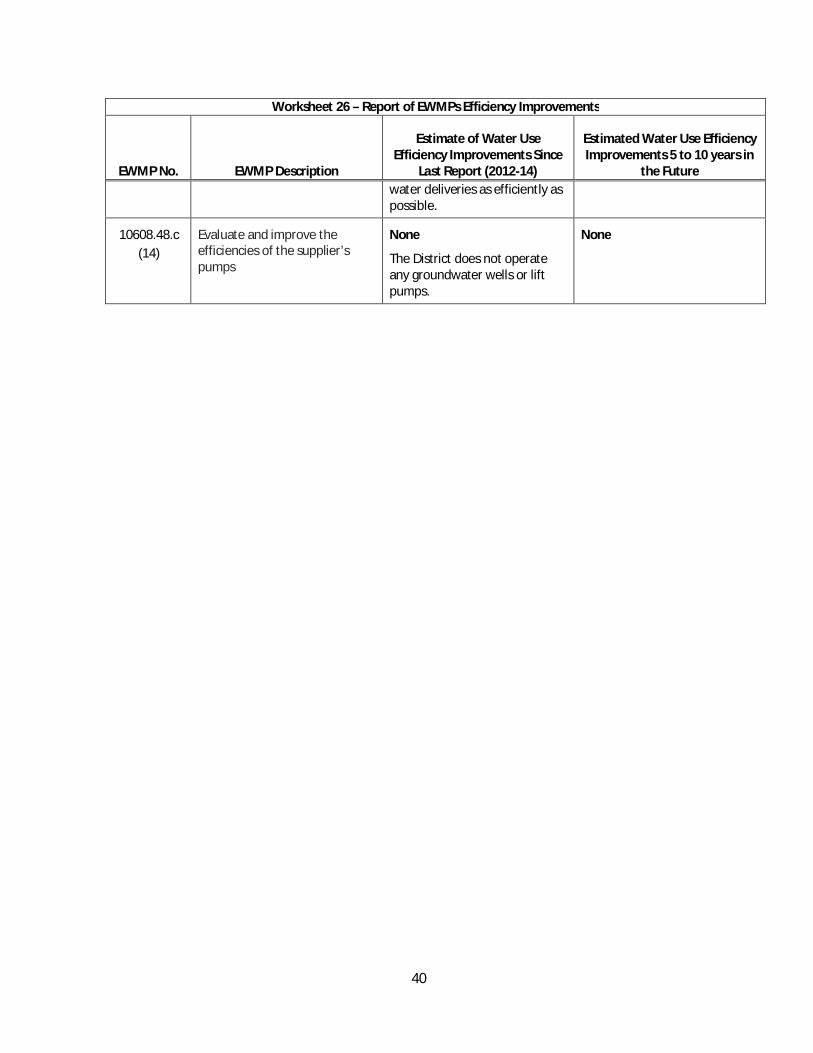
40
Worksheet 26 – Report of EWMPs Efficiency Improvements
EWMP No. EWMP Description
Estimate of Water UseEfficiency Improvements Since
Last Report (2012-14)
Estimated Water Use EfficiencyImprovements 5 to 10 years in
the Futurewater deliveries as efficiently aspossible.
10608.48.c(14)
Evaluate and improve theefficiencies of the supplier’spumps
None
The District does not operateany groundwater wells or liftpumps.
None

SD-1
Section 9: Supporting Documentation
LAGUNA IRRIGATION DISTRICT
PUBLIC NOTICE
Intent to update the District’s 2012 Agricultural Water Management Plan (AWMP) and adopt a2015 AWMP
A Draft 2015 Agricultural Management Plan can be reviewed at the Laguna Irrigation DistrictOffice, located at 5065 19 ½ Avenue, Riverdale, CA.
Office Hours: Monday thru Friday 7:00am-3:30pm(Closed for lunch 12:30-1:00pm)
A public hearing will be held at 9:30 am on January 22, 2016 at 5065 19 ½ Avenue, Riverdale, CAto review the Draft 2015 Agricultural Management Plan. Subsequent to the public hearing, theLaguna Irrigation District Board of Directors at a public meeting will adopt the plan as presented,amend the plan or not take action on the plan.
Published: Hanford Sentinel – January 8, 2016, January 15, 2016
Posted at LID Office January 8, 2016

SD-2
SD-3
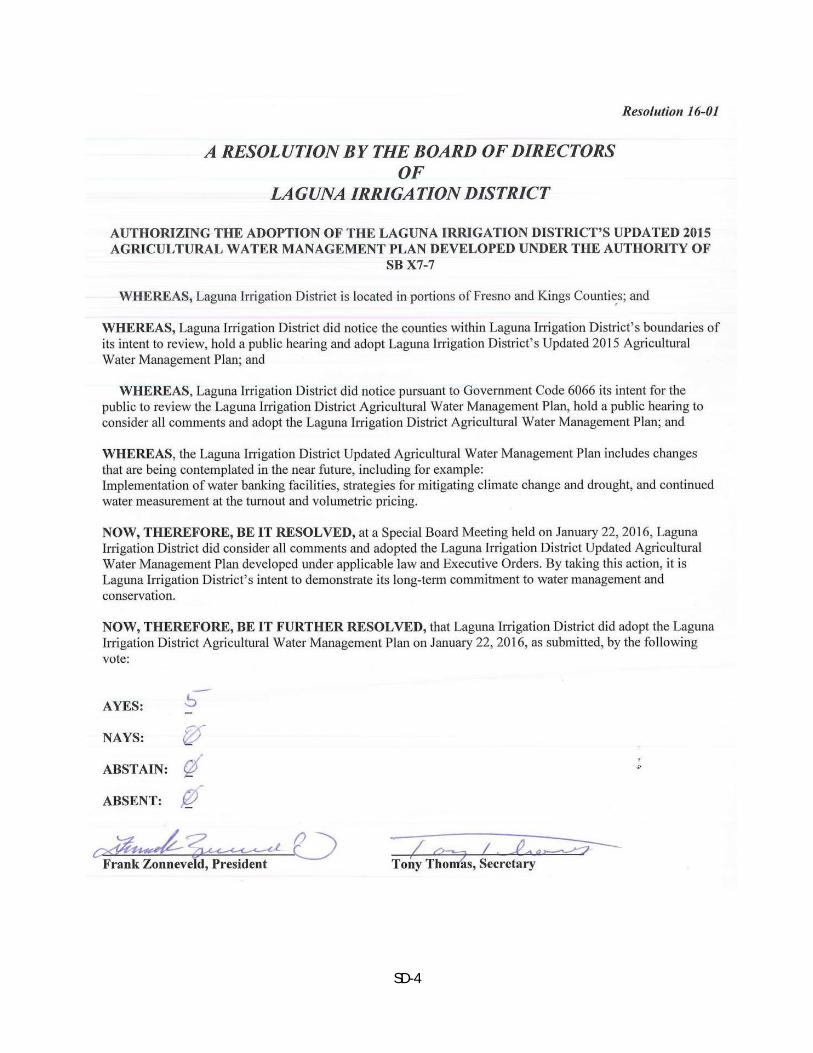
SD-4
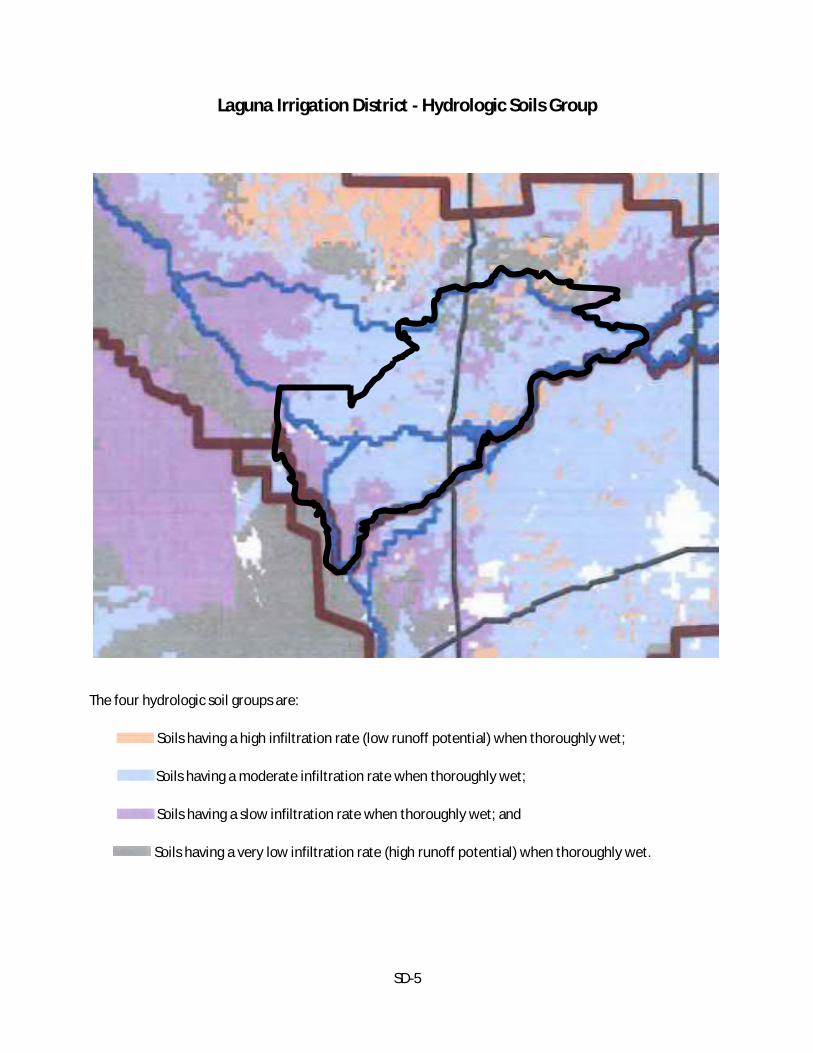
SD-5
Laguna Irrigation District - Hydrologic Soils Group
The four hydrologic soil groups are:
Soils having a high infiltration rate (low runoff potential) when thoroughly wet;
Soils having a moderate infiltration rate when thoroughly wet;
Soils having a slow infiltration rate when thoroughly wet; and
Soils having a very low infiltration rate (high runoff potential) when thoroughly wet.

SD-6
SD-7
SD-8

SD-9
SD-10
SD-11
SD-12
SD-13
SD-14

SD-15
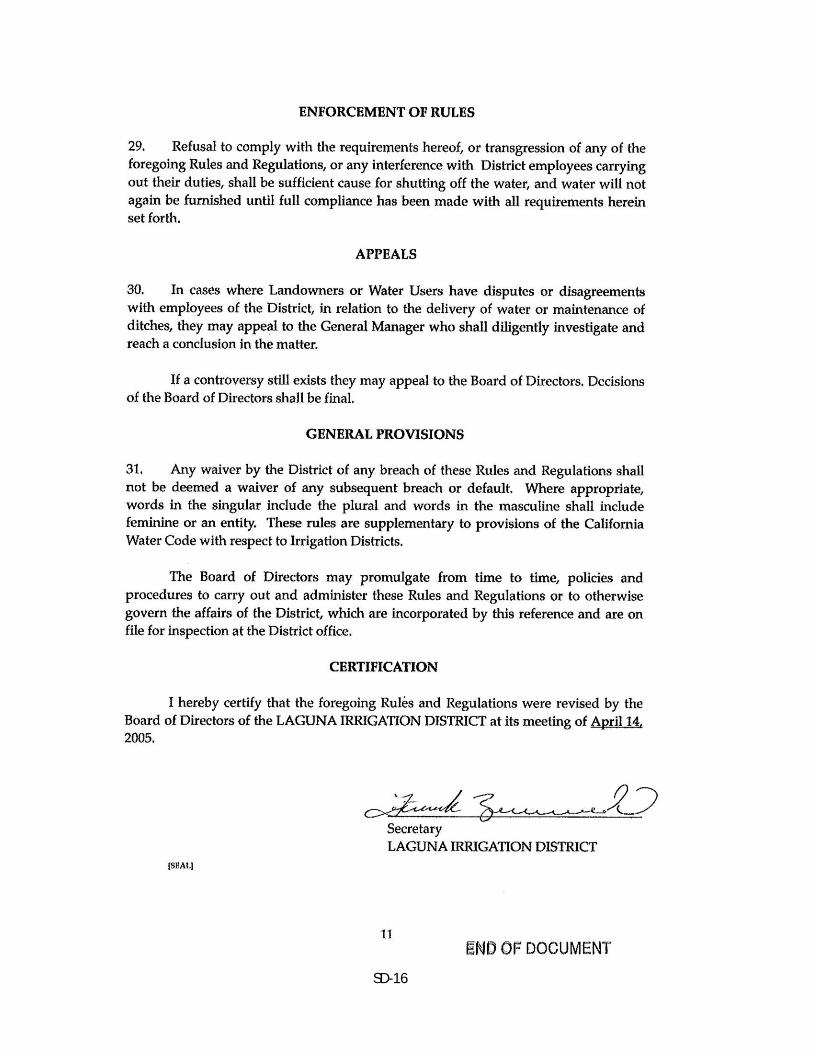
SD-16
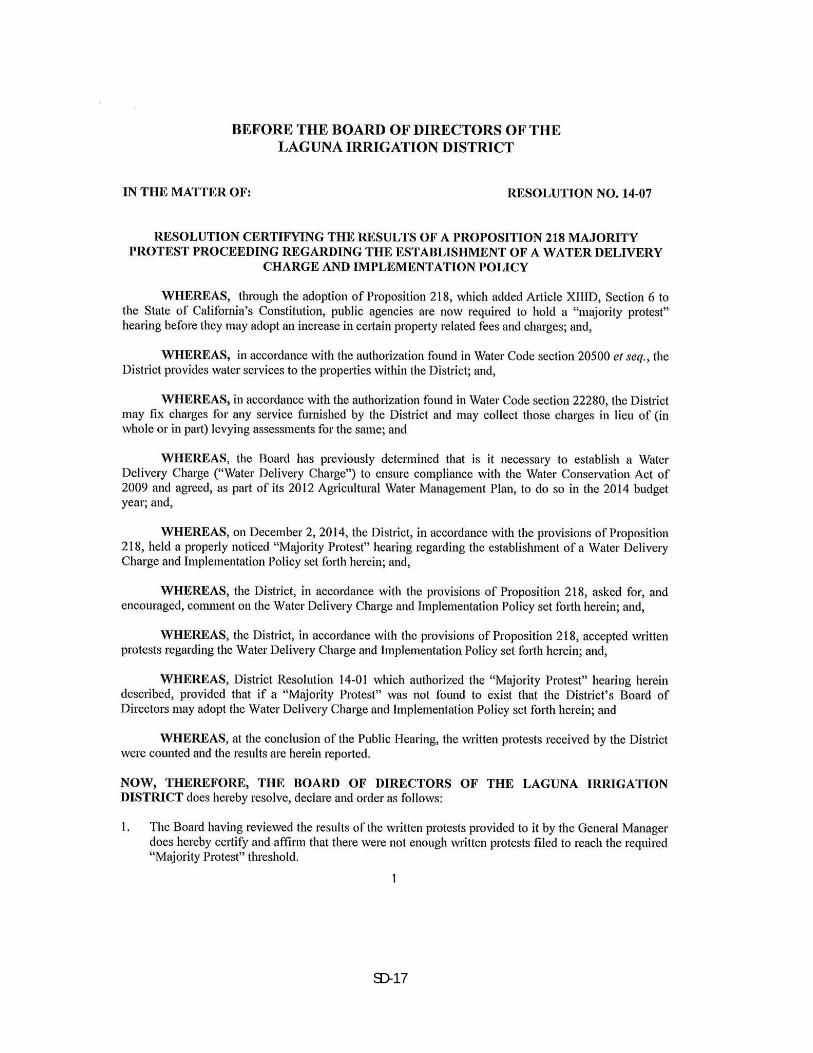
SD-17
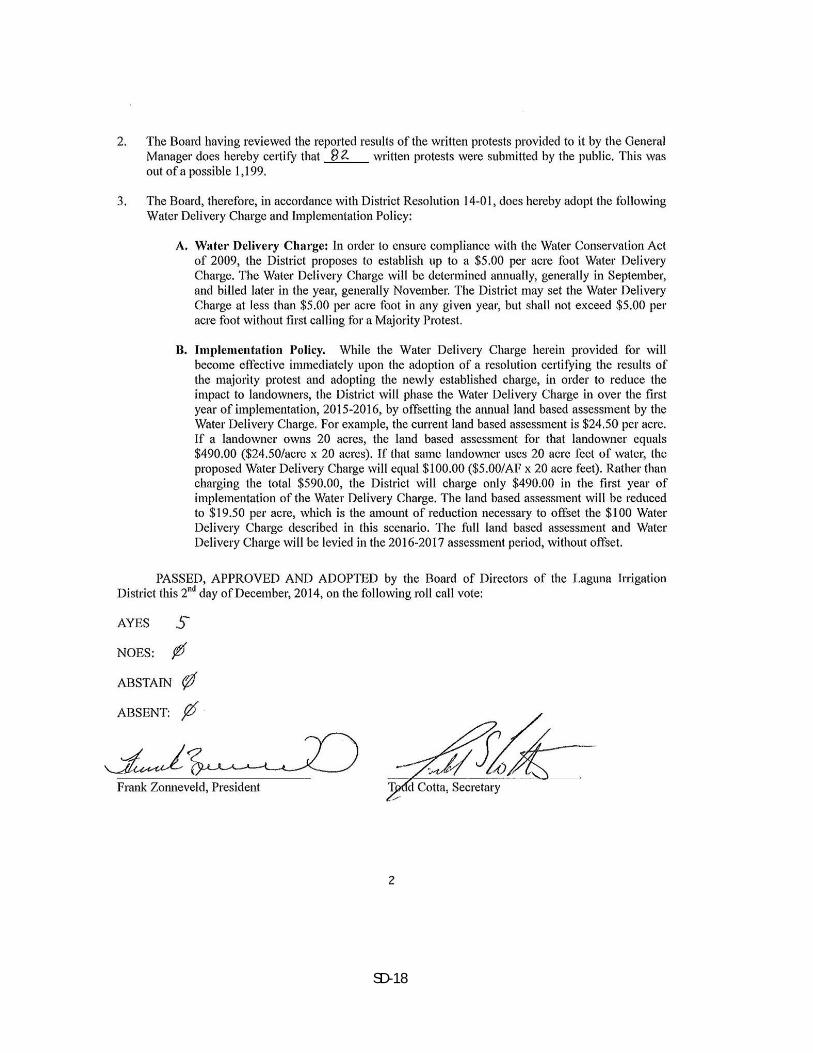
SD-18
SD-19
SD-20
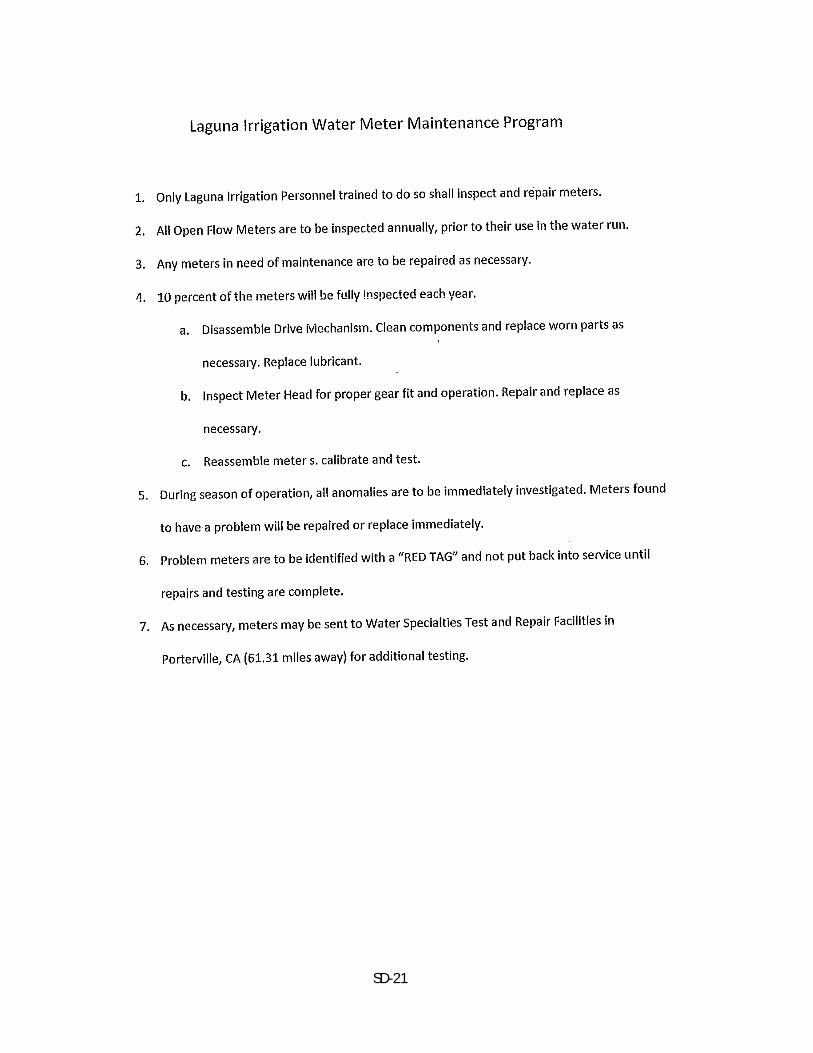
SD-21

SD-22
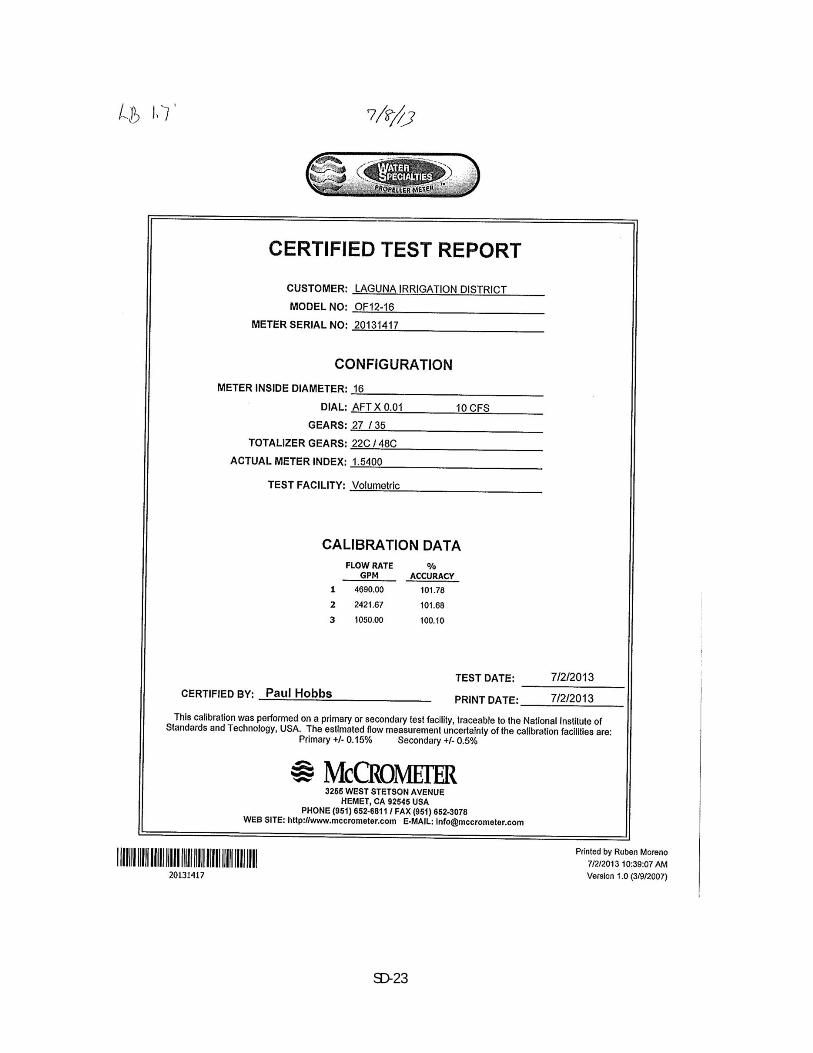
SD-23

SD-24

SD-25
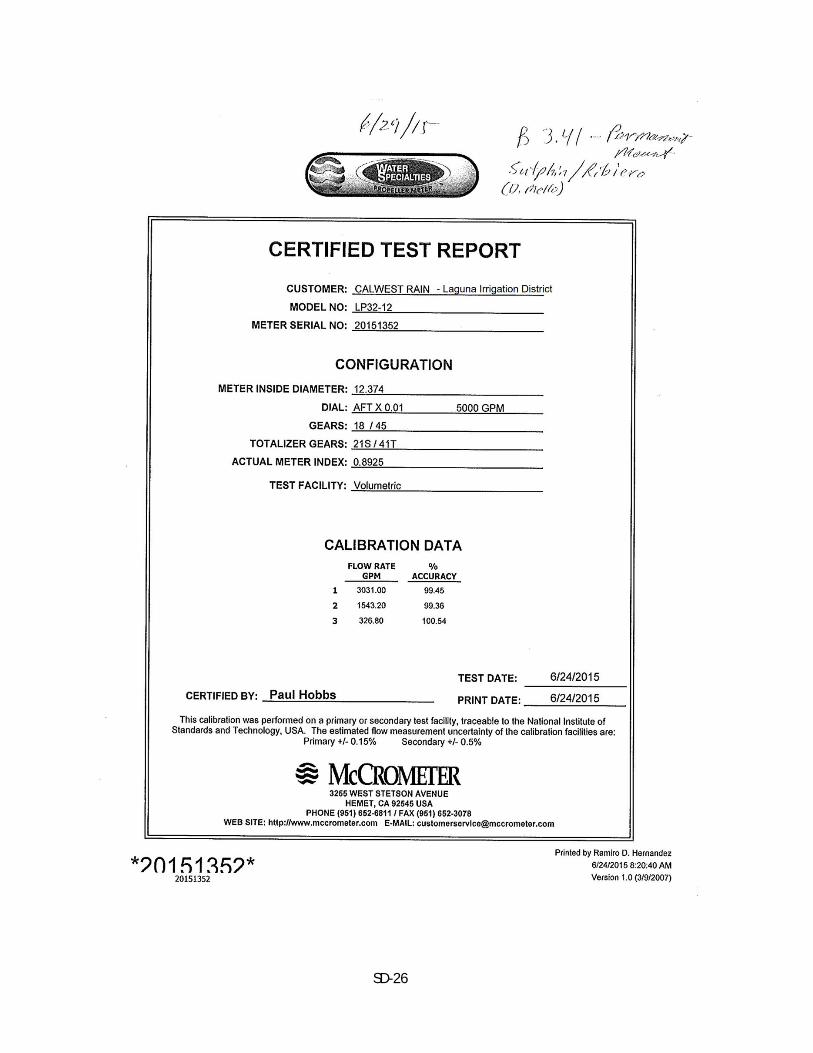
SD-26

SD-27
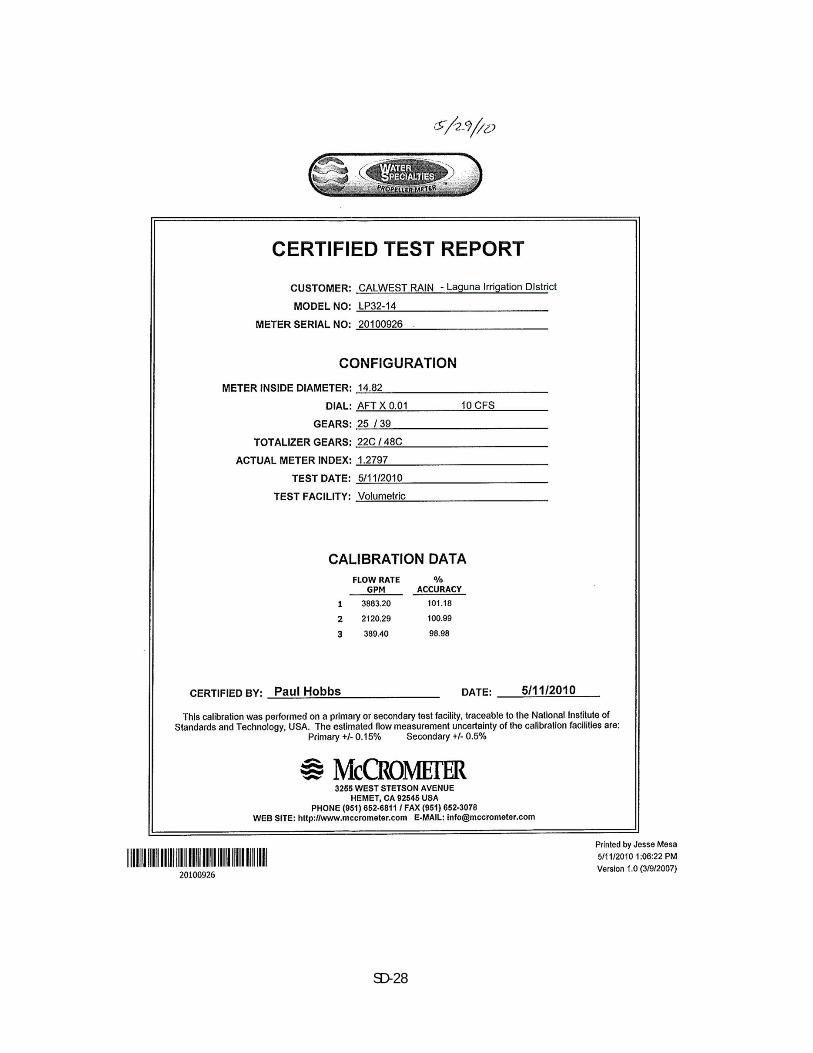
SD-28
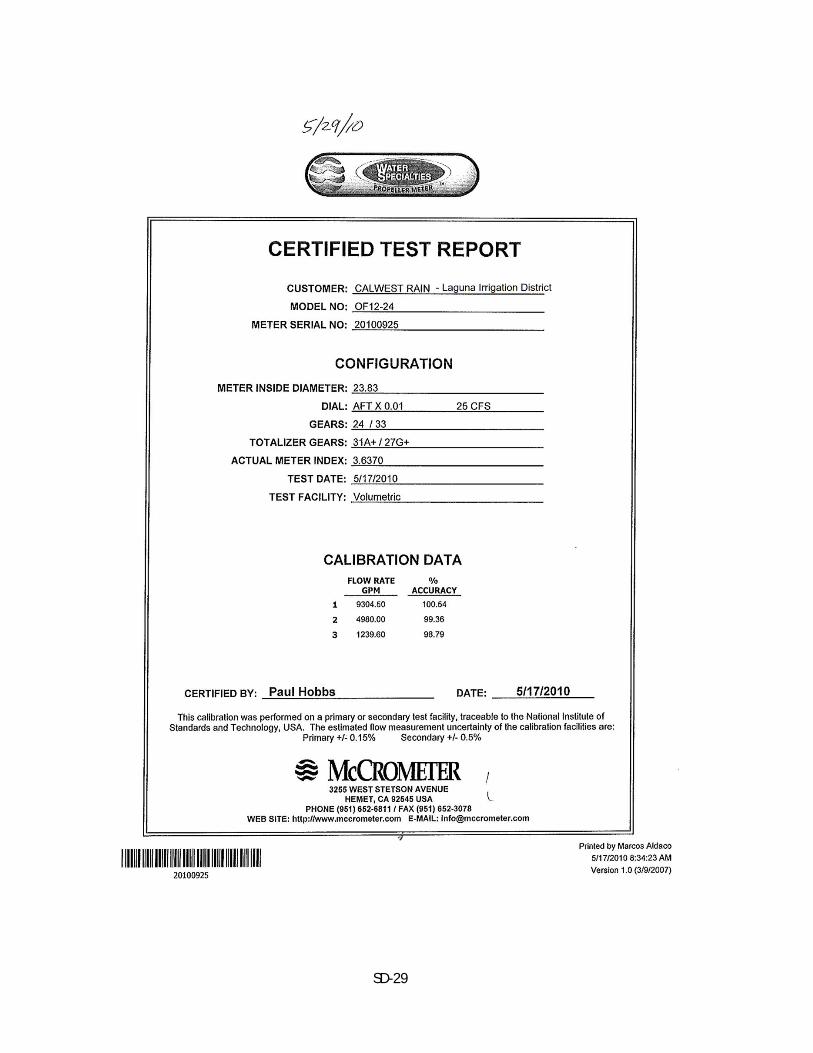
SD-29

SD-30