lagrangian statistics in nonhydrostatic and qg … · lagrangian statistics in nonhydrostatic and...
TRANSCRIPT

Baylor Fox-Kemper (Brown)
LAPCOD, Schoodic Pt., ME 7/28/15
Sponsor: GoMRI/CARTHE
Lagrangian Statistics in Nonhydrostatic and QG
turbulence
P. E. Hamlington, L. P. Van Roekel, BFK, K. Julien, and G. P. Chini. Langmuir-submesoscale interactions: Descriptive analysis of multiscale frontal spin-down
simulations. Journal of Physical Oceanography, 44(9):2249-2272, September 2014.movie credit: P. Hamlington
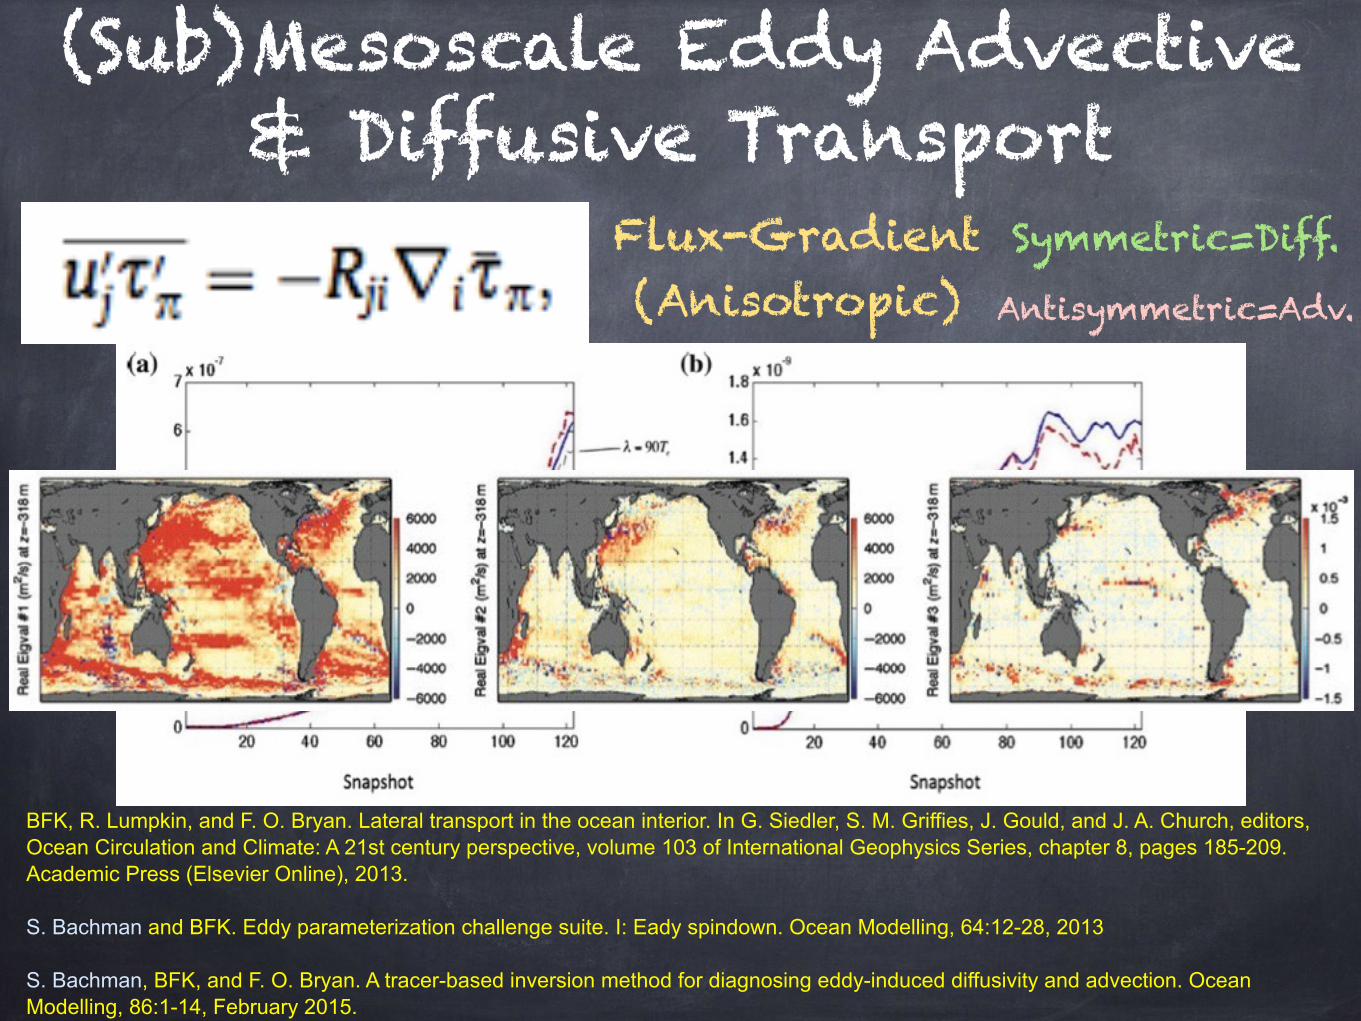
(Sub)Mesoscale Eddy Advective & Diffusive Transport
BFK, R. Lumpkin, and F. O. Bryan. Lateral transport in the ocean interior. In G. Siedler, S. M. Griffies, J. Gould, and J. A. Church, editors, Ocean Circulation and Climate: A 21st century perspective, volume 103 of International Geophysics Series, chapter 8, pages 185-209. Academic Press (Elsevier Online), 2013.
S. Bachman and BFK. Eddy parameterization challenge suite. I: Eady spindown. Ocean Modelling, 64:12-28, 2013
S. Bachman, BFK, and F. O. Bryan. A tracer-based inversion method for diagnosing eddy-induced diffusivity and advection. Ocean Modelling, 86:1-14, February 2015.
Symmetric=Diff.
Antisymmetric=Adv.
Flux-Gradient (Anisotropic)
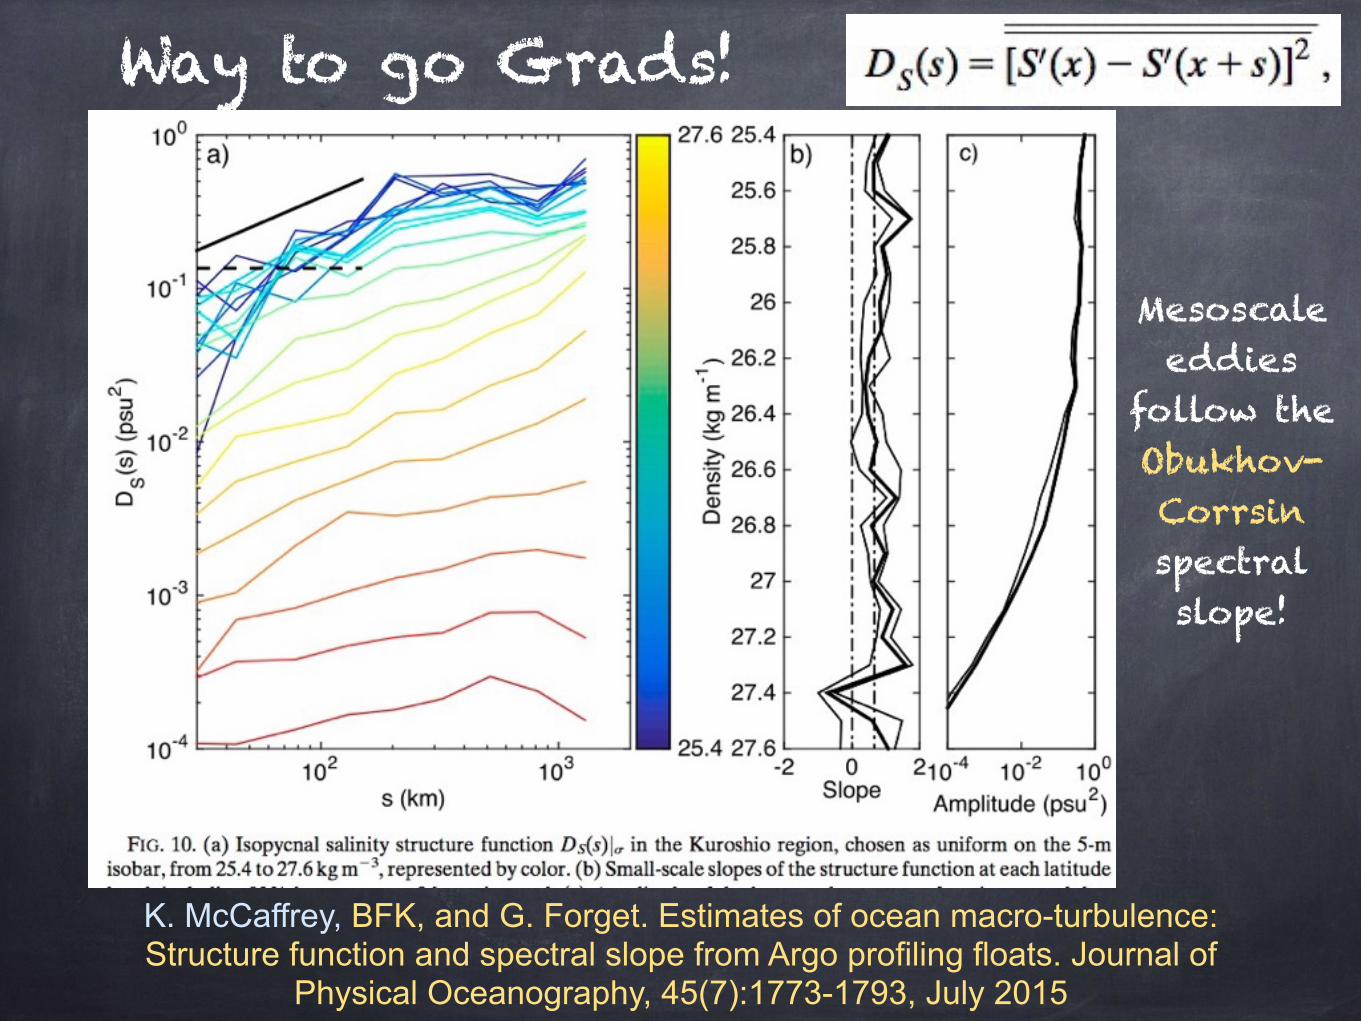
Way to go Grads!
K. McCaffrey, BFK, and G. Forget. Estimates of ocean macro-turbulence: Structure function and spectral slope from Argo profiling floats. Journal of
Physical Oceanography, 45(7):1773-1793, July 2015
Mesoscale eddies
follow the Obukhov-Corrsin spectral slope!

Oversimplify!
2d/QG Isotropic,
Homogeneous Turbulence: Inverse KE Cascade
k-5/33d
Isotropic, Homogeneous Turbulence: Forward KE Cascade
Inverse KE Inertial Range
Forward KE Inertial Range

Model #1: Multiscale LES of Langmuir & Submeso Turbulence
Movie: P. Hamlington
P. E. Hamlington, L. P. Van Roekel, BFK, K. Julien, and G. P. Chini. Langmuir-submesoscale interactions: Descriptive analysis of multiscale frontal spin-down simulations. Journal of Physical Oceanography, 44(9):2249-2272, September 2014.
Wind, Waves
movie credit: P. Hamlington
k-2
turbulence overwhelms these effects. The y–z profiles ofhw02ix in the bottom panels of Figs. 2c and 2f confirmthese conclusions, since it can be seen that there areslightly weakerw intensities below the eddy region. Thissuppression is most evident for the no-Stokes case in thebottom panel of Fig. 2f, although a weak suppression isseen even for the Stokes case in Fig. 2c at sufficientdepth, indicating that submesoscale eddies generated inthe present simulations compete with small-scale verti-cal mixing. This is, in turn, indicative of the restratifyingeffects associated with submesoscale eddies.The small-scale spatial suppression of w is shown in
more detail by the 1 km2 fields in Fig. 4. The locations of
these fields are given by the black boxes in Figs. 2c and 2fand have been chosen to show the small-scale structureboth outside and within the unstable eddy region.Comparison of the Stokes and no-Stokes cases showsthat, because of the Stokes drift forcing and additionalenergy supplied by Stokes shear, there is substantiallygreater small-scale structure in the simulation withStokes forcing at all locations; the small-scale structureshown in Figs. 4a and 4b is characteristic of Langmuirturbulence. The greatest changes to small-scale turbu-lence in the Stokes simulations occur near steep tem-perature gradients where strong vertical velocities areobserved. Figure 4b shows such a region where a band ofintense negative velocity is approximately aligned witha locally steep temperature front. By contrast, Fig. 4dshows that there are relatively large regions of small wmagnitude in the no-Stokes simulation, consistent withresults for the full domains shown in Figs. 2c and 2f. Theexistence of these regions indicates that small-scaleturbulence is suppressed by submesoscale eddies, al-though themechanism of this suppression is not yet fullyunderstood. It should be noted that even the no-Stokescase possesses coherent small-scale structures with largehorizontal vorticity, although these structures are char-acteristic of shear turbulence in the no-Stokes case whilestructures in the Stokes case are characteristic ofLangmuir turbulence.The small-scale structure ofw in both simulation cases
can be examined more directly using the two-dimensional vertical velocity spectra shown in Fig. 5,which are given as functions of the horizontal wave-numbers kx and ky. Near the surface, there is sub-stantially greater small-scale energy content in theStokes simulation than in the no-Stokes simulation. Inthe Stokes case, the two-dimensional spectrum is largestalong an angle of approximately 308, consistent with thedirection of the wind and waves, qw 5 qs 5 308. For theno-Stokes case, by contrast, the near-surface spectrum islargest along a smaller angle (roughly 158), corre-sponding to the direction of the surface Ekman flow.These different angles are due to differences in thesmall-scale dynamics and structure of each case; for theStokes case, the small scales are dominated by Lang-muir cells aligned with the direction of the Stokesforcing, while for the no-Stokes case, the small scalesare dominated by shear from the Ekman flow. By z 5225m, Fig. 5 shows that the energy spectra in the twosets of simulations are similar and that both spectrabecome increasingly isotropic, with nearly equal en-ergies in the x and y directions. Once again, as thedepth increases, the effect of Stokes drift forcing be-comes weaker and surface winds and waves have anincreasingly smaller effect for both the Stokes and
FIG. 3. One-dimensional circularly integrated spectra for veloc-ities u, y, and w and temperature u in the Stokes (solid lines) andno-Stokes (dashed lines) simulations near 12 days. Spectra areshown at depths (a) z 5 23.8m and (b) z 5 225m and are nor-malized by Eu(kmin) at z 5 23.8m for the velocity spectra and byEu(kmin) at z 5 23.8m for the temperature spectra. The magentadashed-dotted line shows a k22 decay rate for reference and grayregions show the scale range used to decompose the fields into low-and high-pass parts (the cutoff scale is at 400m).
2256 JOURNAL OF PHYS ICAL OCEANOGRAPHY VOLUME 44
Domain size: 20km x 20km x -160m Grid points: 4096 x 4096 x 128 Resolution: 5m x 5m x -1.25m
surface Langmuir Turb.

x (km)0 1 2 3 4
y (k
m)
0
1
2
3
4
0
9
> 18
Initially every surface node has 1 drifter, so there are 851796 drifters in the picture
After 40 Min

x (km)0 1 2 3 4
y (k
m)
0
1
2
3
4
0
23
> 45
Initially every surface node has 1 drifter, so there are 851796 drifters in the picture
After 80 Min
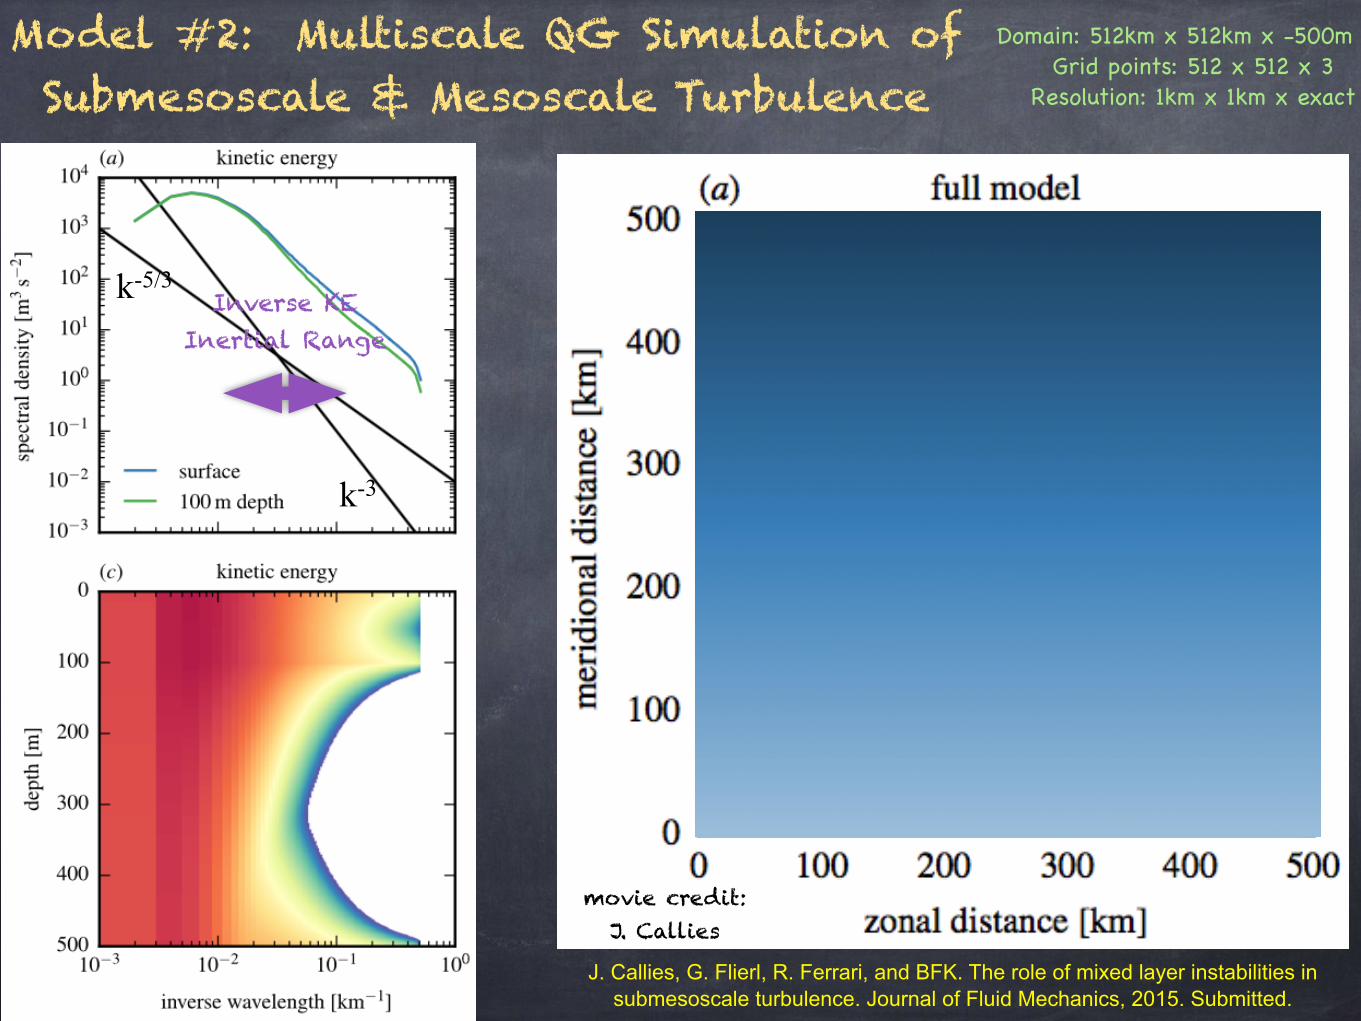
Model #2: Multiscale QG Simulation of Submesoscale & Mesoscale Turbulence
J. Callies, G. Flierl, R. Ferrari, and BFK. The role of mixed layer instabilities in submesoscale turbulence. Journal of Fluid Mechanics, 2015. Submitted.
movie credit: J. Callies
k-3
k-5/3
Domain: 512km x 512km x -500m Grid points: 512 x 512 x 3
Resolution: 1km x 1km x exact
Inverse KE Inertial Range

KE Flux Estimates—Simulated Drifters
from Mann et al. 2009
But, what happens if we do this in these runs?
Also
| | (sign indefinite)

KE Fluxes—Simulated Drifters in SM/Lang.
| |
A pretty good fit if: but inverse Langmuir
cascade?
Langmuir Turb. Range.
Doesn’t predict
any separation dependence

KE Fluxes—Simulated Drifters in QG/SQG
| |
Inverse KE Inertial Range

ConclusionsUpper Ocean Turbulence, Fronts, & Instabilites are important, and are beautiful to contemplate
Interesting transition in physics, as nonhydro. & ageostrophic effects begin to dominate
In realistic upper ocean Langmuir to mesoscale turbulence simulations, drifter-like energy flux diagnostics (based on surface velocities) from 3d Kolmogorov scalings give order of magnitude agreement with each other.
However, incongruities between the estimates, such as predicting the wrong scales over which inertial ranges occur, or forward cascades when inverse cascades are present, mean that these methods are not appropriate without modification.
All papers at: fox-kemper.com/pubs
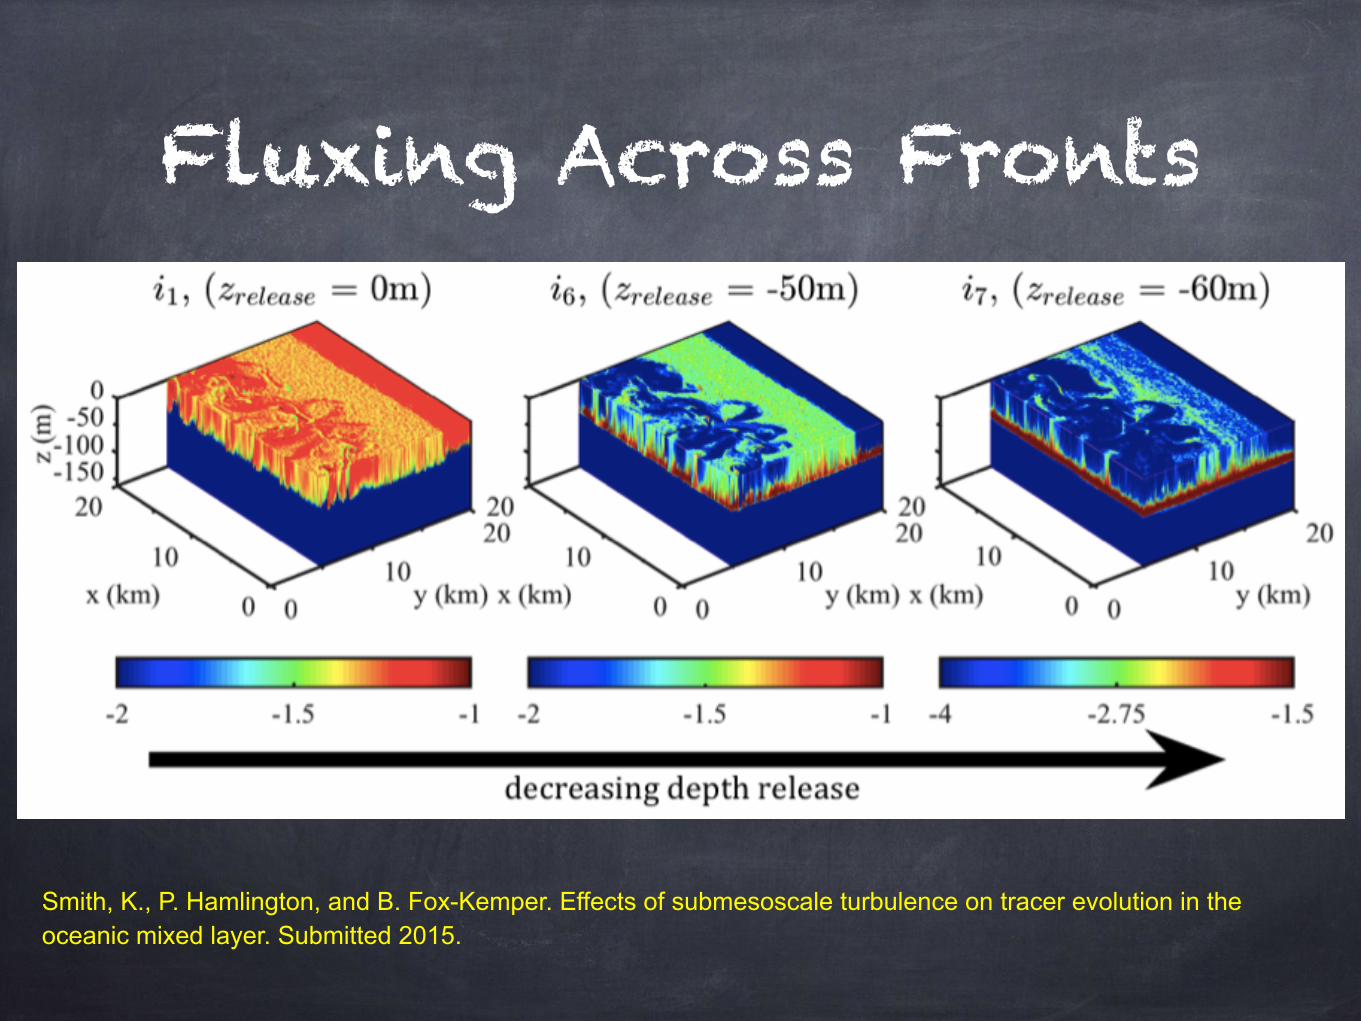
Fluxing Across Fronts
Smith, K., P. Hamlington, and B. Fox-Kemper. Effects of submesoscale turbulence on tracer evolution in the oceanic mixed layer. Submitted 2015.