lafourche parish economy and employment
TRANSCRIPT
Kimley-Horn and Associates, Inc.
Waggonner & Ball Architects
Lafourche ParishComprehensive Resiliency Plan
Economy and Employment

Lafourche Parish Comprehensive Resiliency Plan
Geographic Distribution of Employment Centers

Lafourche Parish Comprehensive Resiliency Plan
Employment Center
Employment Centers

2010 Largest Employment Sectors
Transportation
Retail
Construction
Other Services
Health Care
Administrative
Real Estate
Manufacturing
0 2,000 4,000 6,000 8,000 10,000
14% of total jobs
9% of total jobs
8% of total jobs
7% of total jobs
6% of total jobs
6% of total jobs
6% of total jobs
5% of total jobs
Source: US Bureau of Economic Analysis, 2005-2010 (CA25N)

Lafourche and State Comparison
Employment is strong in Lafourche Parish compared to the state as a whole in:– Transportation & Warehousing – Forestry & Fishing – Management
Compared to the state, Lafourche has relatively lower employment in: – Retail Trade– Health Care– Manufacturing– Accommodation & Food Services– Professional and Technical Services– Finance & Insurance
Source: US Bureau of Economic Analysis, 2005-2010 (CA25N)

Employment Profile 2010
0%
2%
4%
6%
8%
10%
12%
14%
16%
18%
Lafourche Parish
Louisiana
Source: US Bureau of Economic Analysis, 2005-2010 (CA25N)
Sh
are
Lafourche has substantially higher
employment in Transportation and Fishing/Forestry and
Management

Employment Profile 2010
0%
2%
4%
6%
8%
10%
12%
14%
16%
18%
Lafourche Parish
Louisiana
Source: US Bureau of Economic Analysis, 2005-2010 (CA25N)
Sh
are
Lafourche has relative lower employment in several
sectors compared to the State

Largest Employment Sectors
Top 5 Employing Industries
Jobs in 2010
Share of Total
Employment 2010
Change in Jobs
since 2005
Transportation and warehousing 8,568 14% 46%
Retail trade5,284 9% 10%
Construction4,662 8% 7%
Other services, except public administration 4,280 7% 8%
Health care and social assistance 3,846 6% 24%
Share of Total Parish Employment 26,640 44%
Source: US Bureau of Economic Analysis, 2005-2010 (CA25N)

Top 5 Employment Sectors
0%
2%
4%
6%
8%
10%
12%
14%
16%
18%
Lafourche Parish
Louisiana
Source: US Bureau of Economic Analysis, 2005-2010 (CA25N)
Sh
are

Recent Employment Trends
Employment by Type
Jobs in 2005
Jobs in 2010 % Change
Wage & Salary Employment 35,679 39,714 11%
Non-Farm Proprietors 16,947 19,839 17%
Farm Proprietors 324 347 7%
Total Parish Employment 52,950 59,900 13%
Source: US Bureau of Economic Analysis, 2005-2010 (CA25N)
The greatest rate of growth was in non-farm proprietors (i.e. entrepreneurs)
This growth rate was similar to that of the Houma-Thibodaux MSA (15%)
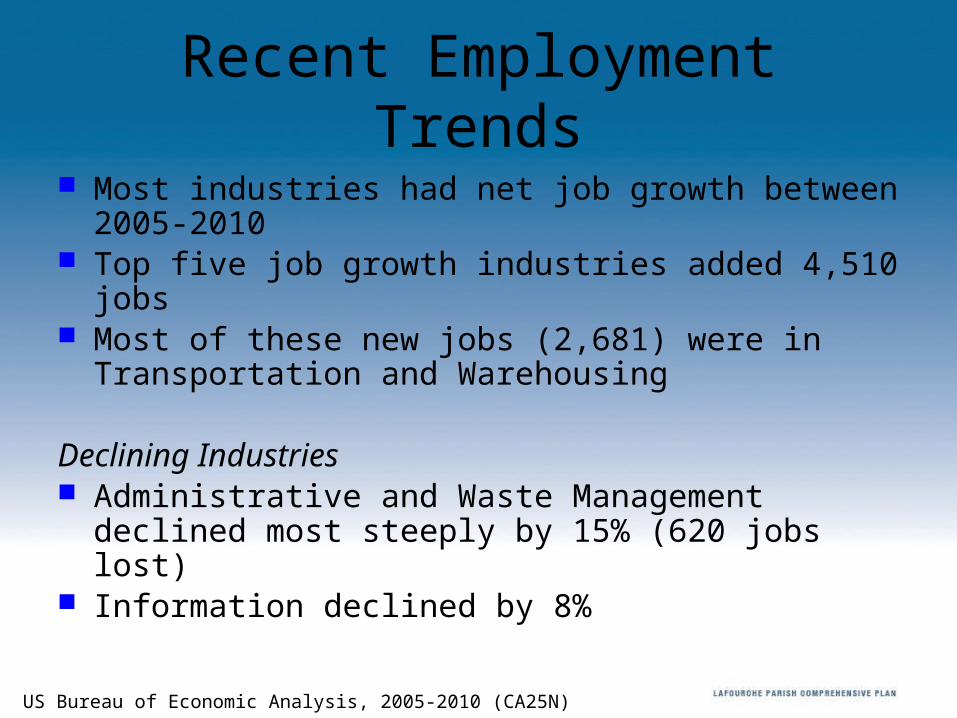
Recent Employment Trends Most industries had net job growth between
2005-2010 Top five job growth industries added 4,510 jobs Most of these new jobs (2,681) were in
Transportation and Warehousing
Declining Industries Administrative and Waste Management declined
most steeply by 15% (620 jobs lost) Information declined by 8%
Source: US Bureau of Economic Analysis, 2005-2010 (CA25N)

Fastest Growing SectorsFastest Growing Sectors 2005-2010 2005 2010
% Change
Mining (includes Drilling) 875 1,614 84%
Transportation and Warehousing 5,887 8,568 46%
Arts, Entertainment, Recreation 735 1,021 39%
Finance and Insurance 1,570 2,172 38%
Management of companies and enterprises 1,120 1,476 32%
Fastest Growing (Subtotal) 10,187 14,851 46%
Share of Total Parish Employment 19% 24%
Source: US Bureau of Economic Analysis, 2005-2010 (CA25N)

Transportation-Based Economy• 14% of all jobs• Far greater
portion compared to the state
• It’s the second-fastest growing job sector
• Transportation investments are crucial to a healthy local economy

Marine and Port Industry
Image: NOAA
Image: flickr user hspauldi

Emerging Sectors
• Environmental and Safety Tech• Food Technologies and Service• Eco-Tourism• Healthcare• Information Technology
Source: SCPDC Comprehensive Economic Development Strategy, 2012
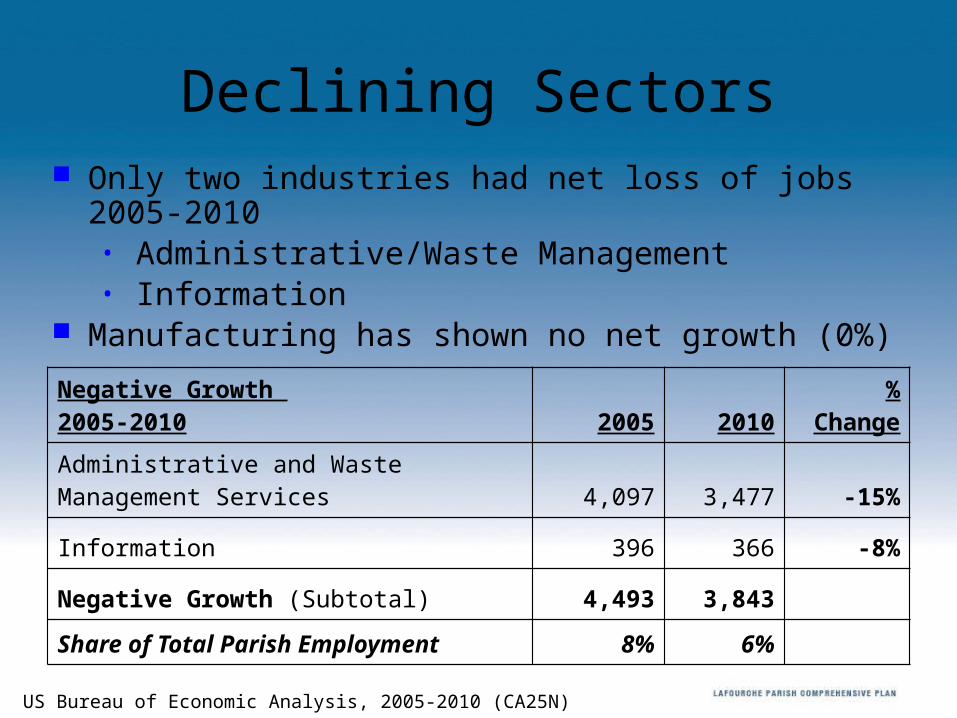
Declining Sectors
Negative Growth 2005-2010 2005 2010
% Change
Administrative and Waste Management Services 4,097 3,477 -15%
Information 396 366 -8%
Negative Growth (Subtotal) 4,493 3,843
Share of Total Parish Employment 8% 6%
Source: US Bureau of Economic Analysis, 2005-2010 (CA25N)
Only two industries had net loss of jobs 2005-2010• Administrative/Waste Management• Information
Manufacturing has shown no net growth (0%)

Economic Strategies• Improve public infrastructure to support and sustain a viable economy
and environment• Create and retain quality jobs and foster a more diversified economy• Improve capacity to make efficient land use decisions• Improve capacity to make economic development decisions• Improve fiscal capacity of local government and the community to make
the region financially attractive for economic development and to enhance quality of life
• Protect and conserve natural resources and promote more equitable use of these resources for business and recreation
• Pre-Plan to improve emergency operations and recovery
Source: SCPDC Comprehensive Economic Development Strategy, 2012

Retail Leakage & Opportunities
• Uncover retail opportunities by comparing retail sales and supply with consumer spending by category
• The Parish is “under-retailed” in several categories, while others are over-supplied

Opportunity Gaps Businesses Supply Less Than 25% of Parish Spending
• Home furnishing• Computer store• Camera, photography• Outdoor power equip.• Beer, wine, liquor• Cosmetics, beauty, health• Optical goods• Hobby, book, music and
sporting goods
• Family clothing store• Clothing accessories• Shoe stores• Luggage, leather goods• Sewing, needlework• Musical instruments• Books, newsstands

Where do the people who live in Lafourche work?
Parish of Employment
% of Workforce
Lafourche Parish 44%
Terrebonne Parish 19%
Jefferson Parish 7%
East Baton Rouge Parish 6%
Orleans Parish 3%
All Others 21%Source: US Census Bureau, LEHD On the Map, 2010.
44%
19%
7%
6%
3%
21%
Lafourche ParishTerrebonne ParishJefferson ParishEast Baton Rouge ParishOrleans ParishAll Others
Lafourche
Others
Terrebonne

Where do the people who work in Lafourche live?
Source: US Census Bureau, LEHD On the Map, 2010.
Parish of Residence
% of Workforce
Lafourche Parish 51%
Terrebonne Parish 13%
Jefferson Parish 4%
Assumption Parish 2%
St. Tammany Parish 2%
All Others 28%
51%
13%
4%2%
2%
28%
Lafourche ParishTerrebonne ParishJefferson ParishAssumption ParishSt. Tammany ParishAll Others
Lafourche
Terrebonne
Others

Kimley-Horn and Associates, Inc.
Waggonner & Ball Architects
Lafourche ParishComprehensive Resiliency Plan
Economy and Employment