labs unclassified ad-a123 483 mechanical … · 2024 al adherends prepared by phosphoric acid...
TRANSCRIPT

AD-A123 483 MECHANICAL PROPERTIES OF ADHESIVELY BONDED ALUMINUM i/STRUCTURES PROTECTED H..CU) MARTIN MARIETTA LABS
BALTIMORE MD D A HARDICK ET AL NOV 82 MML-TR-23CUNCLASSIFIED Neeg14-8e-C-87ig' F/G tt/i NLE]Ehmhhhi=ilIlllllllElllEII.-mI/EEE///EI

1. 8m. .- -
.U1
1 ~ 2.0
MICRL'CQPY RESOLUTION TEST CHARTNATIM#A1. BUREAU OF STANDARDS-1963-A
V
.7S

MECHANICAL PROPERTIES OF ADHESIVELY
BONDED ALUMINUM STRUCTURES PROTECTED
End-of-Second-Year Report
November 1982
Prepared for:
Department of the NavyOffice of Naval ResearchArlington, Virginia 22217
Prepared by:
Martin Marietta Laboratories1450 South Rolling Road .Baltimore, Maryland 21227-3898
UnderONR Contract N00014-80-C-0718
. .~ ....... .....

UNCLASSIFIED
SECURITY CLASSIFICATION OF THIS PAGE (When Does Entered)
READ INSTRUCTIONSREPORT DOCUMENTATION PAGE BEFORE COMPLETING FORM
1. REPORT NUMBER 2. GOVT ACCESSION NO. 3. RECIPIENT'S CATALOG NUMBER
4. TITLE (and Subtlefo) S. TYPE OF REPORT & PERIOD COVERED
End-of-Second-Year Report"Mechanical Properties of Adhesively Bonded Alu-minum Structures Protected with Hydration 6. PERFOR.dING ORG. REPORT NUMBERInhibitors" MML TR-23(c)
7. AUTHOR(a) S. CONTRACT OR GRANT NUMBER(a)
D.A. Hardwick, J.S. Ahearn, and J.D. Venables N00014-80-C-0718
9. PERFORMING ORGANIZATION NAME AND ADDRESS 10. PROGRAM ELEMENT. PROJECT, TASK
AREA A WORK UNIT NUMBERSMartin Marietta Laboratories1450 South Rolling RoadBaltimore, Maryland 21227
11. CONTROLLING OFFICE NAME AND ADDRESS 12. REPORT DATE
Department of the Navy November 1982Office Of Naval Research I. NUMBER OF PAGES
Arlington, Virginia 22217 3414. MONITORING AGENCY NAME & AODRESS(if different from Controlling Office) IS. SECURITY CLASS. (of this report)
Baltimore DCAS Management Area300 East Joppa Road, Room 200 Unclassified
Towson, Maryland 21204 ISa. DECLASSIIrlCATION/DOWNGRADING
SCHEDLE
16. DISTRIBUTION STATEMENT (of this Report)
Unlimited distribution.
17. DISTRIBUTION ST. 4ENT (of 0'. abstract entered In Block 20, If different from Report)
III. SUPPLEMENTARY ras
19. KEY WORDS (Continue on reverse side it necessary and Identify by block number)
Adhesive bonding, mechanical properties, organic inhibitors, bond durability,FPL, PAA.
20. ABSTRACT (Continue on reverea aide If necesary and Identify by block number)
O0s4 search has shown that an adsorbed monolayer of the organic inhibitornitrilotris (methylene) phosphonic acid (NTMP) improves the bond durability of2024 Al adherends prepared by phosphoric acid anodization (PAA). As had previ-ously been determined for Forest Prodz.cts Laboratories (FPL)-prepared adherends, --
maximum Improvements in bond durability occurred when a monolayer of NTMP wasadsorbed onto the surface. Examination of the wedge test failure surfaces ofPAA adherends treated in NTMP revealed that although crack propagation had ini-tially involved oxide-to-hydroxide conversion of the original PAA oxide, the
DD I 'JP, 1473SECURITY CLASSIFICATION OF THIS PAGE (When Date Entered)

- . - I - -. - . - - . + 4 - . - . ° .
SECURITY CLASSIFICATION OF THIS PAOE(Whal Dot Entered)
locus of failure transfers to the adhesive near the interface quite early in thetest. This means that the failure of NTHP-treated PAA adherends was predominant-ly cohesive through the adhesive. In addition, the presence of NTMP at theoxide/adhesive interface did not degrade the initial bond strength when epoxy-based adhesive systems were used., .
This hydration inhibitor scheme shows considerable promise for Improving thedurability of adhesively-bonded components for military and commercial aircraft.The process has the advantage of being extremely simple; aluminum surfaces pre-pared for adhesive bonding need only be dipped or sprayed with a very dilute(~ 100-ppm) aqueous solution of the organic inhibitor. The very thin inhibitorlayer does not interfere with interlocking between the microscopically-roughoxide and the adhesive, which is the source of the high bond strength essentialto aircraft applications.
r
.1--
NTTS
qs.q
i'u. C'~
-7-
SECURITY CLASSIFICATION OF THIS PAGE(WhoIf Data Entered)
_. _ . _ _ . .. . - . .

MML TR-23(c)
MECHANICAL PROPERTIES OF ADHESIVELY BONDED ALUMINUM
STRUCTURES PROTECTED WITH HYDRATION INHIBITORS
End-of-Second-Year Report on
ONK Contract N00014-80-C-0718
November 1982
Prepared for:
Department of the NavyOf fice of Naval Research
Arlington, Virginia 22217
Prepared by:
D. A. Hardwick, J. S. Ahearn, and J. D. VenablesMartin Marietta Laboratories
1450 South Rolling RoadBaltimore, Maryland 21227
*S. Ahearnrincipal Invest 3ator
W

-- -- -- -- -- -- - -- -- -- -- -- - ---. . . . .
TABLE OF CONTENTS
page
1. INTRODUCTION 12. EXPERIMENTAL METHOD 6
2.1 SURFACE PREPARATION 62.2 WEDGE-TEST PROCEDURE 62.3 T-PEEL PROCEDURE 82.4 SURFACE ANALYSIS AND EXAMINATION 9
3. RESULTS ,13.1 INHIBITOR SURFACE COVERAGE 113.2 T-PEEL TESTS 113.3 WEDGE TESTS 123.4 SURFACE EXAMINATION OF WEDGE-TEST FAILURE SURFACES 163.5 SURFACE ANALYSIS OF WEDGE-TEST FAILURE SURFACES 24
4. DISCUSSION 28
5. REFERENCES 34
?. .'p
5, .
Sup'
4. _. 5.. o. . . .5 5........... . . . . . .- -- _

!
LIST OF FIGURES
No. Page
1 Stereo miarograph of Al-oxide morphology on FPL adherendsand schematic of oxide structure.fl) 2
2 Stereo micrograph of Al-oxide morphology on PAA adherendsand schematic of oxide structure. l) 3
3 Crack length vs time for FPL and PAA adherends and PAAadherends treated with 10- and 300-ppm NTNP solution. 13
4 Crack length vs time for PAA adherends and PAA treated in10-ppm NTMP solution at either room temperature or 80*C. 14
5 Crack length vs time for PAA adherends and PAA treated in300-ppm NTNP solution at either room temperature or 80°C. 15
6 Crack length vs time for PAA adherends and PAA treated in10-, 100-, or 500-ppm NTHP solution. 17
7 Average crack velocity, v, as a function of C, the fractureenergy. 18
8 SEN micrograph of "dull" region on Al side of wedge testfailure surface. Adherend was PAA-treated in 100-ppm NTMPsolution. 21
9 SEN micrographs of: (a) transition region on Al side of PAAwedge-test failure surface [arrow denotes direction of crackpropagation]; (b) transition region at higher magnification;
* (c) failure through near-surface adhesive layer. 22
10 SEM micrographs of Al side of failure surface on PAA adhe-rend treated in 200-ppm NThP solution showing hydroxideformation after crack propogation through the adhesive layer. 23
* 11 Depth profle of "dull" region on Al side of PAA wedge-testfailure surface. 26
12 Depth profile of "shiny" region on Al side of PAA wedge-testfailure surface. 27
40- ii -
LIST OF TABLES
No. Title Page
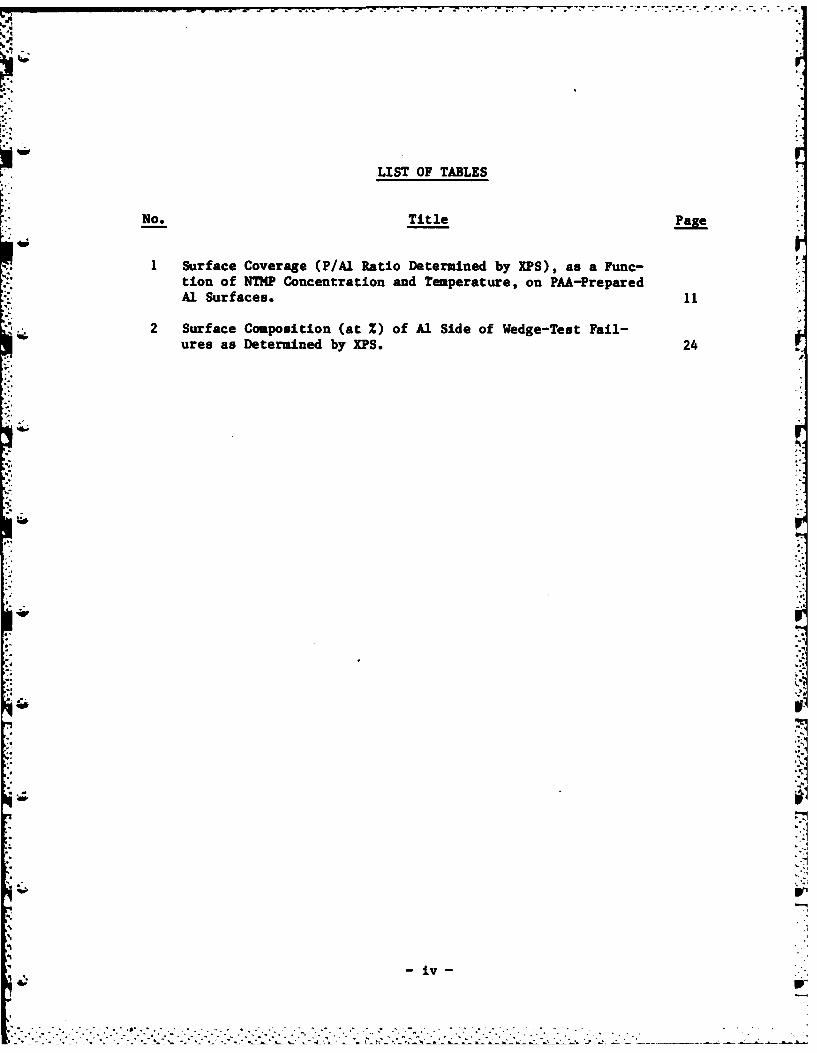
1 Surface Coverage (P/Al Ratio Determined by XPS), as a Func-tion of NTMP Concentration and Temperature, on PAA-PreparedAl Surfaces. 1
2 Surface Composition (at Z) of Al Side of Wedge-Test Fail-ures as Determined by XPS. 24
tip
s7
"-iv

1. INTRODUCTION
Two important factors that determine the overall performance and
* success of adhesively bonded aluminum structures are the initial bond
strength of the adherend/adhesive interface and the stability of the
interface in a humid environment. Recent studies at Martin Marietta
Laboratories(1 ) have indicated that the initial bond strength of commer-
cial aerospace bonding processes is determined principally by physical
interlocking between the oxide on the Al adherend and the adhesive.
The Al-oxide morphologies of two commercial processes are illus-
trated in Figs. 1 and 2. The Forest Products Laboratory process (PPL)
produces an oxide morphology consisting of oxide cells roughly 400 A in
diameter and whisker-like structures 400 A high (Fig. 1). The phosphoric
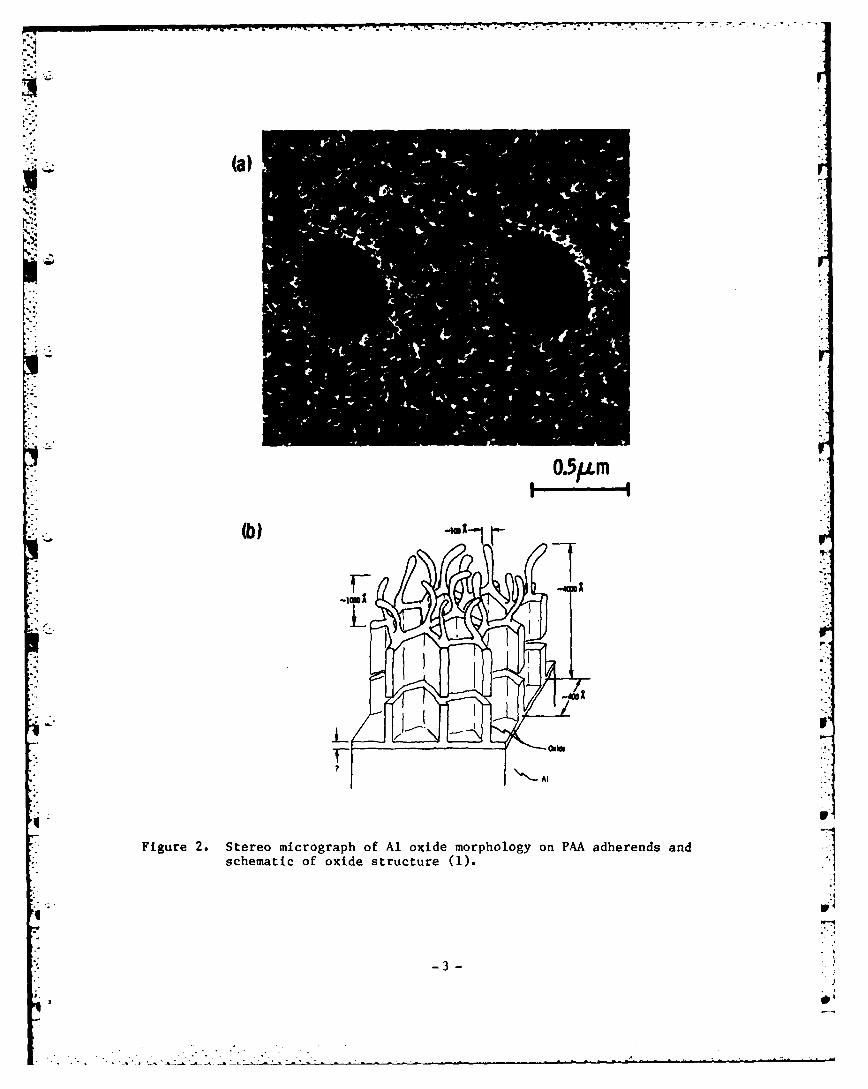
acid anodization process (PAA) also produces an oxide morphology consist-
ing of oxide cells and whiskers (Fig. 2), but the cells are much higher
C( 3,000 A) than those produced by FPL. In both cases, the rough oxide
surface interlocks with the overlaying adhesive to form a much stronger
bond than would be possible with a smooth oxide surface.
The long-term durability of the Al-oxide adhesive bond is deter-
mined to some extent by physical interlocking, but recent evidence from
our research(2) indicates that bond durability is also controlled by
conversion of the original adherend oxide to a hydroxide in the presence
of moisture. A distinction must be drawn when comparing bond durability
observed with a smooth adherend oxide morphology and the durability of
a rough one. For adherends with smooth morphology, the bond strength
. -. ".o. o " " -~o .• ,• . . .. . . _. - - 1••. - , • ° " /

O.5/.Lm
(b)I
Figure 1. Stereo micrograph of Al oxide morphology on FPL adherends andschematic of oxide structure (1).
-2-
- ~ ~ ~ ~ ~ ~ 7 .:'w*** S~W~ ~ ~ . - -7170 --- --:. -
(a)
O.5p.m
(b)
Figure 2. Stereo micrograph of Al oxide morphology on PMA adhe rends andschematic of oxide structure (1).
-3-

I I - - S. 7 U .- ' ,.. . ' . , ;- ' - - ,. .'
.' '.L - " ''. :. -V
'5 depends on the chemical interaction between the Al-oxide surface and
adhesive molecules. Water penetration to a crack tip can disrupt the
chemical bonds between Al-oxide and polymer molecules and cause relatively
rapid crack propagation. For adherends with rough oxide morphology, the
breaking of chemical bonds by water does not affect crack propagation
because physical interlocking of the adhesive and oxide prevents it.
Crack movement is only possible if the interlocking of adhesive and oy'4e
is somehow destroyed. Our recent work(2 ), indicates that the convert 1
of the Al-oxide to Al-hydroxide disrupts the interlocking and degrade
the bond.
These results led us to consider methods that would serve to
inhibit the oxide-to-hydroxide conversion process and thereby improve the
long-term durability of adhesively bonded aluminum structures. In parti-
cular, we have been investigating the use of certain organic acids (amino
phosphonates), which, when adsorbed in monomolecular form on the oxide,
drastically retard the rate of the conversion process without interfering
with the mechanical interlocking that is so important for obtaining good
initial bond strength.
In the first year report under this program (ONR N00014-80-C-0718),
we concluded(3) that hydration inhibitors, and particularly nitrilotris
(methylene) phosphonic acid (NTMP), can be used to improve the bond
durability of adherends etched in FPL. In fact, the presence of NTMP
improves the durability of FPL-prepared 2024 Al adherends to the point
where they rival the durability of PAA adherends. Analysis of the results
suggested that an inhibitor's effectiveness depends both on its ability
4-
-4-.

to inhibit the conversion of Al-oxide to hydroxide and to form chemical
bonds with the adhesive.
In the continuation of this program, we have extended the use of
the inhibitor NTMP to PAA-prepared adherends. We have also investigated
the compatibility of the NTP inhibitor, as adsorbed on an adherend oxide
surface, with several primer/adhesive systems that are widely used in
structural bonding applications.
0'0
-5-o

-?7
2. EXPERIMENTAL METHOD
2.1 SURFACE PREPARATION
The initial step in the preparation of test coupons and panels was
degreasing; panels were immersed for 15 minutes in an agitated solution
of Turco 4215* (44 g/l) at 65*C and then rinsed in distilled, deionized
water. Degreasing was followed by a standard FPL treatment, consisting
of a 15-minute immersion in an agitated aqueous solution of sodium dichro-
mate dihydrate (60 g/l) and sulfuric acid (17% v/v) held at 65*C, after
which samples were rinsed in distilled, deionized water and air dried.
FPL-treated panels were then treated using the PAA process. Panels were
anodized in a 10 wt % phosphoric acid solution at a potential of 10 V for
20 minutes, followed by a rinse in distilled, deionized water and air
drying.
The treatment of panels in inhibitor solutions after the PAA
process was accomplished by immersing the panels for 30 minutes in an
aqueous solution of the inhibitor held at either room temperature or
80°C, followed by rinsing in distilled, deionized water and air drying.
The inhibitor used was nitrilotris (methylene) phosphonic acid (NTMP):
N[CH2P(O)(OH)213•
2.2 WEDGE TEST PROCEDURE
Following surface preparation, 2024 Al adherends (6 x 6 x 0.125
in.) were bonded together using American Cyanamid FM 123-2 adhesive
cured at 120*C and 40 psi for 1 hour. The bonded panels were cut into 1
x 6 in. test strips and a wedge (0.125 in. thick) was inserted between
• An alkaline cleaning agent manufactured by Turco Products.
-6-

the two adherends to provide a stress at the bondline. After an equili-
bration period of 1 hour at ambient conditions, the wedge-test samples
were placed in a humidity chamber held at 60°C and 98Z relative humidity.
In order to determine the extent of crack propagation, the test pieces
were periodically removed from the humidity chamber and examined under
an optical microscope to locate and mark the position of the crack front.
When the test was complete, usually after 150 to 160 hours, calipers
were used to measure the positions of these marks, which denote crack
length as a function of time.
Wedge-test specimens are the adhesive-joint analogue of the wedge-
force loaded double-cantilever beam (DCB) specimens used in the testing
of homogeneous materials. In a wedge-loaded DCB, the displacement is
necessarily fixed, and the load decreases during crack growth. If the
crack length, a, is measured from the point of load application, then it
follows from simple beam theory that the load can be expressed as a
function of the fixed displacement, w, as:(4 )
Bh3Ew:Pm= -- (1)
8a3
where: P - load at point of application4 E - Young's modulus of adherends
h - thickness of adherendsB - width of adherendsw thickness of wedge
-a crack length
If the crack is not growing, then the load is proportional to the dis-
placement: P - w/C. C is the compliance (i.e., inverse of the stiffness)
of the adherends. Thus, from the above relation:
-7-
Lp

_04.' . . . .-..
w 8a3 (2)C m
W P Eh3B
Using the Griffith energy criterion, G, the "energy release rate" or
crack extension force" is given by:
p2 3C (3)G =
2B sa
3h3Ew2 (4)i.e., G "
% w16a4
Equation (4) shows that the crack extension force decreases with the
fourth power of the crack size. This equation can be modified to take
into account such factors as ductile strain in the adhesive, which would
allow rotation of the adherends ahead of the crack tip.(5 ) As the test
was used for comparison, and the same adhesive was always employed, these
W corrections were not used in the analysis of the wedge-test data.
Using the crack-length data generated by the wedge tests, the crack
extension force, G, was calculated using Eq. (4). The average crack velo-
city, v, was also determined from the information on crack length as a
function of time.
2.3 T-PEEL PROCEDURE
The material used for T-peel testing was 2024 Al clad with a 1000
series Al alloy. Prepared panels, 6 x 12 x 0.032 in., were bonded to-
gether over approximately 9 in. of their length using one of the primer/
adhesive systems listed below.
8

7.-797 w
Primer/Adhesive System Cure Conditions
1. No primerFM 123-2 adhesive 60 min at 120*C (250*F) and 40 psi
2. BR 127 primer 30 min at RT + 60 min at 120*C (250°F)PM 300 adhesive 60-90 min at 175°C (350°F) and 45 psi
3. No primer
FM 53 adhesive 60 min at 120*C (250*F) at 45 psi.
The bonded panels were then cut into 1 in.-wide test specimens. The 3 in.-
long unbonded ends were bent apart, perpendicular to the glue line, and
clamped into the grips of an Instron tensile-testing machine. Testing
was done at a constant cross-head speed of 10 in./min, and a record was
made of load versus cross-head movement.
2.4 SURFACE ANALYSIS AND EXAMINATION
On completion of the wedge and T-peel tests, the bonded pairs were
separated and samples were selected for surface analysis and examination
in the scanning transmission electron microscope (STEM). The surface
analysis measurements were done with a Physical Electronics spectrometer
(Model 548) equipped with a double-pass cylindrical mirror analyzer.
Measurements were taken in both the XPS (X-ray photoelectron spectro-
scopy) and AES (Auger electron spectroscopy) modes, the latter being
used in conjunction with sputter-etching (argon ions) to obtain informa-
tion on composition as a function of depth.
Crack surfaces were examined in a JEOL-100 CX scanning transmission
electron microscope (STEM) used in the high-resolution (20 - 30 A) SEM
mode. To suppress charging of the surface by the electron beam, a thin
coating of Pt was deposited on the surfaces by secondary ion deposition.
-9-

Test coupons were analyzed using XPS to determine the amount of
inhibitor adsorbed on the oxide surface. The peak height of the 2p
photoelectrons of P and Al was measured and the P/Al ratio was calculated
using previously determined sensitivity factors.( 6 ) The P/Al ratio was
w taken as a measure of the relative coverage of inhibitor on the Al-oxide
surface.
-10
['- .. i. . . . 2. .. " ' " -. :i. .. " .. . . .

... . .. . ... - .. , .= . f'- .-- - .-- -. o - - '-.- .--- -- . - "
3. RESULTS
3.1 INHIBITOR SURFACE COVERAGE
The inhibitor surface coverage on PAA oxide surfaces, as given by
the P/Al ratio, is summarized in Table 1. Only a limited amount of data
40was collected, but the range of solution concentrations used was similar
to that used to evaluate inhibitor adsorption on FPL.(3 )
TABLE 1
Surface Coverage (P/Al Ratio Determined By XPS), As aFunction Of NTHP Concentration And Temperature,
On PAA Prepared Al Surfaces
wWMP concentration Solution Surface Coverage(ppm) Temperature (P/Al)
0 RT 0.11 ± 0.03I RT 0.13 ± 0.01
10 RT 0.16 ± 0.01300 RT 0.20 t 0.05300 800C 0.49 ± 0.04
3.2 T-PEEL TESTS
For each adhesive system tested, T-peel specimens were prepared
using the following surface treatments: 1) FPL, 2) FPL + 10-ppm NTMP
(RT), 3) FPL + 100-ppm NThMP (RT), and sometimes 4) FPL + 300-ppm NTMP
(800C).
In the course of investigating adhesive systems of varying T-peel
strengths, three epoxy-based adhesives or adhesive/primer combinations
were investigated; they are listed below with their experimentally deter-
mined T-peel strengths.
- 11 -'9

: . . + .. . ..t.. .+. + + + + + + . - . -- . . . , .- I
Primer/Adhesive T-peel Strength (lb/in)
BR 127/FM 300M 6.0 1.0- /FM 123-2 15.0 ± 0.9
- /FM 53 50.9 ± 5.7
In each case, the T-peel strength values were not influenced by
the presence of NTMP at the oxide/epoxy interface since failure occurred
cohesively through the adhesive. Each of the values obtained was compar-
able with the strength claimed by the manufacturer for the adhesive under
the test conditions employed here.
3.3 WEDGE TESTS
The wedge test results (Fig. 3) for FPL adherends, PAA adherends,
and PAA adherends treated with low (10-ppm) and high (300-ppm) concentra-
tion NTMP solutions demonstrate the superior bond durability of PAA-
treated adherends compared with FPL-treated adherends and also show that
* durability can be further improved by pretreatment with NTKP. As shown
in Fig. 3, treating the surface in a 300-ppm NTMP solution gave little
further improvement, as gauged by final crack length, over treatment in
a 10 ppm solution. This probably results from the similar surface cover-
ages obtained by treatment in 10- and 300-ppm solutions.
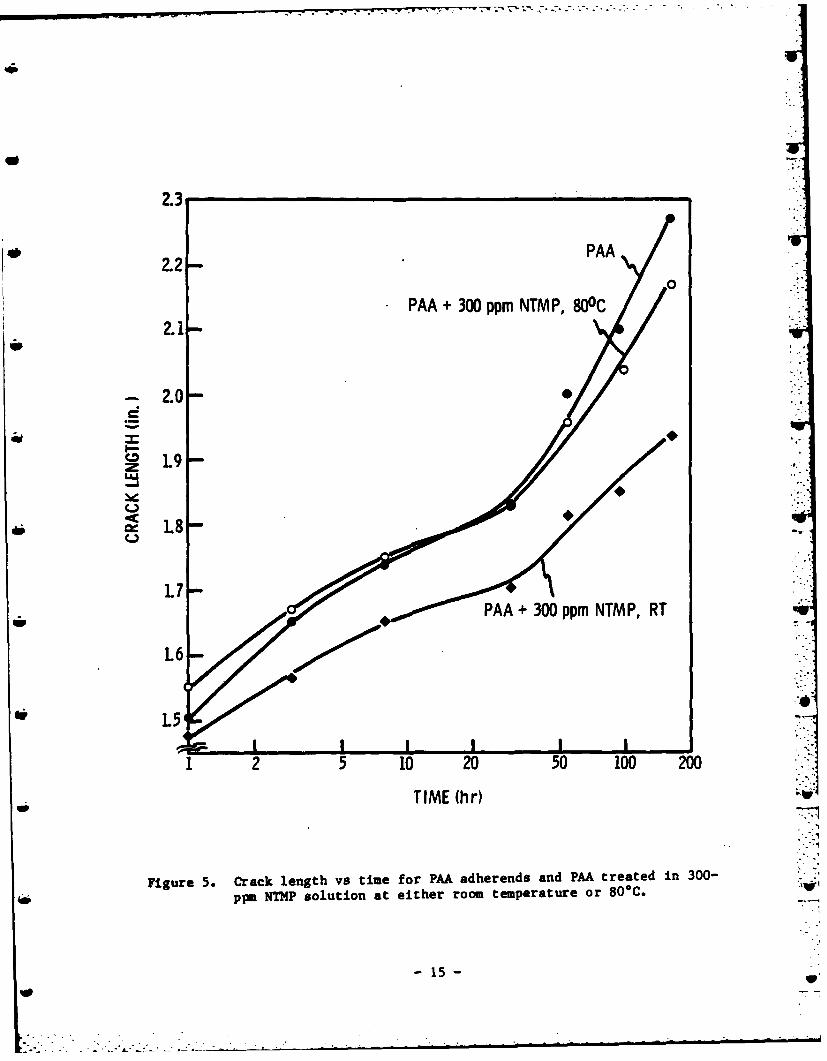
In Figs. 4 and 5, wedge test results have been plotted for two con-
centrations of NTMP solution, 100 ppm and 300 ppm respectively, at two
temperatures, RT and 80C (176*F). Treatment in the elevated temperature
10-ppm NTMP solution gave no improvement over the 10-ppm solution used at
room temperature (Fig. 4). When adherends were treated in a high concen-
tration solution (300 ppm) at 80°C, there actually appeared to be a
decrease in bond durability in comparison with adherends treated in 300-
ppm NTMP solution at room temperature (Fig. 5).
- 12-
0 .

2.3
* 2.2-
2.1-
2.0-PAA
;z
C-, PAA + 10 ppmU - NTM P, RT
PAA + 10 ppm NTMP, 800C
1L5
1 2 5 10 20 50 100 200
TIME (hr)
Figure 4. Crack length vs time for PAA adherends and PMA treated in 10-ppm NTMP solution at either room temperature or 80*C.
141-14-1

* 3.0
FPL
2.5.
-PAA0
2.0
PAA + 10 ppmNTM P
PAA +300 ppm NTMP
1 2 5 10 20 50 100 200
TIME (hr)
Figure 3. Crack length vs time for FPL and PMA adherends and PMA adhe-rends treated with lO-ppm and 3OO-ppm NTHP solution.
-13-
2.3
2.2 PAA
0
PAA + 300 ppm NTMP, 800C2.1-
-.ao
I-~L9
.1-* ~ L8
'" Liip PAA 300 ppm NTMP, RT
1.5
1 2 5 10 20 50 100 200
TIME (hr)
Figure 5. Crack length vs time for PAA adherends and PAA treated in 300-
ppa NTHP solution at either room temperature or 80C. "
-15-

I-.-
In a further series of wedge tests (Fig. 6) the 10 ppm NTMP treated
adherends did not behave as well as in the previous test. Surface cover-
age results for NTMP on FPL-treated surfaces indicated(3) some variability
in the adsorption of NTMP on Al-oxide, particularly when the solution
concentration is below the level necessary to establish monolayer coverage.
Such scatter in surface coverage at the 10-ppm NTMP level probably causes
the variability in wedge-test performance for samples treated in these
solutions. However, once monolayer coverage is established on the surface
(thought to be with P/Al - 0.15-0.20) the results are highly reproducible.
In addition to the results for adherends treated in 100-ppm and 500-ppm
NTMP solutions (reported in Fig. 6), tests were also conducted using PAA
adherends treated in 200-ppm and 300-ppm NTMP solutions. The behavior
of these adherends was the same as the behavior of the 100-ppm and 500-ppm
NTMP treated adherends (within experimental scatter), indicating that
monolayer coverage of NTMP achieves, optimal performance.
As outlined in the experimental procedure (Section 2.2) the wedge
test results were analyzed to yield crack extension forces and resultant
crack velocities. The results of this data analysis (discussed below)
are shown in Fig. 7. As G decreases over the duration of the test, the
initial G values are those on the right-hand side of the graph. The
three curves represent data from wedge tests of FPL and PAA adherends
and PAA adherends treated with 100-500 ppm NTMP.
3.4 SURFACE EXAMINATION OF WEDGE TEST FAILURE SURFACE
Visual Examination
At the conclusion of the humidity exposure, the wedge test assem-
blies were broken open. The crack propagation region, delineated by the
- 16 -

2.1
2.0 --PAA + 10 ppm NTMP
• "L9 " ;
0 00
,,PAA 0.
~L8
PAA + 100 ppm NTMP
PAA + 500 ppm NTMP
I I I I. -.I
1 2 5 10 20 50 100 200
TIME (hr)
Figure 6. Crack length vs time for PAA adherends and PAA treated in 10-
ppm, 100-ppm or 500-ppm NTHP solution. i
-17
l

10 P
10-2
PAA +NTMP
10-3
101
0 2 4 6 8 10 12
G (in -lb Iin 2)
Figure 7. Average crack velocity, v, as a function of G, the fracture-
-18-

markings on the edge of the adherends that record the position of the
crack front with time, was examined visually. In the case of the FPL
adherends, the failed surface appeared "dull" or "stained", with heavier
stains concentrated close to the initial position of the crack front.
14 In addition, once crack propagation had begun at a particular oxide/adhe-
sive interface, the crack continued to follow along that interface with
little or no tendency to transfer through the adhesive to the oxide/adhe-
sive interface on the other side of the adhesive.
On PAA adherends (and to an even greater extent on NTMP-treated
PAA adherends), the crack path was not confined exclusively to one oxide/
adhesive interface. As was the case with FPL, the regions of initial
crack propagation appeared dull or stained, but further along the fracture
surface the appearance of the aluminum side of the fracture took on a
"shiny" appearance with a slight purple sheen. On the adherends treated
in high concentration (200-500 ppm) NTMP solutions, and in 80*C solutions
the final increment of crack extension often consisted of regions where
crack propagation has occurred wholly within the adhesive layer.
Scanning Microscopy
Scanning electron microscopy (SEM) was used to characterize the
fracture surfaces, particularly the aluminum side of these surfaces.
SEM confirmed that once a warm, wet environment is established at the
crack tip, the crack path always transfers from its initial path in the
adhesive to the oxide/adhesive interface, and that initial crack propa-
gation is associated with conversion of the original oxide to boebmite.
This transfer always occurred, even on PAA adherends treated in high
-19-

m ~ ~ ~ ~ ~ ~ ~ .... : n ! -... . . -.. . . . .
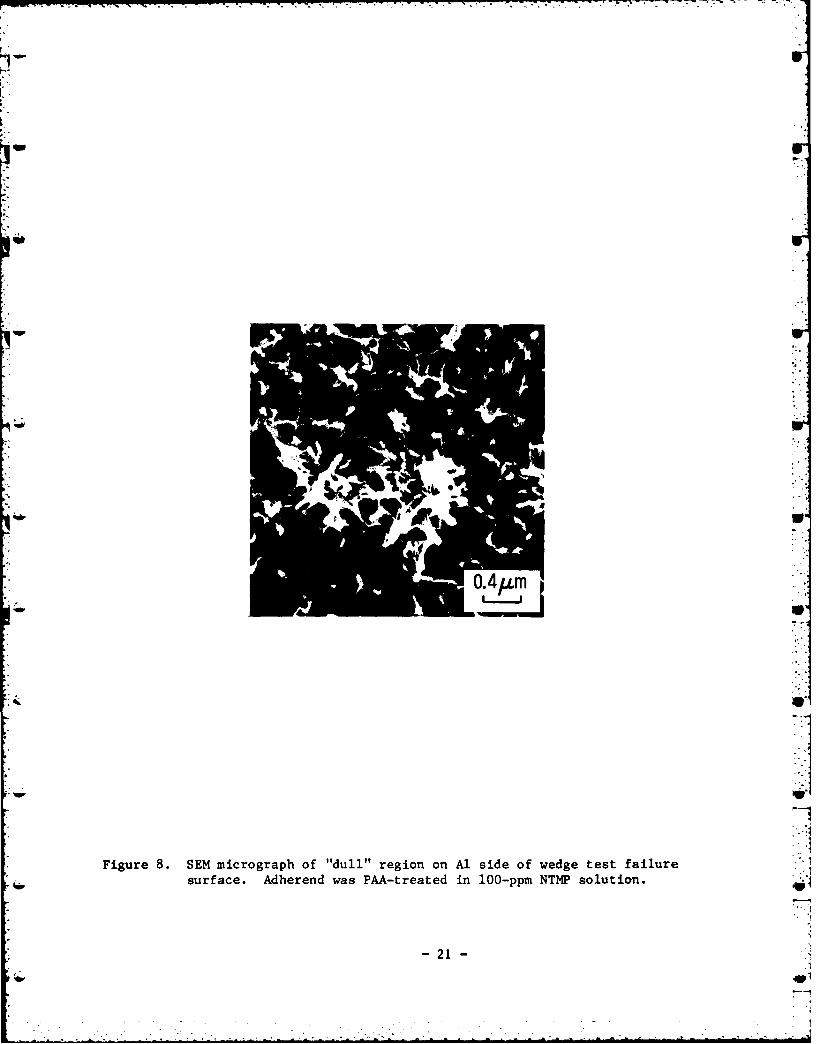
concentrations of inhibitor solution; Fig. 8 shows such a surface region
on a 100-ppm NTMP-treated PAA adherend.
For PAA adherends (without inhibitor treatment), STEM examination
of the fracture surface revealed that the dull regions of the surface
corresponded to a hydrated surface, and the shiny regions corresponded
to an oxide surface coated with a thin adhesive layer (Fig. 9). This
transition from a dull to a shiny surface appearance occured during the
final increment of crack movement. In the lower half of Fig. 9a, the
surface, at high magnification, had the cornflake morphology of boebmite
(similar to Fig. 8). A higher magnification view of the transition be-
tween dull and shiny regions is shown in Fig. 9b. Conversion of the
oxide to hydroxide is probably occurring at such a low rate that it is
no longer a precursor to crack propagation, and propagation through the
adhesive becomes a more favorable mechanism of crack growth. The crack
moves progressively away from the interface region until it is wholly
within the adhesive layers. The adhesive is deformed by the passage of
the crack front until a deformation limit is exceeded, at which point it
recoils to form the structures seen in Fig. 9c.
On PAA treated adherends in the presence of the NTMP inhibitor,
the transition region, indicating transfer of the crack path away from
the oxide/adhesive interface, occurs at a much earlier point in time.
Figures 10a and 10b show the fracture path on an adherend treated in a
200-ppm solution of NTMP. The crack has propagated through the adhesive
(but is still quite close to the interface as no fibres from the dacron
mat are observed). Because moisture was still available to the oxide,
with the passage of sufficient time (judged from the position of this
- 20 -
t I
Figure 8. SEM micrograph of "dull" region on Al side of wedge test failuresurface. Adherend was PMA-treated in 100-ppm NTMP solution.
-21-
.1°
,.1

-Ale
- -. - -. -.- S . ..-- '.
Figure 9. SEM micrographs of: (a) transition region on Al side of PAA wedge-test failure surface (arrow denotes direction of crack propagation);
(b) transition region at higher magnification; (c) failure through
near-surface adhesive layer.
-22 -
r, "C
w" -2. , : :2 ':; ; . i .

23~
region on the fracture surface to be at least 100 hours), the oxide under
W the adhesive has transformed to boehmlite. In fact, sufficient time has
elapsed to allow the formation of bayerite atop the boehmite flakes and
it can be seen distorting the adhesive layer in Fig. 10a. The cracks in
the adhesive layer seen in Fig. 10 are also a direct result of oxide-to-
hydroxide conversion. The formation of boebmite from the initial oxide
involves a lattice expansion, and more Importantly, the flake morphology
* adopted by boeluite is considerably more open than that of the amorphous
oxide. This results in a - 3-fold increase in the thickness of the
layer under the adhesive,(7 ) and the consequent strain produces cracks
in the adhesive. The boehmite structure of the underlying layer is
seen very clearly in Fig. lob.
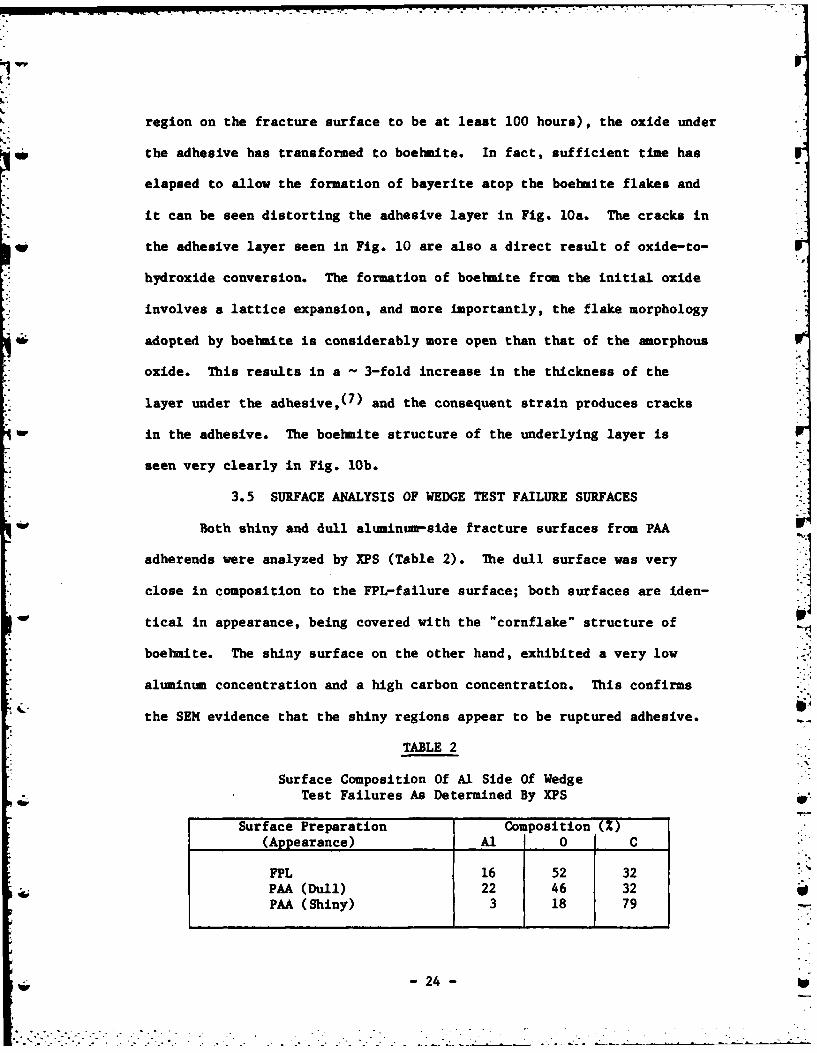
3.5 SURFACE ANALYSIS OF WEDGE TEST FAILURE SURFACES
Both shiny and dull aluminum-side fracture surfaces from PAA
adherends were analyzed by XPS (Table 2). The dull surface was very
close in composition to the FPL-failure surface; both surfaces are iden-
tical in appearance, being covered with the "cornflake" structure of
boebmite. The shiny surface on the other hand, exhibited a very low
aluminum concentration and a high carbon concentration. This confirms
the SEM evidence that the shiny regions appear to be ruptured adhesive.
TABLE 2
Surface Composition Of Al Side Of Wedge
Test Failures As Determined By XPS
Surface Preparation Composition (Z)
(Appearance) Al 0 C
FPL 16 52 32PAA (Dull) 22 46 32PAA (Shiny) 3 18 79
-24-

AES depth profiling confirmed these results; depth profiles obtain-
ed for the dull and shiny surfaces are illustrated in Figs. 11 and 12,
respectively. The surface of the dull sample comprised a layer - 5,000 A
thick of Al-hydroxide. The undulations in the aluminum and oxygen concen-
trations with depth may be due to density changes in the hydroxide layer
but may also result from the sputtering process on the extremely thick
hydroxide layer.
The oxide layer on the shiny surface was found to be - 1,000 A
thick. Previous work(8 ) has shown that the thickness of a typical PAA-
oxide, as determined by AES depth profiling, is - 1,000 A. Thus the
shiny aluminum fracture surface consists of a very thin adhesive layer
overlying the original PAA-oxide.
- 25 -w .1

4s
1"' 0
4
.1
0
1w'-
E-o<0
LA.
C~'I
0w
(s~ln Aejgje) anildW NV~-01NV0
264.5

S25A/min u 80 X/mIn0I= 5- ---'--950A""'- :5 5
4 C
1~U- Al
00
2 -
~Al
0~0
01
I0 - I I I
0 10 20 30 40 50
SPUTTERING TIME (min)
Figure 12. Depth profile of "shiny" region on Al side of PM wedge testfailure surface.
- 27 -w
-* P .1.. ~ *.--
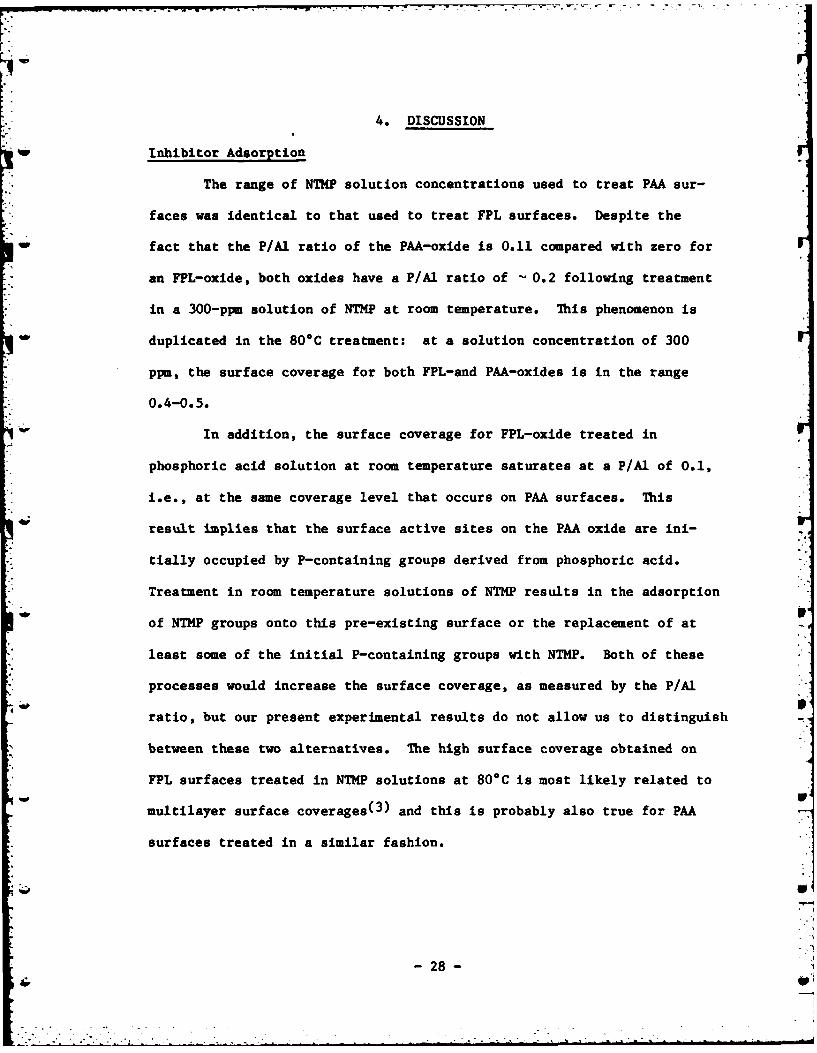
4. DISCUSSION
Inhibitor Adsorption
The range of NTMP solution concentrations used to treat PAA sur-
faces was identical to that used to treat FPL surfaces. Despite the
- fact that the P/Al ratio of the PAA-oxide is 0.11 compared with zero for
an FPL-oxide, both oxides have a P/Al ratio of - 0.2 following treatment
in a 300-ppm solution of NTMP at room temperature. This phenomenon is
duplicated in the 80*C treatment: at a solution concentration of 300
ppm, the surface coverage for both FPL-and PAA-oxides is in the range
0.4-0.5.
In addition, the surface coverage for FPL-oxide treated in
phosphoric acid solution at room temperature saturates at a P/Al of 0.1,
i.e., at the same coverage level that occurs on PAA surfaces. This
result implies that the surface active sites on the PAA oxide are ini-
tially occupied by P-containing groups derived from phosphoric acid.
Treatment in room temperature solutions of NTMP results in the adsorption
of NTMP groups onto this pre-existing surface or the replacement of at
least some of the initial P-containing groups with NTMP. Both of these
processes would increase the surface coverage, as measured by the P/Al
ratio, but our present experimental results do not allow us to distinguish
between these two alternatives. The high surface coverage obtained on
FPL surfaces treated in NTMP solutions at 80*C is most likely related to
multilayer surface coverages(3) and this is probably also true for PAA
surfaces treated in a similar fashion.
-28-

Initial Bond Strength
The influence of NTHP on initial bond strength was evaluated using
the T-peel test. For each of the epoxy-based adhesives used, failure in
the T-peel test was cohesive through the adhesive, so that the T-peel
strength values were not influenced by the presence of NThP at the
oxide/adhesive interface. These results indicate that the strength of
the interface, with or without NTMP, was greater than the peel strength
of the strongest epoxy adhesive used, i.e., 50 lb/in.
Some preliminary T-peel tests were conducted using a non-epoxy,
structural adhesive/primer combination (nitrile-phenolic). When monolayer
NTMP coverage was present on the FPL surface prior to bonding, the T-peels
failed close to the polymer/oxide interface. Preliminary analyses of the
failed surfaces seemed to indicate that the NTHP had interfered with
normal curing processes.
Thus the value of the initial bond strength may be strongly
influenced by the degree of compatability between NTMP and the particular
primer and/or adhesive used. We can conclude that NTMP is compatible
with epoxy-based systems, but that it appears to interfere with the curing
of nitrile-phenolics. Obviously, more information is needed to assess the
compatability of NTMP with other structural adhesive systems currently
available.
Bond Durability
The wedge test results clearly demonstrate that the superior bond
durability of PAA-treated adherends can be further improved by pretreat-
ment in NThP inhibitor solution. This is expected as our previous work(6 )
had shown that PAA oxides were subject to oxide-to-hydroxide conversion
although the reaction rate was slower than that observed for FPL oxides.
- 29 -
bW

Since our previous work(2 ,3 ) had established that long term bond durabil-
ity is intimately related to the stability of an oxide surface in the P
presence of moisture, any further increase in oxide stability should
result in improvements in bond performance.
Maximum improvements in the bond durability of PAA adherends
occurred when a monolayer of the NTMP inhibitor was present on the sur-
face; multilayer coverages, obtained with elevated temperature (80°C)
wq treatment solutions, did not further improve bond durability. Similar
results were obtained when FPL adherends were treated in 80*C solutions
of NTMP.(3) When FPL adherends were treated in a 10-ppm NTMP solution
at 80*C, there was a 1.65X increase in surface coverage above that
achieved through RT treatment. Use of XPS to study wedge-test failure
surfaces with these high surface coverage levels revealed that P was
present on both sides of the failure, implying that the crack path had
been through the multilayer surface film produced by the elevated temper-
ature treatment.(3 ) Surface coverage data was not taken for 80*C treat-
ment of PAA in 10 ppm NTMP solutions, but treatment of PAA in an 80*C,
300-ppm NThP solution did give a 1.45X increase in surface coverage over
the level recorded for a similar treatment at room temperature. Thus, a
similar mechanism may be operative when PAA adherends have multiple
layers of NTHP between the oxide and the adhesive; failure can occur
through the NTMP layers so that although there is an improvement in bond
durability over that of untreated PAA adherends, this improvement may
not be as good as that achieved when a monolayer of NThP is present.
Discussion of the wedge test results is greatly facilitated by the
fracture mechanics approach which was used in the preparation of Figure 7.
- 30 -
If -

Initial crack lengths prior to exposure to the humid environment (i.e.,
the crack length at 1 hour plotted in Figs. 3-6) were similar for all
adherends, and thus the initial G values are similar for all adherends.
This initial crack extension force gave rise to similar initial crack
velocities, regardless of whether the adherend surface preparation includ-
ed treatment with the inhibitor NTMP.
More information must be assembled before definitive statements
' '~can be made regarding the initial stages of crack growth during the
wedge test, but some preliminary conclusions can be inferred through
reference to work by Patrick et al.( 9 ) They used tapered DCB specimens
1 - of adhesively-bonded 2024 Al containing an initial precrack at the center
of the bond line and established that when a static load (well below that
needed to cause unstable cracking) was applied in the presence of either
liquid water or 96% RH air, cracking occurred at the adhesive/adherend
interface and was not a continuation of the initial precrack. The inter-
facial failure was initiated just below or slightly behind the crack tip
of the precrack, i.e., in the region of interaction of the stress field,
due to the crack tip, and the adherend surfaces.
Examination of the fracture surfaces indicate that a similar re-
initiation step may be occurring in the initial stages of our wedge tests.
On FPL-prepared adherends in particular, there is an abrupt transition
from cohesive to adhesive failure during the first hour of exposure to
4 the humid environment. This transition is less abrupt for the PAA
adherends and on PAA treated with 300-ppm NTMP; there is effectively an
"incubation period" before interfacial failure is seen. Future experi-
mental procedures should include more careful attention to processes
-31-% .

occurring in the initial stages of crack growth, particularly for adhe-
rends treated in NTMP. Based on our results, we must tentatively conclude
that the re-initiation of the crack in the presence of moisture occurs
by hydration of the original oxide to give boehmite, but this conclusion
must be verified experimentally.
Regardless of the exact mechanism, once interfacial cracking has
begun on FPL adherends (without inhibitor treatment), the initial crack
velocity is maintained to very low values of G. (It should be kept in
mind that G is not a simple function of time but is related to crack
length.) The fact that the rate of crack growth is relatively constant
over a wide range of G values indicates that the mechanism of crack
growth is independent of the driving force. The conversion of oxide to
hydroxide is such a stress independent mechanism, and STEM examination of
fracture surfaces had previously led to its identification as the mechan-
ism by which adhesive bonds fail in the presence of moisture.(2)
As seen in Fig. 7, the behavior of the PAA adherends is quite
different. At levels of G which are stil relatively high, the crack
velocity began to fall, and it then leveled off two orders of magnitude
below its initial value. SEM examination of these fracture surfaces
(Section 3.4) has shown that over the course of the wedge test the locus
of failure initially transfers from oxide/adhesive interface, and in the
latter stages to the adhesive near the interface. For the PAA adherends
treated in higher-concentration NTMP solutions, thi. "ansfer occurs
quite early in the test and, in the latter stages, the cracking occurs
through the adhesive. Thus, the decrease in crack velocity is probably
due to the occurrence of this transition, and the crack growth rate at
- 32 -

the lower level plateau may be characteristic of the adhesive. More
testing is currently in progress to verify these conclusions.
In stumary, the hydration inhibitor NTMP can be used to improve
the bond durability of adherends prepared by the PAA process. Maximum
improvement in bond durability is obtained with monolayer coverages of
NTMP. When epoxy-based adhesive systems are used, the presence of NTMP
at the oxide-adhesive interface does not degrade the initial bond
strength.
-33-

5. REFERENCES
1. J.D. Venables, D.K. McNamara, J.M. Chen, T.S. Sun, and R.L. Hopping:"Oxide morphologies on aluminum prepared for adhesive bonding", Appl.Surf. Sci., Vol. 3, pp. 88-98 (1979).
2. J.D. Venables, D.K. McNamara, J.M. Chen, B.M. Ditchek, T.I.Morgenthaler, and T.S. Sun: "Effect of moisture on adhesively bondedaluminum structures", Proc. 12th Nat. SAMPE Tech. Conf., Seattle,WA. (1980).
3. J. S. Ahearn, G.D. Davis, A. Desai, and J.D. Venables: "Mechanicalproperties of adhesively bonded aluminum structures protected withhydration inhibitors", Martin Marietta Laboratories, Tech. Report TR81-46c (October, 1981).
4. D. Broek, "Elementary Engineering Fracture Mechanics", Sijthoff andNoordhoff, The Netherlands, p. 154 (1978).
5. M.H. Stone and T. Peet: "Evaluation of the wedge cleavage test forassessment of durability of adhesive bonded joints", Royal AircraftEstablishment Tech. Memo MAT 349, (July, 1980).
6. G.D. Davis, T.S. Sun, J.S. Ahearn, and J.D. Venables: "Application-. of surface behaviour diagrams to the study of hydration of phos-
phoric acid-anodized aluminum", J. Mater. Sci., Vol. 17, pp. 1807-1818 (1982).
7. W. Vedder and D.A. Vermilyea: "Aluminum + Water Reaction", Trans.Faraday Soc., 65, 561 (1969).
8. T.S. Sun, D.K. McNamara, J.S. Ahearn, J.M. Chen, B. Ditchek, and J.D.Venables: "Interpretation of AES depth profiles of porous Al anodicoxide", Appl. Surf. Sci., Vol. 5, pp. 406-425 (1980).
9. R.L. Patrick, J.A. Brown, L.E. Verhoeven, E.J. Ripling, and S.Mostovoy: "Stress-solvolytic failure of an adhesive bond", J. Adhes.,Vol. 1, pp. 136-141 (1969).
434
-1
• - 34 -

14
I
I