labour market survey - ctevt publication labour market...labour market survey analysis of emerging...
TRANSCRIPT

LABOUR MARKET SURVEY Analysis of Emerging Needs of Technical Human Resources in the Country
Council for Technical Education and Vocational Training
Research and Information Division
Sanothimi, Bhaktapur
October, 2016

2 | P a g e
LABOUR MARKET SURVEY Analysis of Emerging Needs of Technical Human Resources In the Country
Field Visit Team
1 Ms. Asmita Paudel 2 Ms. Laxmi Acharya
3 Mr. Gopal Bhandari 4 Ms. Pabitra Ghimire
5 Mr. Dinesh Lal Rajbhandari 6 Mr. Indra Raj Khanal
7 Ms. Sushila Pokharel 8 Mr. Prakash Kattel
9 Ms. Samjhana Rokaya 10 Mr. Ganga Bhujel
11 Mr. Dikendra Bikram Bista 12 Mr. Sirshak Acharya
13 Mr. Dilip Hajara 14 Mr. Keshab Dhungana
Field Coordinator/Supervisor
Mr. Deepak Thapa
Research Team Dr. Shesh Raman Neupane
Mr. Bishnu Koirala Mrs. Anjana Aryal
Mr. Umesh Adhikari
Special Contribution Dr. Hari Kumar Pradhan Mr. Guna Raj Ghimire
Consultancy Service Accountability Initiative Private Limited
Research Coordinator
Mr. Manoj Sharma Neupane Advisors
Dr. Kul Bahadur Basnet Dr. Ramhari Lamichhane
Mr. Shiva Shankar Ghimire
Financial Support EVENT Project/ World Bank
Overall Management
Council for Technical Education and Vocational Training Research and Information Division
Sanothimi, Bhaktapur

3 | P a g e
ACKNOWLEDGEMENT
Labour Market Survey is an extremely important field of research for CTEVT since it provides policy level feedbacks regarding identifying demanded areas, revising existing training curricula and expanding its activities in the needy areas under its premises. The existing huge gap between the available training opportunities and skills in demand in labour market can be mitigated by formulating policies and developing implementation plans based on the findings of such type of survey. Research and Information Division thus feels a great privilege to have this volume of survey report which could be possible by the joint contribution of the research team, CTEVT management and other various persons and individuals. The analyses or views presented in this report are only the the views of the independent group of researchers and do not represent the institutional statement of CTEVT; however, CTEVT considers them as an asset and respects them during the process of policy formulation and planning in the future.
It gives us an immense pleasure in placing on record our deep appreciation and sincere gratitude to all those who have directly or indirectly contributed to this research study entitled Labour Market Survey: Analysis of Emerging Needs of Technical Human Resources in the Country. We would like to express our deep gratitude to Dr. Kul Bahadur Basnet, Vice-Chairperson; Mr. Ramesh Kumar Bakhati, Member-Secretary, Dr. Ramhari Lamichhane, the then Member-Secretary of CTEVT for providing us with this opportunity to conduct this important survey. Our appreciations are also due to Mr. Saurav Ram Joshi and Jeeban Chandra Dahal, the then directors of Research and Information Division of CTEVT; Mr. Saurav Dev Bhatta, World Bank; Mr. Laxmi Ram Paudel, former Project Director, and Mr. Ravi Sharma, Senior Program Officer of EVENT Project for their contribution for designing the study and providing fund.
We also gratefully acknowledge and owe our large debt to each of the following persons:
♦ Dr. Shesh Raman Neupane and whole team of Accountability Initiative Private Limited, for preparing this comprehensive survey report and the persons and institutes that provided assistance to them from proposal development to report finalization. Likewise, the contribution provided by Dr. Hari Kumar Pradhan and Er. Guna Raj Ghimire was extremely valuable for designing and shaping this report.
♦ Mr. Yam Prasad Bhurtel, Account Controller and Mr. Shiva Prasad Khanal, Senior Account Officer for managing fund and handling the account of this research project.
♦ Mr. Manoj Sharma Neupane, Deputy Director, Research & Information (R & I) Division of CTEVT and other staffs of Research and Information Division for their enthusiasm and efforts in all the ways from shaping the approach of the study through entire process, i.e. from development phase till the end of the report preparation.
Last but not least, other large numbers of persons and institutions who directly or indirectly contributed to this research but have not been named here equally deserve our deep gratitude.
Shiva Shankar Ghimire Director, R & I Division

5 | P a g e
ACRONYMS AND ABBREVIATIONS
ADB Asian Development Bank AHW Ayurvedic Health Worker ANM Auxiliary Nurse Midwifery B/CMLT Bachelor/Certificate in Medical Laboratory Technology BN Bachelor of Nursing BS Bikram Sambat CBO Community-Based Organization CBS Central Bureau of Statistics CMA Community Medicine Assistant CTEVT Council for Technical Education and Vocational Training DDC District Development Committee DoLIDAR Department of Local Infrastructure Development and Agriculture Road FGD Focus Group Discussion FNCSI Federation of Nepal Cottage and Small Industries GDP Gross Domestic Product GEFONT General Federation of Nepalese Trade Unions GIZ Gesellschaft für Internationale Zusammenarbeit GoN Government of Nepal GSM Global System for Mobile Communication HA Health Assistant HAN Hotel Association of Nepal HPFN Hotel Professional Federation Nepal HR Human Resource HRH Human Resource for Health I/NGO International /Non-Governmental Organization IT Information Technology JTA Junior Technical Assistant LMIS Labour Market Information and Analysis M.Sc. Master of Science MDSI Macro Development Synergies Inc. MoF Ministry of Finance MW Megawatt NAC Nepal Airlines Corporation NSTB National Skill Testing Board PPP Public Private Partnership SAM Social Accounting Matrices SDC Swiss Agency for Development and Cooperation SPSS Statistical Program for Social Science TSLC Technical School Leaving Certificate TTPs Technical Training Providers TVET Technical and Vocational Education and Training TYP Three Years Plan WHO World Health Organization

7 | P a g e
TABLE OF CONTENTS
Acronyms and Abbreviations
List of Tables
List of Charts
Executive Summary .................................................................................................................................................... 1
PART ONE: INTRODUCTORY
1.1 Background ...................................................................................................................... 4
1.2 Rationale of the Study ...................................................................................................... 6
1.3 Objectives of the Study ..................................................................................................... 6
1.4 Literature Review ............................................................................................................. 6
1.5 Methodology .................................................................................................................... 8
1.5.1 Survey of Employment Units ..................................................................................... 8
1.5.1.1 Agriculture ......................................................................................................... 9
1.5.1.2 Engineering ........................................................................................................ 9
1.5.1.3 Health .............................................................................................................. 10
1.5.1.4 Hospitality ........................................................................................................ 10
1.5.2 Sample Frame and Sampling Methodology ............................................................. 11
1.5.3 Development of Questionnaire and Pilot Test ......................................................... 13
1.5.4 Desk Analysis of Secondary Sources ...................................................................... 14
1.5.5 Data Analysis and Report Preparation .................................................................... 14
1.5.6 General Outline of the Report ................................................................................. 14
1.5.7 Limitations of the Study ......................................................................................... 15
PART TWO: ANALYSIS OF SECTORIAL POLICY AND ECONOMIC TRENDS
2.1 Introduction .................................................................................................................... 16
2.2 Agriculture Sector .......................................................................................................... 16
2.2.1 Trend of Economic Growth of Agricultural Sector .................................................. 18
2.2.2 Policy Measures for Agriculture Development ........................................................ 18
2.3 Engineering Sector ......................................................................................................... 19
2.3.1 Policy Measures for Industrial Development .............................................................. 20
2.3.2 Present Situation of Infrastructure Development ......................................................... 21
2.3.3 Employment Opportunities in Industrial Sector ....................................................... 22
2.4 Health Sector .................................................................................................................. 23
2.4.1 Health Policy ........................................................................................................... 23
2.4.2 Availability of Health Services ................................................................................ 24
2.4.3 Employment Opportunities for HRH ....................................................................... 24
2.5 Hospitality Sector ........................................................................................................... 26

8 | P a g e
2.5.1 Policy Analysis ....................................................................................................... 26
2.5.2 Trends of Tourist Flow ............................................................................................ 26
PART THREE: ANALYSIS AND FINDINGS
3.1 Quantitative Analysis .................................................................................................... 28
3.1.1 Profile of Employment Units ................................................................................... 28
3.1.2 Employment Units by Sampling Strata .................................................................... 28
3.1.3 Employment Units by Economic Sectors ................................................................. 28
3.1.4 Employment Units Sub-sectors ................................................................................ 29
3.1.5 Employment Units by District ................................................................................. 30
3.1.6 Distribution by Occupational Sub-sectors ................................................................ 30
3.1.7 Status of Employees and Employment ..................................................................... 31
3.1.8 Status of Business .................................................................................................... 33
3.1.9 Responses on Future Growth Potentials ................................................................... 35
3.1.10 Demand of Skilled Workers .................................................................................... 36
3.1.11 Perception Level on Supply Status of Workforce ..................................................... 39
3.1.12 Satisfaction Level of Workforce .............................................................................. 40
3.1.13 Potential Innovation ................................................................................................ 41
3.2 Qualitative Approach ...................................................................................................... 41
3.2.1 National Demand of Workforce in Nepal ..................................................................... 41
3.2.2 District-wise Responses Obtained through Checklist Interview ............................... 42
3.2.3 Employment Opportunities in Formal and Informal Sectors ..................................... 46
3.2.4 Speculation for Future Demand ............................................................................... 46
3.2.5 Demanding and Emerging Occupations ................................................................... 47
3.2.6 Quality of Skilled Workers or Skill Gap .................................................................. 47
3.3 Interaction Program among Stakeholders ........................................................................ 48
3.3.1 Agriculture .............................................................................................................. 48
3.3.2 Engineering ............................................................................................................. 48
3.3.3 Health ..................................................................................................................... 49
3.3.4 Hospitality Sector .................................................................................................... 49
PART FOUR: ESTIMATION AND SPECULATION OF DEMAND
4.1 Introduction .................................................................................................................... 51
4.2 Basis of Speculation or Estimation ................................................................................. 51
4.3 Agriculture ..................................................................................................................... 52
4.3.1 Employment in Private Formal Sector ..................................................................... 52
4.3.2 Demand in Government Sector ................................................................................ 53
4.3.3 Employment in Informal Sector: .............................................................................. 53
9 | P a g e
4.4 Engineering .................................................................................................................... 54
4.4.1 Employment in Private Formal Sector ..................................................................... 54
4.4.2 Demand in Government Sector ................................................................................ 55
4.4.3 Demand in Informal Sector: .................................................................................... 55
4.5 Health............................................................................................................................. 55
4.5.1 Employment in Private Formal Sector ..................................................................... 56
4.5.2 Demand in Government Sector ................................................................................ 56
4.5.3 Employment Opportunities in Informal Sector ......................................................... 57
4.6 Hospitality ...................................................................................................................... 57
4.6.1 Employment in Private Formal Sector...................................................................... 57
4.6.2 Employment in Government Sector ......................................................................... 58
4.6.3 Employment in Informal Sector ............................................................................... 58
PART FIVE: FINDINGS, CONCLUSION AND RECOMMENDATIONS
5.1 Background .................................................................................................................... 59
5.2 Agriculture ..................................................................................................................... 59
5.2.1 Major Findings ........................................................................................................ 60
5.2.2 Conclusion and Recommendations .......................................................................... 60
5.3 Engineering .................................................................................................................... 61
5.3.1 Major Findings ........................................................................................................ 61
5.3.2 Conclusion and Recommendations .......................................................................... 62
5.4 Health Sector .................................................................................................................. 63
5.4.1 Major Findings ........................................................................................................ 63
5.4.2 Conclusion and Recommendations .......................................................................... 63
5.5 Hospitality ...................................................................................................................... 64
5.5.1 Major Findings ........................................................................................................ 64
5.5.2 Conclusion and Recommendations .......................................................................... 65
5.6 Other Recommendations ................................................................................................ 65
BIBLIOGRAPHY ................................................................................................................... 67
Annex 1: Occupation-wise Redundant and Recruited Number............................................. 69
Annex 2A: Local and National Demand of Workforce in Nepal ............................................. 72
Annex 2B: Local and National Demand of Workforce in Nepal ............................................. 73
Annex 2C: Employment Percentile in Formal and Informal Sectors ....................................... 75
Annex 3: Growth Speculation for the Next Five Years ........................................................ 76
Annex 4: Availability of Skilled Workforce ........................................................................ 77
Annex 5: Institutions Producing Skilled Workforce ............................................................. 79
Annex 6: Emerging Occupations of Skilled Workers ........................................................... 80
Annex 7: Quality of Skilled Workers or Skill Gap ............................................................... 82

10 | P a g e
Annex 8: District-wise Demand Status ................................................................................ 83
Annex 9: List of the Key Informants Interviewed ................................................................ 97
Annex 10: Projection Sheets for Private Formal Sector ....................................................... 101
Annex 11A: Questionnaire .................................................................................................... 106
Annex 11B: Checklist for FGD and KII ................................................................................. 110
Annex 12: List of Participants of Interaction Program ......................................................... 111
11 | P a g e
LIST OF TABLES
Table 1.1: Tentative Population and Proposed Sample Size ................................................ 11 Table 1.2: Sector and Employment Unit-wise Population and Sample ................................ 11 Table 1.3: Analytical Domains of the Survey ...................................................................... 12 Table 2.1: Situation and Trend Analysis of Health Sector ................................................... 24 Table 2.2: List of Demanded Skills in Public Health Services………………………. ......... 36 Table 3.1: Disaggregation by Subject of Study ................................................................... 28 Table 3.2: Disaggregation of Employment Units by Economic Sector ................................ 29 Table 3.3: Disaggregation by Employment Unit Sub-sector. ............................................... 29 Table 3.4: Distribution of Sample as per the Districts ......................................................... 30 Table 3.5: Distribution by Occupational Sub-sector ............................................................ 31 Table 3.6: Descriptive Statistics on Number of Employees ................................................. 31 Table 3.7: Ratio between Technical Staffs and Total Staffs by Subject Area ....................... 32 Table 3.8: Ratio of Technical Staffs to Total Staffs by Economic Sector ............................. 32 Table 3.9: Ratio of Technical Staffs to Total Staffs ............................................................. 32 Table 3.10: Status of Business as per Sampling Strata .......................................................... 33 Table 3.11: Status of Business as per Employment Unit Classification ................................. 33 Table 3.12: Business Status as per Employment Unit ............................................................ 34 Table 3.13: Probable Future Status of Business .................................................................... 35 Table 3.14: Probable Status of Business as per Economic Sector .......................................... 35 Table 3.15: Probable Status of Business as per Sampling Strata ............................................ 36 Table 3.16: Cross-tabulation between Past Status and Future Expectation ............................ 36 Table 3.17: Comparative Figures of Recruited and Redundant Staffs .................................... 37 Table 3.18: Comparison between Redundant Number and Recruited Number ...................... 38 Table 3.19: Respondents' Perception Regarding the Supply Status ........................................ 39 Table 3.20: Status on Availability of Skilled Workforce ....................................................... 39 Table 3.21: Supply status of Technical HR ........................................................................... 40 Table 3.22: Perceptions on Satisfaction Level of Employees ................................................ 41

12 | P a g e
LIST OF CHARTS
Chart 2.1 Employment Trend in Agro-industry ............................................................................. 17 Chart 2.2 Trend of Registration of Agriculture and Forest-based Cottage Industry ....................... 17 Chart 2.3 Growth Trend of Agriculture Sector in the Last Decade ................................................. 18 Chart 2.4 Growth Rate of Major Sub-sectors ................................................................................. 20 Chart 2.5 Employment in Industrial Sector .................................................................................... 23 Chart 2.6 Establishment of Health Institutions and Extension of Hospital Beds Chart 2.7 Trend of Inflow of Tourists ............................................................................................. 25
EXECUTIVE SUMMARY
Human capital plays an important role to make a country prosper since the prosperity of the country is associated with the productivity of its citizens and productivity of citizens can be enhanced by imparting knowledge and skills to them. The investment in human capital is, therefore, crucial for development of any nation. According to pioneer economist, Gary Becker, general education creates general human capital; however, creation of specific human capital is the sector of TVET. Specific in the sense that it is provided as per the special need of a particular occupational sector or area. Thus, the productivity of individual TVET graduate is limited within his specialized occupation. To achieve the maximum benefit for TVET, training-related employment must be ensured for almost all graduates. The investment in human capital, therefore, must be dovetailed with the actual need of the country; otherwise, the large amount of investment in human capital will be useless. Council for Technical Education and Vocational Training is the apex organization devoted to provide TVET (in the form of specific human capital) as per the need of the country. CTEVT should, therefore, be aware and updated with the actual need of labour market before making TVET programs operationalized. This study is a part of the same endeavor of making TVET programs relevant and reliable. The purpose of the study was to carry out a labour market analysis to identify the demands of technical human resources at present as well as to speculate the demands for the future. The specific objectives of the study were to:
• Identify the emerging demands of lower and middle level technical human resources in the labour market in engineering, health, tourism and agriculture sectors;
• Identify the gaps in the existing human resources so as to better address the employers' needs by enhancing their occupational skills;
• Make projection of such technical human resources both in a long-term and short-term basis.
Both quantitative and qualitative approaches were adopted for this study. Under the quantitative approach, altogether 1,344 employment units were surveyed, selecting 247 from agriculture sector, 315 from engineering sector, 398 and 384 respectively from health and hospitality sectors based on the stratified random sampling procedure. All the seventy-five districts were classified into 10 analytical domains incorporating the districts of similar geographical and socio-economic characteristics, and 25 districts were selected for the study choosing 1-3 districts from each of the analytical domains. The sample size of employment units in each district is calculated proportionately based on the size of population. A semi-structured survey form was developed for collecting the primary data from these employment units. Besides the employment unit survey, several key informants were also interviewed from development-related ministries, departments and district level offices, members of professional associations, trade unions among others. The trend analysis was made of sectorial growth rate of GDPs. Similarly, sectorial plans, policies and programs were also analyzed to get some signals on the absorptive capacity of the economy. Analysis and discussion was also made separately for the four sectors — Agriculture, Engineering, Health and Hospitality. Almost 50% of the staffs of the surveyed employment units were found from technical background and on an average 5.51% of the staffs were found involved/engaged in one occupation. But this number is found varied as per the sector, occupation and on regional basis. Among the various types

2 | P a g e
of employment units, technical staffs are found working in lower proportion in Bank and Financial Sector, whereas this proportion is the highest in NGOs/ INGOs and Education and Training Institutes. During the last five years, most of the enterprises were found not run satisfactorily with some banks and financial institutes and I/NGOs as exceptions. Almost 50% of the employment units are found satisfied from their last five years business; however, another 50% had some type of reservations. Moreover, the owners of these employment units were not found optimistic about the future either. Although, regular entry and exit of employees is observed in the surveyed enterprises in various occupations, negligible number of employment units were found to have recruited additional number of employees in the last twelve months because of the expansion of their business. Most of the occupations where new staffs were recruited are basically health-related occupations like Staff Nurse, General Medicine, Beautician and so on. Based on the perceptions of respondents on supply status of workforce, only 16.7% of the enterprises realized the scarcity of workforce in their sectors; however, the rest of the employment units do not have such realization. Moreover, almost 40% of the employment units even think that there is oversupply of technical human resources they used to recruit. The demand of TVET graduates was also found underestimated due to their proficiency level, since the majority of the employers were not found fully satisfied by the performance of fresh graduates (without experience). Agriculture Agriculture is also emerging as a potential sector. The early sign of mechanization in agricultural practices and shift from traditional agriculture to market agriculture is the indication of the rising absorptive capacity of agriculture sector for basic to higher level technicians. The increasing trend of opening of agro-industries as well as the emerging agro-businesses like trout framing, off-season vegetables farming, organic farming, farming of several kinds of livestock like poultry, ostrich, pig are creating self-employment opportunities in informal sector. Since all of these activities are running informally, the formal employment opportunities are hardly available within these sectors. Although public jobs in agriculture sector have become saturated, present plan of expansion of agriculture service (including livestock) to wider range of beneficiaries creates job opportunities for middle level technicians immediately to almost 3,000 and another 1,000 within few years. Engineering Presently, a large demand of skilled workforce in construction-related occupation is speculated in the domestic labour market based on various factors analyzed in this study. Scarcity of workforce was already prevailing in the market because of the attraction the youth to foreign employment. Some currently running infrastructure projects such as hydropower, irrigation and road and bridge construction have suffered from crisis of the skilled workforce. The need of new construction and reconstruction in the post-disaster phase has further multiplied the previous need. Some junior level technicians in construction sector like Welder, Plumber, Carpenter, Scaffolder are also demanded in significant number. Although signals about the significant demand of construction-related skilled workforce is clearly visible in the labour market, the demand trend of labour market is not encouraging in the last few decades. The continuity of freezing trend of the last few years of government capital expenditure has not been broken up till date. Conducive environment has not been prepared yet for the private sector investment. Anyway, several engineering-related occupations are highly demanded in the labour market, mostly in private and informal sectors.
3 | P a g e
Health Sector No notable increment in public health institutions has been observed during the last two decades. However, expansion of beds and other services saw a remarkable upsurge in that period. Unlike the public sector, both health institutions and health services in private for profit sector witnessed a rapid increment during the same period. Because of diversification and modernization of health technology and services, demand of more specialized courses instead of general courses of medicine and nursing is emerging. These are Orthopedic Assistant, Radiography Assistant, Optical Fitting and Dispensing, Dental Mechanics, Operation Theater (OT) Technician, Dialosis Technician and so on. Unlike the new and specialized occupations, the graduates from presently available health courses such as Staff Nurse, General Medicine, Lab Technicians, Auxiliary Nurse Midwifery, Community Medicine Assistant are found saturated in the labour market in present set up of public health service. However, the provision of existing government policy to expand and extend free and quality health services to VDC and ward level paves way to create more employment opportunities for the graduates of these programs in significant number. But before reaching on any conclusion, we have to wait for the proper implementation of the policy. Hospitality Employment opportunities in tourism or hospitality-related organizations are mainly available in private and informal sector and very few opportunities are available in formal and public sector. Due to the absence of workplace-based training system, employers find it hard to get efficient workforce and therefore are interested to hire fresh candidates and train them than recruiting trained graduates. Unstable political situation of the country is considered as the primary cause for inefficient performance of hospitality sector. The inflow of tourists during the last decade is not encouraging. However, slight upward trend is observed. In the interview with key informants, it is reported that hotel business was shrinking day by day and it is difficult to accommodate the existing employees. The sector is dominant with informal opportunities. Tour and travel sector is also covered by informal sector and demands differ from region to region because tourism activities do not take place in the same manner in all the regions. Trekking business is another area considered by the study and the study found out that 90% activities and demand thereby employment opportunities fall in informal sector. In conclusion, the survey result depicts that the majority of the employees in the formal sector are from technical background or are skilled-based but annual increment in employment is negligible. It is a pity to conclude that one in every two enterprises was not performing satisfactorily in the last five years. Moreover, no more evidences can be gathered to justify the betterment of the situation in the future except the ambitious-looking targets of public policies and development plans. If these expected outcomes of development plans and policies are to be achieved, supply of technical human resources should be increased in significant proportion not only in quantity but also in quality. The employers are found preferring experienced workers to trained graduates. This may be because of the dominance of theoretical portion and lack of practical or work-based learning approach in the existing training curricula. In some trades and programs, even if the curricula are somewhat appropriate, they are not followed properly in the institution while teaching.
4 | P a g e
PART ONE
INTRODUCTORY
1.1 Background History of Technical Education and Vocational Training came into existence in an unorganized form since the great artists had been spreading arts and crafts and architecture of Pagoda Style from Tibet to many other parts of the world. In Nepal, the organized Vocational Education began based on Gandhian Philosophy in around 1940. Nurse and Health Assistant School was established in 1956. Similarly, Balaju Technical Training Center (Mechanical Training Center) was initiated from 1963. The first training program for Junior Technical Assistants in Agriculture was launched by Technical Training Division of the Department of Cottage Industry in 1956. Moreover, Vocational Education had been introduced in 29 multi-purpose schools together with general education under multi-purpose education program from 1970. Realizing the scope of vocational education and training, government of Nepal initiated it in Vocational High Schools in 80's decade and established TVET structure in a separate wing establishing the Directorate of Technical and Vocational Education. With the successful impacts of such initiatives, Technical Education and Vocational Training Act was brought into picture in 1989 and the secretariat of the TVET sub-sector was established as Council for Technical Education and Vocational Training (CTEVT). The Council for Technical Education and Vocational Training as an apex body of TVET sector in Nepal is responsible for policy formulation, expansion of TVET sector, quality assurance and coordination and is mandated for producing basic to higher level technical human resources as per the needs of the country (GoN, 20061). Today, the graduates of CTEVT are not only absorbed by domestic market, they are equally in demand in foreign employment. These demands come for graduates of all occupations and programs – Diploma, Technical SLC (TSLC) and short-term vocational trainings. Therefore, demands in both domestic and foreign employment have been the matter of major concern for policy makers, planners and managers of TVET sub-sector. Technical Education and Training and Vocational Education and Training are widely used nomenclatures; however, clear demarcation between them is absent. With the common practice in Nepal, technical and vocational trainings fall under shorter duration with specific skills of a particular occupation and are with terminating nature but can be accumulated together with different modules and can be linked with the classification of skill standards for further certification. Even within the technical and vocational training, there are two different approaches to deal with the training delivery. The courses of very short duration: one or two weeks such as candle making, soap making, incense stick making, pickle making which do not demand any prerequisites and extended skills are delivered under the courses of livelihood skills. With little efforts of time and resources, beneficiaries can change their earning level through their small enterprises. But such courses cannot be articulated with the standards set for skill certification. The courses designed with the duration more than 160 hours and less than 1,560 hours fall under technical and vocational courses. Such courses demand certain prerequisites, can be linked with other modules and matched with the criteria for skill certification of different levels. Courses with more than 1,560 hours with fixed criteria and can be articulated for further training and education are defined as technical and vocational education. The livelihood, vocational and Technical School Leaving Certificate level courses fall under basic level courses and courses of proficiency certificate
1 Government of Nepal (GoN), 2006, The CTEVT Act (Second Amendment - Education and Sports related Some Nepal Act Amendment Act 2006) (29 Dec 2006; BS 2063/09/14).
5 | P a g e
and or diploma level are of middle level courses and the courses of undergraduate and master's degree courses fall under the higher level programs. The TVET programs managed by CTEVT are assumed to be demand-based. In the early days, it had only conducted the long-term non-academic courses, especially in Agriculture, Health and Construction sectors but in a limited number through its trade schools. Gradually, it expanded its activities covering large number of sectors in wider geographical locations. After democracy in 90s, it started to grant affiliation to various private institutes to run both academic (Diploma) as well as non-academic programs (TSLC). While selecting the training programs, the single criterion that CTEVT should consider is the needs of the market. It is, therefore, theoretically accepted that the gap between supply and demand should be reduced to minimize the wastage of resources. Like any other developing countries, unemployment/ underemployment and poverty are the main challenges for Nepalese economy. On the one hand, one out of every four Nepalese are living below the poverty line (CBS, 2011) with the lowest per capita GDP among the south Asian countries. On the other hand, massive underutilization of labor force can be observed in Nepalese economy. Although the officially calculated unemployment rate is not that serious (1.8%) (CBS, 20112), the underemployment rate can be counted as almost 30% if the underutilization rate of labor force is considered. Moreover, as mentioned above more than 450,000 labor force enters annually into the labor market (MoF, 2011). However, the majority of them are not gainfully employed due to lack of appropriate skills. As per CTEVT, less than 100,000 short- and long- term training opportunities are available in the country (CTEVT, 2011 3 ). If the contribution of development projects is removed, the training opportunity is really limited, grossly insufficient to address the new labor market entrants. Therefore, 1,500 people leave the country each day for foreign employment, of which strong majority are unskilled. While a study based on market signalizing study (KC and Pradhan 20104) concluded it to stand at 70%, the World Bank concludes that 75% of such migrants are unskilled. Lack of skilled human resources is conceived as a main responsible factor for slow process of industrialization (1.6%) and decreasing contribution of manufacturing sector to GDP, which has declined by 2.8 percentage point in the last decade (MoF, 2012). Anecdotes claim that a large number of industries in Terai region have been employing Indian technicians because of unavailability of particular type of skills in Nepalese workforce. This problem is observed in all sectors of economy. A study carried out by SDC claims that there is a big need of properly trained people in sectors such as construction, tourism, mechanical, automobile, etc. (Pradhan et al., 20145). Therefore, it is necessary to properly assess the need of such workforce and prepare workforce in required quality. Due attention should be paid to the demand side of labor market while adjusting the supply side of training. Presently, a large number of technical training providers (TTPs) under governmental and non-governmental (including private sector) are carrying out training programs
2 CBS 2011, Nepal Living Standard Survey 2010/11, Kathmandu: CBS. 3 CTEVT-A Glimpse, 2011 4KC, Anuja, & Pradhan, H., 2010, Analysis of Labor Market Signaling, Unpublished Research Paper, Kathmandu. 5 Pradhan, H., Ghimire, G.R., & Subedi, S. (2014). Report on analysis of selected industry and service sectors in Nepal. Lalitpur: Swiss Agency for Development Cooperation.

6 | P a g e
but basically without understanding the needs of business and industry, the ultimate buyers of the TVET services. Therefore, the government together with SDC and EU is planning to introduce employer-led training projects. CTEVT has further responsibility to assure the quality of these initiatives as well as coordinate such organizations to eliminate duplications.
1.2 Rationale of the Study Employment creation and income generation are the necessary measures to address both issues of unemployment/underemployment and poverty of a country. In order to address these problems, a large number of governmental, non-governmental as well as private organizations have been involving in TEVT programs throughout the country. The demand side information, rate of employment creation and nature of skills mismatch in technical field are the primary concerns of TVET sub-sector. Regular updating of such information is essential to ensure smooth operation of labor market information system (LMIS). LMIS is the system that supplies and/or facilitates supply of these data and information to both the TVET system and employers. In summary, establishment of a dynamic LMIS that is capable of managing demand and supply side data and information, the analysis and dissemination of the results to address the needs of both demand and supply side stakeholders, primarily of business and industry are its two major functions.
1.3 Objectives of the Study The purpose of this study was to carry out a detailed labour market survey to identify the demands of technical human resources at present as well as to speculate the demands for the future. The specific objectives of the study were to:
• Identify the emerging demands of lower and middle level technical human resources in the labour market in engineering, health, tourism and agriculture sectors;
• Identify the gaps for enhancing skills of the existing human resources so as to better address the employers' needs;
• Make projection of such technical human resources both on a long-term and short-term basis;
1.4 Literature Review There are very few studies regarding the labour market survey, especially in technical field with quantitative methodologies; however, some study reports are available. As reported by some studies, there is scarcity of skilled human resources in several sectors of economy (Pradhan et al., 2014) that are supposed to make contribution to the national economy. These studies indicate that lack of properly trained HR has been the bottleneck for enhancing productivity. It has also adversely affected expansion of the service sector and commercialization and modernization of the agricultural sector. On the other hand, a large number of TVET graduates are assumed left unemployed.
7 | P a g e
Slow process of industrialization, slow rate of expansion of service sectors, lack of commercialization and modernization of agriculture sector and lack of productive investments are among the main challenges of Nepalese economy. Presently, the agricultural sector in its current form is not in position to absorb any additional labour force since it has already been overcrowded. Likewise, the service sector is expanding to some extent, but this expansion is not sufficient to absorb even a small fraction of new annual entrants of 450,000 in the labour market (MoF, 20126). The production of human resources should always be compatible with the actual needs of labour market in terms of both required skills and their level of efficiency (quality of human resource). Conduction of labour market assessment on periodic basis and revising the TVET plans and policies accordingly is thus essential to reduce the degree of mismatch between actual needs and supply of labour in the market.
The studies in the past have indicated mismatch between the skills in demand and supply. A study carried out by CTEVT/The British Council has sufficiently presented evidence by the study of agriculture, tourism and mechanical sectors (Pradhan et al., 20147). The tracer studies have also revealed the low employment status of graduates of TVET programs (Neupane, 20108 ). The mismatch in these two facts (demands and supply) clearly depicts the prevalence of structural unemployment (mismatch between available skills and actual needs of skills) within the country. This finding underscores the need of detailed labour market assessment, thereby providing reliable and relevant labor market data and information to planners and policy makers. Such a report will be very helpful for planning and implementation of appropriate TVET programs.
Although there are various studies focused on labor market in the international arena, there is hardly any research with a comprehensive coverage in the context of Nepal. In the specific case of transition to low carbon economy, ILO reviewed the methodologies used to speculate the skills demand. According to ILO, generally two methodologies are found adopted to analyze the employment effects of any intervention, they are Input-output models and SAMs (models based on social accounting matrices) at the national or sub-national level (ILO, 2012)9. Input-output model can estimate the increase in output and employment, sector-by-sector, caused by growing demand for construction services to modify existing houses.
A study conducted by YUWACCESS Project regarding the labour market survey adopted the mixed methodologies of desk study and administered the “Labour demand and supply” questionnaires to 15 FNCSI (Federation of Nepal Cottage and Small Industries) District Chapters. Various short-term vocational training providers use rapid market appraisal (RMA) approach to identify the local immediate demand. A study by CTEVT regarding the projection of demand of
6 MoF, 2012, The Eonomic Survey, Kathmandu: MoF. 7 Pradhan, H, Neupane, BR and Sapkota, H., 2014, Analysis of Skills Gaps between Selected CTEVT Curricula and Demand in Labor Market 8 Neupane, B.M. (2010). Increasing access of technical education and vocational training (TVET) programs and relevancy to the job market. Technical and Vocational Education and Training Development Journal, CTEVT 9International Labor Organization, (2012) Comparative Analysis of Methods of Identification of Skills Needs in the Labour Market in Transition to the Low Carbon Economy.

8 | P a g e
technical human resources adopted the ratio and trend analysis from health and engineering sectors respectively (Joshi et al., 2014)10,11.
Likewise, a study conducted by GIZ in 2010 adopted the Meta-Analysis approach to conduct the rapid market appraisal, especially focusing on the training requirement for Maoist army combatants12. According to the publication of World Health Organization (WHO), the projection approach for HR in health services mainly explained two models: Supply Model and Requirement Model. In the supply model, annual loss rate method and cohort method are mainly emphasized, whereas in the requirement method, disaggregation of sector-wise requirements is speculated and then it is summed up for national figure (Human resources for health: Models for projecting workforce supply and requirements13).
In summary, each of these methods has their own strengths and weaknesses. This proposal attempts to incorporate the strong part of these studies and revise on the weaker ones. Review of the methods used in these studies lead us to conclude that none of the methods can be replicable for this assignment. However, these studies give ample logical insights for designing and conducting this assignment.
1.5 Methodology Although quantitative data obtained from the field survey was the major basis for analyses, mixed method was used to accommodate the qualitative information. Such type of qualitative information was collected from Focus Group Discussion (FGD) and key informants' interview. Likewise, desk review of available secondary information was also the major part of analysis of this study. For the quantitative information, survey of the employment units was the major source as suggested in the ToR. Semi-structured data collection format was used for the survey of the employment units. Since scope of the study was only limited within Agriculture, Health, Engineering and Tourism, the potential employment units in each sector were identified by reviewing sufficient relevant literatures. Sufficient qualitative information was also obtained from the focus group discussion (FGD), key informants' interview and desk analysis of relevant study reports and proceedings. Unstructured interview checklist was developed and used for FGD and key informants' interview. The obtained qualitative information was applicable both to substantiate and triangulate the findings of the primary survey. Moreover, such type of qualitative data better helped to speculate the future requirements of workforce where quantitative data was not much supportive.
1.5.1 Survey of Employment Units In this survey, the word ‘employment unit' refers to the organization or institute or firm that is presently providing or has potential to provide employment to basic and middle level technical human resources as a wage-employee or self-employee; e.g. local bodies, manufacturing industries, contractor agencies, star and non-star hotels, travel and trekking agencies, small agricultural
10 Joshi, S., & Neupane, M. (2014). National Skilled Human Resource Projection in Health and Engineering Profession, CTEVT under Technical Support of MDSI, an unpublished document). 11 This report was prepared under the technical guidance of Dr. Hari Pradhan. 12 CTEVT (2010). A rapid assessment of potential labour market for rehabilitation on Maoist army combatants: A desk study for GIZ. GIZ 13 Human resources for health: Models for projecting workforce supply and requirements13.
9 | P a g e
enterprises, private hospitals, NGOs and so on. The government bodies were not included in the employment unit's survey because employment creation in government sector does not depend upon the policy of individual organization but on the national policy. So, the survey of employment units only covered private sectors and local bodies, which are independent to conduct their own activities. The primary survey which was the major source of information for this study was conducted in formal enterprises of Agriculture, Engineering, Health and Hospitality sectors as mentioned above. Both formal and informal employments within these sectors were covered in the study. However, informal employment in informal sector was not analyzed under the quantitative approach. Survey requires predetermined population; however, obtaining the list of such types of informally-run business or production units was almost impossible, thereby making it difficult to draw valid sample and conduct survey. Thus, the qualitative approach was mainly focused to analyse the employment opportunities in the informal sector as mentioned hereafter. The employers or owners of the employment units were the respondents of this survey in the small production or business firm, whereas responsible officers in HR section were the respondents in case of local bodies and large enterprises. The probable types and numbers of such employment units in each of the above specified sectors are explained separately hereunder. 1.5.1.1 Agriculture In the agriculture sector, the formal employment is limited within the government offices, banks, various categories of agro industries including large agricultural firms, dairy industries, agro-vet centers, I/NGOs, educational institutes, and so on. As mentioned earlier, employment opportunities in civil service depend upon the national policy and are covered by qualitative approach, since individual government offices may not have any individual plan for expansion. The survey was, therefore, conducted only in registered private or cooperative organizations or firms. The information about the registered firms was gathered from company registration office, cottage and small industry office, department of agriculture, etc. The number of registered organizations obtained from related government offices was considered as the total population of this sector which was calculated 28,250. The list on type of employment units for the primary survey is depicted hereunder.
a. Agriculture Development banks as well as other cooperatives and small farmer development banks
b. Various types of agro industries including agro firms, tea plantation and processing centers, fishery, and animal husbandry
c. Various cottage industries including agro-vet centers and agro input producers and suppliers, tea and coffee processing centers, jam, jelly and pickle processing centers
d. INGOs/NGOs working for the agriculture sector development
1.5.1.2 Engineering The engineering sector which is the major sector related with infrastructure development has a broader capacity for creating employment within a country. The infrastructure development activities in the country such as road and bridge construction, commercial as well as residential housing, electrification and construction of mega projects, adoption of computerized system in the

10 | P a g e
personal and official activities, mechanization of human activities are the primary determinants that provide signals for the expansion of this sector and hence reflect the idea for HR requirements. The total number of contractor agencies registered in DDC and Ministry of Physical Infrastructure and Transport, engineering consultancies, engineering institutions, manufacturing establishments and local bodies (especially municipalities) was the total population of the engineering sectors. The number of total employment units in the construction sector was calculated as 22,969.
a. Public and private educational institutes b. Contractors' associations/agencies and housing agencies c. Educational consultancies d. Workshops and service centers e. Cottage industries related to construction (carpentry, iron workshops, grill
association, occupational association such as furniture) f. Manufacturing and other service industries under the specified categories
1.5.1.3 Health Presently, formal employment opportunities for health professionals will be available in hospitals, health posts, polyclinics, pathologies, dispensaries, pharmaceutical companies, medical colleges and other health institutions. The primary surveys on all of these units were the major sources of information for the analysis. A total of 13,458 employment units was taken as the population of employment units in this sector. The list given hereunder enumerates the type of representative employment units in the health sector.
a. Private health service providers (hospital, nursing homes, polyclinics, b. Pathologies and dispensaries c. School/ Institutions d. Large industries e. I/NGOs f. Pharmaceutical companies
1.5.1.4 Hospitality The employment provided by the tourism industry is the function of the flow of tourists (both internal and external) in the country. The activities or establishment related with the tourism industry such as hotel and lodge, travel and trekking agencies, mountaineering, homestay service, religious tourism, sports tourism such as paragliding, rafting and bungee jumping, are the major guiding factors for employment assessment. The number of such establishments and their activeness had provided some insights about the employment creation capacity of the tourism industry. The total number of registered enterprises of the above mentioned activities was the total population of the study which was calculated as 200,662. The following list enumerates some types of employment units in tourism sector, from which the sample was drawn:
a. Hotel, lodge, restaurants and tea houses b. Travel/ Trekking/Rafting/ Mountaineering agencies c. Home-stay services d. Emerging occupations in tourism including bungee jumping, paragliding, etc. e. Associate members of Hotel Association of Nepal (HAN) and Hotel Professional
Federation of Nepal (HPFN)
11 | P a g e
1.5.2 Sample Frame and Sampling Methodology At first, the population of the study was determined by summing up nationwide figure of all the registered companies or probable employment units from the above mentioned four sectors which was also considered as sampling strata. Then, statistically representative sample size was determined from this population applying the following formula within each stratum considering 5-7 % margin of error and 95% confidence level as per the sector. The margin of error is considered 6.21% for agriculture sector, 5.48% for engineering sector and 5% for the remaining two sectors each.
Where, n is the required sample ‘z’ is the value of Z score at 95% confidence level (1.96) ‘t’ is margin of error (5-7% is proposed) 'p' is probability (.5 is taken) The tentative population, respective sample size with sampling weight of each sector is given hereunder in Table 1.1.
Table 1.1: Tentative Population and Proposed Sample Size
SN Name of Sector
Tentative Population
(Nationwide)
Sample Size (Selected districts)
Probability of Selecting Sampling
Sampling Weights
1 Agriculture 28,462 247 .0086 115.2 2 Engineering 200,438 315 .00157 636.1 3 Health 19,629 398 .0202 49.31 4 Tourism 24,094 384 .0159 62.74 Total 272,623 1,344 .0049 202.84
Table 1.2: Sector- and Employment Unit-wise Population and Sample
SN Employment Unit Population Sample 1. Agriculture Sector
1 Banks and Financial Institutions 272 22 2 Agro-Related Cottage and Small Industries 9,217 119 3 INGOs /NGOs(Agriculture-Related) 18,625 58 4 Agro Industries (Small, Medium and Large) 271 44 5 Educational Institutions/Training Centers 77 4
Total of Agricultural Sector 28,462 247 2. Engineering Sector
1 Contractors' Agencies 16,655 104 2 Industries (All types and categories ) 4,046 90 3 Cottage Industries 179,805 119 4 Educational Institutions 156 57

12 | P a g e
5 I/NGOs (Engineering-Related) 14 Total of Engineering Sector 200,438 384 3. Health Sector
1 Hospitals (Private /Mission/Medical College) 508 55 2 Clinic/Polyclinic / Pathologies 500 49 3 Pharmacies 6,000 153 4 Pharmaceutical/Health Equipment Industries 44 5 5 Educational Institutions 459 48 6 Health-Related Cottage Industries 459 63 7 Health-Related I/NGO 11,659 25
Total of Health Sector 19,629 398 4. Tourism or Hospitality Sector
1 Hotels (Star + Non-Star tourist standard) 499 195 2 Agencies (Travel, trekking , rafting...) 4,488 94 3 Tourism-Related Industries 957 15 4 Tourism-Related Cottage Industries 18,150 7 5 Tourism-Related I/NGOs Not Specified 4
Total of Tourism Sector 24,094 315 After determining the sample size from each stratum, the sampling was carried out in two stages (multi-stages). At first stage, all the seventy-five districts were categorized into 10 different analytical domains covering similar economic and geographical characteristics as given in table 1.3. Out of the 75 districts, 25 districts covering 2-5 districts from each analytical domain were selected as sample district. These districts were Sankhuwasabha and Dolakha from Eastern Mountain; Sindhupalchok and Mustang form Central Mountain and Bhajhang and Jumla from Western Mountain. Similarly, Ilam, Okhaldhunga and Udayapur were from Eastern Hills, Kavrepalanchok, Dhading, Tanahun, Kaski and Palpa from Central Hills and Dadeldhura, Pyuthan and Surkhet from Western Hills. Likewise, Morang, Siraha and Sarlahi were from Eastern Terai, Parsa and Rupandehi from Central Terai and Dang and Kailali from Western Terai. Similarly, Kathmandu District was selected from the three districts of Kathmandu Valley. From each (purposively) of the selected districts, the above defined employment units were listed out by the help of desk study and administrative data of related organizations. The lists of such employment units in each stratum were gathered from company registration office, Cottage and Small Industry Board, respective business and professional associations and national level survey data of related sector. The employment units of the selected districts were the actual population of the survey where each unit had a chance to be selected in the sample. The twenty-five districts selected from above mentioned 10 analytical domains for the survey were Sankhuwasabha, Dolakha, Sindhupalchok, Mustang, Bajhang, Jumla, Ilam, Okhaldhunga, Udayapur, Kavrepalanchok, Dadhing, Tanahun, Kaski, Palpa, Dadeldhura, Pyuthan, Surkhet, Morang, Siraha, Sarlahi, Parsa, Rupandehi, Dang, Kailali, and Kathmandu. Among the above mentioned 25 districts, Dolakha, Sindhupalchok, Kavrepalanchok and Dhading were the districts which were severely affected by the earthquake of 2072 BS.
Table 1.3: Analytical Domains of the Survey
13 | P a g e
Eastern Central Western
Mou
ntai
n
1. Taplejung 2. Sankhuwasabha 3. Solukhumbu 4. Dolakha
5. Sindhupalchok 6. Rasuwa 7. Manang 8. Mustang
9. Bajura 10. Bajhang 11. Darchula 12. Dolpa 13. Jumla 14. Kalikot 15. Mugu 16. Humla
Hil
ls
1. Panchthar 2. Ilam 3. Dhankuta 4. Terhathum 5. Bhojpur 6. Okhaldhunga 7. Khotang 8. Udayapur 9. Sindhuli 10. Ramechhap
11. Kavrepalanchok 12. Nuwakot 13. Dhading 14. Makawanpur 15. Gorkha 16. Lamjung 17. Tanahun 18. Syangja 19. Kaski 20. Myagdi 21. Parbat 22. Baglung 23. Gulmi 24. Palpa 25. Arghakhanchi
26. Achham 27. Doti 28. Dadeldhura 29. Baitadi 30. Pyuthan 31. Rolpa 32. Rukum 33. Salyan 34. Surkhet 35. Dailekh 36. Jajarkot
Kathmandu Valley
1. Kathmandu 2. Bhaktapur 3. Lalitpur
Ter
ai
1. Jhapa 2. Morang 3. Sunsari 4. Saptari 5. Siraha. 6. Dhanusha 7. Mahottari 8. Sarlahi
9. Rautahat 10. Bara 11. Parsa 12. Chitwan 13. Nawalparasi 14. Rupandehi 15. Kapilvastu
16. Dang 17. Banke 18. Bardiya 19. Kailali 20. Kanchanpur
The employment units which were selected from four different employment sectors were classified into different groups based on the size of employment (wherever available from secondary sources), types of organizations and nature of jobs provided (formal and informal). The calculated sample number in each sector was proportionately distributed to all these different groups and sampling was made randomly.
1.5.3 Development of Questionnaire and Pilot Test A semi-structured questionnaire was developed to gather the required information from these employment units which had included the following information:
• Status of presently employed technicians; e.g. number, qualification, training, skills, etc. • Trend on level of business (booming, shrinking)

14 | P a g e
• Status of availability of required human resources, (oversupplied, undersupplied in terms of both quality and quantity)
• Skills gaps • Efficiency level of available human resources (satisfactory or unsatisfactory) • Future planning of the business • Technological innovation in respective business in international and national level • Role of technicians for increasing productivity and competitiveness in the business, etc.
As mentioned above, a semi-structured interview questionnaire and checklist were prepared for the survey. The questionnaire was developed by joint efforts of experts of consulting firm and finalized discussing with CTEVT, Event Project and World Bank. After getting the approval, pilot test was carried out. The questionnaire was finalized for the survey after incorporating the feedbacks obtained from the pilot test. Report on the pilot test data was prepared and submitted to research committee and the related organizations which further helped finalizing methodology and data collection instruments.
1.5.4 Desk Analysis of Secondary Sources Besides the analysis of primary data, sufficient relevant literature as well as other information was also collected from the secondary sources. This literature included policy papers, periodic and master plans of development ministries, trends of sector-wise GDP growth and employment growths, increasing awareness level of citizens, mechanization of human activities; trends of inflow of tourists and trends of establishing new enterprises. The review and analysis of this literature was mainly focused to get sufficient signals regarding the demand of technical human resources in the corresponding sectors. The detailed analysis pattern and interpretation is presented in Part II.
1.5.5 Data Analysis and Report Preparation Both quantitative and qualitative information was collected as mentioned in the ToR. Quantitative data were analyzed by the help of statistical software named Statistical Program for Social Science (SPSS), whereas qualitative information was analyzed manually. Various statistical and econometric tools were also used to analyze the quantitative data as required. Likewise, various established theories were also considered to analyze the qualitative information. After completion of analysis, a draft report was prepared and discussed at the interaction program participated by a wide range of stakeholders including CTEVT officials, other TEVT experts, professional associations, councils and federations and some freelance researchers. The appropriate and logical feedbacks obtained from the interaction program were considered while revising the draft report. Thereafter, this final comprehensive report was prepared.
1.5.6 General Outline of the Report The report was developed and designed into four different chapters and different sub-chapters as outlined hereunder.
1 Introduction 2 Analysis of Public Policy and Economic Trends
a. Agriculture b. Engineering c. Health
15 | P a g e
d. Hospitality 3 Analysis and Findings
a. Quantitative Analysis b. Qualitative Analysis c. Brief about Interaction Program
4 Speculation of Demand a. Agriculture b. Engineering c. Health d. Hospitality
5 Conclusion and Recommendations
1.5.7 Limitations of the Study As every social research has to be carried out under a notable number of limitations, this study couldn't be an exception. The major limitations of the study were as follows:
• This study is proposed as a survey; however, conducting a survey with statistically representative sample size in the four broader sectors such as Agriculture, Engineering. Health and Hospitality was not possible only covering 1,200 employment units. So this study is more an anticipation of skills demand rather than labour marker survey.
• The data collection work of the study had to be carried out in a completely unfavorable condition of the country because of the fuel crisis resulted from undeclared border blockade. Thus the study had to face several problems such as lack of means of transportation, closure of major industries and hotels, absent of authorized representatives in employment units which adversely affected smooth data collection and supervision.
• Time series data of long period are the prerequisites for the projection or speculation of future HR requirements which was another major limitation of the study.
• In initial period of the study, the devastating earthquake of April 2015 and continuous aftershocks adversely affected the collection of secondary information to design the methodology of the study.

16 | P a g e
•
PART TWO
ANALYSIS OF SECTORIAL POLICIES AND ECONOMIC TRENDS
2.1 Introduction Two different approaches have been adopted to analyze the labour market demand of technical human resources in this report. They are supply and demand approaches. As per the demand approach, demand of individual employers is summed up to get the aggregate demand of the nation. Unlike the demand approach, demand of workforce in general or technical workforce in specific is considered as the derived demand of the production sector in supply approach. Under this approach, future projection of output growth is made at first and the demand of labour is calculated accordingly by means of employment elasticity14 of output growth.
In this part of the report, general discussion and analysis is made regarding those variables which are mainly responsible for generating employment in an economy in general and in the Nepalese economy in particular. In this regard, public policies related to socio-economic development of the nation, past trends on employment and economic growth, inflow of tourists, and house construction trends are analyzed separately under four topics — Agriculture, Engineering, Health, and Hospitality as the employment units were stratified for the sampling purpose.
2.2 Agriculture Sector Agriculture remains as a main sector of employment. Official survey data show that around 64% of the population is still engaged in agriculture occupation (CBS, 2011). According to Nepal Living Standard Survey 2010/11, 61.3% of the Nepalese are engaged in self-employment in agricultural sector, whereas 2.8% of the population is engaged in this sector as wage employees. Official data also tell us that 271 Agro-based Industries and 9,217 Agro-Based Cottage Industries are operating their production and service activities which provide employment opportunities to 29,153 and 37,203 people respectively (DCSI, 2070). As per the findings of this survey, out of the total workforce engaged in the industries, 47.27% are generally required with technical background. As per the data of Industrial Statistics 2070/71, the trend of new employment provided by the agriculture-based large industries and similar types of cottage and small scale industries are given hereunder.
If the registration trend of cottage industries between 063/64 to 069/70 is analyzed by comparing the number of registered industries between the former three years to later three years, the industries related to Dairy Industry and Food Processing are found in increasing trend; whereas some other areas of agriculture such as Nursery Business, Horticulture, Tea Plantation/ Processing and Herbal Processing are found shrinking during the same period (DCSI, 2070).
The employment trend in agro-industry of the last 25 years is depicted in Chart 3.1. In the beginning years, the annual employment opportunities provided by newly established industries have increased; however, this trend saw a remarkable decline in 052/53 which was also followed in the subsequent years. Such type of decline may be the result of the unstable political situation due to emergence of Maoist insurgency in the country. This trend started to climb up gradually when it reached to the fiscal year 063/64. It may be because of the hope of business community towards the
14 Employment elasticity of output growth is proportionate change in employment due to the unit change in output, i.e. production sector.
17 | P a g e
newly developed situation, i.e. settle down of Maoist issue and establishment of Federal Democratic Republic of Nepal.
Chart 2.1: Employment Trend in Agro-industry
Source: Industrial Promotion Statistics 2070, DCSI
The Chart 2.2 depicts the trend of number of registered cottage industry under Agriculture and Forest-based category from 063/64 to 070/71. The line shows the increasing trend. The number of industries registered in every following year is always greater than its preceding years except in the fiscal years 066/67 and 071/72. Since the number of employments is also directly proportional to the number of industries, the employment-creating capacity of these cottage industries is also estimated in the same trend as the trend of registered industries.
Chart 2.2: Trend of Registration of Agriculture and Forest-based Cottage Industry
Source: Industrial Promotion Statistics 2070, DCSI
As per the trend lines of both of the graphs, it can be speculated that a remarkable number of employment opportunities can be generated in both types of industries in the coming years. As per the industrial statistics, the per industry employment of cottage and small industry is 4.03 and large and medium industry is 85.

18 | P a g e
2.2.1 Trend of Economic Growth of Agricultural Sector The growth rate of agricultural sector can be considered as the major indicator for speculating the demand of agricultural technicians; however, the agricultural growth rate in Nepal depends more on seasonal factors than technological factors. Presently, only 54% of agricultural land is irrigated, and the productivity of the rest 46% agricultural land depends upon the monsoon. If the trend of growth rate of agricultural sector is reviewed, it was around 3.5% in the last decade. In the time series data, maximum growth rate is observed in the fiscal year 2007/08 where the growth rate is 5.8%. Conversely, it is at the minimum level in the fiscal year 2006/2007 with 1% (MoF, 2016). Although the pattern of growth rate is not deterministic but stochastic and moves up and down, the upward slopping trend line shows the rising trend of growth rate of agricultural sector (See Chart 3.3). The growth rate of agricultural sector in the last decade is depicted in the Chart 3.3 below.
Chart 2.3: Growth Trend of Agriculture Sector in the Last Decade
Source: Ministry of Finance, Economic Survey 2014/15
2.2.2 Policy Measures for Agriculture Development Agriculture has been considered as the backbone of Nepalese economy since long and it has got due consideration in every development plan and policies. The lack of agriculture labour as well as technology and technicians is the major stumbling block for the development of this sector. Presently, the contribution of Agriculture and Industry sectors to GDP is decreasing, whereas the contribution of Service sector is increasing. In the Fiscal Year 58/59 the contribution of Agriculture sector to GDP was 37.9%, which decreased to 32.3% in the Fiscal Year 071/72. Unlike the Agriculture sector, the contribution of Service sector has increased from 45.1% to 53.2% during the same period (i.e. 058/59 to 071/72) (MoF). Similarly, the proportion of population that depends upon agriculture is decreasing slightly because of shift from agriculture to other non-agricultural occupations; however, the majority of the labour force is still consumed by this sector. In the present years, due to the increasing attraction to foreign employment, large plots of agricultural land are becoming barren which has converted Nepal into an agricultural importing country from agricultural exporting country. Mechanization of agriculture sector seems to be instrumental to solve the present labour problems, which requires both technology and technicians.
19 | P a g e
Presently, the Agriculture Policy 2004 is in place. The long-term vision of this policy is expected to bring about an improvement in the standard of living through a sustainable agricultural development by transforming the current subsistence-oriented farming system into a commercial and competitive farming system. Towards achieving this vision, priority has been given to the promotion of agriculture colleges and establishing agriculture universities since the role of human resources is always crucial in the efficient and effective utilization of resources (GoN, 2004). Similarly in the Three Years Plan 2070/71-072/73, raising production and productivity of agricultural sector is prioritized. In this regard, capacity building of farmers, youth, entrepreneurs and specialists is taken as a major concern so as to enhance the use of appropriate technology in fields such as commercialization of agriculture sector, quality test and monitoring. Government of Nepal has recently developed and issued 20 years Agriculture Development Strategy (ADS) 2015-2035, which has envisioned a self-reliant, sustainable, competitive, and inclusive agricultural sector that drives economic growth and contributes to improved livelihoods and food and nutrition security leading to food sovereignty. The ADS has also aimed to achieve a remarkable agriculture growth rate of 6% with the help of expanded agribusiness, the contribution of which is equivalent to 20% of the GDP and also to provide year round irrigation facility to 80% agricultural land. The agricultural technicians that will be required in a remarkable quantity is proposed to achieve by strengthening agriculture education system in Nepal. This has been proposed to launch a comprehensive package of measures to ensure closer integration with research and extension, improved capacity of the university, agricultural colleges, and vocational schools, and better response to the needs of farmers and agro-enterprises. This plan has also proposed to establish 4,000 additional agriculture service centers which can generate the employment opportunities for middle level agricultural technicians equivalent to this number or more. Moreover, Ministry of Agriculture has recently issued a commitment paper which has planned to allocate an/a agriculture/Livestock Technician to each of the 3,000 Village Development committees (MoA, 2015). To sum up, the agriculture policy and agriculture development strategy not only create notable employment opportunities in public sector but also create formal employment opportunities in private sectors and remarkable employment opportunities in informal sector.
2.3 Engineering Sector Construction, Manufacturing and Automobile sectors are the major employment sectors for graduates of engineering trade such as industries of several categories, mega projects of hydro-electricity and road construction and irrigation, production and maintenance of automobiles and so on. Similarly the service sectors such as construction, electricity, gas and water also provide employment to a significant number of engineering graduates. Analysis of growth trend of the past and public planning and policies for future development could provide a blur signal for HR requirement.
The Chart 2.4 depicts the growth trend of Manufacturing, Construction and Electricity, Gas and Water. All of these sub-sectors represent the engineering sector in majority of the cases. The trend of each of these sub-sectors is not deterministic but stochastic with flexible growth rate. If we analyze the growth trend of electricity, gas and water sub-sectors in the last decade, it ranges between 13% and -3.44%. Similarly, the growth rate of construction sub-sector ranges between 7.67% and -0.35%, and the growth rate of manufacturing sub-sector is somewhat consistent and is in the rising trend except between 2007/2008 and 2009/10. In the fiscal year 2009/10, the growth rate of all three sub-sectors is in downward and decreasing trend, whereas in the Fiscal Year

20 | P a g e
2011/12, the growth rate of all three sub-sectors are reasonably higher (MoF, 2015). A single factor can't be held responsible for such a situation; however, political instability and lack of other favorable environment for business could be responsible for this situation in totality. On the one hand, the trends of these growth rates are not in deterministic to rightly speculate the future growth, and on the other hand, the employment elasticity of output growth is also found too variable to calculate the employment growth based on the projected output growth.
Chart 2.4: Growth Rate of Major Sub-sectors
Source: Ministry of Finance, Economic Survey 2014/15 Although sufficient literature is available in the international context regarding the relationships between output and employment growths, such types of studies are rare in the Nepalese context. A study conducted by CTEVT, Research and Information Division has stated as follows:
According to Three Years Plan 2010/11-12/13, GDP growth was 4.4% at the base year, whereas the corresponding employment growth is only 3%. The same plan had targeted the GDP growth rate of 5.5% for the whole plan period, the corresponding target of employment growth was only 3.6%. According to the Three Years Plan 2013/14-15/16, the corresponding figures of GDP growth are 3.2 and 6.0 vs employment growth rate of 2.9 and 3.6 percent respectively. By using these four figures, the employment elasticity of output growth is derived as 0.71. The employment elasticity of output growth does not follow the linear path. Moreover, a polynomial function more favors the relationships. The equation depicted in the chart 3.1 was used to find out the growth rate of employment with the given growth rate of GDP. (CTEVT, 2013)
In this regard, employment elasticity of output growth can't be justified as a reliable approach to forecast the employment growth rate in the future; however, neither better methodologies nor time series data of sufficient period of time are available to replace this approach. In this report, the above mentioned facts are considered while making projections.
2.3.1 Policy Measures for Industrial Development Industry is considered as a major employment sector. It provides opportunities to a significant number of youths both as a self-employment and wage employment. As it was discussed earlier, the
21 | P a g e
growth rate of industrial sector of Nepalese economy is almost nominal during the last decade. During the same period, its contribution to GDP has also decreased from 17% to 14.5%, despite the efforts of the government to promote the industrial sector or industries (MoF, 2015).
The Government of Nepal has initiated several policies and strategies for industrial development in Nepal. Regarding employment promotion, several measures are suggested in the Employment Policy 2071, such as promoting foreign employment returnee workers in the construction industries run by private sectors, preparing efficient human resources by means of skill development activities as per the need of infrastructure development sector focusing on the designing, maintaining, and developing road networking, etc. (GoN, 2071).
The analysis of sectorial development plan of the government and the past trend of sector-wise growth rate provide enough grounds to speculate the demand of related HR in the future. General discussion is, therefore, made regarding the demand and employment potentialities for Engineering human resources in the coming paragraphs. The need of different levels of technicians in Civil Engineering profession depends upon the growth rate of construction sector in the country. However, this growth rate is further the function of both public and private investments, level of technology, type and quality of developed infrastructures. Since level of technology and type and quality of infrastructures are fixed in a short term, the demands of such technicians are more explained by the amount of investments in infrastructure development. But in the long term, none of the factors remains constant and all are responsible for the growth of the construction sector.
2.3.2 Present Situation of Infrastructure Development In the TYP 2013/14-15/16, GoN had aimed to expand road transportation by 3,000 km and upgrade the status of 2,100 km of existing roads. Similarly, 310 new bridges are targeted to construct during the plan-period (NPC, 2013). According to Er. Bhupendra Bahadur Basnet, the then Director General, DoLIDAR, construction of each 10 km of new road requires one civil engineer. In general, one civil engineer should be assisted by 2-3 sub-engineers (Overseer) and 4-5 sub-overseers15. On the basis of this reasoning, almost 1,000 overseers and 2,000 sub-overseers are required in transportation sector. However, due to the wide use of modern technologies in the engineering sector and availability of overseers could adversely affect the demand of sub-overseers, and therefore could gradually replace the sub-overseers16. The existing road upgrading activities and bridge construction will also require an additional number of such human resources. Hydroelectricity is another major investment sector which requires a large number of engineering technicians in various categories such as Electrical, Civil, and Architecture. The government aimed to start 584 MW of hydroelectricity projects and complete projects with another 668 MW of capacity which are under construction. Similarly, construction of 400 km of transmission lines, expansion of electricity facilities to 3,000 new villages and increasing the share of population that have access to electricity facility from 67.32% to 87% are the expected outcomes as per the Three Years Plan 2013/14 - 2015/16. An independent study jointly conducted by the National Planning Commission (NPC) and Investment Board Nepal (IBN) has made a forecast that per capita electricity consumption will reach 700 kilowatt hour per year (kWh/year) by 2030, which can be 15 The organization structure of DoLIDAR includes 158 engineers and 300 sub-engineers, which is almost in 1:2 ratio. Moreover, in the minimum requirements published by GoN for contractors' agency mentioned that 'A' level contractors' agencies must require 2 engineers and 4 overseer, this is also in 1:2 ratio. 16 At the beginning years, the Civil Sub-overseer programs were run under full capacity; however, after launching diploma level program, enrollment in Sub-overseer programs has dramatically declined. The average enrollments in Civil Sub-overseer program are 29.9, 28.6, 24.9, and 29.6 in the years 2067, 2068, 2069 and 2070 respectively.

22 | P a g e
met through total installed capacity of 8,000 MW. Similarly, in another 25 years the per capita energy consumption is expected to hover around at 1,000 kWh/year and the country needs to develop 10,000 MW energy by 2040, as per the study. If we compare the ratio between electricity consumption and HR requirement between present and future, 10 times higher need of human resources in the construction phase and five times higher number of human resources in operational phases can be speculated (MoE, 2007). All these activities also require a large number of engineers, overseers and other skilled human resources. However, it is difficult to quantify and categorize the requirements. If all the planned activities start in the planned period, the absorption capacity of skilled human resources of hydroelectricity sector may be double of the present capacity. Under the urban development activities, physical infrastructures for 16 municipalities are aimed to be developed which benefit 1.2 million population. In addition to this, 10 new cities are aimed to be developed to make enough residences for one million population. These infrastructure development activities will require a substantial number of engineering professionals ranging from civil engineers to field supervisors (NPC, 2013). Similarly, during the plan period, 3,250 kilometer long agricultural road is targeted to construct. Likewise, a large number of suspension bridge construction will be initiated and irrigation facility will be available in additional 35,000 hectares of land. Through these interventions, a total of 250,00,000 labour-day employment will be generated. Informal discussion with the technicians working in the concerned sector opined that the required proportion of engineers, overseers, sub-overseers and construction labours is 1:2:5:200. As per this assumption, altogether, 329 engineers, 658 overseers and 1,645 sub-overseers will be employed in these activities. Because of the employment-friendly policy of DoLIDAR, it adopts labour intensive technologies. Thus labours and supervisors are required in greater numbers than other high skilled staffs (DoDIDAR, 2010). Similarly, some multi-purpose mega projects like Bheri-Babai Diversion, Kaligandaki-Tinau Diversion, Sunkoshi-Kamala Diversion are also under the discussing and designing phases. The Investment Board Nepal has initiated and started 12 different mega projects like Mid-hill Highway, North-South Corridor, Terai-Madhesh Fast Track Road Project, E-W Electrified Railway Project, Hulaki Highway which are the major projects of National Pride, and each of which has capacity to generate employment opportunities for thousands of construction-related technicians. Alternative Energy Promotion Center has revealed that more than 28 megawatt of hydroelectricity has already been generated in more than 60 districts by 40 mini-hydro, 999 micro hydro and 1,480 pico-hydro plants. Similarly, almost 2 lakh biogas and 3 lakh solar plants and appliances have already been installed across the country. These micro hydro and solar plants installation activities demand technical workforce with specific skills both at the installation phase and thereafter for regular maintenance.
2.3.3 Employment Opportunities in Industrial Sector The employment opportunities available in the major industries are not remarkable since both the contribution of industrial sector to GDP and growth rate of industrial sector are disappointing. At one time, the industrial sector used to create employment opportunities to almost 90,000 workforce annually, now it has declined to almost 20,000. The line graph in the Chart 2.5 depicts the industrial employment opportunities provided annually in the industrial sectors in the last 24 years.
23 | P a g e
Chart 2.5: Employment in Industrial Sector
Source: Department of Industry, Industrial Statistics 2012/13 Employment Opportunities in Post-Earthquake Situation The catastrophic earthquake of 25 April 2015 and more than 300 aftershocks greater than magnitude of 4.0 thereafter has badly affected the country. To date, over 8,790 human casualties and 22,300 injuries have been reported. It is estimated that the lives of eight million people, almost one-third of the population of Nepal, have been affected by these earthquakes. Human settlements equivalent to NRs. 408,625 billion and public infrastructures equivalent to NRs. 65,783 billion are the estimated figures of damage caused by the earthquake (NPC, 2015). That catastrophic earthquake not only claimed the lives of many Nepalese and damaged the infrastructures but also paved the way for employment creation in large numbers. The technicians related to retrofitting sector seem to be highly demanded in the coming years. The post-disaster recovery plan of Nepal pointed out the necessity of retrofitting of several public and private buildings. Instead of making new buildings, retrofitting the existing buildings reduces the carbon emission. Some green jobs like micro-hydro technician, retrofitting technicians and technicians working in recycling areas are the emerging occupations.
2.4 Health Sector The demand of technicians in health sector mainly depends upon the health service need which is further the function of population of the country as well as health awareness of citizens. In a country like Nepal where health service is also run as private business, purchasing power of the citizens is also one of the major factors for health service needs. Hospitals, health posts, pharmacies, polyclinics and pathologies are the main areas for which employment opportunities for health services are provided. Similarly, large enterprises and institutions, I/NGOs also consume HRH in notable number. The government health policy is the main guiding principle for the employment creation in health sector.
2.4.1 Health Policy The dynamics and dimensions of public sector jobs mainly in health-related field are more explained by the provisions of public health policy. Presently, the Government of Nepal has formulated and implemented Health Policy, 2071. This health policy has aimed to establish health service system to ensure basic and quality health services to all citizens by means of quality health

24 | P a g e
personnel. As the main responsible organization to produce lower and middle level technical human resources for the country, the program delivery of CTEVT, particularly of health-related programs should be guided by this health policy. Unlike the other sectors, informal employment in health sector is rare, most of the employments in health sector are in formal sector.
The first and foremost objective of the government as mentioned in the policy is to provide basic health services to every citizen. Moreover, developing, acquiring and using efficient health technicians was another responsibility mentioned in the policy. For this to achieve, CTEVT is responsible to supply basic and middle level health technicians in sufficient numbers.
Regarding the management of Human Resource in Health, the policy has proposed the action plan of managing one doctor in every Village Development Committee together with required number of other health professionals and one ANM in each ward. Moreover, it has also planned to expand pathology and X-ray services in each Village Development Committee level.
The same policy has aimed to establish one health post in each 40 minutes' distance of national highway, one primary health center for every 20 thousand population, 25-bed hospital for every 1 lakh population as well as 1 doctor and 23 other health professionals are planned to be managed for every 10 thousand population.
2.4.2 Availability of Health Services Although the policy aimed for ambitious-looking targets, present human resources allocation is not in satisfactory level. A total of 31,665 human resources are working in public health services out of which 33.8% are administrative and supporting staffs. Presently, 1,636 doctors are working in public health system, whereas the corresponding figures of paramedics, Nursing and Public Health staffs are 7,806, 6,443 and 4,296 respectively (MoHP, 2013). The detailed figures of sanctioned posts in the public health system are depicted in the Table 2.1.
Table 2.1: Situation and Trend Analysis of Health Sector
SN Name of Category Type of Positions
Total Sanctioned Posts
Percentage of Total Posts
1 Admin/Support 78 10,695 33.8% 2 Paramedics 75 7,806 24.7% 3 Nursing 17 6,443 20.3% 4 Public Health 27 4,296 13.6% 5 Doctor 57 1,636 5.2% 6 Traditional 14 789 2.5% Total 268 31,665 100.0%
Source: Primary Data, Human Resource Information System, MoHP 2013
2.4.3 Employment Opportunities for HRH Hospitals and other health-related institutions both in public and private sectors are the major employment sectors for health professionals. The extension of health institutions, therefore, explains the requirement of health professionals to some extent; however, demand of health services is not limited within health institutions. A significant number of health professionals are also employed in private hospitals, education institutions, NGOs and industries. Some of them are also engaged in informal sector as self-employment. The Chart 3.6 depicts the time series data of health-related institutions and hospital beds in public sectors which can be the good indicator to explain the demand of Human Resource in Health (HRH). The number of hospital beds increased abruptly in
25 | P a g e
the fiscal year 2003/04 because of the policy of the government to extend the hospital beds in each health post and opening district hospitals. The same reason caused the abrupt increase in hospital beds in Fiscal Year 2013/14.
Chart 2.6: Establishment of Health Institutions and Extension of Hospital Beds
Source: Ministry of Finance, Economic Survey 2014/15
The health-related institutions are almost in the same line between 2002/03 to 2014/15. By the Fiscal Year 2002/03, 4,408 health institutions had been established throughout the country including health centers, health posts and hospitals. Presently, this number has slightly increased and reached to 4,505. The number of hospital beds has increased in greater proportion against the number of health institutions. See the Chart 3.6 for detailed analysis.
Although, preparation of basic to higher level technical courses is under the responsibility of CTEVT, it has not developed curricula of large number of health occupations. Ministry of Health and Population has identified needs of additional programs. Based on their analysis, MoHP had communicated a letter to CTEVT in 2067/12/9 for the appropriate management for preparation of these HRH categories (CTEVT, 2013). The detailed figure of this projection is presented in Table 2.2 (CTEVT, 2013). Table 2.2: List of Demanded Skills in Public Health Services S N Name of Program Projected Number Level
1 Radiography Assistant 5,000 TSLC 2 Physiotherapy Assistant 5,000 TSLC 3 Optical Fitting and Dispensing 1,600 TSLC 4 Ophthalmic Science 7,000 Diploma 5 Operation Theater Assistant 2,000 Diploma 6 Homeopathy 1,000 Diploma 7 ECG/ECO 3,000 Diploma 8 Orthopedic Assistant 3,000 Diploma 9 Dental Mechanics 3,000 Diploma
10 Acupuncture 5,000 Diploma 11 Physiotherapy 3,000 Diploma 12 OT Technician 1,500 Diploma 13 Dialysis Technician 1,500 Diploma
Source: MoHP, 2009

26 | P a g e
2.5 Hospitality Sector Hospitality or tourism industry has become a major economic activity in all the countries of the world in these days than ever before. It creates various direct, indirect and induced effects in the economy including employment creation and income generation. Because of its tourism-friendly geo-social situation, there is high potentiality of tourism development in Nepal. The human resources in tourism sector are mostly absorbed in the formal establishment like hotels and restaurants, travel and trekking agencies, mountaineering agencies and so on. However, the travel and trekking sector also generates informal employments in a significant number.
2.5.1 Policy Analysis The government had initiated Tourism Master Plan in 1972, tourism infrastructural development program in 1990s with the financial support of ADB, tourism policy of 1995 as the first consolidated policy aimed at generating employment and income from tourism by diversifying it. Presently, the Government of Nepal has formulated Tourism Policy 2009, which was the major guiding principle for the tourism sector development. In 2009, the government announced tourism vision 2020 with twin goals of (i) increasing the tourist inflow to two million and (ii) employing one million people in the tourism sector by the end of 2020. The tourism policy of 2009 has also set the objectives of (i) establishing second international airport, (ii) developing regional airports and (iii) restructuring NAC in a Public-Private Partnership (PPP) model. The tourism sector development has always been prioritized by every periodic plan and policies. Nepal has a high potential in mountaineering, trekking, mountain flights, jungle safari and adventure tourism like rafting, bungee jumping, mountain biking and paragliding (sky sports), etc., which are popular among tourists. Tourism, no doubt, helps in terms of employment generation, infrastructure development, cultural preservation, environmental protection, foreign exchange earnings and expansion of other amenities like healthcare and education. At the same time, if not managed well, it might adversely impact local goods and services in favor of imported ones, can lead to environmental and cultural degradation, high costs for maintaining the tourism destinations, and could foster illegal economic activities like drug peddling and wildlife trade.
2.5.2 Trends of Tourist Flow According to Economic Survey 2013/14, the number of tourist arrivals declined by 0.7 percent to 797,759 persons in the year 2013. The average length of stay of tourists which had remained at 12.9 days in 2012 came down to 12.6 days in 2013. By the first eight months of the fiscal year 2013/14, income earned through the tourism sector stood at Rs. 30.43 billion, while per capita per day tourist expenditure stood at 34.5 US dollars. Contribution of tourism sector to GDP stood at around 2.0 percent, and providing direct employment to 178,000 persons (MoF, 2016). The employment creation capacity of tourism sector is directly proportional to the number of tourist inflow since it is widely believed that one day stay of one tourist creates nine person-days equivalent to direct and indirect employment. According to the report of World Travel and Tourism Council, in the year 2011, 292 thousand people were directly employed in tourism sector, whereas other 263 thousand were indirectly employed. Similarly, 170 thousand is the number employed in other sectors because of the induced effect of it. This report further projected that employment in tourism sector will grow by 4.1% annually. As a result, in the year 2021, 108,600 people will be employed in tourism sector which will be 6.8% share of total employments generated in the economy ( WTTC, 2011).
27 | P a g e
Chart 2.7: Trend of Inflow of Tourists
Source: Ministry of Culture, Tourism and Civil Aviation, Tourism Statistics 2014
As depicted in the Chart 2.7, the inflow of tourists is found directly influenced by the political stability of the country and results on increased tourism establishment and employment in tourism sector. When the political situation is adverse, the flow of tourist falls and when it is favorable it rises. The above chart shows, during the period between 1999 and 2006, the Maoist insurgency extremely affected the tourism sector and thus declined the tourist inflow. However, some improvement in political stability thereafter increased tourist flow (MoTCA, 2013).
As per the survey conducted by the Ministry of Culture, Tourism and Civil Aviation in 2014, the status of employment generated in the last five years is at moderate level. Out of the total surveyed establishments, 49.2% reported that the number of persons employed in their establishment has increased. The corresponding proportions of Star Hotel, Tourist Standard Hotel, Home Stay, Travel Agency, Rafting Agency, Trekking Agency were 37.8%, 47.9%, 35.7%, 40%, 84.6% and 62.5% respectively (MoCTCA, 2014).
According to a study report conducted by the Embassy of Switzerland to Nepal, there are about 61,000 small and medium-sized hotel professionals which are employing staff ranging between 150,000 and 300,000. It is further reported that big hotels like Hotel Sheraton are approaching to extend their services in Nepal. A single hotel of this kind generates around 1,000 new jobs (Pradhan et al., 2014)
Cross-Cutting Issues of Federalism The transformation of Nepalese political system from unitary system to federal system affects various sectors. The employment in public services will definitely be affected by this transformation process. Federal government will need parallel system of Executive, Legislative, and Judicial system which requires a sufficient number of employees to work in. But, the provincial set up of legislative and judicial system will hardly require technical workforce. Under the executive branch, there should be parallel public offices in all the seven provinces to provide technical services to the citizens. However, this requirement can be managed by adjusting the existing district and regional offices to some extent, whereas some new office set ups will definitely be required. So the additional requirement will not be required in the same proportion as there is at present. In this line of thinking, it is easily assumed that the proportion of requirement of technical staffs will be lower than the administrative and judiciary staffs. As per the information provided by the official of Public Service Commission, 20-30% more staffs will be required for the complete federal system. Based on the information of Public Service Commission, 20% more technical staffs can be assumed to be required to address the public service system. The tentative requirement is analyzed in Part Five.

28 | P a g e
PART THREE
ANALYSIS AND FINDINGS
3.1 Quantitative Analysis As mentioned in the methodology, this study comprises three types of analysis — quantitative analysis of primary data, qualitative analysis of the information obtained from focus group discussion (FGD) and key informant's interview as well as desk analysis of secondary data. This part of the report is about the general findings and interpretation of quantitative analysis from primary survey in the formal topics and qualitative in the later. As mentioned in the methodology, 1,344 employment units were surveyed, covering various economic, and occupational sectors as well as different ecological and development regions. The information about their business and employees as well as general demand and supply of skilled human resources was covered in the analysis. The coming paragraphs delineate the general findings of this survey.
3.1.1 Profile of Employment Units The informants of this survey were either the owner of the enterprises or responsible officers working for human resource management. The enterprises surveyed for this study range from micro level cottage and small industries to macro level big production houses. A set of semi-structured survey questionnaire was developed comprising various questions related to the number, qualification and training status of the employees, their performance level, skills gap, general demand and supply status of workforce and so on. The employment units surveyed were further categorized based on ecological and development regions.
3.1.2 Employment Units by Sampling Strata As the survey was conducted based on stratified random sampling process by stratifying the population (Employment Units) under the strata of Agriculture, Engineering Health and Hospitality which are the major program areas run by CTEVT. These four program areas cover more than 95 percent of the long term training and academic programs of CTEVT. Two hundred and forty seven sample employment units were surveyed from Agriculture sector, 398 employment units were from Health Sector, 384 employment units from Engineering Sector and 315 from Hospitality sector. The corresponding sample number deserves the share of 18.4, 29.6, 28.8 and 23.4 percentage respectively in the total sample size. The figures depicted in the Table 3.1 reflects the detail pictures of the disaggregation by four major sectors.
Table 3.1: Disaggregation by Subject of Study
SN Sector of Employment
Total Employment Unit
Percentage Remarks
1 Agriculture 247 18.4% 2 Engineering 384 28.6% 3 Health 398 29.6% 4 Hospitality 315 23.4% Total 1,344 100.0%
3.1.3 Employment Units by Economic Sectors The employment units are also categorized as per the major economic sectors; e.g. primary, secondary, and tertiary sectors. As the economic survey categorized agriculture, fishery and mining and querying under the primary sector, similar categorizations are also made as secondary and tertiary sectors. The same standard was also followed which was mentioned in Table 3.2. The
29 | P a g e
sample employment units comprise more than two-thirds (935 or 69.6%) share of enterprises from tertiary sector. A notable number of employment units (324 or 24.1%) were also represented from secondary sector, whereas the least number of employment units were represented from primary sector or agriculture-related sectors. The Table 3.2 below reflects the detailed picture in this regard.
Table 3.2: Disaggregation of Employment Units by Economic Sectors
SN Sector-wise Distribution
Number of Employment
Units
Percentage Total Employment
Average Employment
1 Primary Sector 85 6.3% 2,320 27.29 2 Secondary
Sector 324 24.1% 15,978 49.31
3 Tertiary Sector 935 69.6% 20,193 21.60 Total 1,344 100.0% 38,491 28.64
3.1.4 Employment Units by Sub-sectors Although the sample size was determined by the stratified sampling process based on the sectorial strata of Agriculture, Engineering, Health and Hospitality, this number was further divided purposively into different sub-sectors to make the representation wider and the samples were selected accordingly. This categorization of subsectors includes industries, cottage industries, contractor agencies, hospitals, polyclinics and pathologies, pharmacies, education and training institutes, hotel/restaurants, etc. The predetermined sample size was purposively distributed as per their total population as well as per unit employment creation capacity.
Table 3.3: Disaggregation by Employment Unit Sub-sector
SN Name of Employment Unit (Subsector)
Number of Employment
Unit
Percentage Remarks
1 Bank and Financial Institutions 22 1.6% 2 Industries 154 11.5% 3 Cottage Industries 292 21.7% 4 Contractor Agencies 104 7.7% 5 Hospitals 57 4.2% 6 Polyclinic/Pathologies 49 3.6% 7 Pharmacies 169 12.6% 8 INGOs/NGOs 101 7.5% 9 Education/Training Institutions 109 8.1% 10 Hotels/Resorts 193 14.4% 11 Travel/Trekking/Rafting
Agencies 94 7.0%
Total 1,344 100.0% As the sample size was distributed to various types of employment units. Of the total samples, cottage industries have the biggest share, whereas bank and financial institutes have the least shares with 21.7% and 1.6% respectively. Hotels and resorts occupied the second biggest size in the pie with 14.4% share of the total samples followed by industries (11.5%), pharmacies (12.6%), education and training institutes (8.1%), I/NGOs (7.5%) and so on. The Table 3.3 above reflects the disaggregated level of sample size as per the types of employment units with their corresponding shares in the total samples.

30 | P a g e
3.1.5 Employment Units by District At it is mentioned earlier in the methodology section, 25 districts were selected for the survey from ten analytical domains where each analytical domain comprises the districts with similar development level, social and geographical characteristics. All types of employment units were selected as a sample from each of the 25 districts. The majority of representation was from Kathmandu Valley (specially Kathmandu district) which occupies 22.7% of the total employment units. A notable number of employment units were also surveyed from Kaski and Rupandehi districts which occupy 9.6% and 9.2% volume of total representation respectively. The breakdown of all 25 districts is depicted in Table 3.4.
Table 3.4: Distribution of Sample as per the Districts
SN Name of Surveyed Districts Number of Employment Units Percentage 1 Sankhuwasabha 30 2.2% 2 Dolakha 29 2.2% 3 Sindhupalchok 30 2.2% 4 Mustang 9 0.7% 5 Bajhang 13 1.0% 6 Jumla 12 0.9% 7 Ilam 34 2.5% 8 Okhaldhunga 21 1.6% 9 Udayapur 21 1.6% 10 Kavrepalanckok 53 3.9% 11 Dhading 36 2.7% 12 Tanahun 21 1.6% 13 Kaski 129 9.6% 14 Palpa 70 5.2% 15 Dadeldhura 21 1.6% 16 Pyuthan 29 2.2% 17 Surkhet 45 3.3% 18 Morang 52 3.9% 19 Siraha 27 2.0% 20 Sarlahi 39 2.9% 21 Parsa 64 4.8% 22 Rupandehi 124 9.2% 23 Dang 81 6.0% 24 Kailali 49 3.6% 25 Kathmandu 305 22.7%
Total 1,344 100.0%
3.1.6 Distribution by Occupational Sub-sectors The employment units were also classified into different occupational sub-sectors as per the OSS/OP classification of NSTB. Since this classification is only based on the type of the employment units and not based on the individual occupation of workers, some nature of occupation in a particular employment unit may be different than the employment unit itself. As an example, industries also have health-related staffs for the primary treatment of their employees, hotels and restaurants may employ electrician and plumber for their internal maintenance. These occupational subsectors are Agriculture, Automobile, Computer, Construction, Construction Equipment and so on. Majority of the employment units (27.8%) are related to health occupations followed by hospitality industries (22.8%), construction (10.5%) and agriculture (9.2%) and so on.
31 | P a g e
Likewise, the employment sectors accumulated under other sectors occupied (9.1%) share as per the distribution. The details of the distribution are depicted in Table 3.5.
Table 3.5: Distribution by Occupational Sub-sector
SN Occupational Sub-sector Number of Employment Unit
Percentage Remarks
1 Agriculture 124 9.2% 2 Automobile 10 0.7% 3 Computer 50 3.7% 4 Construction 141 10.5% 5 Construction Equipment 19 1.4% 6 Electrical 5 0.4% 7 Electronics 46 3.4% 8 Forestry 2 0.1% 9 Handicraft 19 1.4%
10 Health 374 27.8% 11 Hospitality Industry 307 22.8% 12 Leather Goods and Products 4 0.3% 13 Mechanical 25 1.9% 14 Mountaineering 1 0.1% 15 Others 122 9.1% 16 Service 83 6.2% 17 Tailoring /Garments 8 0.6% 18 Textile 4 0.3%
Total 1,344 100.0%
3.1.7 Status of Employees and Employment Information about the total employees and details of the technical employees employed in each employment unit were also collected from the survey. In the total 1,344 surveyed employment units, 38,491 staffs were employed with an average of 28.64 employees per employment unit where the number of employees ranges from 1 to 1,000. The higher value of standard deviation (80.75) also suggests that the sample population was a heterogeneous group having more variability in terms of number of employees. Similarly, among the 1,344 employment units surveyed, technical staffs were only found employed in 1,248 employment units. The sum of the technical staffs in the 1,248 employment units is 19,099, who are employed at the rate of 5.81 technical staffs per occupation per employment unit where the range of employees is from 1 to 500 with a standard deviation of 20.54.
Table 3.6: Descriptive Statistics on Number of Employees
Type of Data N Minimum Maximum Sum Mean Std. Deviation Total Number of Staff
1,344 1 1,000 38,491 28.64 80.751
Valid N (list-wise) 1,344 Total Number of Technical Staffs
3,286 1 500 19,099 5.81 20.544
Valid N (list-wise) 3,286

32 | P a g e
The ratio between technical staff and total staff varies with sectors and sub-sectors. If this ratio is compared as per the sampling strata (program of study), it is found higher in Hospitality Sector, whereas this ratio is the least in Agriculture Sector. In the Hospitality Sector, 52.37% of the employed staffs are from technical background, whereas the corresponding figures of Agriculture, Engineering and Health Sectors are 41.67%, 50.54% and 51.26.% respectively.
Table 3.7: Ratio between Technical Staffs and Total Staffs by Subject Area
SN Sector of Employment
Total Number of Staffs
Technical Staffs Remarks Number Percentage of Total
Staffs 1 Agriculture 6,427 2,678 41.67 2 Engineering 14,361 7,258 50.54 3 Health 10,040 5,150 51.29 4 Hospitality 7,663 4,013 52.37 Total 38,491 19,099 49.62 The same comparison was also made as per the economic sectors. The proportion of technical staffs to total staffs is the highest in the Primary Sector and the lowest in the Secondary Sector. The percentage of technical staffs to total staff is 67.28% in primary sector, whereas the corresponding figures of Secondary and Tertiary Sectors are 47.20% and 64.57% respectively. The detailed figures are presented in the Table 3.8.
Table 3.8: Ratio Between Technical Staffs to Total Staffs by Economic Sector
SN Sector-wise Distribution
Total Number of Staffs
Number of Technical Staffs
Percentage of Technical Staffs to Total Staffs
1 Primary Sector 2,320 1,561 67.28 2 Secondary Sector 15,978 7,554 47.28 3 Tertiary Sector 20,193 9,984 49.44 Total 38,491 19,099 49.62 Likewise, comparison was also made between the technical staffs and total staffs as per the various employment units. In this classification, technical staffs are in highest proportion in Hotels and Resorts and lowest in Travel/Trekking and Rafting Agencies where corresponding figures are 61.59% and 24.48% respectively. Similarly, the other sectors where the proportion of technical staffs to total staffs is relatively higher are Education and Training Institutes, I/NGOs, Pharmacies, Polyclinics, Hospitals. The Table 3.9 reflects the subsector-wise proportion of technical staff to total staffs.
Table 3.9: Ratio of Technical Staffs to Total Staffs
SN Employment Unit Subsector Total Staffs Technical Staffs
Percentage
1 Bank and Financial Institutes 858 220 25.64 2 Industries 8,965 4,073 45.43 3 Cottage Industries 2,544 1,484 58.33 4 Contractor Agencies 6,784 3,290 48.50 5 Hospitals 6,583 3,189 48.44 6 Polyclinics/Pathologies 470 250 53.19
33 | P a g e
SN Employment Unit Subsector Total Staffs Technical Staffs
Percentage
7 Pharmacies 635 354 55.75 8 INGOs/NGOs 3,840 2,307 60.08 9 Education/Training Institutions 1,374 827 60.19 10 Hotels/Resorts 4,103 2,527 61.59 11 Travel/Treking/Rafting
Agencies 2,271 556 24.48
12 Agro-vet Centers 64 22 34.38 Total 38,491 19,099 49.62
3.1.8 Status of Business Respondents were also asked about their perceptions on their last five years' business trends, giving three alternatives: booming, status quo, and shrinking to choose one from. In aggregated figure, clear majority (53.2%) of the employment units had mentioned that their business has boomed during the last five years. Adversely, the performance of a notable share (46.8%) of employment units was found not satisfactory. Every 28 in 100 employment units were in status quo during the last five years, whereas almost 18% of employment units had seen the bad time of their business during the same period.
Table 3.10: Status of Business as per Sampling Strata
Employment Unit Sub-sectors
Status of Business in Last Five Years Total Booming Status Quo Shrinking
Sect
or o
f Em
ploy
men
t Agriculture 136 (64.2) 50(23.6) 26(12.3) 212(100) Engineer 161(54.4) 69(23.3) 66(22.3) 296(100) Health 199(56.5) 111(31.5) 42(11.9) 352(100) Hospitality 94(37.8) 91(36.5) 64(25.7) 249(100)
Total 590 (53.2) 321(28.9) 198(17.9) 1,109(100)
Note: The figures in parenthesis indicate the row percentage. If the corresponding proportion is compared among sectors and subsectors, it leads us to draw some interesting conclusion. The proportion of employment units which were booming during last five years' period was the highest (64.2.0%) in the Bank and Financial Sub-sector whereas the corresponding figure is found significantly lower (37.8%) in the Tourism Sub-sector. This finding is dovetailed with our economic situation where banks and financial institutions were expanded rapidly. Unlike the Banking and Financial Sub-sector, a significant depletion of the hospitality business was observed in the economy in those days. The table below depicts the cross tabulation between the status of business and types of employment units.
Table 3.11: Status of Business as per Employment Unit Classification
SN Types of Employment Units Status of Business in Last Five Years Total Booming Status Quo Shrinking
1
Empl
oym
ent U
nit Banks and Financial
Institutes 17 (100) 0 0 17 (100)
2 Industries 62(56.9) 28(25.7) 19(17.4) 109(100) 3 Cottage Industries 153 (59.5) 69(26.8) 35(13.6) 257(100) 4 Contractor Agencies 30(35.7) 17(20.2) 37(44) 84(100) 5 Hospitals 35(67.3) 9(17.3) 8(15.4) 52(100) 6 Polyclinics/Pathologies 18(42.9) 19(45.2) 5(11.9) 42(100)

34 | P a g e
SN Types of Employment Units Status of Business in Last Five Years Total Booming Status Quo Shrinking
7 Pharmacies 83(53.5) 54(34.8) 18(11.6) 155(100) 8 INGOs/NGOs 55(70.5) 17(21.8) 6(7.7) 78(100) 9 Education/Training
Institutions 56(64.4) 22(25.3) 9(10.3) 87(100)
10 Hotels/Resorts 65(41.7) 54(36.6) 37(23.7) 156(100) 11 Travel/Trekking/Rafting
Agencies 16(22.2) 32(44.4) 24(33.3) 72(100)
Total 590 (53.20) 321(28.94) 198 (17.85) 1,109 (100) Note: The figures in parenthesis indicate the row percentage. If the proportion of employment units that experienced booming status during the last five years is further compared to the sub-categories of employment units, more meaningful conclusion can be drawn. Business status of hotels/resorts sub-group is found comparatively higher than that of travel/trekking/rafting agencies. Only 22.2% of the travel/trekking/rafting agencies mentioned that their status has boomed in the last five years, whereas the corresponding figure of hotel and resort sub-group is 41.2%. In this categorical analysis, 100% of the banks and financial institutes, 70.5% of the I/NGOs, 64.4% of the education and training institutes and 59.5% of the cottage industries have mentioned sound business status in the last five years. This finding is more or less similar with the sectorial growth rate of economy, where every sub-sector has been witnessing the growth rate of below average in the last decade. The growth rate of agricultural sector mostly depends upon the seasonal rainfall, it is, therefore, not logical to analyze it associating with the HR need. On the contrary, employment need of rest of the economic sub-sectors depends upon economic environment of the country or economic growth rate. In conclusion, the lack of quality and quantity of technical HR must be one of the responsible factors behind such disappointing performance of these sub-sectors. If their status is again compared among the occupational sub-sectors, the percentage of responses mentioning the boomed status was highest (70.5%) in the I/NGOs sub-group, whereas the corresponding percentage was lowest in the tourism-related enterprises including travel, trekking and rafting agencies (22.2%) and hotels and resorts (41.7%).
Table 3.12: Business Status as per Employment Unit Occupational Sub-sectors Status of Business in Last Five Years Total
Booming Status Quo Shrinking
Occ
upat
iona
l Sub
sect
or
Agriculture 59 (62.8) 21 (22.3) 14 (14.9) 94 (100) Automobile 3(100) 0 0 3(100) Computer 22 (61.1) 9(25) 5(13.9) 36 (100) Construction 41(36.6) 27 (24.1) 44 (39.3) 112 (100) Construction Equipment
10(55.6) 2 (11.1) 6(33.3) 18(100)
Electrical 3(75) 1(25) 0 4(100) Electronics 26(63.4) 8 (19.5) 7(17.1) 41(100) Forestry 0 2(100) 0 2(100) Handicraft 10(71.4) 2(14.3) 2(14.30 14(100) Health 181(55.2) 107(32.6) 40(12.2) 328(100) Hospitality Industry 91(37.3) 91(37.3) 62(25.4) 244(100) Leather Goods and 3(75) 1(25) 0 4(100)
35 | P a g e
Occupational Sub-sectors Status of Business in Last Five Years Total Booming Status Quo Shrinking
Products Mechanical 9(75) 3(25) 0 12(100) Mountaineering 0 0 1(100) 1(100) Others 67(63.8) 28(26.7) 10(9.5) 105(100) Service 56(70) 17(21.20 7(8.8) 80(100) Tailoring /Garments 6(85.7) 1(14.3) 0 7(100) Textile 3(75) 1(25) 0 4(100)
Total 590(53.2) 321(28.9) 198(17.9) 1,109(100%))Note: The figures in parenthesis indicate the row percentage. 3.1.9 Responses on Future Growth Potentials Respondents were also asked about the future prospects of their business. In the response, comparatively larger proportion of respondents were found optimistic on the future of the business. Significantly large (61.7%) percentage of respondents has hoped that their business would be boomed in the future. However, some 31.3% didn't expect any remarkable improvement in their business. Although the figure is insignificant, some 7.4% of the employment units were also found completely pessimistic about their business in the future. (Please refer Table 3.13).
Table 3.13: Probable Future Status of Business SN Sector of Employment Possible Status of Business
within Next Five Years Total
Booming Status Quo Shrinking 1 Agriculture 158(64) 66(26.7) 23(9.3) 247(100) 2 Health 276(69.3) 106(26.6) 16 (4.0) 398(100) 3 Engineering 226(58.9) 129(33.6) 29(7.6) 384(100) 4 Hospitality 163(51.7) 120(38.1) 32(10.2) 315(100) Total 421(31.3) 100(7.4) 1,344(100)
Note: The figures in parenthesis indicate the row percentage.
The corresponding figure varies as per the sector of employment. In the disaggregated analysis, the employment units under health sector (69.3%) were found more optimistic about the future of their business; however, enterprises related to tourism are still in lower level (51.7%). In the engineering sub-sector, 58.9% of the employment units saw good future of their business, whereas the corresponding figures of agriculture and hospitality sectors are 64% and 51.7% respectively. The figures in the Table 3.13 show the detailed breakdown.
Table 3.14: Probable Status of Business as per Economic Sector
SN
Employment Sector Possible Status of Business in Next Five Years Total Booming Status Quo Shrinking
1
Econ
omic
Se
ctor
Primary Sector 52(61.2) 21(24.7) 12(14.1) 85 (100)
2 Secondary Sector 177(54.6) 120(37) 27(8.3) 324(100)
3 Tertiary Sector 594(63.5) 280(29.9) 61(6.5) 935(100)
Total 823(61.2) 421(31.3) 100(7.4) 1,344(100)
Note: The figures in parenthesis indicate the row percentage.
If the future expectancy in terms of the status of their business is compared as per the economic sector, it is found lowest in the secondary sector that is industries, and the tertiary sector stands at the highest level. 61.2% of the employment units of tertiary sector expected that their future status

36 | P a g e
will be boomed, whereas only 6.5% of them mentioned their disappointment in the future. Similarly, the corresponding figures of the respondents that expect continuation of present trend also in the future are 24.7%, 37%, and 29.9% in primary, secondary and tertiary sectors respectively.
Table 3.15: Probable Status of Business as per Sampling Strata
SN Employment Unit Subsector
Possible Status of Business in Next Five Years Total Booming Status Quo Shrinking
1
Empl
oym
ent U
nit S
ubse
ctor
Banks and Financial Institutes
15 (68.2) 7(31.8) 0 22(100)
2 Industries 75(48.7) 63(40.9) 16(10.4) 154(100) 3 Cottage Industries 194(66.4) 77(26.4) 21(7.20 292 (100) 4 Contractor Agencies 67(64.4) 28(26.9) 9(8.7) 104(100) 5 Hospitals 45(78.9) 12(21.1) 0 57(100) 6 Polyclinics/Pathologies 33(67.3) 11(22.4) 5(10.2) 49(100) 7 Pharmacies 117(69.2) 44(26) 8(7.4) 169(100) 8 INGOs/NGOs 64(63.4) 31(30.7) 6(5.9) 101(100) 9 Education/Training
Institutions 66(60.6) 38(34.9) 5(4.6) 109(100)
10 Hotels/Resorts 105(54.4) 68(35.2) 20(10.4) 193(100) 11 Travel/Trekking/Rafti
ng Agencies 42(44.7) 42(44.7) 10(10.6) 94(100)
Total 823(61.2) 421(31.3) 100(7.4) 1,344(100) Note: The figures in parenthesis indicate the row percentage.
Generally, the sectors which experienced and expected booming of the business suggested that they would require more numbers of human resources, whereas the opposite might be the case of the shrinking sector. The businesses which reported status quo in their business are neither hiring any more staff nor making their staff redundant. In an average situation, it can be concluded that higher the difference of proportion of the employment units which reported booming status to the proportion that reported shrinking status, greater the demand of staffs in the future. In this line of reasoning, 53.8% of the employment units are hiring more staffs in the future. (Conclusion in disaggregated terms can be made accordingly.) The answer of the respondents in the past status was also tried to be compared with the future status. Among the 590 (43.89%) of the employment units which mentioned booming status in the last five years, large majority 515 (87.3%) are found extra hopeful about the future, whereas some 9.5% are expecting the continuation of the past trends in the future as well. Similarly, 19 (3.2%) employment units out of 590 are pessimistic about the future despite their sound business status in the past. Out of the 198 employment units which experienced shrinking status in the last five years' business, 54% are also hopeful about their future. Employment units which experienced shrinking status in their business seemed optimistic about the future; however, the employment units which observed status quo in the past are expecting the continuation of the same trend in the future too. Table 3.16: Cross-tabulation between Past Status and Future Expectation
SN Observed Past Status Expectation about Future Total Booming Status Quo Shrinking
1 Booming 515(87.3) 56(9.5) 19(3.2) 590(100) 2 Status Quo 201(36.2) 329(59.2) 26(4.7) 556(100) 3 Shrinking 107(54) 36(18.2) 55(27.8) 198(188) Total 823(61.2) 421(31.3) 100(7.4) 1,344 (100)
Note: The figures in parenthesis indicate the row percentage.
37 | P a g e
3.1.10 Demand of Skilled Workers A company can be taken as a symbolic labour market where a large number of labours come to join the job and a remarkable number of them also exit from it. If a company hires more staffs than the number made redundant in the same period, it depicts the increasing demand of that particular occupation, whereas the decreasing demand may be the suggestion of opposite situation. In this line of thinking, in order to know about the most demanded occupations, a question was asked about the occupations and their respective employees who either entered or exited within the last 12 months from that particular employment unit. The production system is associated with the productivity which is the function of performance of labour and capital. Expansion of capital investment is not possible in the short run, so engaging more labours is the only way to expand the business in the short run. Thus labour is a crucial measure to expand the business or industries.
Table 3.17: Comparative Figures of Recruited and Redundant Staffs
SN Occupational Subsector
Recruited Number Number Made Redundant Employment
Unit Recruited Number
Employment Unit
Redundant Number
1 Agriculture 48 157 46 151 2 Automobile 9 16 9 20 3 Computer 18 32 15 25 4 Construction 26 77 22 55 5 Construction
Equipment 2 6 4 15
6 Electrical 1 1 1 1 7 Electronics 9 19 9 14 8 Handicraft 10 28 9 34 9 Health 132 370 103 214 10 Hospitality Industry 193 447 220 474 11 Leather Goods and
Products 1 2 1 2
12 Mechanical 16 34 15 40 13 Mountaineering 1 1 13 Others 37 200 36 166 14 Service 33 125 30 61 15 Tailoring /Garments 5 7 4 5
Total 540 1,521 525 1,278 The data of recruited staffs as well as the staffs made redundant from the job are, therefore, taken as the major signals for the demand of the workforce. Out of the 1,344 employment units, only 540 employment units reported that they have recruited some staffs during the last 12 months. Similarly, 525 employment units reported that they have made some staffs redundant from the jobs. If this figure is compared among the occupations, hospitality industry emerged as the highest staff-recruiting sector. During the analyzed period, 193 employment units under hospitality industry hired 447 new staffs, while 474 staffs were also made redundant from the jobs by 220 employment units. Similarly, 370 staffs were hired by 132 employment units in health sector, whereas only 214 employees were made redundant from the jobs by 103 employment units of the same sector. In this way, hospitality sector can be taken as a shrinking sector in the analyzed period, whereas health sector can be taken as a booming sector.

38 | P a g e
If we compare the figures of the hired staffs with the staffs made redundant, Agriculture, Computer, Construction, Electronics, Health, Service, Tailoring and the occupations under Others category have recruited more numbers of staffs than the numbers made redundant from the job. Unlike these, Automobile, Construction Equipment, Hospitality Industry and Mechanical sectors made more staffs redundant from the job than the numbers hired. Although Construction Equipment, Automobile and Mechanical occupations were considered as the demanded occupational sectors, the impact of the earthquake and fuel crisis in the last few months is the major responsible factor for getting adverse responses in this survey. If the same figure of redundant staffs is compared to recruited staffs among the occupations, Waiter/Waitress emerged as the job with highest recruitment. In the analyzed period, 138 waiters were recruited by 56 employment units, whereas 140 waiters were also made redundant from the job by 64 employment units. Staff Nurse ranked the second highest position in this comparison. 138 staff nurses were found recruited in 19 employment units, whereas 88 staff nurses were also made redundant from job from the equal number of employment units. The Table 3.18 gives the comparative figures of the recruited number and the redundant number as per the various occupational categories.
Table 3.18: Comparison between Redundant Number and Recruited Number
SN Name of Occupations
Recruited Number Redundant Number Employment
Units Employees Employment
Units Employees
1 Waiter 56 138 64 140 2 Staff Nurse 19 107 19 88 3 Administration 3 73 3 7 4 Labour 7 67 9 89 5 H.A. 14 63 6 8 6 Housekeeper 23 63 22 57 7 Cook 31 61 35 77 8 CMA 18 47 16 46 9 Mechanic 10 42 7 38 10 ANM 14 41 11 33 11 Field Tourist Guide 4 31 1 1 12 Beautician 19 29 15 20 13 Helper 17 28 17 27 14 B.P.H. 2 25 0 15 Production Operator 5 25 6 29 16 IT 1 25 0 17 Social Mobilizer 6 25 4 10 18 JTA 5 22 3 6 19 Receptionist 13 21 13 19 20 Technician 4 21 2 14 While comparing the same figures among other occupations, Housekeeper, CMA, General Mechanic, ANM, Beautician, Social Mobilizer, Receptionist, Technician, Pharmacist are some representative jobs, in which the recruited number was significantly greater than the number made redundant. On the contrary, Waiter, General Labour, Cook, Production Operator, Front Office are
39 | P a g e
those representative jobs which have greater number of redundant staffs than that recruited during the same period of time. The top twenty occupations as per the number of recruits and corresponding number made redundant are depicted in Table 3.18.
3.1.11 Perception Level on Supply Status of Workforce To know the experience of employment units regarding the availability or scarcity of skilled workforce in the labour market, a question was asked to them regarding the supply status of workforces that are direly needed in their employment units giving three alternatives to choose from - oversupplied, moderate supply and undersupply. Among the total 1,344 employment units surveyed, only 81.5% of the units responded to this question. A significant number of respondents (37.9%) expressed that there was oversupply of human resources as per the need of their enterprises. Unlike this, a notable number of employment units (26.9%) also expressed that the supply of the workforce was at the moderate level, whereas 16.7% respondents realized the undersupply status of workforce in the labour market. The table below reflects the total distribution of respondents.
Table 3.19: Respondents' Perception Regarding the Supply Status
SN Status of
Technicians Frequency Percentage Valid Percentage Cumulative Percentage
1 Over -supplied 510 37.9 37.9 37.9 2 Moderate Supply 361 26.9 26.9 64.8 3 Under-supplied 225 16.7 16.7 81.5 4 No Idea 248 18.5 18.5 100.0 Total 1,344 100.0 100.0
If this supply status is compared as per the occupational classification, only minority of the agriculture-related employment units (25.8%) reported that there is undersupply of technical human resources in their field, whereas the corresponding figure of health sector is (11.2%). As per the perception of owner of the employment units, occupational sectors such as Services, Construction and Construction Equipment and the employment units categorized as Others categories were the sub-sectors where shortage of skilled workforce was comparatively higher. Unlike the above mentioned occupational sub-sectors, Hospitality Industry, Handicraft and Mechanical are the sub-sectors where supply of skilled workforce is comparatively limited. The Table 3.20 depicts the detailed figures on the supply status of respondents as per the occupational category.
Table 3.20: Status on Availability of Skilled Workforce
SN
Occupational Categories
Status on Supply of Technical Human Resources Total Oversupplied Moderate Undersupplied No Idea
1 Agriculture 24(19.4) 38(30.6) 32(25.8) 30(24.2) 124(100) 2 Automobile 2(20) 0 1(10) 7(70) 10(100) 3 Computer 18(36) 9(18) 6(12) 17(34) 50(100) 4 Construction 53(37.6) 40(28.4) 18(12.8) 30(21.3) 141(100) 5 Construction
Equipment 7(36.8) 8(42.2) 3(15.8) 1(5.3) 19(100)
6 Electrical 1(20) 3(60) 0 1(20) 5(100) 7 Electronics 15(32.6) 19(41.3) 7(15.2) 5(10.9) 46(100) 8 Forestry 0 2(100) 0 0 2(1000 9 Handicraft 5(26.3) 6(31.6) 3(15.8) 5(26.3) 19(100) 10 Health 194(51.9) 92(24.6) 42(11.2) 46(12.3) 374(100)

40 | P a g e
SN
Occupational Categories
Status on Supply of Technical Human Resources Total Oversupplied Moderate Undersupplied No Idea
11 Hospitality Industry
104(33.9) 70(22.8) 59(19.2) 74(24.10)
307(100)
12 Leather Goods and Products
2(50) 0 2(50) 0 4(100)
13 Mechanical 2(8) 4(16) 6(24) 13(52) 25(100) 14 Mountaineering 0 1(100) 0 0 1(100) 15 Others 46(37.7) 36(29.5) 25(20.5) 15(12.3) 122(100) 16 Service 34(41) 25(30.1) 20(24.1) 4(4.8) 83(100) 17 Tailoring
/Garments 1(12.5) 6(75) 1(12.5) 0 8(100)
18 Textile 2(50) 2(50) 0 0 4(100) Total 510(37.9) 361(26.9) 225(16.6) 248(18.5) 1,344(100)
Note: The figures in parenthesis indicate the row percentage. If the supply status is compared as per the development region, large majority (71.7%) of employment units of Central Development Region mentioned that there is oversupply of technical human resources which was followed by Kathmandu Valley (46.2%). Similarly, the proportion of employments unit of Mid-western Development Region, Eastern Development Region and Western Development Region that mentioned the oversupply status are 28.1%, 31.1% and 18.7% respectively. It is pity to say that majority of the employment units of Far-western Development Region have expressed that they have not any idea regarding the issue.
Table 3.21: Supply Status of Technical HR
Development Region Supply Status of Technical HR Total Over -Supplied
Moderate Under-Supplied
No Idea
Dev
elop
men
t R
egio
n
EDR 52 (28.1) 85(45.9) 40(21.6) 8(4.3) 185 (100) CDR 180(71.7) 44(17.5) 23(9.2) 4(1.6) 251 (100) Kathmandu Valley
141(46.2) 82(26.9) 47(15.4) 35(11.5) 305 (100)
WDR 66(18.7) 62(17.6) 46(13) 179(50.7) 353 (100) MWDR 52(31.1) 53(31.7) 40(24) 22(13.2) 167(100) FWDR 19(22.9) 35(42.2) 29(34.9) 0 83 (100)
Total 510(37.9) 361 (26.9) 208(16.7) 248(18.5) 1,344 (100) Note: The figures in parenthesis indicate the row percentage. 3.1.12 Satisfaction Level of Workforce The respondents of the employment units were also asked about the satisfaction level of their employees. Since some of the employment units have a single employee or are family-run business, the question was not found applicable to all the employment units, as a result it was found applicable to only 1,098 employment units out of 1,344. While responding to this question, majority of the respondents (76.8%) mentioned that the performance level of their employees was satisfactory. Likewise, 17.8% expressed as good and 2.7% expressed as poor. The Table 3.22 gives the detailed distribution of the respondents.
41 | P a g e
Table 3.22: Perceptions on Satisfaction Level of Employees
SN Satisfaction Level
Frequency Valid Percentage Cumulative Percentage
1 Extremely Poor 2 0.2 0.2 2 Poor 30 2.7 2.9 3 Satisfactory 843 76.8 79.7 4 Good 195 17.8 97.4 5 Excellent 28 2.6 100.0 Total 1,098 100.0
3.1.13 Potential Innovation Respondents were also asked about the potentiality of innovation in their sector in the future. The small percentage of respondents answered this question. Among the respondents who answered this question, most of them mentioned the name of specific type of machines or online computer system in their business which were Digital machine, ECG and X-ray Machines, Laboratory Machine, Computerized Software, Painting Machine, RNP technology, etc. Their answer suggested that human resources they required must be aware of the new technology in their respective fields.
3.2 Qualitative Approach This chapter has been designed to illustrate the qualitative information collected from the selected organizations associated with different professions within the valley and selected districts. With the checklist, the identified respondents within the valley and in the selected districts throughout Nepal were contacted, discussed, interviewed and information and data were collected. The collected data were analyzed in tabular forms and have been attached in Annex 2A-7. Based on the data tabulated and presented, the findings of the study have been written.
3.2.1 National Demand of Workforce in Nepal Nursing sector as responded by the key informants is almost oversupplied. There is not a system to record the data of demand and employment opportunity of nursing workforce. No national projection has been made about how many workforces are required for future. Production and consumption of nursing graduates is being done on a random basis. The health sector other than nursing provides a different picture. There is the demand of health professionals by 35% in formal and 65% in informal sector in the local market, whereas they are demanded by 40% in formal and 60% in informal sectors in the national market. Hotel sector was one of the areas where the study tried to explore the demand of skilled workforces and potential employment opportunities. The key informants reported that hotel business was shrinking day by day and it is difficult to accommodate the existing employees in the sector. The sector is dominant with informal opportunities. Tour and travel sector is also covered by informal sector and demands differ from region to region because tourism activities do not take place in the same manner everywhere. Trekking business is another area considered by the study and the study found out that 90% activities and demand and employment opportunities fall in informal sector. There is no database system within information and telecommunication fields since most of the activities have been accomplished through contract awards. The respondents from trade unions, Federation of Contractors' Association of Nepal and Federation of Nepal Chamber of Commerce and Industry pointed out that there is hue and cry about the unemployment in the country but when time comes to hire skilled workers it is difficult to find such workers. There is mismatch between graduates of training programs and employment opportunities available in the labor markets. The mismatch between demand and supply could be due to absence of proper training needs assessments, untrained instructors, traditional supply-driven courses, traditional approach of training delivery, less opportunities for practical exposure and lack of proper system for career guidance and counseling.

42 | P a g e
There were other questions asked during the interviews to find out different information related to demand of skilled workforce and employment opportunities in local as well as national levels of both formal and informal sectors. The key informants responded that there was oversupply in nursing occupation, no national projection of the requirement of human resources, and the government sector is saturated. More opportunities are there in private sector but they have to work with nominal facilities. More people undergo nursing education and training for foreign employment. Health workers other than nursing graduates who have occupational license are found directly or indirectly employed except Community Medicine Assistant (CMA). CMAs are also saturated in terms of employment opportunities. Hotel business has also shrunk due to various reasons and has less than 5% employment opportunities for newcomers in the sector. In other sectors such as trekking, travel and tourism, agriculture, construction, there is demand of skilled workers but quality training should be the prerequisite. Most of the employment sectors are being hampered due to the attraction of youths to foreign employment. Agriculture and livestock are dominant sectors which demand huge number of skilled workers both in formal and informal set ups. Construction/Engineering sector has been growing satisfactorily in terms of building construction in the public and private sectors, private homes, real estate development, and government offices in the Kathmandu valley and other urban areas. The trend of the growth rate points out that construction is one of the prime sectors for Nepalese economy, at least for several years in future. Industry, being the biggest sector contributing to GDP has its normal growth. It has 7.1 percent contribution to GDP though it has a very slow growth rate due to load-shedding and many other reasons. There is no other option except developing this sector to shift the economic development from agriculture to industry. The demand of skilled workforce in the sector is in increasing trend. Agriculture is being the largest sector contributing to GDP and is the sector where mostly farmers who are less educated, trained and productive, engage in agricultural activities. This sector provides a greater number of employment but it needs further improvement and development to attract trained and educated people to adopt agriculture as a complete profession for better life.(See Annex 2A & 2B)
3.2.2 District-wise Responses Obtained through Checklist Interview The key informants of the selected organizations of the selected districts were interviewed applying the same checklist used in the Kathmandu Valley. The findings of the survey have been presented district-wise as follows: Dang District The key informants of various organizations as selected for sample were interviewed and the informants responded that there were high demands of skilled workforce both in the local and national labor markets. Skilled workers are not easily available and training opportunities are also limited in the district. More skilled workers are demanded in agriculture and construction sectors. Similarly, hotel business also demands skilled workers such as cook and waiter/ waitress. The demand of skilled workers will be increased by 5% to 100% in the next five years. Due to the attraction to foreign employment, it is difficult to find skilled workers. Skilled workers come in from adjoining districts and also from India. Informal sector demands and consumes more skilled workers than the formal sector. It is almost 70/30 in percentage in terms of informal/formal sector-wise opportunities. (See Annex 8: Table 8.1)
43 | P a g e
Sankhuwasabha District The respondents of Sankhuwasabha district responded that the demand of skilled workers is normal in the local market. More employment opportunities prevail in informal sector. 60% opportunities are there in informal sector, whereas only 40% opportunities can be observed in the formal sector. Skilled workers come from outside the district. Skilled workers cannot be found easily. The employment opportunities will be increased by 50% in the next five years. The new areas of demands are mason, carpenter, plumber, and electrician and the most demanded are the laborers. Responses differ from individual to individual informant. Overall, there is demand of skilled workers both in local and national markets (See Annex 8: Table 8.2). Kavrepalanchok District Kavrepalanchok district has no industries. Hotels and restaurants are popular there, but due to the national scenario, hotels and restaurants are being compelled to reduce their employees. The district has well progressed through NGOs/INGOs and CBOs. Such organizations are not getting proper skilled workers. Agriculture is another prominent area in the district where more skilled workers are in demand. Employees of health institutions come to the district from other districts. In an overall situation, there are less employment opportunities and less demands of skilled workers except in agricultural sector (See Annex 8: Table 8.3). Dolakha District There is high demand of skilled workers both in the local and national labor markets as the key informants of Dolakha district responded. NGOs and INGOs are functional in the district and such organizations consumed more skilled workers. Hotel restaurants are other areas where more skilled workers are demanded and employed. There are training institutions in the districts and the graduates produced by such institutions are employed in other districts as well. There are hydro projects in the district and many more skilled workers are demanded by such projects. There are no industries but if there will be stability in the country, there will be possibility of industrial development and demand of skilled workers in future (See Annex 8: Table 8.4) Sindhupalchok District The key informants of Sindhupalchok district were interviewed to identify the labor market situation of skilled human resources in terms of employment opportunities and demands of such workers. The respondents were not found very much optimistic since most part of district is remote and is badly hit by the devastating earthquake of 2072. Many people have left the district due to natural terror and also to hunt future fortune. Many NGOs and INGOs have been working in the district and they mostly consume the skilled workers. Future demand of skilled workers is also not exciting due to slow growth of industries in the district. There is demand of skilled workers in construction for reconstructing the infrastructures destroyed by the earthquake. Skilled workers are not found easily in the district. Therefore, the district as a whole was found with scarcity of skilled workforce, and thus has opportunity for human resource development (See Annex 8: Table 8.5). Siraha District The key informants of Siraha district responded that there were high demands of skilled workers both in local and national level labor markets. Brick, ply and agriculture industries consume more skilled workers. More people engage in informal sector and employment opportunities are also there in informal sector. No skilled workers are available in the district. Skilled workers come from the adjoining districts and also from India. Labors with skills are demanded by the local market because employers can get more benefit from such a worker as a labor and technician (See Annex 8: Table 8.6).

44 | P a g e
Sarlahi District The key informants of Sarlahi district pointed out that there were high demands of skilled workers in the district. Skilled workers are not available easily. Informal sector of the district is promising in terms of employment opportunities. Similarly, agriculture and construction are the prominent sectors for consuming the skilled workers. Industries are also growing, and they demand skilled workers. As a whole, the district demands skilled workers in various occupations (See Annex 8: Table 8.7). Morang District The key informants of the highly industrialized district, Morang, were found reluctant to hire additional workers. Industries are on the verge of collapse due to various reasons such as Terai strike and load-shedding. They said that the industrialists had difficulty in maintaining their existing employees. Therefore, there is no demand of skilled workers in the local market; however, others claimed that there were demands at the local market as well. Agricultural technicians are highly demanded. Skilled workers of such sectors are not easily available. Informal sector of the district has more employment opportunities and consumes more skilled workers. The employers hire trained workers from training institutions and also from open market. Workers of health and mechanical-related occupations were in high demand in the district. Similarly, metal fabricator, house wiring, plumbing and beauticians are of medium demand and skilled workers being involved in handicrafts are least demanded. Even in Morang, informal sector is stronger and offers more employment opportunities. Employment opportunities will be increased in the district by 20% in the next five years (See Annex 8: Table 8.8). Udayapur District The key informants in interview said that there were no demands of skilled workforce. The respondents have mixed opinions. 50% of them said that there were opportunities of skilled workforce in both local and national labor markets. Informal opportunities are stronger in the district as 40-80% employment opportunities are in the informal sector. Masons, carpenters, electricians, plumbers, lab assistants engineers, overseers, sub-overseers and technicians needed for agriculture and construction sectors were found in demand (See Annex 8: Table 8.9). Ilam District Ilam district is observed with many opportunities in terms of employment of skilled workers. Opinions are divided in terms of availability of skilled workers. There are 60% employment opportunities in formal and 40% in informal sectors. Engineers, agriculture technicians, cooks, waiters/waitresses, bellboys, and tea technicians are in demand. There are employment opportunities in the district if people are prepared/trained accordingly (See Annex 8: Table 8.10). Jumla District The key informants of Jumla were asked about the situation of skilled workers, employment opportunities and future trend of employment in the district. There is not much demand of workforce both in formal and informal sectors. Skilled workers are available. There is a nominal demand in informal sector. Herbal processing has the future scope in Jumla district (See Annex 8: Table 8.11). Parsa District The key informants of Parsa district were asked about the situation of skilled workforce. The informants responded that there were high demands of skilled workforce in the district both in the local and national labor markets. After provincial set up, a huge number of skilled workers will be demanded in both formal and informal sectors. By the next five years, there will be 50% demand of
45 | P a g e
skilled workers in the district. The employers hire their employees through advertisement. They responded that they found their employees with quality training. Doctors, pharmacists, nurses, engineers, computer operators, paper bag makers are some of the professions which are in demand in the district (See Annex 8: Table 8.12). Surkhet District The key informants of Surkhet district were interviewed about the situation of workforce, employment opportunities and future employment trend. The informants responded differently. Skilled workers with latest skills of technology are in demand. Agriculture, herbal processing, tourism demand more skilled workers. Informal sector has more employment opportunities. By the next five years, employment opportunities will be increased by up to 200% in the district. Workers come to the district from adjoining districts and even from India. Cement industry, Upper Karnali Hydropower Project and hotels, restaurants will demand more skilled workers in the future (See Annex 8: Table 8.13). Palpa District The key informants of Palpa district representing various institutions were asked about the situation of skilled workers in the local and national markets of formal and informal sectors. For coffee production there are sufficient workers and even no scope of future demands. Agriculture technicians are in demand for vegetable productions. Skilled workers are needed for tunnel and greenhouse construction. Although there is no market for ginger production, there are high demands of workers for cottage industries. There is higher rate of turnover of the skilled workers in the district. Construction sector needs more skilled workers, but it is very difficult to find properly trained people (See Annex 8: Table 8.14). Rupandehi District The selected informants of Rupandehi district were asked about the situation of skilled workers of local and national markets in both formal and informal sectors. NGOs of the district need skilled workers. Skilled workers are not easily found due to attraction to foreign employment. No agencies are there to connect workers to employment. More Indian workers are working in the district. Over 70% employment opportunities are in informal sector. Workers are oversupplied in hotel and restaurant businesses. CTEVT-trained graduates are there in the market and they are of quality competence but they need more practical exposure. The occupations in demand are management, tailoring, veterinary, proposal/report writing, NGO management, cooperative, sanitation and pump operator (See Annex 8: Table 8.15). Kailali District The selected informants of Kailali district were asked about the situation of skilled workers of local and national markets in formal and informal sectors. NGOs of the district need skilled workers. Skilled Workers are not easily found due to attraction to foreign employment. More Indian workers are working in the district. Over 70% employment opportunities are in the informal sector. Workers are oversupplied in the demanded professions. CTEVT-trained graduates are there in the market and they are of quality competence but they need more practical exposure. (See Annex 8: Table 8.16). Pyuthan District The key informants of Pyuthan district were asked about the situation of skilled workers, employment opportunities and future trend of employment in the district. There is not much demand of workforce both in formal and informal sectors. Skilled workers are available. Agriculture and vegetable production have future scope in the district.

46 | P a g e
3.2.3 Employment Opportunities in Formal and Informal Sectors There is 5-10% opportunity for nursing graduates in the formal sector and more opportunities in the informal sector. 70% opportunities are available in the formal sector for health professionals, whereas 30% prevail in informal sector. Hotel business consumes 95% workforce in formal setup and only 5% in the informal businesses. Similarly, tour and travel offers 70% opportunities in formal and 30% in informal sectors. Likewise, trekking sector provides 70% employment opportunities in the informal sector just opposite to travel and tourism areas. Telecom and electricity sectors offer 80% opportunities for informal employment. Similarly, trade unions and other key informants of different agencies said that informal sector offered more employment opportunities and demanded skilled workforces in the country. Middle level skilled workers and professionals are acutely shortage in agriculture which is the biggest sector of employment in Nepal. (See Annex 2C)
3.2.4 Speculation for Future Demand The key respondents from the Kathmandu valley responded about the growth trend of the demand of skilled workers for the next five years. The responses of the informants varied from one individual to another. There is no projection for nursing workforce, whereas health-related skilled workers will be demanded by 10% in the formal sector and 5% in the informal sector. Hotel business will demand 30% and 10% in formal and informal sectors respectively in the next five years in a condition if the proposed star hotels will come in operation. Similarly, tour and travel agencies will demand skilled workers by 15% in formal and 5% in informal employment during the next five years. Likewise, trekking business will demand skilled workers by 15% and 30% in formal and informal employments respectively. Telecommunication and electricity sectors also need skilled workers but they cannot speculate any number since most of the activities are accomplished through outsourcing consulting and contracting vendors. Trade Unions and other professional organizations responded that formal sector would demand skilled workers from 5% to 50% and informal sector will demand skilled workers in the same percentage. Similarly, there is already a shortage of skilled middle level technicians and more than 1,500 vacant posts were found in formal sector of agriculture. 20-30% employment will be created in agriculture by the next five years. Similarly, construction business has big contribution to national GDP which will demand 30-40% additional skilled workforce by the next five years. If the situation remains stable, industry and commerce will demand 50% skilled workforce in the next five years. There are other sectors such as small hotel business, cottage industries and a complete informal sector which demand separate but comprehensive studies. (See Annex 6). Availability of Skilled Workforce: The key informants of 14 organizations from the Kathmandu valley were asked whether the skilled workers were easily available. The informants had different opinions. Nursing and hotel business sectors are oversupplied by skilled workers and it was difficult to accommodate the workers who have been working for years. Tour and travel and trekking agencies said that they did not find the workers easily whenever they needed. Their businesses depend on seasons and there is no system to hire skilled workers. Nepal Telecom and Nepal Electricity Authority have different situation. They outsource the vendors for the accomplishment of their projects. Therefore, the vendors should have such information whether they find skilled workers or not (a separate study reaching to such vendors needed). Trade Unions and other professional organizations responded that the skilled workers were not easily available. Construction sector has huge demand of skilled workers. Similarly, skill upgrading courses of electrical technicians are in demand. Lower level skilled workers are easily available but the study pointed out that there were 1,500 vacant posts for JT/ JTA in the Ministry of Agriculture and the government recently declared that Agriculture Technicians would be deputed even in ward level which would demand high number of such technicians in future. Similarly, there are 60 vacant posts of technicians in NARC. Likewise, construction sector within Engineering has huge potentialities
47 | P a g e
and skilled workforce such as Mason, Carpenter, Plumber, Electrician, Tile/Marble Fitter, Plasterer, Painter, Gabon-wire Maker, Scaffolder, Aluminum, Welder, Bar Bender, etc. are in demand. This subsector is also not free from problems. Employment opportunities have been created for the dry season which is also supportive to underemployment situation in the country. (See Annex A: Table 4). The key informants of the Kathmandu valley were asked about the skilled workers they hired produced by the universities or institutions. They responded that the institutions were as: Council for Technical Education and Vocational Training (CTEVT), Institution of Medicine, B.P. Koirala Institute of Health Science, Karnali Health Academy, National Academy for Hotel and Tourism Management, Labor Training Centre, Department of Cottage and Small Industries, Cottage and Small Industry Board, public and private institutions affiliated to CTEVT and also from foreign universities (See Annex 5).
3.2.5 Demanding and Emerging Occupations The key informants of the Kathmandu valley were asked about the occupations in demand and emerging occupations and the projected number of skilled workers they need to hire in their organizations. None of the respondents could answer the projected number of skilled workers since there is not a system to plan and project the workers in any organization of Nepal. The informants responded that the occupations in demand and even emerging demand areas are as follows:
• Nursing profession: B.Sc./BN Nurse, M.Sc./MN Nurse • Health profession: Radiographer, Ophthalmic Assistant, Dental Hygienist, Acupressure,
Aayurveda, Lab, Pharmacy, etc. \ • Hotel Business: Waiter/Waitress, Housekeeping, Cook, Assistant Manager, Manager, Chef,
Front Desk, Supervisor, Bellboy, etc. • Tour and travel business: Ticketing, Marketing, Tour Operator, Tour Guides • Trekking Business: Porter, Porter Guide, Trekking Guide, Mountaineering Guide • Telecom Profession: Fiber/Optical Cable Installation, GSM Installation, Air-conditioning
and Generator Maintenance, IT Technicians, Repair and Maintenance Technician • Electrical Profession: Ladder Carrier, General Electrician, Building Electrician, Industrial
Electrician, Installation, Connection, Repair and Maintenance Technician, Skill Upgrading Courses
• Other Occupations: Mason, Carpenter, Scaffolder, Electrician, Plasterer, Tile/Marble Fitter, Painter, Plumber, Tailor, Beautician, Embroidery, Handicrafts, Security Guards, Sales Boys/Girls, Aluminum Fitter, Heavy Equipment Driver, Workers Related to Forestry, Manufacturing Industries, Processing Industries, Fertilizer Industry, Herbal Processing, and Arts and Crafts (See Annex 6).
3.2.6 Quality of Skilled Workers or Skill Gap The key informants of the Kathmandu valley were asked about the training quality of graduates when they recruit them as skilled workers. Most of the informants responded that the graduates were of quality skills, however, more practical exposure during training should be provided. The elective subjects should be added to the curriculum so that the graduates would have wider opportunities of employment. 10% of respondents said that the quality is missing due to the negligence of training institutions. 15% of them said, the trained are not getting employment but the untrained are occupying the positions due to the lack of proper system. On the one hand, many youths are flying overseas for employment; on the other hand, there are no workers available in the labor market. There is a kind of mismatch between employment requirement and skills acquired by the trained graduates. No informant was in a position to point out the skills gap in their employees except Nepal Electricity Authority which demanded skill upgrading training for their working

48 | P a g e
officials. Although respondents were not in a position to point out the skill gaps, 90% of them responded that the trained graduates needed more skills and knowledge to perform their responsibility in the job placement. They have suggested that the duration of training should be from six months to less than one year in the following occupations: (See Annex 7) • Herbal Processor • Automobile Technician • Welder • Construction Supervisor • Community Livestock Worker • Community Agriculture Worker • Seed Producer • Web Designer • Small Hotel Manager
• Travel/Tour Guide • Advanced Tailor • Industrial Electrician • Micro-Hydro Technician • Organic Crop Farmer • Medical Equipment Repair/Maintenance
Technician • Ref. and AC Technician • Social Mobilizer • Physiotherapist
3.3 Interaction Program among Stakeholders An interaction program was organized on April 5, 2016 at Alpha House, New Baneshwor, which was participated by various representatives from development-related ministries, professional councils, associations, federations and freelance researchers from TVET Subsector to discuss the draft report (The list of participants is attached in Annex 12). The vice-chairperson of CTEVT, Dr. Kul Bahadur Basnet had chaired the program. Appropriate feedbacks obtained during the floor discussion were considered during the refinement and finalization of draft report. The participants were also brainstormed for half an hour in to four groups and discussed upon the emerging and demanding occupation they are related with. Perceptions of the respondents in the feedback session as well as output of the group work are synopsized hereafter under four different topics — Agriculture, Engineering, Health and Hospitality.
3.3.1 Agriculture Majority of the participants participated in the group work and they mentioned that middle level agriculture-related technicians are in demand not only in formal private sector but also in public sector because of the additional post of Agriculture and Livestock technician created in service center at VDC level. Besides, herbal processing, floriculture, fruit preservation, organic farming, etc. are growing areas where specific technicians seem to be demanded mainly in informal sector. The following are the agriculture-related emerging areas and occupations pointed out during group work.
1. Livestock technicians 2. Floriculture business skills
3. Organic manure production skills 4. High value crops (tea, mushroom)
5. Herbal processing skills 6. Natural fiber processing skills
7. Off-season vegetables production 8. Fruit processing and preservation
3.3.2 Engineering Almost 6,600 trained micro-hydro operators are presently in demand based on the need of 2 micro-hydro operators for each of almost 3,300 micro-hydro stations. Presently, untrained staffs are taking the responsibility of operating such business. Similarly, occupations such as Micro-hydro Installer (Civil), Micro-hydro Installer (Electro-mechanic) are also in significant demand. ITC sector is an
49 | P a g e
emerging sector and thousands of related technicians can be absorbed in this sector. Similarly, the film production industry is also an emerging industry which can employ technicians such as lights men, set designer, makeup artist, fire master, costume designer, photographer and so on. Construction supervisor is the major demanding occupation in the construction sector. Plumber, heavy equipment operators are also demanded in significant number in construction sector. In the ITC sector, the following areas and occupations are in demand.
1. Web designer, Coding, Graphics 2. Mobile Apps Developers (Android Apps) 3. Animation/ Graphics 4. Network , Hardware Technicians 5. Customer Support Technicians (in call center) 6. GIS Mapping
3.3.3 Health X-rays and radiography are the emerging occupations in health sector. Similarly, Some new and technological innovation in health sector should be updated and the required manpower should be prepared accordingly. The following are the major occupational areas in health sector.
Table 3.23: Demanding and Emerging Occupations in Health Sector
SN Occupational Area Potential Employment Areas
1 Laboratory Personnel Research Institutes, Genetics, Hospitals, Clinics, Camps, Clubs
2 Radiological Personnel Hospital, Clinics, Nursing homes, Manpower Company,
3 Nursing Hospitals, School, Industry, Midwifery Center (VDC)
4 General Health Hospitals, School, Industry, Midwifery Center (VDC)
5 Public Health School, Industry, Midwifery Center (VDC)
6 Dental Health School, Industry, Midwifery Center (VDC)
7 Physiotherapy School, Industry, Midwifery Center (VDC)
8 Transfusion Personnel School, Industry, Midwifery Center (VDC)
9 Ophthalmic Personnel School, Industry, Midwifery Center (VDC)
10 Pharmacists Pharmacies, Dispensaries Source: Group Work on Interaction Program
3.3.4 Hospitality Sector In hospitality sector, almost 61,000 non-star hotels are presently running with an average of 5 technical staffs out of which 95% are untrained. In this way, almost 250,000 to 300,000 trained human resources are required in these hotels. However, the official record does not have all this information. There are various emerging occupations associated with hospitality sectors. The table below depicts major highly demanded occupations in hospitality sector and their respective figures.
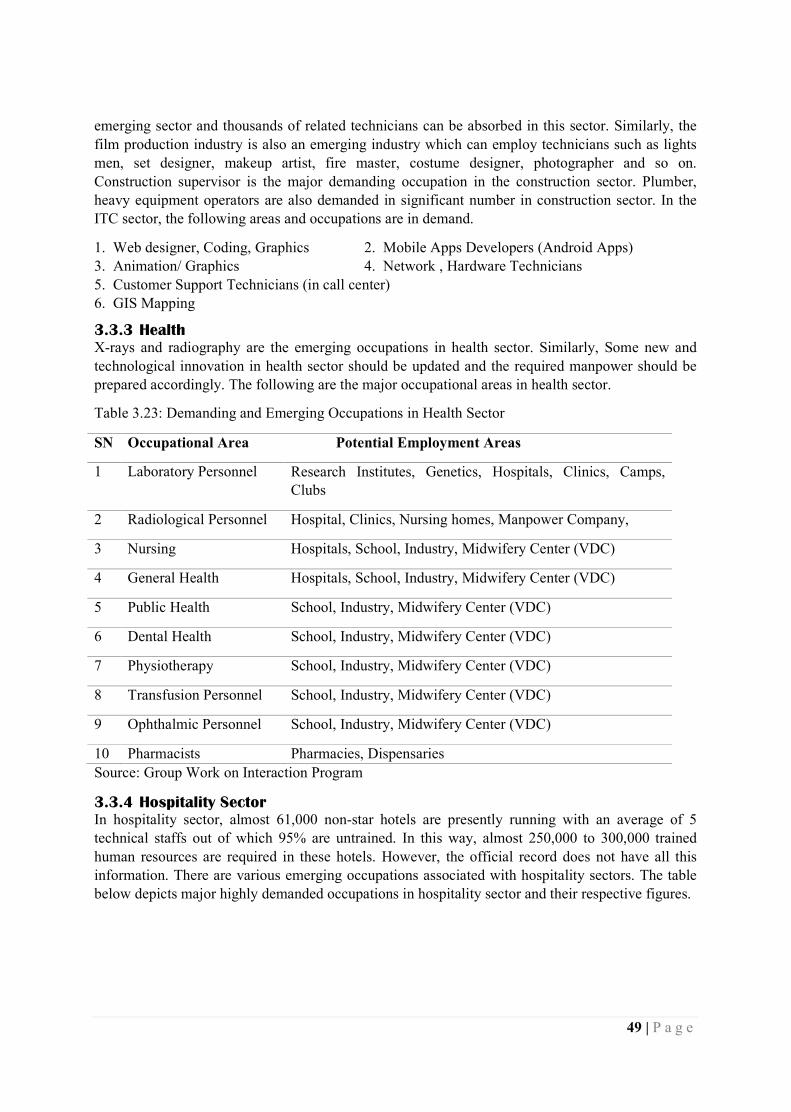

50 | P a g e
Table 3.24: Demanding and Emerging Occupations in Hospitality Sector
SN Occupations Shortage (%)
Specific Qualification
Estimation for the Next Five Years
1 Cook (Continental) 80% L-II 200,000
2 Cook (Indian) 50% L-II 200,000
3 Cook (Chinese) 75% L-II 200,000
4 Hotel Management 50% DHM 50,000
5 Waiter 80% L-I&II 120,000
6 Housekeeper 80% L-I 120,000
7 Hotel Representative 20% SLC+ Training 60,000
8 Tour Guide 90% SLC+ Training 1,000
Source: Group Work on Interaction Program
51 | P a g e
PART FOUR
ESTIMATION AND SPECULATION OF DEMAND
4.1 Introduction This part of the report is about estimation or speculation of the workforce based on the analysis of primary data collected under qualitative approach, primary data collected under quantitative approach and desk review of public policy and econometric trends. The main basis of estimations made in this report are the existing technical HR engaged in the sample employment units, sampling weightage, number of total population, economic activity of sample employment unit, entry and exit of workforce in the labour market (particularly in the sample employment unit), supply status of technical human resources. Because of unavailability of time series data and absence of appropriate LMIS system, econometric projection is difficult to carry out. This is only the anticipation of demand based on the information mentioned earlier.
4.2 Basis of Speculation or Estimation Major research question of this study is to list out the emerging and demanded occupations in the technical areas and speculate their future needs in more specific approach. Although the former part of the question was almost straightforwardly answered by the this survey, some assumptions were made and some guidelines were developed to answer the latter part of the question. This survey, which only covers the formal private sector does not give information about government sector and informal sector. As depicted in the box below, the demand of labour market is the sum of the demands of private formal sector, public sector and informal sector. Obviously, the absorption capacity of the formal sector is the multiplication of total employed number in the sample employment units and sampling weightage; however, the sample employment units in some of the strata are too low to statistically represent the whole population. As per the key informants' interview and experience of enumerator, research team has reached on the conclusion that the calculation is misleading if the same approach is applied in case of cottage industries, D-level contractor's agencies and NGOs. The registered number of employment units in these categories were either found closed or inactive while tracing those employment units during primary data collection17. The key informants also reported the same situation regarding this
17 While considering the population, the information was based on the affiliation record of Social Welfare Council and sampling was conducted accordingly. While tracing the sample for survey, only about 20% were found in the mentioned address. The corresponding status of D-level contractors' agencies is also the same. The case of cottage industries, pharmacies and C-level contractors' agencies is slightly better, almost 50% were found in the mentioned address.
Total National Demand Demand of Public Sector + Demand of Formal Private Sector + Demand of Informal Sector Demand of Public Sector Demand of Government Organization + Demand of Semi- governmental Organizations Demand of Formal Sector Demand of Surveyed Employment Unit * Sampling Weightage *Business Activity of Particular Type of Employment Unit Demand of Informal Sector Fully Based on Qualitative Information

52 | P a g e
matter. Similarly, the respondents' perceptions regarding the supply status of technical HR in respective fields, the number of staffs recruited annually and its share with the total staffs, and comparison between entry and exit numbers are also considered as the basis for analysis. Table 4.1: Major Basis for Projection SN Name of Employment Unit
(Subsector) Population Number of
Employment Unit Sampling Weight
1 Bank and Financial 272 22 12.36 2 Industries 5,274 154 34.25 3 Cottage Industries 207,172 292 709.49 4 Contractor Agencies 16,655 104 160.14 5 Hospitals 508 57 8.91 6 Polyclinics/Pathologies 500 49 10.20 7 Pharmacies 6,000 169 35.50 8 INGOs/NGOs 30,284 101 299.84 9 Education/Training Institutions 971 109 8.91 10 Hotels/Resorts 499 193 2.59 11 Travel/Trekking/Rafting Agencies 4,488 94 47.74 Total 272,623 1,344 202.84 Employment opportunities in formal private sector are speculated based on the survey data, whereas the same of the governmental and semi-governmental organizations was analyzed based on the desk study and qualitative information (i.e. FGD, KII and Policy Analysis). The speculation was made separately for the four sectors: Agriculture, Engineering, Health and Hospitality which is depicted hereafter in details.
4.3 Agriculture Likewise in other sector, the formal private employment is limited within registered private enterprises including banks and other financial institutions, different types of agro-industries and agriculture related cottage industries like tea industries, agro-processing industries, dairy industries, poultry firms, herbal processing industries, large agricultural firms, I/NGOs, technical training institutions and so on. Some governmental and semi-governmental organizations like Department of Agriculture, Department of livestock, NARC, CTEVT and its training institutions also offer significant number of employment opportunities to graduates of agriculture trade. Similarly, significant number of graduates can also get employment opportunities in informal sector as self-employed or as a freelancer.
4.3.1 Employment in Private Formal Sector As mentioned earlier, the demand of formal sector is speculated based on the findings of the survey of employment units. The total population of agriculture strata is calculated as 28,250, based on the registration or membership record of various sources as explained in the methodology. The population, sample and sampling weightage depicted in Table 4.1 are the major basis of estimation for the employment opportunities in formal sector. On the basis of sampling weightages, the number of total employees and annual recruitment in the existing enterprises as well as yearly demand for the newly established enterprises are depicted in the Table 4.2. These figures are estimated based on the total number of employees and recruited number of employees in previous year asked and analyzed in the survey. The figures in the fifth
53 | P a g e
column which reflect the probable number of employees required in the newly established enterprises were estimated based on the annual trend of industry registration and per industry employment of technical staffs. As per this analysis, Junior Technical Assistant (Agriculture), Junior Technical Assistant (Veterinary), Gardener, Poultry Worker, Fiber Processer, Seed Technician have emerged as top demanded occupations. In total, 341,590 technical workforces are found engaged in agricultural sector, including skilled workers to higher level technicians. Table 4.2: Projected Employment of Major Occupations SN Name of Occupation Projected Demand in Formal Establishments
Currently Working
Annual Increment
Opportunity in New Enterprises
Total Annual Demand
1 Junior Technical Assistant
10,000 2,000 300 2,300
2 Gardener 7,000 1,000 200 1,200 3 Poultry Worker 6,000 2,000 150 2,150 4 Fiber Processer 4,000 1,000 100 1,100 5 Livestock Technician 2,000 1,000 50 1,050 6 Butcher 2,000 1,700 50 1,750 7 Veterinary JTA 1,500 1,500 40 1,540 8 Seed Technician 1,400 1,200 40 1,240 9 Fish Feeding Technician 1,000 700 30 730
10 Beekeeper 1,000 200 30 230 11 Hatchery Technician 700 150 20 170 12 Senior Agriculture
Technician 500 150 10 160
13 Agriculture Instructor 500 150 10 160 14 Agriculture Supervisor 500 150 10 160 15 Agriculture Assistant
Teacher 150 150 10 160
4.3.2 Demand in Government Sector As per the data of Public Service Commission, out of the total 112,295 staffs of civil service, 5,301 are presently working under Agriculture Group. Out of the 5,301 posts of agriculture service, 398 are presently vacant, which is only 7.5% of the total posts. This small number suggests that public service job opportunities for agriculture graduates are almost saturated since the small size of vacancies may be due to discontinuity in recruitment process. This is the indication of excess supply of agriculture-related workforce in comparison to other types of human resources in the current set up of public service. However, the government policy may affect the future demand. As analyzed in Part II, almost 3,000 Senior/Junior Technical Assistants (TSLC & Diploma) are immediately required for agriculture service and 4,000 are required in the long term. Similarly, according to the information received from Public Service Commission, 1,000 (15-20%) more staff from agriculture background seems to be required to address the requirement of federal set up (PSC, 2072).
4.3.3 Employment in Informal Sector As per the Living Standard Survey 2011, 64.1% of the working age population is engaged in Agriculture sector; and out of them, 2.8% are engaged in wage employment and 61.3% are engaged

54 | P a g e
in self-employment (CBS, 2011). Those engaged in self-employment in agriculture are almost considered as informally employed and the majority of them are unskilled workers. Likewise, the proportion which represents wage employed is also more or less unskilled in nature. Thus the skilled workforce employed informally in agriculture sector is too low to project the future demand; however, the opportunity for such type of workforce is enormous alongside the marketing of agriculture.
4.4 Engineering The engineering sector which is the major sector related with the infrastructure development has broader capacity for creating employment within the country. The infrastructure development activities in the country such as road and bridge construction, commercial as well as residential housing, mega projects of electrification and construction, adoption of computerized system in personal and official activities, the mechanization of human activities are the primary determinants that provide some signals for the expansion of this sector and hence, reflect the idea for HR requirements. The engineering sector is the broader sector that provides job opportunities in all private formal establishments, public sector and informal sector, which are explained hereunder in details.
4.4.1 Employment in Private Formal Sector As mentioned in the methodology, the following private registered organizations are surveyed. These agencies include contractor agencies registered in DDC and Ministry of Physical Planning, engineering consultancies, schools and institutions, manufacturing establishments and others. The total registered agencies in these categories which was calculated as 22,986 was considered as the total population and information was collected from statistically representative sample size.
• Private educational institutes delivering engineering programs • Contractors' associations/agencies and housing agencies • Cottage industries in engineering sector including various service industries (Consulting
firms, engineering workshops, furniture industries, etc.) • Industries under the specified categories • INGOs/NGOs
As per the above mentioned guidelines and assumptions, the demanded occupations and their respective annual demand under formal private sector is depicted in Table 4.3. By this approach, Production Skilled Labour, Mason, Carpenter, Electrician, Weaver, Plumber are identified as the top demanded occupations in the formal private sector. Table 4.3: Top Demanded Occupations in Formal Private Sector
SN Name of Occupation Projected Demand in Formal Establishments
Currently Working
Annual Increment
Opportunity in New Enterprises
Total Demand
1 Production Skilled Labour 120,000 5,000 6,000 11,000 2 Mason 80,000 500 4,300 4,700 3 Carpenter 80,000 2,500 4,100 6,600 4 Weaver 70,000 700 3,800 4,500 5 Electrician 45,000 700 2,400 3,100 6 Driver 36,000 600 1,900 2,500 7 Plumber 34,000 100 1,800 1,900 8 Mechanic 30,000 3,600 1,600 5,200 9 Machine Operator 21,000 300 1,100 1,400
55 | P a g e
SN Name of Occupation Projected Demand in Formal Establishments
Currently Working
Annual Increment
Opportunity in New Enterprises
Total Demand
10 Supervisor 18,000 800 1,000 1,800 11 Brick Molding 17,000 700 900 1,600 12 Miller 16,000 2,500 850 3,350 13 Overseer 15,000 700 800 1,500 14 Mobile Phone Repairer 14,000 2,500 700 3,200 15 Computer Operator 11,000 1,000 600 1,600 16 Production Operator 11,000 350 600 950 17 Metal Sculpture 10,000 3,500 500 4,000 18 Welder 10,000 1,700 500 2,200 19 Woodcarving 7,000 800 400 1,200
4.4.2 Demand in Government Sector As per the data of Public Service Commission, out of 112,295 total staffs of public service, 11,836 are presently working under Engineering Service, out of which 3,957 are presently vacant which is 33.4% of the total posts. This is a significant number. Although some posts are vacant due to the longer process of official recruitment system, there are other factors responsible for this, such as new provision of inclusive recruitment system, unavailability of related technicians in the market and unwillingness of technicians to work in the remote part of the country. This is an indication of shortage of engineering technicians under specialized field where no applicants are available to apply for the jobs. These specialized fields of engineering posts are Textile Engineering, Land Surveyor, Offset Press Man, Senior Mason and so on. As mentioned in Part II, the April earthquake of 2015 has completely damaged the human settlements equivalent to NRs. 408,625 billion and public infrastructure equivalent to NRs. 65,783 billion (NPC 2015). This indicates for the employment opportunities in various occupations in Engineering Sector. This disaster possibly brings the paradigm shift in the demand trend of construction from general structure to earthquake resilient structure.
4.4.3 Demand in Informal Sector To analyze the demand of engineering-related occupations, the analysis of three major sectors is essential, which are Manufacturing and Recycling, Electricity, Gas and Water, and Construction sector. In the manufacturing sector, 93.3% employment opportunities are in informal sector, whereas the corresponding figures of the remaining two sectors are 91.2% and 96% respectively (CBS, 2008). But, the demand in informal sector is mostly of unskilled workers including small percentage of basic and middle level technicians other than senior technocrats. So the large proportion (almost 95%) of demand of informal sector is for unskilled technicians. In this line of reasoning, it can be estimated that around 400,000 technical workforces (basic and middle level technicians) are also currently engaged in informal sector. The expansion of employment market as well as the number required for the replacement of retired workforce is estimated around 10% of the total employed. In this approach, around 40,000 engineering workforces from technical field are speculated to be annually demanded in informal sector.
4.5 Health Presently, employment opportunities for health professionals are mainly available in public hospitals, health posts, polyclinics, pathologies, dispensaries, pharmaceutical companies, medical colleges, other health institutions, etc. The private (for profit) hospitals and hospitals run by

56 | P a g e
missionaries are also providing significant employment opportunities to health professionals. Unlike the other sectors, informal sector's employment are found negligible for health-related professionals.
4.5.1 Employment in Private Formal Sector As delineated above, the major basis of analysis of employment capacities of formal sector is the employment units survey. A total of 398 employment units were surveyed considering 13,458 as a total population. The following are the types of employment units covered in the survey under the health sector.
• Private health service providers (hospital, nursing homes, polyclinics) • Pathologies, dispensaries • Schools/ Institutions • Large industries including pharmaceutical industries and health equipment industries • I/NGOs • Pharmacies/Dispensaries
Table 4.4: Highly Demanded Occupation and Estimated Annual Demand
SN Name of Occupation
Projected Demand in Formal Establishments
Currently working
Annual Increment
Demand in New Enterprises
Total Annual Demand
1 Beautician 38,000 7,000 2,000 9,000 2 CMA 12,500 1,000 600 1,600 3 Staff Nurse 12,000 2,000 500 2,500 4 Pharmacist 7,000 500 200 700 5 ANM 6,000 500 300 800 6 H.A. 5,500 500 300 800 7 Lab Technician 5,000 600 300 900 8 B.P.H. 4,500 200 200 400 9 Radiographer 4,000 500 200 700
10 Lab Assistant 2,200 200 100 300 11 Pathologist 1,800 60 90 150 12 Ophthalmic
Assistant 500 30 20 50
13 X-ray Technician 400 30 20 50 14 Health Teacher 350 20 40 60 15 Eye Assistant 300 10 5 15 16 AHW 200 10 10 20 17 Junior Pharmacist 200 70 10 80 18 Health Assistant
Teacher 150 10 5 15
19 Physiotherapist 50 5 5 10 20 Lab Technologists 50 5 5 10
4.5.2 Demand in Government Sector As per the data of Public Service Commission, out of 112,295 total staffs of public service, 28,646 staffs are presently working under Health Service, out of which, a significant number "11,687" are presently vacant which is 40.3% of the total posts. As mentioned earlier, the posts are vacant due to
57 | P a g e
the longer process of official recruitment system. However, other factors are also responsible for this situation. The new provision of inclusive recruitment system, unavailability of related technicians in the market and unwillingness of people to work in the remote parts of the country may be other responsible factors. This is the indication of shortage of HRH under specialized categories where no applicants are available to apply for the jobs. These specialized fields of vacant posts are Radiographer, Dark Room Assistant, Health Education Instructor and so on.
4.5.3 Employment Opportunities in Informal Sector According to Nepal Labour Force Survey, 53.5% of the total employed population in health and other social sectors is engaged as informal employees. This suggests that the number of HRH who are employed in informal sector is almost equal (almost 50%) to the number that is employed in formal sector. But in other sectors, the proportion of population among various categories of health professions and levels is not the same as in formal sector. It is rational to assume that unskilled and basic level workforces are engaged in higher proportion than other higher categories of skills. Considering this fact, the proportions of the employed HRH in the categories like Pharmacists, Community Medicine Assistant (CMA) and Pathologists are found higher proportion than in formal sector; however, the Staff Nurse, Auxiliary Nurse Midwife, Radiographer, Ophthalmic Assistants are in lower proportion. In total, almost 150,000 health professionals are found engaged in informal sector including Skilled Birth Attendant to higher level medical doctor.
4.6 Hospitality The employment opportunities provided by the tourism industry is the function of the flow of tourist (both internal and external) in the country. The tourism activities or the number of establishments related with the tourism industry such as hotel and lodge, travel and trekking activities, mountaineering activities, homestay services, religious tourism, sports tourism activities like paragliding, rafting and bungee jumping can be the major indicators for employment assessment. The number of such establishments and their activeness had provided some insights into the employment creation capacity of the tourism or hospitality sector.
4.6.1 Employment in Private Formal Sector The total number of employees engaged in the registered enterprises involved in the above mentioned activities was the total population of the study which was calculated as 4,987. Here is the list of types of employment units in tourism sector, from which the samples was drawn.
• Hotel, lodge, restaurants and tea houses • Travel/Trekking/Rafting/Mountaineering Agencies • Homestay services • Emerging occupations in tourism including bungee jumping, paragliding, etc. • Associate members of Hotel Association of Nepal (HAN) and Hotel Professional Federation
of Nepal (HPFN) As per the similar estimation approach, Waiter, Field Tourist Guide, Thanka Painter, Cook, Bamboo Furniture Maker, Washer Man, Housekeeper are the emerging and demanding occupations in the tourism sector. Table 4.5: Demanded Occupations and the Number of Demand SN Name of occupation Presently Working Probable Annual Requirement
1 Waiter 7,000 300 2 Field Tourist Guide 4,000 200 3 Thanka Painter 1,250 150

58 | P a g e
SN Name of occupation Presently Working Probable Annual Requirement 4 Cook 3,500 150 5 Bamboo Furniture Maker 3,550 150 6 Washer Man 3,400 150 7 Housekeeper 3,000 125 8 Receptionist 2,600 100 9 Porter 2,500 100
10 Cabin Crew 100 10 11 Binding 1,800 75 12 Airport Operator 200 10 13 Front Office 800 30 14 Reservation 600 30 15 Room Maid 600 60 16 Mountaineering Guide 350 20 17 Food and Beverage 300 30 18 Laundry Boy 250 20
4.6.2 Employment in Government Sector Public sector rarely provides any long-term employment opportunities for the tourism-related skilled workers. Nepal Tourism Board (NTB) has employed the tourism-related professionals; however, this number is quite limited. The institutes like Nepal Academy of Tourism and Hospitality Management and other tourism-related institutes themselves do not provide any notable number of employment opportunities except preparing trained workforce for the rest of the tourism industry. So the employment opportunities for tourism-related skilled workforce are only limited within the formal set up of hotels, lodges, restaurants, travel and trekking agencies, etc. as well as other informally available seasonal employment.
4.6.3 Employment in Informal Sector As per the Labour Force Survey 2008, out of the total people employed in hotel and restaurant sub-sector, 96.6% are informally employed, whereas only 3.4% have got formal employment in this sub-sector (CBS, 2011). In this survey, the number of formal employment in hotel and restaurant sub-sector is 12,382 which represents only 3.4% of employment (i.e. formal). In this line of reasoning, approximately 350,000 workforces are assumed in the hotel and restaurant business. If we assumed that the annual requirement of workforce is around 10% of the total employment, 35,000 is the speculated annual demand of hotel and restaurant sub-sector in totality. Moreover, by applying the same logic, almost similar number of employment opportunities are annually available in other tourism-related establishments like travel/trekking and rafting agencies. The hotels and restaurants considered here are not only limited to tourist standard hotels, so this number is quite higher than the number calculated by WTTC as explained in Part II.
59 | P a g e
PART FIVE
FINDINGS, CONCLUSION AND RECOMMENDATIONS
5.1 Background Based on the analysis made in earlier parts, this part incorporates the major findings, conclusion and recommendations. On the one hand, employment opportunities in public sector are almost saturated for the average technical workforce and on the other hand, the private sector is not developed and has not become competitive to employ competent human resources in a desired level. The manufacturing industry which is considered as the major employment sector is not getting friendly environment to flourish so as to create employment opportunities in this sector in a desired number. Lack of matching and quality workforce is one of the reasons for such a situation. The service sector such as construction and tourism are in prominent position to generate employment opportunities for technical human resources to some extent. However, only small proportion of demand is fulfilled by it. The survey result depicts that majority of the employees in the formal sector are from technical background or skilled-based but the annual increment in employment is negligible. It is a pity to report that one in every two enterprises has not performed satisfactorily in the last few years. Moreover, no more evidences can be gathered to expect betterment of the situation in the future except the ambitious-looking targets of public policies and development plans. Supply of quality technicians in a desired quality and quantity can be instrumental to make such development plans achievable. The employers are found preferring experienced workers to trained workers. This is because of the dominance of theoretical portion and lack of practical or work based-learning approach in the existing training curricula. In most of the trades and programs where curricula are somewhat appropriate, it is not followed properly by the institution while teaching. Although the conclusion as mentioned above can be common in each trade and program, a significant variation can be found in the demand and supply situation of workforce and the factors responsible for such variation are not common in all trades and programs. The conclusion and recommendations part is, therefore, explained under four sub-topics as Agriculture, Engineering, Tourism and Health Sectors as follows.
5.2 Agriculture Agriculture is a potential sector for employment. However, extremely large proportion of unskilled labor than the skilled technicians is being engaged in agriculture. Majority of the formal employment opportunities in agriculture are limited within government and I/NGOs; However, the present trend of shifting from subsistence agriculture to market agriculture plays a vital role to generate employment opportunities for skilled workforce also in the informal sector. Presently, extensive use of modern technologies also increases the demand of skilled workforce. This research explores some facts regarding the labour market dynamics and dimensions of technical HR in agriculture sector, which are listed out hereafter as the major findings. Besides, this topic also incorporates conclusions drawn based on that findings along with some policy level recommendations.

60 | P a g e
5.2.1 Major Findings • Agriculture is the largest sector for employment. However, extremely large proportion
(61.3%) of informal employment is in agriculture sector of which the majority are unskilled labor.
• The annual growth rate of agriculture sector remained around 4% in the last decade. The lack of year round irrigation and lack of technology and technicians are the major responsible factors for this disappointing situation.
• Structural transformation can be observed in the Nepalese economy. The contribution of agriculture sector to GDP has decreased from 37.9% to 32.3% in the last 12 years (058/59 to 071/72). Unlike the agriculture sector, contribution of service sector has increased from 45.1% to 53.2% in the same period of time.
• There are almost 28,462 formally registered agriculture enterprises throughout the country, which employ almost 768,474 workforces at the rate of 27 employees per enterprise, of which 41% are technical staffs.
• Among the 247 surveyed enterprises, 48 enterprises recruited 157 new technical staffs during the last 12 months of the survey. At the same time 151 staffs were also made redundant from the job.
• Every one in four agriculture-related enterprises has been found suffering from the crisis of technical workforce, this figure is comparatively higher than the corresponding figures of engineering, health and hospitality sectors.
• Last five years' business status of agriculture-related enterprises was found comparatively more sound than the enterprises related to engineering, health and hospitality sectors. Business of almost 64% of agriculture-related enterprises had boomed and another 23.6% enterprises maintained their status quo, while the business of the remaining 12.3% employment units was reported shrunk during the same period of time.
• Government policy to expand agriculture services up to VDC level has created job opportunities to around 4,000 middle level agriculture and livestock technicians.
• Organic farming, floriculture, herbal processing, natural fiber processing are some of the representative emerging agro-business where technical HR of specific skills are immediately needed.
• Junior Technical Assistant (Ag.), Gardener, Poultry Worker, Fiber Processer, Livestock Technicians, Veterinary JTA, Seed Technicians are some demanding occupations in agriculture, whose annual demand of 1,000-2,000 is there only in the formal sector.
• Middle level technicians were not in demand in significant number in informal sector; however, some lower level technicians are harshly needed.
5.2.2 Conclusion and Recommendations • Conclusion: In some occupations, employers have difficulty in finding appropriate technicians
due to the lack of training curricula. However, insufficient contents of the curricula are responsible in other cases. Unlike the curricula, lack of efficient and effective training methods is more responsible to widen the gaps between the employers' needs and skills of trained graduates.
• Recommendation 1: Short-term curricula should be developed in the occupations such as Seed Technician, Gardener, Weaver, Poultry Technician, Fish Feeding Technician, Fiber Processer, etc. as per the need of the employers.
• Recommendation 2: Updating and modification of the existing curricula of Junior Technical Assistant, Livestock Technician incorporating some technical contents related to emerging agro-businesses such as herbal processing, organic farming, floriculture, etc. as well as soft skills including business or entrepreneurial skills is a must, which enhances the employability of graduates.
61 | P a g e
• Conclusion: On the one hand, the graduates are found attracted towards wage employment in formal sector; however, such types of employment opportunities in agriculture are limited within government and I/NGOs which is found almost saturated. On the other hand, present trends of shift from subsistence agriculture to market agriculture and technological innovation pave the way to generate large number of employment opportunities in informal sector; however, the graduates are hardly found motivated and capacitated to start their own business. • Recommendation 3: The existing curricula are to be modified to incorporate the
necessary soft skills components including business skills and entrepreneurial skills. • Recommendation 4: Appropriate career counseling should be conducted before
enrolling in TVET programs so that trainees can choose the programs as per their interest and get enough time to be motivated towards self-employment.
• Recommendation 5: Placement and coordination mechanism should be there to establish a linkage between TVET graduates to financial institutions for managing investment source as well as provide facilitating role throughout the whole process.
• Recommendation 6: The occupations such as Agro-mechanics, Food Technicians, Gardener and Floriculture are modern fields of agriculture, so medium-term courses should be designed regarding these fields so as to capacitate trainees to start their own business.
5.3 Engineering A developing country like Nepal has a large need for investment in infrastructures such as hydro-electricity, road transportation, bridge construction, public offices and private residencies. The April earthquake of 2015 further multiplied the need for such type of investments which can generate employment opportunities in a larger number; however, the investment trends of the past few years, especially in large infrastructure sector was not encouraging. The analysis carried out in this study has explored several facts which are synopsized hereafter in the bullets as the major findings.
5.3.1 Major Findings • Sectorial growth rate of GDP of Manufacturing, Construction, and Electricity, Gas and
Water was not in deterministic trend to speculate the future growth rate. The growth rate ranges between -3.44 and 13% during that period.
• The employment elasticity of output growth can be a tentative measure to speculate the demand of workforce by analyzing the trend of economic growth. In the case of Nepal, such type of elasticity can be taken as 0.71.
• The employment generating capacity of Nepalese industrial sector has shrunk during the last decade. The contribution of industrial sector to GDP has fallen from 17% to 14.5% during the last decade.
• Some mega projects having capacity to generate a large number of employment are either already initiated such as Mid-hill Highway, North-South Corridor, Terai Madhesh Fast Track Road Project and Hulaki Highway or some are in pipeline such as Bheri-Babai Diversion, Kaligandaki-Tinau Diversion, Sunkoshi-Kamala Diversion, E-W Electrified Railway Project, etc.
• Alternative energy sector is also generating a significant number of employment opportunities for the technicians such as micro-hydro operator, micro-hydro installer, solar technician, social maintenance technicians, etc.
• Around 30,000 employment opportunities are being created annually in big industries and in similar number in cottage and small industries.

62 | P a g e
• In total, 50% of the staffs of the engineering-related enterprises were from technical background, whereas the disaggregated figure shows that proportion of Cottage Industry is 58.33%, of Contractor Agency is 48.5% and 45.43% in big industries.
• Majority of the engineering-related enterprises (54.5%) were found booming during the last five years since the time of survey, whereas a significant proportion (23.3%) was able to maintain the position of status quo.
• Information obtained from employment unit survey reveals that general mechanics, production operator, information technology, etc. were emerging as the major demanded occupations.
• Twenty-one percent employment units in engineering sectors have suffered from workforce crisis during the last few years, whereas a large majority of the enterprises have witnessed either excess or moderate supply of workforces.
5.3.2 Conclusion and Recommendations Conclusion: The sectorial growth rate of GDP in all sectors including the engineering-related sectors such as Manufacturing, Construction and Electricity, Gas and water were below average in the last decade. On the one hand, a significant proportion of government development expenditure had gone unspent. Private investors are also not getting favorable business climate for the productive investments on the other hand. As a result, job opportunities created in the economy are far lower than the number of employment-seekers that enter annually in the labour market.
• Recommendation 1: As in agriculture sector, engineering sector should also be focused on preparing human resources based on the informal sector's requirements and more oriented towards self-employment. One elective subject of soft skills should also be incorporated in the curricula of the TSLC courses.
• Recommendation 2: Short courses such as plumber, mason, welder, carpenter, auto-mechanics are emerging as the demanding occupations in informal sector; however, HR in the mentioned occupations should be developed as an employment creator rather than an employment absorber/seeker by designing self-employment-oriented courses of medium term incorporating necessary soft skills such as entrepreneurial skills, business skills and interpersonal skills.
Conclusion: Just like in agricultural sector, employment opportunities in public sector are also almost saturated in engineering sector; however, technological innovation and modernization of work procedure always give birth to the demand of more specified technicians. Such types of hi-tech technicians are highly demanded not only in private formal sector but also in government sector where such types of posts are gone unfulfilled even after the repeated advertisements.
• Recommendation 3: Some specialized courses for middle level technicians, parallel with the higher engineering degree should be designed and the programs should be run accordingly, such as Diploma/TSLC in Chemical Engineering, Diploma/TSLC in Structural Engineering, Diploma/TSLC in Hydroelectric Engineering and TSLC in Electronic Engineering.
• Recommendation 4: Although some technicians are widely available in labour market, such posts under the reservation category still remain unfulfilled so that the targeted community-focused program is a must for operating TVET programs.
Conclusion: Analyzing the early sign of the economy, potentiality of paradigm shift in the demand of construction-related workforce has appeared in the economy after the catastrophic earthquake of April 25, 2015 and the continuous aftershocks thereafter. A massive amount of reconstruction and new construction of public and private building as well as other infrastructures is the immediate necessity. Greater awareness about earthquake resilient technology is also raised not only among the engineering technicians but also in general public. This situation paves the way for a significant number of employment opportunities for engineering-related skilled workers, medium level technicians not only in quantity but also in quality.
63 | P a g e
• Recommendation 5: All curricula under Engineering Trade should be revised to incorporate earthquake resilient technology to some extent and special courses should also be designed giving due focus on such type of technology.
• Recommendation 6: Viewing the post-disaster reconstruction need, the number of short-term trainings such as mason, plumber, welder, carpenter, etc. should be increased by two folds and middle level technicians should be increased by double within next three to five years.
5.4 Health Sector In this report, trend and policy analysis was made focusing on the needs of HRH in the country. Similarly as other sectors, primary survey was conducted in 384 hospitals and other health-related institutions and industries. In addition to the primary survey and trend and policy analysis, dozens of key informants were also interviewed and interaction program was also organized. Analyzing the information gathered from all these sources, the major findings are explored hereafter.
5.4.1 Major Findings • The employment opportunities of health-related occupations such as Staff Nurse, Auxiliary
Nurse Midwife, Health Assistant, etc. are almost saturated in public sector; however, the annual retirement of staff creates opportunities for a limited number of graduates.
• The expansion plan of health services up to ward level seems to create additional employment opportunities for almost 10 thousand health professionals in various fields.
• The transformation process from unitary political system to federalism seems to create 20% additional job opportunities for health-related professionals from basic to higher technocrat level.
• Almost 47% staffs of public health services comprise of basic and middle level health technicians.
• Although no significant increment in public health institutions has been observed during the last 15 years, 46% expansion of health services (including hospital beds) was observed in the same period.
• In the health-related surveyed enterprises including hospitals, polyclinics/pathologies, and pharmacies, 51.29% of the staffs working in these enterprises were from technical background.
• Health sector can be considered as a booming sector in respect to other surveyed sectors, since 57% of the health-related enterprises reported their last five years' business as booming.
• Among the various categories of health-related enterprises, hospital business is found comparatively a boomed business than polyclinics/pathologies and pharmacy businesses.
• Staff Nurse, Health Assistant, Community Medical Assistant, Auxiliary Nurse Midwife, Beautician can be considered as top demanded occupations irrespective of supply status.
• Some middle level health technicians in specialized fields such as Orthopaedic, Optical Fitting and Dispensing, Radiography, Homeopathy, ECG, Physiotherapy are of immediate demand not only in private but also in public sector.
5.4.2 Conclusion and Recommendations Conclusion: Presently, technicians in health-related occupations are almost saturated in the public jobs. But, the government policy to extend primary healthcare facilities up to ward and village level may create some additional employment opportunities for medium level health technicians. Moreover, government's policy of privatization of health services has also created enabling environment to open private hospitals, thereby creating an ample number of employment opportunities in private sector as well.

64 | P a g e
• Recommendation 1: Since the health policy can create employment opportunities for various health technicians in a significant number, TVET extension plan should be linked with implementation status of other public policies including health policies.
• Recommendation 2: The supply of HRH should not be increased abruptly except some new trades such as Optical Fitting Assistant, Homeopathy (See Part II for a detailed list); however, slight increment in supply of such workforce is essential to meet the need of the expansion of health service both in private and public sectors.
Conclusion: Self-employment opportunities are also there for the occupations such as Pharmacy and Lab Technician; however, majority of the traditional health-related trades have only opportunities for formal employment. Presently, health sector is adopting modern and innovative technologies which give birth to the new and very specific demands. Similarly, qualitative data further suggest that demand of Technical HR will be increased by 15% in the next five years.
• Recommendation 3: The curricula such as Pharmacy, Lab-technician and Radiology should be comprised of necessary soft-skill components, including entrepreneurship skills to orient and motivate the graduates for self-employment.
• Recommendation 4: The changing or emerging technology in health sector creates opportunities of new jobs; therefore, workforce should be prepared based on the findings of periodic market assessment.
• Recommendation 5: Quality of health services has a major role for employment opportunities; therefore, CTEVT should enforce strong mechanism of monitoring and supervision for quality delivery of training programs.
• Recommendation 6: Necessary action should be taken by the concerned agencies, mainly by CTEVT to incorporate adequate practical components in the curricula as well as ensure their proper implementation.
5.5 Hospitality Due to its geo-social diversity, tourism is the major potential sector of economic development and employment generation in Nepal; however, desired benefits have not been achieved from it till date. Lack of tourism infrastructures, political instability, lack of trained and efficient human resources are the major problems of this sector. As in other sectors, the trend of tourist flow in the past, government policies, primary survey of tourism establishments, the key informants interviewed are the major bases for the analysis of workforce demand in hospitality sector. The following are the major findings explored from the analysis made in this study.
5.5.1 Major Findings • Since the flow of tourists is found directly influenced by the political situation, employment
in hospitality sector will be in expected level only under the condition of favorable political environment.
• Hospitality industry provides direct employment to around 200 thousand people, if indirect and induced employments are also considered this figure reaches to almost 600 thousands.
• Under the favorable political environment, the hospitality industry will accommodate almost one million people by the year 2021.
• Opening of a five star hotel requires almost 1,000 tourism-related professionals. • Out of the total staffs working in tourism establishment, 52.37% are required from technical
background which is higher in respect to other types of establishments analyzed in this report.
• While reviewing the business trend of hospitality sector in the last five years, completely pessimistic scenario is observed. Only 39% of the enterprises experienced boomed business during that period.
65 | P a g e
• Among the hospitality industry, business status of hotel/resorts is somewhat better than that of travel/ trekking and rafting agencies.
• Entrepreneurs are not found optimistic about the future of their business. • This survey reveals that during the last 12 months 197 enterprises of hospitality sector hired
456 employees; whereas at the same time 485 staffs were also made redundant from the job by 226 enterprises.
• Waiter, Cook, Housekeeper, Field Tourist Guide, Thanka Painter, Receptionist have emerged as the highly demanded occupations in hospitality sector irrespective of supply status.
• About 20% of the hospitality-related enterprises have suffered from workforce crisis in the last few years; however, the rest 80% didn't have such an experience.
• Performance level of the majority of the employees (79%) was found average (satisfactory), neither excellent nor poor.
5.5.2 Conclusion and Recommendations Conclusion: Although hospitality industry has been facing its worst time because of political instability in the country, a large number of hospitality professionals are likely to be demanded in the future if some improvement in situation as well as effective implementation of Tourism Policy 2010 and other tourism development strategies is ensured. The job opportunity for hospitality professionals in public organizations is very limited but such type of opportunity is in a significant number within the formal set up of hotel, resorts and restaurants. But a major proportion of employment is accommodated by informal sector.
• Recommendation 1: CTEVT has to pay proper attention to establish tourism-related institutions with enough physical and other educational infrastructures in the main tourism destinations such as Chitwan, Solukhumbu and Bardiya in teaching hotel basis18.
• Recommendation 2: The involvement of CTEVT in tourism sector is limited; therefore, it should expand its programs through proper coordination with concerned stakeholders.
Conclusion: The employers in tourism related-organizations give more priority to experienced workers than trained workers which suggests for inadequate practical exposure in the institution. Moreover, Nepalese hospitality industry has already started to be diversified into various forms such as village tourism (including homestay), adventure tourism, sports tourism (bungee jumping, etc.); but the human resources are not available to address the HR requirement as per this diversified demand.
• Recommendation 3: Diversification has occurred in the tourism business, so courses of tourism should be redesigned so as to make it compatible with the changing needs of tourism industry.
• Recommendation 4: New curricula should be designed and developed to address the emerging and diversified needs of tourism sectors such as paragliding, rafting, bungee jumping, canoeing, etc. Similarly, specification of cooking profession should be done by specifying it as Indian, Continental, Chinese and others.
5.6 Other Recommendations The other recommendations which are common or not covered by the above mentioned major four categories are as follows;
18 Like in the teaching hospital, teaching hotel modality provides ample practical exposure within their own premises.

66 | P a g e
• The study with its limitation could not explore the employment opportunities entering into other potential areas such as cottage industries, arts and crafts and the areas beyond the above mentioned four categories. To address and identify the employment opportunities in such areas, a separate study should be designed and conducted.
• Informal economy is a huge sector but it is scattered, fragmented and not within the recording system. A lot of economic activities happen in this sector and creates employment opportunities for skilled workforce. This study has tried to reach to the sector but with its limitations could not address it completely. Therefore, a separate study of informal sector should be designed and conducted in future.
• Recently the country has got a new constitution with Federal States of Republic. The study was not designed to address human resource requirement for the implementation of the new constitution. Therefore, there should be a separate labour market survey to address the needs of skilled workforce for the forthcoming seven provinces of the country.
• Film and recreation industry is a new area which is rapidly developing in Nepal. This industry was not within the scope of this study. Therefore, to identify the needs of skilled workers of the industry, a separate study should be designed and conducted.
• For the complete projection of human resource requirement, a separate study for each of the sectors should be conducted in the future.
67 | P a g e
BIBLIOGRAPHY Central Bureau of Statistics, (2011). National population and housing census, 2011(National
report). Kathmandu, Nepal: Central Bureau of Statistics.
Central Bureau of Statistics, (2011). Nepal living standard survey, 2010/11. Kathmandu Nepal: Central Bureau of Statistics.
Council for Technical Education and Vocational Training, (2007). Council for technical education and vocational training: A glimpse. Sanothimi, Bhaktapur: CTEVT.
CTEVT, (2010). A rapid assessment of potential labour market for rehabilitation of Maoist army combatants: A desk study for GIZ. (unpublished).
CTEVT, (2011). Council for technical education and vocational training: A glimpse, 2011. Kathmandu, Nepal: CTEVT.
DCSI, (2072). Industrial promotion statistics 2072. Kathmandu, Nepal: Department of Cottage and Small Industry.
DoI, (2013). Industrial statistics. Kathmandu, Nepal: Department of Industry.
GoN, (2006). Council for technical education and vocational training act, 2045. Kathmandu, Nepal: Ministry of Education.
International Labor Organization, (2012). Comparative analysis of methods of identification of skills needs in the labour market in transition to the Low Carbon Economy. Geneva, Switzerland: ILO.
Joshi, S., & Neupane, M. (2014). National skilled human resource projection in health and engineering professions. Sanothimi, Bhaktapur: CTEVT.
KC, A., & Pradhan, H. (2010). Analysis of labor market signaling. (An unpublished research paper).
Kennedy, P. (1998). A guide to econometrics (4th edition). Cambridge, MA: The MIT Press.
Ministry of Education, (2012). Technical and vocational education and training policy, 2012. Singhadurbar, Kathmandu: Ministry of Education.
Ministry of Finance, (2012). Economic survey, 2011/12. Kathmandu, Nepal: MoF.
Ministry of Health and Population, (2012). Human resources for health strategic plan 2011-2015. Kathmandu, Nepal: MoHP.
Ministry of Health, (2003). Nepal strategic plan for human resource for health, 2003-2017. Kathmandu, Nepal: Ministry of Health and Population.
MoAC, (2004). Agriculture policy, 2004. Lalitpur, Nepal: Ministry of Agriculture and Cooperative Development.
MoAC, (2015) Agriculture development strategy, 2015-2035. Lalitpur, Nepal: Ministry of Agriculture and Cooperative Development.
MoCTCA, (2013). Nepal tourism statistics, 2013. Kathmandu, Nepal: Ministry of Culture, Tourism and Civil Aviation.

68 | P a g e
MoCTCA, (2014). Tourism employment survey, 2014. Kathmandu, Nepal: Ministry of Culture, Tourism and Civil Aviation.
MoF, (2012). Economic survey, 2011/12. Kathmandu, Nepal: Ministry of Finance.
MoF, (2015). Economic Survey, 2014/15. Kathmandu, Nepal: MoF.
National Planning Commission, (2010). Three years interim plan 2013/14-2015/16. Singhadurbar, Kathmandu: NPC.
National Planning Commission, (2015). Post-disaster needs assessment (executive summary). Kathmandu, Nepal: NPC.
Neupane, B.M. (2010). Increasing access of technical education and vocational training (TVET) programs and relevancy to the job market. Technical and Vocational Education and Training Development Journal. 1 (10).
Padalino, S., & Marco, V. (1997). The employment intensity of economic growth in the G-7 countries. International Labour Review. 136, 191-213.
Pianta, M. Rinaldo, E. & Giulio, P. (1996). The dynamics of innovation and employment: An international comparison. Science Technology Industry Review 18: 67-93.
Pradhan, H., Ghimire, G.R., & Subedi, S. (2014). Report on analysis of selected industry and service sectors in Nepal. Lalitpur: Swiss Agency for Development Cooperation.
Pradhan, H., Neupane, B.R., & Sapkota, H. (2014). Analysis of skills gaps between selected CTEVT curricula and demand in labour market. Kathmandu, Nepal: unpublished
Public Service Commission, (2071). Loksewa Aayogko Pacpannaun Barshik Prativedan. Kathmandu, Nepal: Public Service Commission.
69 | P a g e
ANNEXES Annex 1: Occupation-wise Redundant and Recruited Number
SN Name of Occupation Recruited Number Redundant Number Employment
Unit Employees Employment
Unit Employees
1 Waiter 56 138 64 140 2 Staff Nurse 19 107 19 88 3 Administration 3 73 3 7 4 Unskilled Labour 7 67 9 89 5 Health Assistant 14 63 6 8 6 Housekeeper 23 63 22 57 7 Cook 31 61 35 77 8 CMA 18 47 16 46 9 Mechanic 10 42 7 38 10 Auxiliary Nurse
Midwifery 14 41 11 33
11 Field Tourist Guide 4 31 1 1 12 Beautician 19 29 15 20 13 Helper 17 28 17 27 14 B.P.H. 2 25 0 15 Production Operator 5 25 6 29 16 IT Staff 1 25 0 17 Social Mobilizer 6 25 4 10 18 Junior Technical Assistant 5 22 3 6 19 Receptionist 13 21 13 19 20 Technician 4 21 2 14 21 Agriculture Labour 1 20 1 20 22 Servicing Mechanic 2 20 2 11 23 Brick Molding 1 20 1 20 24 Lab Technician 13 19 9 13 25 Front Office 8 18 10 23 26 Computer Technician 10 18 8 13 27 Radiographer 4 18 2 5 28 Veterinary JTA 2 18 1 3 29 Pharmacist 11 17 8 11 30 Accountant 9 17 12 26 31 Production Skilled Labour 2 15 1 20 32 Lab Assistant 10 14 7 8 33 Welder 9 13 9 20 34 Tailor 4 12 3 6 35 Overseer 7 12 3 5 36 Miller 9 12 7 10 37 Computer Operator 11 11 10 10 38 Electrician 6 10 6 10 39 Metal Sculptor 2 10 2 8 40 Mobile Repairer 7 10 6 9 41 Driver 6 10 8 13

70 | P a g e
42 Packaging Staff 2 10 2 9 43 Ticketing Staff 6 10 9 25 44 Machine Operator 2 10 4 14 45 Salesperson 6 9 9 13 46 Electronic Technician 2 9 2 4 47 Security Guard 6 8 5 6 48 Marketing Officer 6 8 13 19 49 B. Nursing 3 8 4 16 50 Management 3 7 4 8 51 Carpenter 4 7 6 15 52 Entrepreneurship
Development Facilitator 1 7 0
53 Baker 3 6 3 5 54 Computer Engineer 2 6 0 55 Engineer 5 10 7 26 56 Poultry Worker 1 6 1 6 57 Computer Teacher 2 5 2 4 58 Teacher 1 5 1 5 59 Butcher 1 5 1 3 60 Bellboy 2 4 1 2 61 Wood-carving 4 4 3 3 62 Room maid 3 4 2 2 63 Supervisor 3 4 6 10 64 Reservation 4 4 2 2 65 Cook+ Waiter 1 4 1 4 66 LGF 1 4 0 67 CCC 1 4 0 68 Washerman 2 4 3 5 69 Gardener 3 3 2 2 70 Thanka Painter 1 3 2 7 71 Cleaner 2 3 4 7 72 Cutting 1 3 1 2 73 Doctor 3 3 4 5 74 Chef 1 3 1 2 75 Repairer Assistant 1 2 1 2 76 Plumber 1 2 2 3 77 D. Pharma 1 2 1 1 78 Land Surveyor 1 2 0 79 Computer
Hardware/Software 1 2 1 2
80 Agriculture Assistant Teacher
1 2 1 1
81 Health Teacher 1 2 1 3 82 Bus Conductor 1 2 0 83 Weaver 1 2 1 2 84 Leather Shoes/Craft
Maker 1 2 1 2
85 Beekeeper 1 2 1 2 86 Medical Representative 1 2 1 3
71 | P a g e
87 ICS 1 2 0 88 Furniture Coloring 1 2 1 2 89 Dyeing 1 2 1 2 90 Food and Beverage 2 2 2 2 91 Fish Feeding 1 2 1 2 92 Trainer 1 1 1 1 93 Barista 1 1 0 94 Diner 1 1 0 95 B. Pharma 1 1 2 2 96 Fashion Designer 1 1 1 1 97 Mason 1 1 1 1 98 AHW 1 1 2 3 99 Dairy Assistant 1 1 1 1 100 Book Binder 1 1 1 1 101 Program/ Institutional
Facilitator 1 1 0
102 Meter Reader 1 1 0 103 Technical Teacher 1 1 2 3 104 Physician 1 1 1 1 105 Dentist 1 1 0 106 BMLT 1 1 1 1 107 Barber 1 1 1 3 108 Baidya 1 1 1 1 109 Loader 1 1 1 1 110 Wiring 1 1 1 1 111 Pallet Operator 1 1 1 1 112 Sub-overseer 1 1 1 1 113 Ophthalmic Officer 1 1 0 114 Operator 1 1 1 2 115 Electrical Engineer 1 1 1 1 116 Ophthalmic Assistant 1 1 0 117 Allrounder 1 1 1 1 118 Officer Staff 1 1 0 119 Transportation Department 1 1 0 120 Kayaker 1 1 1 1 121 X-ray Technician 0 1 1 122 Rafting Guide 0 1 1 123 Carpet Fitting 0 1 1 124 Roll Man 0 1 1 125 Dishwasher 0 1 2 126 Assistant Cook 0 1 1 127 Maintenance 0 1 1 128 M. Pharma 0 1 2 129 Computer Software 0 1 1 130 Pilot 0 1 2 131 Painter 0 1 3

72 | P a g e
Annex 2 A: Local and National Demand of Workforce in Nepal
S N Respondents Local Demand National Demand Remarks Formal Informal Formal Informal
1 Nepal Nursing Council
No projection
No projection
No projection
No projection
No demand but over-supply
2 Nepal Health Professional Council
35% 65% 40% 60% Formal: 30% Informal: 70%
3 Hotel Association of Nepal
25% 75% 40% 60% Local: 25% National: 35% No new recruitment
4 Nepal Association of Tour and Travel Agents
10% 90% 40% 60% Region-wise demands are different.
5 Trekking Agencies' Association of Nepal
10% 90% - - No system in the sector
6 Nepal Telecom No projection
No projection
No projection
No projection
Outsourcing is in practice.
7 Nepal Trade Union Congress
2% 98% 2% 98% There is gap between supply and demand.
8 Federation of Contractors' Association of Nepal
60% 40% 20% 80% Lack of workers due to foreign attraction
9 GEFONT 5% 95% 10% 90% High demand of skilled workers
10 Nepal Tourism Board 20% 80% 20% 80% Highly skilled workers are in demand.
11 Nepal Electricity Authority
80% 20% 80% 20% High demand of skilled workers
12 Federation of Nepal Chamber of Commerce and Industry
4% 96% 4% 96% Mismatch between skills and demand
73 | P a g e
Annex 2B: Local and National Demand of Workforce in Nepal SN Respondents Responses Remarks 1 Nepal Nursing Council • Less demand but oversupply of nursing professionals
• No national projection between demand and supply • No jobs in government sector • High percentage engaged in private jobs but with less
remuneration • There is attraction in foreign employment and due to this reason
more people want to undergo the nursing education and training.
2 Nepal Health Professional Council
• Health workers who hold license are employed directly or indirectly.
• Except Community Medicine Assistant, other occupations of Para-health workers are found employed.
• They have engaged in public, private, NGOs, INGOs, CBOs and in their own enterprises.
3 Hotel Association of Nepal
• Star hotels employ trained people. Therefore, there is limited opportunity of employment in hotel management.
• No expansion of hotel management • No new recruitment is taking place. • There is oversupply of trained people.
4 Nepal Association of Tour and Travel Agents
• Increment of skilled workers in this occupation • National demand is high but varies from development region to
region. High demand in central and western regions but less demand in other development regions
• Priority is given to skilled workers.
5 Trekking Agencies' Association of Nepal
• High skilled workers are in demand such as mountaineering guides.
• Demands are local-based though offices are in the urban areas. • Workers get opportunity where trekking activities take place.
6 Nepal Telecom • Most of the works are being done through outsourcing of skilled people.
• There is need of skilled workers as demanded by the nature of job they have to carry out in telecom sector.
7 Nepal Trade Union Congress
• Overflow of workers for foreign employment • Less minimum wages in the country • There is gap between supply and demand. • No workers available for construction work after the devastating
earthquake of 2072 • Child labor exits.
8 Federation of Contractors' Association of Nepal
• Once they are trained they leave for foreign jobs. • No workers for tunnel construction. • No worker for heavy equipment operation. • There is demand for skilled workers.
9 GEFONT • High demand of skilled workers • Still foreign workers are working in Nepalese industries. • Construction and reconstruction after earthquake needs huge
number of skilled workers.
10 Nepal Tourism Board • The Board is to support tourism sector; therefore, it is not directly related to employment.
• There is shortage of highly trained workers in hotels, travel, trekking and tour occupations.
11 Nepal Electricity Authority
• Most of the extension and new projects are done through contractors and contractors need skilled workers for their projects.
• There is need of skilled workers. • Skill upgrading courses are highly demanded to develop its

74 | P a g e
personnel. • Mostly workers trained by CTEVT are recruited. • Mostly NATHM-trained people are recruited. The respondent
had little knowledge about CTEVT products/graduates. 12 Federation of Nepal
Chamber of Commerce and Industry
• Workers are not available. • Workers are flying overseas for employment. • Training programs are not need-based. • Workers are not prepared for foreign employment. Those who
fly overseas do not meet the requirements and are forced to work as labors.
75 | P a g e
Annex 2C: Employment Percentiles in Formal and Informal Sectors
S.N. Respondents Formal Employment Opportunities
Informal Employment Opportunities
Remarks
1 Nepal Nursing Council Little Some 2 Nepal Health Professional Council 70% 30% 3 Hotel Association of Nepal 95% 5% 4 Nepal Association of Tour and
Travel Agents 70% 30%
5 Trekking Agencies' Association of Nepal
30% 70%
6 Nepal Telecom 80% 20% 7 Nepal Trade Union Congress 30% 70% 8 Federation of Construction of
Nepal 20% 80%
9 GEFONT 10% 90% 10 Nepal Tourism Board 20% 80% 11 Nepal Electricity Authority 80% 20% 12 Federation of Nepal Chamber of
Commerce and Industry 4% 96%

76 | P a g e
Annex 3: Growth Speculation for the Next Five Years
SN Respondents Local Demand National Demand Remarks
Formal Informal Formal Informal
1 Nepal Nursing Council
No projection No projection No projection
No projection No demand but oversupply
2 Nepal Health Professional Council
35% 65% 40% 60% Formal: 30% Informal: 70%
3 Hotel Association of Nepal
25% 75% 40% 60% Local: 25% National: 35% No new recruitment
4 Nepal Association of Tour and Travel Agent
10% 90% 40% 60% Region-wise demands are different.
5 Trekking Agencies' Association of Nepal
10% 90% - - No system in the sector
6 Nepal Telecom No projection No projection No projection
No projection Outsourcing is in practice.
7 Nepal Trade Union Congress
2% 98% 2% 98% There is gap between supply and demand.
8 Federation of Contractors' Association of Nepal
60% 40% 20% 80% Lack of workers due to foreign attraction
9 GEFONT 5% 95% 10% 90% High demand of skilled workers
10 Nepal Tourism Board
20% 80% 20% 80% Highly skilled workers are in demand
11 Nepal Electricity Authority
80% 20% 80% 20% High demand of skilled workers
12 Federation of Nepal Chamber of Commerce and Industry
4% 96% 4% 96% Mismatch between skills and demand
13 Department of Agriculture
10% No data No data 110% High level workers are in demand.
14 NARC No data No data No data 60% High level workers are in demand.
77 | P a g e
Annex 4: Availability of skilled Workforce S.N. Respondents Responses Remarks 1 Nepal Nursing
Council • Less demand but oversupply of nursing professionals • No national projection between demand and supply • No jobs in government sector • High percentage engaged in private jobs but with less
remuneration • There is attraction to foreign employment and due to the
reason more people want to undergo the nursing education and training.
2 Nepal Health Professional Council
• Health workers who hold license are employed directly or indirectly.
• Except Community Medicine Assistant, other occupations of Para-health workers are found employed.
• They have engaged in public, private, NGOs, INGOs, CBOs and in their own enterprises.
3 Hotel Association of Nepal
• Star hotels employ trained people. Therefore, there is limited opportunity of employment in hotel management.
• No expansion of hotel management • No new recruitment is taking place. • There is oversupply of trained people.
4 Nepal Association of Tour and Travel Agents
• Increment of skilled workers in this occupation • National demand is high but varies from development region
to region. High demand in central and western region but less demand in other development regions
• Priority is given to skilled workers.
5 Trekking Agencies' Association of Nepal
• High skilled workers are in demand such as mountaineering guides.
• Demands are local-based though offices are in the urban areas.
• Workers get opportunity where trekking activities take place.
6 Nepal Telecom • Most of the works are being done through outsourcing of skilled people.
• There is need of skilled workers as demanded by the nature of jobs they have to carry out in telecom sector.
7 Nepal Trade Union Congress
• Overflow of workers to foreign employment • Less minimum wages in the country • There is gap between supply and demand. • No workers available for construction work after the
devastating earthquake of 2072. • Child labor exits.
8 Federation of Contractors' Association of Nepal
• Once they are trained they leave for foreign jobs. • No workers for tunnel construction • No worker for heavy equipment operation • There is demand for skilled workers.
9 GEFONT • High demand of skilled workers • Still foreign workers are working in Nepalese industries. • Construction and reconstruction after the earthquake needs a
huge number of skilled workers.
10 Nepal Tourism Board
• The Board is to support tourism sector; therefore, it is not directly related to employment.
• There is shortage of highly trained workers in hotels, travel, trekking and tour occupations.
• Mostly NATHM trained people are recruited. The respondent had little knowledge about CTEVT products/graduates.
11 Nepal Electricity • Most of the extension and new projects are done through

78 | P a g e
Authority contractors and contractors need skilled workers for their projects.
• There is need of skilled workers. • Skill upgrading courses are highly demanded to develop its
personnel. • Mostly workers trained by CTEVT are recruited..
12 Federation of Nepal Chamber of Commerce and Industry
• Workers are not available. • Workers are flying overseas for employment. • Training programs are not need-based. • Workers are not prepared for foreign employment. Those
who fly overseas do not meet the requirements and are forced to work as labors.
13 Department of Agriculture
• Total Employees: 5,062 • Technical Officers: 799 • Immediate Demand: JT/JTA: 1,500 • Huge number of lower level workers are deputed on contract
basis.
14 NARC • Employed: Scientists: 281 Technical Officers: 304 Technicians: 418
• Vacant Posts: Scientists: 132 Technical Officers : 100 Technicians: 60 Unclassified Workers: 5,000
S.N Respondents Easily Available Not Available Remarks
1 Nepal Nursing Council Yes - 2 Nepal Health
Professional Council Yes but not in all
occupations -
3 Hotel Association of Nepal
Yes 10% by five years Oversupply
4 Nepal Association of Tour and Travel Agents
- Not available easily
5 Trekking Agencies' Association of Nepal
- Not available in peak season
6 Nepal Telecom Available as consulting firms are outsourcing
people.
-
7 Nepal Trade Union Congress
- Not available High demand in construction sector
8 Federation of Contractors' Association of Nepal
- Not available
9 GEFONT - Not available 10 Nepal Tourism Board - No information The Board is related to
policy issue. 11 Nepal Electricity
Authority - Skill upgrading is essential.
12 Federation of Nepal Chamber of Commerce and Industry
- Not available
79 | P a g e
Annex 5: Institutions Producing Skilled Workforce S.N Respondents Institutions Providing Skilled Trainings Remarks 1 Nepal Nursing Council CTEVT, IOM, KU, BPKISH, Karnali Health Academy 2 Nepal Health Professional
Council CTEVT:
Public and Private Institutions
3 Hotel Association of Nepal CTEVT, NATHM: Public and Private Training Institutions
Oversupply
4 Nepal Association of Tour and Travel Agents
CTEVT, NATHM: Public and Private Training Institutions
5 Trekking Agencies' Association of Nepal
CTEVT, NATHM: Public and Private Training Institutions
6 Nepal Telecom CTEVT, DCSI, CSIDB, Labour Training Centre: Public and Private Institutions
7 Nepal Trade Union Congress
CTEVT, DCSI and CSIDB, Labour Training Centre: Public and Private Institutions
High demand in construction sector
8 Federation of Contractors' Association of Nepal
CTEVT, DCSI and CSIDB, Labour Training Centre: Public and Private Institutions
9 GEFONT CTEVT, DCSI and CSIDB, Labour Training Centre: Public and Private Institutions
10 Nepal Tourism Board NATHM The Board is related to policy
issue. 11 Nepal Electricity Authority CTEVT, DCSI and CSIDB, Labour Training Centre:
Public and Private Institutions
12 Federation of Nepal Chamber of Commerce and Industry
CTEVT, DCSI and CSIDB, Labour Training Centre: Public and Private Institutions

80 | P a g e
Annex 6: Emerging Occupations of Skilled Workers S.N. Respondents Occupations in Demand Projected Skilled Workforce Remarks 1 Nepal Nursing
Council • Auxiliary Nurse
Midwives • Staff Nurse • B.Sc./BN Nurse • M.Sc./MN Nurse
No data available
2 Nepal Health Professional Council
• Community Medicine Assistant
• Radiographer • Ophthalmic Assistant • Dental Hygienist • Health Assistant • Acupressure • Aayurveda • Lab • Pharmacy, etc.
No data available
3 Hotel Association of Nepal
• Waiter/Waitress • Housekeeping • Cook • Assistant Manager • Manager • Chef • Front Desk Supervisor • Bellboy
No data available
4 Nepal Association of Tour and Travel Agents
• Ticketing • Marketing • Tour Operator • Tour Guide
No data available
5 Trekking Agencies' Association of Nepal
• Porter • Porter Guide • Trekking Guide • Mountaineering Guide
No data available
6 Nepal Telecom • Fiber/Optical cable installation
• GSM installation • Air-conditioning and
generator maintenance • IT Technicians • Repair and maintenance
technician
No data available
7 Nepal Trade Union Congress
• Construction workers • Agriculture workers • Manufacturing workers • Service sector • Tourism sector • Hospitality sector
No data available
8 Federation of Contractors' Association of Nepal
• Mason • Carpenter • Scaffolder • Electrician • Plasterer • Tile/Marble Fitter • Painter
No data available
81 | P a g e
• Plumber, etc. 9 GEFONT • Mason
• Carpenter • Scaffolder • Electrician • Plasterer • Tile/Marble Fitter • Painter • Plumber • Beautician • Embroidery • Handicrafts • Security Guards • Sales Boys/Girls • Aluminum Fitter • Heavy equipment driver,
etc.
No data available
10 Nepal Tourism Board • Tourism-related courses No data available 11 Nepal Electricity
Authority • Ladder Carrier • General Electrician • Building Electrician • Industrial Electrician • Installation • Connection • Repair and maintenance
technician • Skill upgrading courses
No data available
12 Federation of Nepal Chamber of Commerce and Industry
• Workers related to agro-forest
• Workers related to tourism
• Workers related to hydro • Manufacturing industries • Processing industries • Fertilizer industry • Herbal processing • Arts and crafts • Paper industry • Service industries
No data available
13 Department of Agriculture
• Technical Officers • Technicians • Skilled workers
14 NARC • Scientists • Officers • Technicians • Skilled workers

82 | P a g e
Annex 7: Quality of Skilled Workers or Skill Gap S.N. Respondents Quality
“Yes” Quality “No”
Remarks
1 Nepal Nursing Council Yes No practical exposure 2 Nepal Health
Professional Council Quality is missing due to negligence of training
institutions. 3 Hotel Association of
Nepal Yes
4 Nepal Association of Tour and Travel Agents
Yes Practical work needs to be exposed and elective courses should be added.
5 Trekking Agencies' Association of Nepal
Yes The trained are not getting works but the untrained are working.
6 Nepal Telecom Yes 7 Nepal Trade Union
Congress Yes But there is mismatch between demand and
supply. 8 Federation of Contractors'
Association of Nepal Yes
9 GEFONT Yes But there is mismatch between demand and supply.
10 Nepal Tourism Board Yes 11 Nepal Electricity
Authority yes
12 Federation of Nepal Chamber of Commerce and Industry
yes But there is mismatch between demand and supply.
83 | P a g e
Annex 8: District-wise Demand Status 8.1 Dang S.N. Organizations Responses Remarks
1 Hotel Association of Nepal, Dang
• High demand of workforce both in national and local market
• Skilled workers are not available. • Cook and waiter/waitress are in demand. • No training opportunities are available. • Trainings are being conducted by hotels themselves.
2 Nepal Trade Union Congress, Dang
• High demand of workforce in agriculture and construction sectors
• Only the workers working in formal sector are in record.
• Demand of skilled workers will be increased by 5 times in the next five years in construction, agriculture, health and industry sectors.
• Lack of skilled workers • Indian workers are available. • Sewing, cutting, leather goods, barber, cooks,
improved stove making, beekeeping and drivers are in demand.
• Access of training to the targeted people and market management of products are to be managed.
3 Federation of Contractors' Association of Nepal
• High demand of workers both in formal and informal sectors
• 60% workers are working in formal and 40% in informal sectors.
• Due to foreign employment workers are not available when they are needed.
• Some workers are available from the district and some are from adjoining districts.
• More helpers than skilled workers are needed. • No training is available • Agriculture, construction, and commerce need to be
improved.
4 Cottage and Small Scale Industries
• High demand of skilled workers • High demand of workers in informal sector • Sewing machine repairing, plumbing and veterinary
workers are in demand. • Indian workers are available. • 50% part-time and 50% full-time employments exist. • Training of complete package to be delivered, such
as a person who is trained should perform the task of masonry, wiring, plumbing
• Skilled workers are not available as demanded. • New areas of training are to be identified through
market need assessment.
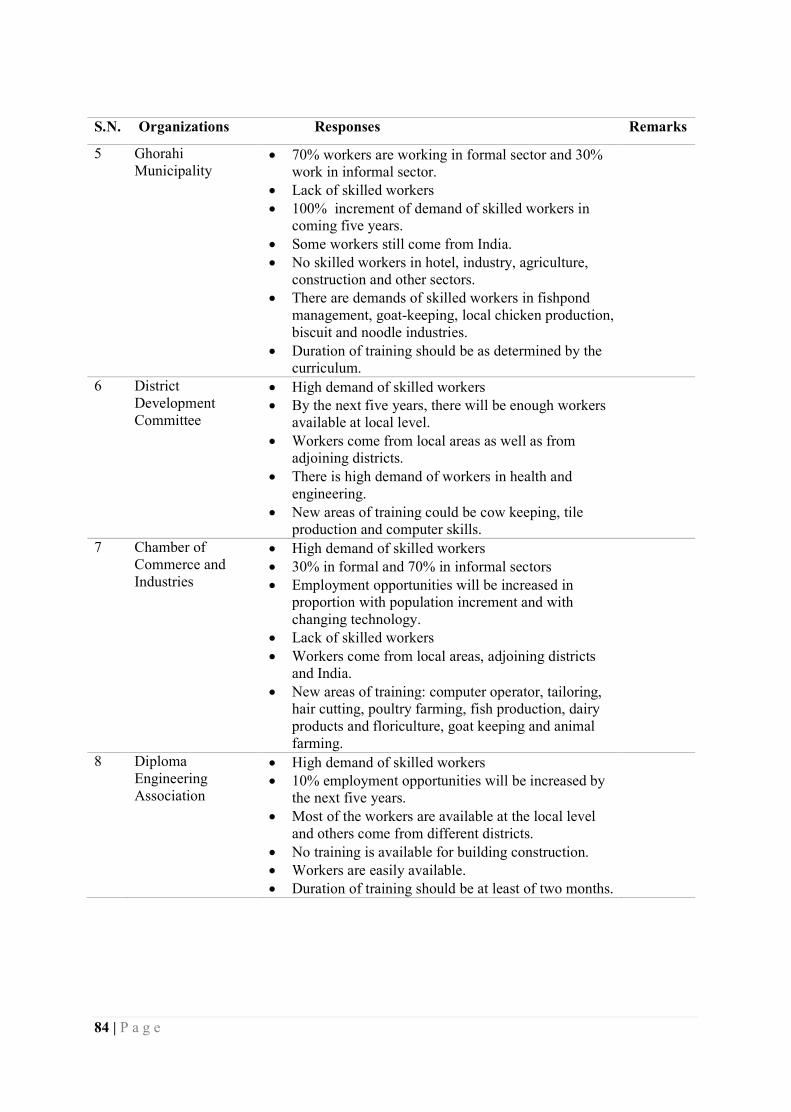
84 | P a g e
S.N. Organizations Responses Remarks
5 Ghorahi Municipality
• 70% workers are working in formal sector and 30% work in informal sector.
• Lack of skilled workers • 100% increment of demand of skilled workers in
coming five years. • Some workers still come from India. • No skilled workers in hotel, industry, agriculture,
construction and other sectors. • There are demands of skilled workers in fishpond
management, goat-keeping, local chicken production, biscuit and noodle industries.
• Duration of training should be as determined by the curriculum.
6 District Development Committee
• High demand of skilled workers • By the next five years, there will be enough workers
available at local level. • Workers come from local areas as well as from
adjoining districts. • There is high demand of workers in health and
engineering. • New areas of training could be cow keeping, tile
production and computer skills.
7 Chamber of Commerce and Industries
• High demand of skilled workers • 30% in formal and 70% in informal sectors • Employment opportunities will be increased in
proportion with population increment and with changing technology.
• Lack of skilled workers • Workers come from local areas, adjoining districts
and India. • New areas of training: computer operator, tailoring,
hair cutting, poultry farming, fish production, dairy products and floriculture, goat keeping and animal farming.
8 Diploma Engineering Association
• High demand of skilled workers • 10% employment opportunities will be increased by
the next five years. • Most of the workers are available at the local level
and others come from different districts. • No training is available for building construction. • Workers are easily available. • Duration of training should be at least of two months.
85 | P a g e
8.2 Sankhuwasabha S.N. Organizations Responses Remarks 1 GEFONT, Okhaldhunga • Local demand is normal.
• More opportunities in informal sector • Workers come from outside. • 60% are in formal and 40% in informal sectors. • 50% increment in employment opportunity in
next 5 years • Difficulty to get workers • New areas of training : Mason, Carpenter,
Helper, Plumber and Electrician • Dairy farming/animal farming is future potential
area.
2 Akhil Trade Union, Okhaldhunga
• High demand of workers in local market since road construction and development works are being done.
• There is demand of workers both in formal and informal sectors.
• 60% increment will be there in both sectors by next five years
• Difficulty to get workers • Agriculture and construction are the demanding
areas. • No quality training
3 NGO Federation, Okhaldhunga
• High demand of workers in both sectors • 80% informal and 20% formal employments • 25% increment in employment by next five
years • Workers are available in the district. • Market and agent both supply workers. • Agriculture and animal farming are high
demanding areas. • Paper, herbal, dairy industries are potential
areas.
4 Association of Gold and Silver Business, Okhaldhunga
• High demand of skilled workers • High demand of workers in both sectors • 70% in informal sector • Demand will increase by 25% in both sectors by
next five years • Workers are not easily available • Workers are supplied by agents • Trained workers are with quality skills
5 Trade Union Congress, Okhaldhunga
• High demand of workers in local market • 40% increment of employment opportunity in
next five years • Difficulty in finding workers • Workers are available from labor market. • Even the trained workers are not fully

86 | P a g e
S.N. Organizations Responses Remarks competent.
• Agriculture and grill industries are growing. 6 FNCCI, Okhaldhunga • High demand of skilled workers
• By next five years, there will 100% demand increment of skilled workers.
• Workers come from local areas as well as from adjoining districts.
• There is high demand of workers in plumbing, electrician, carpentry and masonry.
• New areas of training could be agriculture and animal keeping.
7 Siddhicharan Municipality, Okhaldhunga
• Good opportunities for workers both in local and national levels.
• There is demand in informal sector. • 50% increment will be there by next five years. • Difficulty in getting workers • Workers are available from labor market. • Plumber, electrician, mason and carpenters are
in demand. • There is future scope in laundry and restaurant
business.
8 Middle Hill Transport Association, Okhaldhunga
• No demand in local market • Less opportunities of employment in both
sectors • 20% increment in employment opportunities by
next five years • Workers are obtained from the market and
through agents. • Labor, electrician and plumber are in demand. • Even the trained workers need upgrading their
training.
9 Hotel Association of Nepal, Okhaldhunga
• High demand of workers at local level • High scope of workers in both sectors • 25% increment in next five years • Workers are supplied by agents. • Driving is highly demanded. • Lack of quality training
10 Nepal Health Workers' Union, Okhaldhunga
• High demand at local level but not available and those who are there are not competent
• High demand in both sectors • 33.33% in formal and 66.67% in informal
sectors • 50% increment in next five years • Difficulty in getting workers • Agents supply workers. • Demanded occupations are electrician, plumber,
mason, carpenter, ANM, CMA, lab technician,
87 | P a g e
S.N. Organizations Responses Remarks health assistant, nurse and doctor.
• No relevant training • Health and agriculture are growing occupations.
11 FCAN, Okhaldhunga • High demand of skilled workers • Both sectors need skilled workers. • 50% increment in employment opportunities in
next five years • Difficulty to get workers • Workers are hired through contact. • Construction is a high demanding occupation. • No quality training
8.3 Kavrepalanchok S.N. Organizations Responses Remarks 1 FNCCI, Kavre • No skilled workers in NGOs/INGOs
• More workers in hotels and restaurants but they are being minimized and unemployment problem is prevalent.
• No experts in agriculture • People come from other districts in health sector. • Few industries and workers also come from other
districts. • Workers are trained from CTEVT
2 Dhulikhel Municipality
• There are hotels and restaurants and thus more people are being engaged in them.
• NGOs/INGOs are working. • Less workers in municipality
3 FCAN, Kavre • More people are engaged in hotel and restaurants. • Workers are oversupplied. • No industries • Less demand of skilled workers
4 Hotel Association of Nepal, Kavre
• No job in hotel and restaurants • Skilled workers come from national level. • There are many interns working as being trained
by CTEVT. • NGOs/INGOs are functional.
8.4 Dolakha S.N. Organizations Responses Remarks 1 FNCCI, Dolakha • There is demand of skilled workers but are not
easily available. • NGO/INGO and agriculture are the potential
sectors. • There is scope of industries. • Skilled workers produced in this district are being

88 | P a g e
S.N. Organizations Responses Remarks consumed in other districts.
2 DDC, Dolakha • NGO/INGO, construction and hotels are the potential sectors for employment.
• Hydropower project is under construction. • Lack of skilled workers
3 NGO Federation, Dolakha
• NGO/INGO and agriculture are the areas of employment.
• Some skilled workers come outside the district.
4 FCAN, Dolakha • Skilled workers are demanded in NGOs/INGOs and agriculture.
• Need of such workers • No industries • No other projects
8.5 Sindhupalchok S.N. Organization
s
Responses Remarks
1 FCAN, Sindhu • There is demand in NGO/INGO, hotels, tourism and transportation.
• There is demand in both formal and informal sectors.
• Normal growth will be there due to slow growth of industries.
• No availability of skilled workers
2 NGO Federation, Sindhupalchok
• People of the district are leaving due to earthquake and remoteness.
• People work in NGOs/INGOs. • No industries • Trained people are in health sector. • No workers are available. • Workers are needed for reconstruction.
3 Cottage and Small Scale Industries, Sindhu
• Normal demand of workers as it is a hilly district • Labors are demanded for reconstruction. • NGOs/INGOs consume more workers.
8.6 Siraha S.N. Organizations Responses Remarks 1 FNCCI, Lahan • Labors with skills are demanded.
• Brick, ply and agricultural industries consume more skilled workers.
• More people are engaged in informal sector. • No skilled workers
2 NGO Federation • No workers available at local level • People engage in industries.
89 | P a g e
S.N. Organizations Responses Remarks • Informal sector demands more workers. • No skilled workers are available.
3 FCAN, Siraha • High demand of skilled workers. • Industries, agriculture and construction are the
areas to consume skilled workers. • No skilled workers are available.
8.7 Sarlahi S.N. Organizations Responses Remarks 1 FCAN, Sarlahi • High demand of skilled workers
• Informal sector demands more skilled workers. • No skilled workers are available.
2 NGO Federation, Sarlahi
• High demand but workers not available • Agriculture is a prominent sector for
employment. • No skilled workers are available.
3 Hotel Association of Nepal, Sarlahi
• High demand of workers • Agriculture and industries are the areas to
consume skilled workers. • No workers are available.
3 Lalbandi Federation of Industry and Commerce, Sarlahi
• High demand of skilled workers • Industries and construction consume more skilled
workers. • Informal sector demands more workers. • Skilled workers come from all parts of the
country.
4 FNCCI, Hariwan, Sarlahi
• High demand of skilled workers • More people engage in informal sector. • No skilled workers are available. • More labors are demanded.
8.8 Morang S.N. Organizations Responses Remarks 1 DDC, Morang • No demand at local level
• High demand of agriculture workers • Demand in industries and agriculture • No skilled workers • Informal sector demands and consumes more
skilled workers. • Difficulty in getting skilled workers • They come from institutions and labor market. • High demand areas: Health and mechanical, • Medium demand areas: Metal fabrication, house
wiring, plumbing and beautician • Low demand area: handicrafts
2 FCAN, Morang • No skilled workers available at local level

90 | P a g e
S.N. Organizations Responses Remarks • High demand of workers in national level • More people are engaged in informal sector. • 20% employment opportunities will be increased
by next five years. • Engineer and overseer/sub-overseer are
comparatively in demand. 3 Chamber of Industry,
Morang • Local industries have collapsed. • No job for workers • Now raw materials • Informal sector demands more skilled workers. • Workers are hired through ads and from open
market • Garments and daily consuming goods industries
consume more workers. • Fashion design is an upcoming potential area. • Skilled workers are to be produced.
4 Engineers’ Association, Morang
• High demand in engineering • Demand in foreign employment and hotel
occupations. • Informal sector demands and consumes more
skilled people. • Workers are highly demanded in construction,
and transport sectors.
5 Biratnagar Sub-metropolitan City, Morang
• High demand of workers in hotels and physical infrastructure development.
• Building workers are in demand. • High demand in informal sector. • Hire through advertisement and from open
market • High demand in construction sector. • Tourism is an upcoming potential sector.
6 GEFONT, Morang • No work for labors • No employment both in formal and informal
sectors • Informal sector demands more people.
7 Health Workers' Union, Morang
• No sufficient workers at local level • Pharmacy, lab, tourism and industries are the
potential areas for employment. • Informal sector consumes more workers.
8 NGO Federation, Morang
• Lack of skilled workers • Workers not available at local level • Government service, NGOs and industries are the
areas for employment. • Social mobilizers, salespersons are in demand. • Informal sector demands more skilled workers. • Workers are not easily available.
9 HAN, Morang • No jobs in hotel business
91 | P a g e
S.N. Organizations Responses Remarks • Informal sector demands more workers. • Workers are hired through ads, personal relation,
returnees and training institutions.
8.9 Udayapur S.N. Organizations Responses Remarks 1 FNCCI, Udayapur • No demand of workforce
• 70% formal and 30% informal • Engineers, overseers and lab assistants are in
demand. • CTEVT and other institutions supply workers.
2 Cottage Industries, Udayapur
• Lack of masons and carpenters • Informal sector is growing. • 60% formal and 40% informal • Masons and carpenters are demanded most.
3 Nepal Government Official Union
• Low jobs available at local level • 80% formal and 20% informal opportunities • Construction and agriculture sectors demand
more workers.
4 DDC, Udayapur • Workers easily available at local level • 80% formal and 20% informal opportunities
8.10 Ilam S.N. Organizations Responses Remarks 1 DDC, Ilam • Skilled workers are available.
• 60% formal and 40% informal opportunities • Engineers, agro-technicians and vet doctors are in
demand.
2 FNCCI, Ilam • Workers are available at local level. • Opportunities are there in both sectors. • Engineers and agriculture technicians are in
demand.
3 HAN, Ilam • Jobs are available in the sector. • Cooks, waiters and helpers are in demand. • Combined training of cook, waiter and bellboy
should be provided.
4 Tea and Coffee Development Board
• High demand of skilled workers • 60% workers engage in formal sector and 40% in
informal. • 75% increment will be there both in formal and
informal sector in next five years. • Tea experts and agriculture technicians are in
demand.
5 Ilam Municipality, Ilam
• Lack of skilled workers • Lack of training institutions and lack of specific

92 | P a g e
S.N. Organizations Responses Remarks skilled workers
• High demand and high employment opportunities • Formal and informal both sectors prominently
consume skilled workers. 8.11 Jumla S.N. Organizations Responses Remarks 1 FCAN, Jumla • Normal demand of workers
• Workers are available. • Informal sector is demanding. • 75% are employed.
2 HAN, Jumla • Lack of workers • More demands in informal sector.
3 FNCCI, Jumla • No work • Informal sector is demanding. • Herbal processing has future scope.
4 Engineers’ Association, Jumla
• No employment • More opportunities in formal sector • Lack of workers in hotel and tourism sectors
8.12 Parsa S.N. Organizations Responses Remarks 1 Health Professional
Union of Nepal • High demand both in local and national levels in
health sector • After provincial set up, a huge number of
workforce will be required. • Workers are hired though advertisement • Doctors, pharmacists and nurses are demanded
2 NGO Federation, Parsa
• High demand in local and national levels • Formal and informal both sectors demand more
skilled workers • Demand will be increased tremendously by five
years
3 Cottage Industry, Parsa
• Trainings are demanded for cottage industries • No workers are available • Both formal and informal sectors have demand of
skilled workers • Workers are hired through advertisement • Paper bag making is most demanded
4 FCAN, Parsa • High demand in local and national markets • Both formal and informal sectors are equally
important for employment opportunities • Workers are hired through advertisement and
contact • Engineers and computer operators are demanded
93 | P a g e
S.N. Organizations Responses Remarks 5 FNCCI, Parsa • High demand in local and national markets
• Both formal and informal sectors are equally important for employment opportunities
• Workers are hired through advertisement and contact
• Engineers and computer operators are demanded
6 HAN, Parsa • High demand in local and national markets • Both formal and informal sectors are equally
important for employment opportunities • Workers are hired through advertisement and
contact • Engineers and computer operators are demanded
7 Nepal Engineer Association, Parsa
• High demand in local and national markets • Both formal and informal sectors are equally
important for employment opportunities • Workers are hired through advertisement and
contact • Engineers and computer operators are demanded
8 GEFONT, Parsa • High demand in local and national markets • Both formal and informal sectors are equally
important for employment opportunities • Workers are hired through advertisement and
contact • Engineers and computer operators are demanded
9 Nepal Trade Union Congress, Parsa
• High demand in local and national markets • Both formal and informal sectors are equally
important for employment opportunities • Workers are hired through advertisement and
contact • Engineers and computer operators are demanded
8.13 Surkhet S.N Organizations Responses Remarks 1 FNCCI, Surkhet • Demand of modern skills
• Informal sector such as agriculture, herbal and tourism demand more skill workers
• Over supply of skilled workers • New area of employment needs to be explored
and train people accordingly
2 Trade Union Congress, Surkhet
• High demand of skilled workers • Informal sector is most prominent for
employment opportunities • Demand of skilled workers will be increased upto
200% by next five years • Workers come from adjoining districts and even
from India

94 | P a g e
S.N Organizations Responses Remarks • Cement industry, Upper Karnali and hotel
restaurants are the areas for employment
3 Akhil Nepal Trade Union, Surkhet
• High demand of skilled workers in the local market. Due to unavailability of such workers, Indian workers have been employed
• Informal sector demands more skilled workers • Employment opportunity will be increased by 15
% in the next five years • Agriculture sector is promising for employment • Graduates of training are found with quality skills
4 Engineer Association, Surkhet
• Good local market for skilled workers • Formal and informal both demand skilled
workers • Gradual increment of employment opportunities • Construction sector demands more skilled
workers • Quality graduates who are trained
5 NGO Federation • High demand • Informal sector is promising • Demand will be increased • Sewing, cutting, beautician are most demanded
training areas • Practical exposure is to be focused • Agriculture sector demands more skilled workers
6 HAN, Surkhet • Sewing, cutting, beautician are most demanded training areas
• Practical exposure is to be focused • Agriculture and tourism sectors demands more
skilled workers
8.14 Palpa S.N Organizations Responses Remarks 1 District Coffee
Cooperative Federation, Palpa
• Enough workers • Trained workers are with quality skills • Less demand even in future for coffee production
2 District Vegetable Federation, Palpa
• Demand of agri-technicians • Weak policy • No effective role of technicians • Need of research centers for hybrid seeds • No skilled workers for making tunnel and green
homes • No skilled workers are available
3 District Ginger Federation, Palpa
• Workers are over supplied • No market • No training
4 Nepal Cottage and • High demand of skilled workers
95 | P a g e
S.N Organizations Responses Remarks Small Industries Federation, Palpa
• No people are getting training • High turnover due to overseas employment
5 FCAN, palpa • Work is done through contract • Workers learn skills themselves and work • No training is available • 35% in formal and 65% in informal sector
occupy employment opportunities
8.15 Rupandehi S.N Organizations Responses Remarks 1 NGO Federation,
Rupandehi • High demand of skilled workers are needed for
NGOs • Areas of workers in need are management,
tailoring, veterinary, proposal/report writing, NGO management, cooperative, sanitation and pump operators
2 FCAN, Rupandehi • High demand of skilled workers • Labors learn skills and work as technician • No agencies working to connect market and
workers • Some workers are trained by CTEVT • Workers are hired through personal contact • More workers are flying overseas as a result
workers are not easily available.
3 Nepal Engineers' Association, Rupandehi
• CTEVT graduates are modest in quality. They lack practical knowledge
• More Indian workers working • 30% formal and 70% informal employment
opportunities are there in the district
4 FNCCI, Rupandehi • Lack of training at worker level • 40% in formal and 60% in informal employment
opportunities • Efficiency of workers is medium type • Workers are to be prepared as per changing
technology • More than 1600 technicians are in demand alone
in Rupandehi district
5 Trade Union Congress, Rupandehi
• Workers are over supplied • Employment opportunities are: 35% formal and
65% in informal sectors
6 HAN, Rupandehi • Workers are over supplied in hotel sector • More than 2000 workers are needed in Rupandehi • Employment opportunities are 33% and 67% in
formal and informal sectors respectively

96 | P a g e
8.16 Kailali S.N Organizations Responses Remarks 1 CPN-UML Party
Office, Kailali • After the earthquake, huge demand of workers
both in local and national levels • Hotel: 70% formal and 30% informal,
Construction: 30% formal and 70% informal and Agriculture: 60% formal and 40% informal
• In next five years, 50,000 workers in formal and 20,000 workers in informal sectors needed
• CTEVT should focus on quality production. • More Indian workers are there. • Nursing, engineering and agriculture are more
demanded areas. • Instructors are to be qualified, and monitoring
and supervision should be more effective.
2 FNCCI, Kailali • High demand of skilled workers at local level • Hotel: 70:30 percent in formal/informal, Resort:
55:45 percent in formal/informal and Beautician: 40:60 in formal/informal sectors
• In next five years, 60,000 workers needed in formal and 25,000 in informal sectors
• Moderate level of availability of workers
3 Nepali Congress Party Office, Kailali
• Lack of skilled workers at local level • Agriculture: 65% formal and 35% informal • Hotel: 70% formal and 30% informal • Industry: 30% formal and 70% informal • In next five years, the demand will be 80,000 in
formal and 30,000 in informal sectors. • IT, agriculture, hydropower and forestry are the
areas where more skilled workers will be demanded.
4 FCAN, Kailali • High demand of skilled workers at local level • Road: 10% formal and 90% informal • Construction: 20% formal and 80% informal • In next five years, 5,000 workers in formal and
50,000 in informal sectors will be demanded. • Lack of skilled workers • Carpenters, masons, plumbers, electricians and
textile mechanics are in demand.
5 Cottage and Small Industries Federation, Kailali
• High demand of skilled workers at local level • Agriculture: 30% formal and 70% informal • Poultry farm: 40% formal and 60% informal • Beauty parlor: 85% formal and 15% informal • In next five years, 5,500 workers in formal and
70,000 in informal sectors will be demanded . • Lack of skilled workers • Carpenters, masons, plumbers, electricians and
textile mechanics are in demand.
97 | P a g e
S.N Organizations Responses Remarks 6 NGO Federation,
Kailali • High demand of skilled workers at local and
national levels • NGOs: 60% formal and 40% informal • In next five years, demand will be increased
gradually. • Lack of skilled workers • Carpenters, masons, plumbers, electricians and
textile mechanics are in demand. • CTEVT graduates are moderate in quality. • Some workers are still coming from India.
Annex 9: List of the Key Informants Interviewed
S.N. Name Designation Organization Contact Number
1 Laxmi Rai Registrar Nepal Nursing Council 9851079517 2 Khub Narayan
Biswas Administration Officer Nepal Health Professional
Council 9841427318
3 Nava Karki Senior Administration Officer
Hotel Association of Nepal 9841273353
4 Shraddha Chhetri Chief Media Officer Nepal Association of Tour and Travel Agents
01-4418661
5 Karna Bahaduur Lama
General Secretary Trekking Association of Nepal
9841529747
6 Bhanu Raj Shrestha Manager Nepal Telecom 01-4784006 7 Ram Mani Pokharel Office Secretary Nepal Trade Union
Congress 9841350960
8 Krishna Bahadur Pokharel
Chief Executive Officer
Federation of Construction of Nepal
-
9 Hari Datta Joshi Vice-president GEFONT 9741150985 10 Nabin Pokharel Senior Assistant
Manager Nepal Tourism Board -
11 Mukunda Pd. Sapkota
Officer Nepal Electricity Authority 01-4153089
12 Hansha Ram Pandey Director Federation of Nepal Chamber of Commerce and Industry
9851007125
13 Kishor Acharya Chairman Trade Union Congress, Dang
9857832372
14 Yadav Choudhary Secretary FCAN, Dang 082-605072 15 Ganga Mani Sharma Officer CSI, Dang 082-560004 16 Prem KC Information Officer Ghorahi Municipality,
Dang 082-560700
17 Basudev Acharya Plan &Admin Officer DDC 082-565050 18 Suraj Budhathoki Officer FNCCI, Dang 082-560630 19 Rudra Bahadur
Dangi Chairman Hotel Association, Dang 9847913510
20 Indra Kumaar Dhital Chairman Diploma Engineers' Association
9857832788
21 Kul Bahadur - FCAN, Khandbari 9842094105

98 | P a g e
S.N. Name Designation Organization Contact Number
Shrestha 22 Khem Raj Niroula - Khandbari Municipality 9852051707 23 Gobardhan Tikhatri - NEPPC Union, Khandbari 9841451272 24 Ram Sharan Acharya - DDC, Khandbari 029-560045 25 Ramesh Bhattarai - FNCCI, Khandbari 9852051734 26 Hariswor Thapa - Association of Transport 9852023821 27 Mani Rasaili ` Sankhuwasabha Gold and
Silver Business Association
9860534065
28 Man Bahadur Limbu - NGO Federation, Khandbari
9852051608
29 Nava Raj Dahal - GEFONT, Okhaldhunga 9842929259 30 Lekha Nath Fuyal - Akhil Trade Union,
Okhaldhunga 9842972784
31 Prakash Kattel - NGO Federation, Okhaldhunga
9842929158
32 Yuba Raj Gajmer - Association of Gold and Silver Business, Okhaldhunga
974306333
33 Gyanendra Rumdali - Trade Union Congress, Okhaldhunga
9852840400
34 Gyanendra Maske - FNCCI, Okhaldhunga 9842931344 35 Rajan Ghimire - Siddhicharan Municipality 037-520213 36 Milan Khatri - Middle Hill Transport
Association, Okhaldhunga 037-520630
37 Thagendra Raj Rai - Hotel Association, Okhaldhunga
9842563802
38 Indira Goutam - Nepal Health Workers' Union
9852840593
40 Dil Bahadur Shrestha Chairman FNCCI, Kavre 9851020903 41 Shankhabudha Lama Chairman FCAN, Kavre 9851054939 42 Prem Kantha
Shrestha Chairman HAN, Kavre 011-490114
43 Rajeswor Manandhar Chairman FNCCI, Dolakha 049-421218 44 Sita Pariyar LDO DDC, Dolakha 049-421142 45 Dharmendra Moktan Chairman NGO Federation, Dolakha 9851026056 46 Rameswor Upreti Chairman FCAN, Dolakha - 47 Lil Bahadur Thapa Chairman FCAN, Sindhupalchok 9851098242 48 Bijaya Shrestha Chairman NGO Federation,
Sindhupalchok 9851160381
49 Kalpana Sharma Chief CSIB - 50 Ashok Agrawal Chairman FNCCI, Lahan 9852830251 51 Gobinda Bista Chairman NGO Federation, Siraha 9842825946 52 Rash Lal Raya
Yadav General Secretary FCAN, Siraha 9852832000
53 Surendra Pd. Singh Chairman FCAN, Sarlahi 9744016248 54 Yadav Sarkar Chairman NGO Federation, Sarlahi 9842825946 55 Baikuntha Sapkota Chairman HAN, Sarlahi - 56 Nava Raj Mishra Chairman FNCCI, Lalbandi 9854037137 57 Ram Bhakta Shrestha Chairman FNCCI, Hariwan 9854035126 58 Gopi Pd. Ghimire Chief Officer Morang 021-472964
99 | P a g e
S.N. Name Designation Organization Contact Number
59 Pralhad Pokharel Member FCAN, Morang - 60 Shiva Shankar
Agrawal Chairman CIM, Morang -
61 Binod Ojha Member Engineer Association - 62 Punam Dahal Chief, Social
Development Biratnagar Sub-metropolitan City
-
63 Kishor Dhamala Chairman GEFONT - 64 Pitambar Osti Acting LDO DDC, Morang 9852022501 65 Bhola Shankar Giri Member Health Workers'
Union -
66 Umesh Biswokarma Central Member NGO Federation 9842026900 67 Nimesh Pokharel Member Secretary HAN, Morang - 68 Gajendra Kumar
Bhagat Chairman FNCCI, Udayapur 9852835031
69 Gopal Pd. Sharma Director CSIB, Udayapur 035-820202 70 Man Bahadur Ban Chairman GoN Official Union 9842825078 71 Shyam Kumar
Sundas Administration Assistant
DDC, Udayapur 9842882941
72 Chhabi Lal Khatiwada
Administration Officer
DDC, Ilam 027-520848
73 Hemanta Goutam Chairman FNCCI, Ilam 9852680170 74 Yam Kumari Limbu Saving worker HAN, Ilam 027-521692 75 Dev Kumar Singh Planning Officer Tea and Coffee Board 9852681831 76 Bhimir Shrestha Ilam Municipality,
Ilam Urban Dev. Expert 9841336854
77 Ashok Kumar Shrestha
Chairman FCAN, Jumla 9848300597
78 Tilak Mahat - HAN, Jumla 9868345825 79 Paras Upadhyaya Chairman FNCCI, Jumla 9848355790 80 Nripa Raj Joshi Chairman Engineers’
Association, Jumla -
81 Sudip Lama - Nepal Health Worker, parsa
9845197951
82 Ajaya Kuswaha - NGO Federation 9851174904 83 Basanta Magar - CSIB, Parsa - 84 Ramananda
Chourasiya - FCAN, Parsa -
85 Pradip Kediya - FNCCI, Parsa 9855021686 86 Dipak Man Shrestha - HAN, Parsa 051-527777 87 Suresh Thakur - NEA, Parsa 9845230764 88 Yagya Bdr. Khadka - DDC, Parsa 9841340123 89 Ramananda Kurmi - GEFONT, Parsa 9804227308 90 Bala Ram Kurmi - NTUC, Parsa 9855021243 91 Tanka K. Shrestha Chairman FCAN, Dhading 9851082368 92 Raja Ram Silwal Chairman HAN, Dhading - 93 Damodar Aryal Chairman Genchha Cooperative 9751020450 94 Rohit Bhandari Office Chief FNCCI, Dhading 9851177844

100 | P a g e
S.N. Name Designation Organization Contact Number
95 Kumar Dhakal Planning Chief Nilakantha Municipality, Dhading
9841526538
96 Kol Prasad Gautam Information Officer DDC, Dhading - 104 Ganesh Karki Program Coordinator CNCCI, Surkhet 083-520300 105 Samrat Goutam Chairman Trade Union
Congress, Surkhet 9802051810
106 Yam Raj Malla Member ANTU, Surkhet 9848123270 107 Miti Lal Gupta Treasurer NEA, Surkhet 9848028240 108 Hari Adhikari Chairman NGO Federation,
Surkhet 9848022286
109 Yogendra S. Thapa Member HAN, Surkhet 9858050163 110 Ek Prasad Bhandari Chairman District Coffee
Cooperative, palpa -
111 Tri Ratna Shakya Chairman NSCSI Fed. Palpa 9847029525 112 Barun Prasad Regmi Member FCAN, Palpa - 113 Krishna G.C. Chairman District Ginger
Federation, Palpa -
114 Tika Ram Bhandari Member District Vegetable Federation, Palpa
-
115 Sumitra Sharma Chairman NGO Federation, Rupandehi
9857028021
116 Top Bahadur Rayamajhi
Chairman FCAN, Rupandehi -
117 Dhani Ram Choudhary
Member NEA, Rupandehi -
118 Mahesh Man Singh Chairman FNCCI, Rupandehi 9857020534 119 Samundar G.C. Chairman HAN, Rupandehi 9847033389 120 Kaji Man Shrestha Chairman Trade Union
Congress, Rupandehi 9851025160
125 Him Karna B.K. Chairman NGO Federation, Kailali
9848427337
101 | P a g e
Annex 10: Projection Sheets for Private Formal Sector SN Name of Occupation Estimated Figure of
Currently Working Annual Requirement
1 Production Skilled Labour 120,000 17,000
2 Mason 82,000 10,000 3 Carpenter 80,000 10,000 4 Social Mobilizer 75,000 10,000 5 Weaver 72,000 8,000 6 Electrician 45,000 5,000 7 Beautician 38,000 10,000 8 Driver 36,000 4,000
9 Plumber 34,000 3,500 10 Mechanic 30,000 7,000 11 Tailoring 28,000 5,000 12 Parlor 21,000 2,000
13 Machine Operator 21,000 2,500 14 Supervisor 18,000 2,500 15 Brick Molding 17,000 2,500 16 Loader 17,000 2,000 17 Miller 16,000 4,000 18 Overseer 15,000 2,200 19 Mobile Repairer 13,000 4,000 20 CMA 12,000 2,000
21 Staff Nurse 12,000 3,000 22 Computer Operator 11,000 2,000 23 Production Operator 11,000 1,500 24 JTA (Agriculture) 10,000 3,000
25 Metal Sculpture 10,000 4,500 26 Welder 10,000 2,700 27 Packaging Staffs 9,000 2,200 28 Dairy Assistant 8,000 1,200 29 Weaver/Tailor 8,000 1,000 30 Baker 8,000 2,200 31 Mechanical Engineer 7,500 800 32 Pharmacist 7,000 1,200
33 Wood Carving 7,000 1,500 34 Gardener 7,000 1,800 35 Computer Technician 7,000 3,400 36 Waiter 7,000 1,000
37 Technician 6,500 1,000 38 Ticketing 6,000 800 39 Engineer 6,000 800 40 ANM 6,000 800 41 Poultry Worker 5,500 800

102 | P a g e
SN Name of Occupation Estimated Figure of Currently Working Annual Requirement
42 Health Assistant 5,500 800 43 Lab Technician 5,200 750 44 Cutting 5,000 700 45 Heavy Equipment Operator 4,700 700 46 B.P.H. 4,500 600
47 B. Pharma 4,200 600 48 Steel Craft Maker 4,200 600 49 Radiographer 4,000 570 50 Field Tourist Guide 4,000 570
51 Security Guard 4,000 560 52 Fiber Processer 4,000 550 53 Thanka Painter 1,200 200 54 Veterinary Technician 4,000 500 55 Fashion Designer 4,000 530 56 Leather Shoes/Craft Maker 4,000 530 57 Sub-overseer 3,500 500 58 Cook 3,500 500
59 Bamboo Furniture Maker 3,500 500 60 Washer Man 3,300 500 61 Engineer 3,300 500 62 Housekeeper 3,000 400
63 Painter 3,000 400 64 Repairer Assistant 3,000 400 65 Doctor 2,800 400 66 Receptionist 2,600 400 67 Potter 2,500 350 68 Program/ Institutional Facilitator 2,300 350 69 General Medicine 2,300 350 70 Lab Assistant 2,200 300
71 Dyeing 2,200 300 72 Carton Box Maker 2,100 300 73 Trainer 2,100 300 74 Livestock Technician (Junior) 2,000 300
75 Pathologist 1,800 250 76 Cabin Crew 100 15 77 Civil Engineer Teacher 1,800 250 78 Public Health Teacher 1,800 250 79 Binding 1,800 250 80 Metal Engineer 1,800 250 81 Butcher 1,800 250 82 Sewing 1,800 250
83 Painter 1,800 250 84 General Technician 1,700 230
103 | P a g e
SN Name of Occupation Estimated Figure of Currently Working Annual Requirement
85 AME 1,500 230 86 Veterinary JTA (Senior) 1,500 230 87 Molding + Baking 1,400 200 88 Seed Technician 1,400 200 89 Paper Maker 1,400 200
90 TV/Radio Repairer 1,400 200 91 Program Officer 1,400 190 92 Refrigeration Department 1,400 190 93 Doll Maker 1,400 190
94 Rafting Guide 1,300 180 95 Electronic Technician 1,300 180 96 Computer Teacher 1,300 175
97 Entrepreneurship Development Facilitator
1,100 165
98 Nepali Paper Processor 1,100 150 99 Maintenance 1,100 150
100 Inspector 1,000 150 101 Carpet Fitting 1,000 150 102 Product Technician 1,000 150 103 Fish Feeding 1,000 150 104 Computer Engineer 1,000 150 105 Beekeeper 1,000 140 106 Caretaker 900 130
107 Airport Operator 300 30 108 Pilot 900 120 109 Ice-cream Maker 800 120 110 Fitter 800 120 111 Grinding 800 110 112 Front Office 800 100 113 Finisher 800 100 114 Assistant Manager 800 100 115 Computer Hardware/Software 800 100 116 Technical Teacher 700 100 117 Officer Staff 700 100 118 Quality Control 700 100
119 Agro-forest Technician 700 100 120 Filter 700 100 121 Fish Technician 700 100
122 Furniture Colourer 700 Not Applicable 123 Hatchery Technician 700 Not Applicable 124 Ground Control 700 Not Applicable 125 Reservation 600 Not Applicable 126 Mixing Operator 600 Not Applicable

104 | P a g e
SN Name of Occupation Estimated Figure of Currently Working Annual Requirement
127 Site In-charge 600 Not Applicable 128 B. Nursing 600 Not Applicable 129 Teacher 600 Not Applicable 130 R&D In-charge 600 Not Applicable 131 Electrical Engineer 500 Not Applicable 132 Agriculture Technician 500 Not Applicable 133 Early Childhood Development 500 Not Applicable 134 Child Friendly Skills 500 Not Applicable 135 Sweeper 500 Not Applicable 136 Operator 500 Not Applicable 137 Denting 500 Not Applicable 138 B. Sc. Ag. 500 Not Applicable 139 Agriculture Teacher 500 Not Applicable 140 Coordinator 500 Not Applicable 141 Wiring 500 Not Applicable 142 I. Sc. Ag. 500 Not Applicable 143 Electrical Appliance Repairer 500 Not Applicable 144 Software Engineer 500 Not Applicable 145 Parenting Orientation 450 Not Applicable 146 Transportation Department 450 Not Applicable 147 Ophthalmic Assistant 450 Not Applicable 148 Shift In-charge 450 Not Applicable 149 X-ray Technician 400 Not Applicable 150 Servicing Mechanic 400 Not Applicable 151 Special Potter 400 Not Applicable 152 Sorting Manager 400 Not Applicable 153 Sandwich Maker 400 Not Applicable 154 Special Diploma 400 Not Applicable 155 Veterinary Doctor 400 Not Applicable 156 Room Maid 600 Not Applicable 157 Health Teacher 350 Not Applicable 158 Mountaineering Guide 350 Not Applicable 159 Food and Beverage 350 Not Applicable 160 Nepali Mat Weaver 350 Not Applicable 161 Steel Cutter 350 Not Applicable 162 M. Pharma 350 Not Applicable 163 Medical Technician 350 Not Applicable 164 Eye Assistant 350 Not Applicable 165 Fabricating 350 Not Applicable 166 Junior helper 350 Not Applicable 167 CAF 350 Not Applicable 168 Auto Mechanics 350 Not Applicable 169 Mechanical Engineer 350 Not Applicable
105 | P a g e
SN Name of Occupation Estimated Figure of Currently Working Annual Requirement
170 Laundry Boy 350 Not Applicable 171 Entrepreneurship Trainer 250 Not Applicable 172 B. Pharma 250 Not Applicable 173 Ophthalmic Officer 250 Not Applicable 174 Pallet Operator 250 Not Applicable 175 Technical Officer 250 Not Applicable 176 AHW 250 Not Applicable 177 Pashmina Weaver 250 Not Applicable 178 Counter 250 Not Applicable 179 Flight Dispatcher 200 Not Applicable 180 Medical Representative 200 Not Applicable 181 Land Surveyor 200 Not Applicable 182 D. Pharma 200 Not Applicable 183 Lathe Operator 200 Not Applicable 184 Dying 200 Not Applicable 185 Print Designer 200 Not Applicable 186 Baidya 200 Not Applicable 187 Medical Officer 200 Not Applicable 188 Electrical Engineering 150 Not Applicable 189 Civil Engineer 150 Not Applicable 190 Bellboy 150 Not Applicable 191 Thread Processor 150 Not Applicable 192 Ironing 150 Not Applicable 193 Chemical Engineer 150 Not Applicable 194 Roll Man 150 Not Applicable 195 Mechanical Engineer 150 Not Applicable 196 Junior Fitter 150 Not Applicable 197 Health Assistant Teacher 150 Not Applicable 198 Room Boy 150 Not Applicable
199 M. Sc. Ag./ Agriculture Engineer/ Ag. Teacher
150 Not Applicable
200 Meter Reader 100 Not Applicable 201 Sub-pump Operator 100 Not Applicable 202 Agriculture Assistant Teacher 100 Not Applicable 203 Eye Doctor 100 Not Applicable 204 B. Pharma 100 Not Applicable 205 Computer Software 100 Not Applicable 206 Hardware Engineering 100 Not Applicable 207 Diner 100 Not Applicable 208 Sorting 100 Not Applicable 209 Stacking 100 Not Applicable 210 Oven Operator 100 Not Applicable 211 Boiler Operator 100 Not Applicable 212 Mobile Crane Operator 100 Not Applicable
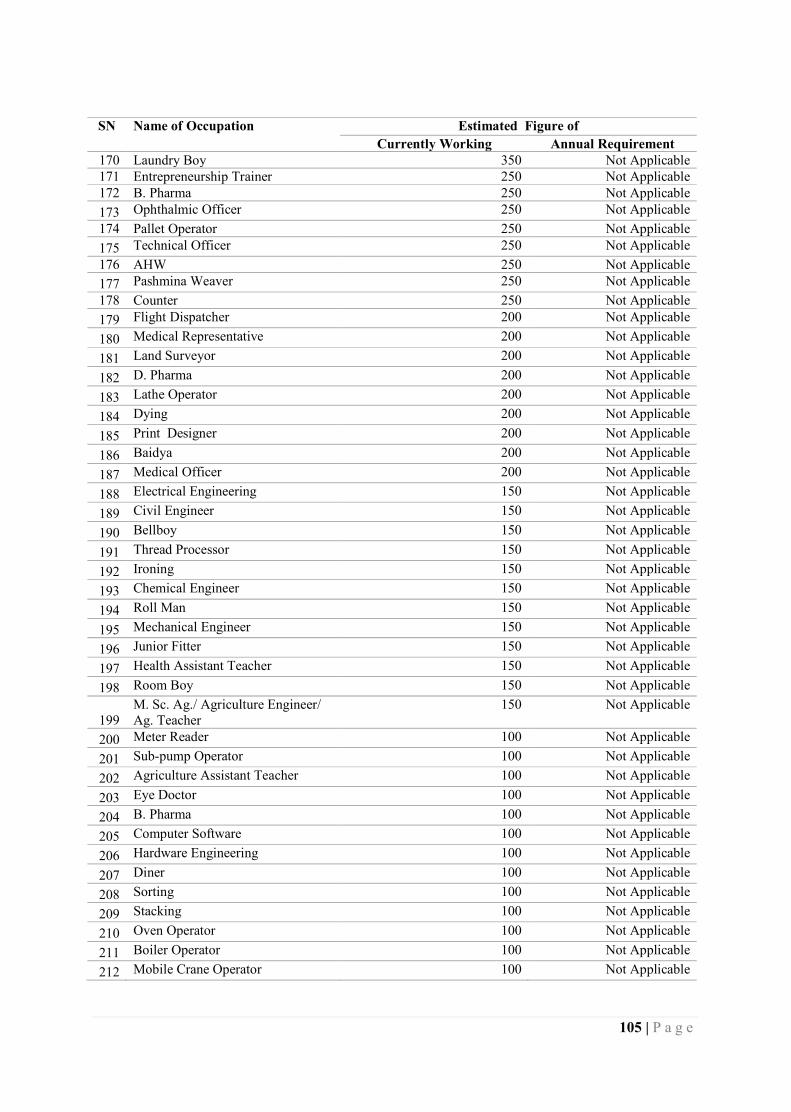

106 | P a g e
Annex 11A : Questionnaire
Council for Technical Education and Vocational Training Sanothimi, Bhaktapur
Labour Market Survey to Identify the Emerging Needs of Technical Human Resources in the Country
Questionnaire for Enterprises
Dear Entrepreneurs, Availability of skilled human resources as per the need of labour market is the foundation for overall economic development of the country. A wide range of actors of society including government, individual trainees and their families, business community and industries can be benefited by the market relevant skills training; however, there exists some gap between the skills of the workforce and needs of employers. This study is, therefore, designed to bridge this gap by identifying the actual needs of employers. The information you provide is just for macro level analysis which will not be used for any other purpose. CTEVT, therefore, requests and expects actual information of your enterprise regarding the availability and needs of skilled human resources. Many thanks for your cooperation!
- CTEVT, Research and Information Division
Name of the Interviewer: Date of Interview:
Section 1: Basic Information a. Name of the Employment Unit: b. Address: c. Contact Numbers: d. Establishment Year:
e. Name of the Sector f. Name of Sub-sector (Please refer annex 1 for list of sub-sector)
Occupational Employment Unit Economical
1. Engineering 2. Agricultural
3. Tourism 4. Health
Section 2: Employment-related Information 1. What is the total number of staffs in your company/ enterprise? ____Males ____Females 2. Please provide the disaggregated information regarding the technical staffs as per the following table?
3. C
urre
nt W
orkf
orce
Name of Occupations
Gender-wise Engagement Type Type of TVET /Qualification Total
Male Female Full-time Part-time Dip TSLC Vocational
107 | P a g e
4. In-service training received by the technicians (in last FY)
Type of Training Number of Trained Staffs
5. Growth status of business in last 5 years? (Based on observation)
1. Booming 1. Status quo 2. Shrinking
Mention reasons for specific response in Q5:
6. Growth prospects of the business in next 5 years? (Based on their opinion)
1. Booming 2. Status quo 3. Shrinking
Mention reasons for specific response in Q6: 7. Have you developed any business plan for coming years?
1. Yes 2. No
If yes, please mention number of years _____years
8. H
ow m
any
new
staf
f will
you
hire
in
next
fiv
e ye
ars?
Name of Occupations
Gender-wise Engagement Type Type of TVET /Qualification Total
Male Female Full-time Part-time Dip. TSLC Vocational
9. How many additional staffs were recruited or made redundant during the last year?
Recruited Made Redundant
Occupation No. Occupation No.

108 | P a g e
10. Availability of required human resources
Over-supplied Moderate Supply Under-supplied
What is the reason for your response? Over-supplied or Under-supplied
Reasons:
11. What is the average proficiency level of the staffs?
Very Poor Poor
Satisfactory Good
Excellent
If you are not satisfied, please mention the reasons?
12. What are the major skills gaps with the existing staff?
Name of Occupation Gap Area
13. Could you mention probability of any technological innovations at this sector in near future? Please mention.
1 Yes, I see some probability. 2 No, I don't see any probability.
14. What are the new skills/occupations that possibly appear in near future?
109 | P a g e
Occupational sub-sector: Occupational Sub-sector
1. Automobile 2. Business/
Service 3. Computer 4. Construction 5. Construction
Equipment 6. Electrical 7. Electronics 8. Forestry 9. Handicrafts 10. Health
Employment Unit Sub-sector 1. Banks & Finance 2. Industries 3. Cottage industries 4. Contractor Agencies 5. Hospitals 6. Polyclinics/Pathologies 7. Pharmacies 8. Pharmaceutical
Industries 9. INGOs/NGOs 10. Education /Training
Institutions 11. Hotels/Resorts 12. Travel/Trekking/ Rafting
Agencies
Economic Sub-sector 1. Agriculture 2. Fishing 3. Mining & Quarrying 4. Manufacturing 5. Electricity, Gas and Water 6. Construction 7. Wholesale and Retail Trade 8. Hotel and Restaurant 9. Transport Storage and
Communication 10. Financial Intermediation 11. Real Estate Renting and Business
Activities 12. Public Administration and
Defense 13. Education 14. Health and Social Work 15. Other Community, Social and
Personal Service

110 | P a g e
Annex 11B: Checklist for FGD and KII Name of the Interviewer: Date of Interview:
Name of the Interviewee (Key Informant):
Name and Address of Organization:
Designation: Contact No.:
Sector: Sub-sector:
1. Introduction and Rapport Building
2. Sharing of Objective
3. What is the situation of national and local demands of workforce in the sector?
4. Where are the employment opportunities of the sector, both formal and informal sector?
5. How many numbers are employed in formal sector and how many of them in informal sector?
6. What will be the growth trend and demand for the coming 5 years in both formal and informal sector?
7. Are the workforces readily available?
8. From where do we get the workforce?
9. What are the most demanded occupations? And what is the number of workforce demand in each occupation?
10. Are the skills acquired in the training institutes adequate (quality of training)? If not, what are the major missing skills gaps?
11. What are the new emerging occupations in the sector?
12. Any suggestions regarding the training?
111 | P a g e
Annex 12: List of Participants of Interaction Program

112 | P a g e
113 | P a g e

112 | P a g e
113 | P a g e

114 | P a g e
115 | P a g e

114 | P a g e
115 | P a g e