labour market statistics - home : scottish parliament executive summary this briefing gives an...
TRANSCRIPT
The Scottish Parliament and Scottish Parliament Infor mation C entre l ogos .
Financial Scrutiny Unit Briefing
Labour Market Statistics 06 December 2013
13/80
Andrew Aiton
A brief overview of Scottish, UK and international labour market statistics

2
CONTENTS
EXECUTIVE SUMMARY .............................................................................................................................................. 3
INTRODUCTION .......................................................................................................................................................... 4
SOURCES OF INFORMATION .................................................................................................................................... 4
LABOUR FORCE SURVEY (LFS) ........................................................................................................................... 4 ANNUAL POPULATION SURVEY (APS) ................................................................................................................ 5 ANNUAL SURVEY OF HOURS AND EARNINGS (ASHE) ..................................................................................... 5 NOMIS ...................................................................................................................................................................... 5 INTERNATIONAL STATISTICS ............................................................................................................................... 6
DEFINITIONS OF LABOUR MARKET TERMS .......................................................................................................... 6
UNEMPLOYMENT ................................................................................................................................................... 6 EMPLOYMENT ........................................................................................................................................................ 6 ECONOMICALLY INACTIVE ................................................................................................................................... 7 CLAIMANT COUNT.................................................................................................................................................. 7 UNDEREMPLOYMENT ........................................................................................................................................... 8
WELFARE REFORMS AND CLAIMANT COUNT DATA ........................................................................................... 8
LABOUR MARKET STATISTICS AND SCOTLAND PERFORMS ............................................................................ 9
FREQUENTLY ASKED QUESTIONS (FAQ) ............................................................................................................ 11
1. WHEN ARE FIGURES RELEASED? ................................................................................................................. 11 2. WHAT IS THE DIFFERENCE BETWEEN UNEMPLOYMENT AND ECONOMIC INACTIVITY? ..................... 11 3. HOW CAN UNEMPLOYMENT AND EMPLOYMENT GO UP AT THE SAME TIME? ...................................... 11 4. WHAT IS SEASONAL ADJUSTMENT? ............................................................................................................. 12 5. HOW DO I ACCESS CONSTITUENCY DATA? ................................................................................................ 12 6. CAN I COMPARE THIS MONTHS LFS FIGURES WITH LAST MONTHS? ..................................................... 13 7. WHAT IS THE BEST WAY TO DESCRIBE THE CHANGE FROM THE PREVIOUS FIGURES?.................... 13 8. HOW CAN I ACCESS YOUTH UNEMPLOYMENT FIGURES? ........................................................................ 14
APS .................................................................................................................................................................... 14 LFS ..................................................................................................................................................................... 14 Claimant count data ........................................................................................................................................... 14
ANNEX A – HOW TO ACCESS THE FIGURES ....................................................................................................... 15
ONS ........................................................................................................................................................................ 15 NOMIS .................................................................................................................................................................... 16
SOURCES .................................................................................................................................................................. 17
RELATED MATERIAL ............................................................................................................................................... 20

3
EXECUTIVE SUMMARY
This briefing gives an overview of Scottish, UK and international labour market statistics. It signposts users to sources of labour market data, provides definitions of the key measurements, and discusses the implications of the introduction of Universal Credits to the availability of future claimant count data. It also examines the Scottish Government‟s Scotland Performs framework and how labour market statistics are used in measuring the government‟s success on specific targets. A Frequently Asked Questions section is included based on some of the more common labour market statistics enquiries received by SPICe. The briefing ends with a step-by-step guide to using two of the main labour market statistics resources.

4
INTRODUCTION
Labour market statistics provide details of the size, structure and characteristics of a country‟s labour market, allowing commentators and policy-makers to compare performance over time and measure the success of various micro and macro-economic interventions. Headline figures on the labour market deal with labour supply and demand; unemployment, employment, economic inactivity and claimant count.
SOURCES OF INFORMATION
The Office for National Statistics (ONS) is the main source of official labour market statistics in the UK. It provides estimates of labour supply, unemployment, employment and economic inactivity, in line with the definitions set out by the International Labour Organisation (ILO). The ONS gathers the data through their main surveys the Labour Force Survey (LFS) and Annual Population Survey (APS). The ONS also produce the Annual Survey of Hours and Earnings (ASHE) which provides information on earnings and their structure and distribution within the UK. The ONS also provides Jobseeker‟s Allowance (JSA) claimant count figures for the country as a whole, as well as for smaller areas such as constituencies and local authorities. These are produced using the JobCentre Plus administrative data. Although recognised as a robust way of identifying trends in local labour markets, it should be noted that the Claimant Count data does not meet the internationally agreed definition of unemployment specified by the ILO (see the Definitions of Labour Market Terms section for more information). A brief guide on how to access the above information through the ONS website and Nomis can be found in Annex A.
LABOUR FORCE SURVEY (LFS)
The LFS is the UK‟s largest household survey, canvasing approximately 53,000 private households covering around 120,000 adults. It asks individuals questions about their labour market status. The main purpose of the survey is to provide information which “can then be used to develop, manage, evaluate and report on labour market policies.” According to the ONS the LFS has the following strengths:
it provides a self-contained, integrated source of information about the labour market activity (or inactivity) of the whole (household) population
it is based on a large sample size
it uses the internationally-recognised standard definitions of employment and unemployment, recommended by the ILO (allowing comparison between countries)
Source: Office for National Statistics (2011)
As well the headline labour supply figures the LFS also gathers information on respondents‟ personal circumstances. This includes information on topics such as occupation, training, hours of work and personal characteristics of household members aged 16 years and over (i.e. sex, ethnicity etc.) The LFS collects the majority of it data through face to face interview using computer assisted questionnaires, with the rest of the data collect via telephone interviews. As the size of the

5
population interviewed as part of the LFS is relatively small when compared to the population of the UK, those interviewed are intended to be “representative of the entire population of the UK.” This means that each individual‟s response will be weighted depending on which group they represent relative to the makeup of the total UK population. More information on the methodologies used when producing the LFS and other labour market surveys can be found on the ONS website here: http://www.ons.gov.uk/ons/guide-method/method-quality/quality/quality-information/labour-market/index.html The LFS can be accessed through the ONS website.
ANNUAL POPULATION SURVEY (APS)
The APS expands the LFS data with sample boosts from England, Wales and Scotland. The combination of different sources takes the total number of individuals that take part in the APS to approximately 340,000, with the Scottish component accounting for around 35,000 individuals. The design of the APS enables annual estimates for relatively small areas of the United Kingdom (e.g. local authority or Parliamentary constituency) to be produced. The APS datasets are produced quarterly, with each dataset containing 12 months of data.
The APS also collects information on other topics such as; Geographical mobility, Education and training, Health, Childcare, Income, Individual and household characteristics. It should be noted that as the income and working pattern data is self-reported it is not checked for accuracy with either the respondent‟s employer or HMRC.
The APS can be accessed through Nomis and through various publications on the ONS website.
ANNUAL SURVEY OF HOURS AND EARNINGS (ASHE)
The Annual Survey of Hours and Earnings (ASHE) is an annual survey of approximately 280,000 employee jobs registered with HMRC PAYE. It provides information on paid hours worked by individuals throughout the UK. The information can be broken down by industry, occupation and different regions within the UK as well as by gender and full-time/part-time workers. It should be noted that ASHE does not include the self-employed or employees not paid within the reference period Some of the variables which ASHE offers are: gross weekly pay, gross hourly pay, total paid hours, basic paid hours and paid overtime hours. ASHE can be accessed through the ONS website.
NOMIS
NOMIS is a web based database of labour market statistics run by the University of Durham on behalf of the ONS. It provides access to labour market and related population data for local areas from a variety of sources including the LFS/APS, claimant count, Business Register and Employment Survey (BRES), New Earnings Survey (NES) and the 2011, 2001, 1991 and 1981 Censuses of Population.

6
INTERNATIONAL STATISTICS
As the LFS gathers data in line with the ILO definitions it allows comparison with other countries that also collect information within this framework. The main sources which allow comparison are the OECD, Eurostat and ILOSTAT the ILO‟s official database of labour statistics. Table 1 briefly outline what each source offers in the way of information.
Table 1: International sources of labour market data
OECD.Stat Data for OECD countries and selected non-member economies.
Data on employment, unemployment, average annual working time and public expenditure on active labour market policies
EUROSTAT Data on the EU and candidate countries
Data on the key indicators and age, sex, educational attainment, and distinctions between permanent/temporary and full-time/part-time employment.
Provides data for the Nomenclature of Territorial Units for Statistics (NUTS) regions
ILOSTAT Includes data for nearly 200 countries.
Datasets contain standardized indicators for purposes of greater comparability across countries
Relies heavily on the official submission of data by national authorities
DEFINITIONS OF LABOUR MARKET TERMS
UNEMPLOYMENT
Definition: Any individual aged 16 and over who is not in employment and has been looking for work in the last four weeks and is able to start work within the next two weeks. An individual is recorded as unemployed regardless of the nature of employment they are looking for, full-time or part-time, or whether they are claiming Jobseeker‟s Allowance or any other benefits. The unemployment estimates also include people who are out of work, have found a job and are waiting to start in the next two weeks. Source of data: LFS/APS: http://www.ons.gov.uk/ons/taxonomy/index.html?nscl=Unemployment APS (through NOMIS): https://www.nomisweb.co.uk/Default.asp
How the rate is worked out:
Number of unemployed people aged 16+ as a percentage of the total economically active population (all individuals aged 16 and over who are either in employment or unemployed)
EMPLOYMENT
Definition: Any individual aged 16 and over who is undertaking one hour or more a week of paid work
People are recorded as in employment if they are engaging in any form of paid work, on a government-supported training programme, work experience or work-related training. The employment estimates also include unpaid family workers, who work in a family business and benefit from the profits of the business although they do not receive a formal wage or salary.

7
However individuals working without pay (for example, volunteers in charity shops) are not included in the employment figures.
Source of data: LFS/APS: http://www.ons.gov.uk/ons/taxonomy/index.html?nscl=Employment
How the rate is worked out:
Number of people in employment expressed as a percentage of all people aged 16-64 (see fig.1)
ECONOMICALLY INACTIVE
Definition: Any individual aged 16 and over who is not in employment and has not looked for work in the last four week and is unable to start work within the next two weeks.
The economically inactive population includes retired people, individuals looking after family or home, people unable to work due to illness or disability and students who choose not to look for work. A common misunderstanding is to assume that all full-time students are in the economically inactive category. This is incorrect. A full-time student with a part-time job will be recorded in the employment figures. Likewise students who are not working but have been looking for a job within the last four weeks would be counted as unemployed, even if they are only looking for part-time work. Source of data: LFS/APS: http://www.ons.gov.uk/ons/taxonomy/index.html?nscl=Economic+Inactivity APS (through NOMIS): https://www.nomisweb.co.uk/Default.asp
How the rate is worked out:
Number of people economically inactive expressed as a percentage of all people aged 16-64 (see fig.1)
CLAIMANT COUNT
Definition: The number of people claiming unemployment-related benefits.
Since October 1996 the Claimant Count figure has been the number of people claiming Jobseeker‟s Allowance (JSA). Some JSA claimants are not classified as unemployed. This is because people working less than 16 hours per week may be eligible to claim JSA depending on their income (NOMIS).
Claimant count figures provide a narrow measurement of unemployment as it does not include unemployed people who are not eligible for JSA (for example students, people with working spouses and most under 18s). The information used for providing claimant count figures are based on administrative records rather than a survey. This means the data can be updated monthly, provide information on small geographical areas and groups of interest, such as by gender or a specific age group, with no sampling errors. The introduction of the Universal Credit later this year will have some impact on future claimant count statistics this is discussed later in the briefing.
Source of data: NOMIS Claimant count: https://www.nomisweb.co.uk/Default.asp

8
How the rate is worked out:
The numbers of claimants as a percentage of the working age resident population (16‐64) using the National Records of Scotland mid-year estimates.
UNDEREMPLOYMENT
The International Labour Organisation identifies underemployment as the “underutilisation of the productive capacity of the employed population.” Underemployment can be broken down into two categories; hours underemployment and skills underemployment. The first definition includes individuals who are willing to supply more hours of work than their employers are prepared to offer. Whereas skills underemployment is when individuals are working in jobs where their skills are not adequately utilised (also known as skills underutilisation).
During the course of its investigation into Underemployment the Scottish Parliament‟s Economy, Energy and Tourism Committee noted the fact that up-to-date and Scotland-specific data on skills underutilisation is currently unavailable. The LFS is the key source of information on visible or hours-constrained underemployment. The ONS‟s criteria for defining hours-constrained underemployment are individual who want to work more hours and are:
currently working below 40 hours a week if they are between 16 and 18 and below 48 hours if they are over 18 and;
available to start working longer hours within 2 weeks
The EET Committee report contains up-to-date figures (as of April 2013) from the Scottish Government and includes links to a variety of useful resources: http://www.scottish.parliament.uk/parliamentarybusiness/CurrentCommittees/62266.aspx
WELFARE REFORMS AND CLAIMANT COUNT DATA
In November 2010 the UK government announced the introduction of Universal Credit as part of their reform of the welfare system. This new benefit is designed to provide a single monthly payment to people who are unemployed or on low income. It is intended to replace 6 benefits that are currently in place including Job Seekers Allowance (JSA). As discussed earlier the claimant count figures is made up from the JSA count, mainly the contribution and means tested elements.
The ONS launched a consultation in October 2012 looking for views on the creation and distribution of claimant count statistics once Universal Credit has been fully introduced. The ONS proposed that the new Claimant Count will only include individuals who are “out of work (that is with zero earnings) and subject to a full set of labour market requirements.” In this proposal the ONS defines an individual who meets the full set of labour market requirements as someone “that is actively seeking work and available to start work.”
As part of the ONS analysis of the responses to the consultation they noted that replies in general supported their suggestion. They have therefore concluded that they will proceed with the headline measures for Claimant Count as:
those people who receive Universal Credit while not in work and expected to meet a full set of labour market requirements, and
those who are not in work and receive contributory JSA

9
The transition period for the introduction of Universal Credits will take place in two phases and will have an impact on the way claimant count data is presented. These phases are:
Phase 1: Migration of the means-tested element of the claimant count to a measure only counting people not in work. This is expected to run from October 2013 until the migration has been completed; this is expected to be accomplished by 2015.
Phase 2: This will remove the individuals who are in work and claiming contributory JSA who account for a relatively small number of claimants.
The Claimant Count figure during the initial phase will be a hybrid of people on Universal Credit, those on contributory JSA, and remaining claimants of income-related JSA who have yet to migrate to Universal Credit. This will impact on the headline seasonally adjusted claimant count figure. In order to incorporate these changes adjustments will have to be made to ensure that all previous time-series data is based on a consistent definition. The ONS have stated that this will take place „towards the end of transition.‟ During the transition the ONS will publish information regarding the impact the alteration is having on movement in the claimant count figures alongside the hybrid data (Office for National Statistics 2012d).
LABOUR MARKET STATISTICS AND SCOTLAND PERFORMS
Scotland Performs is the Scottish Government‟s mechanism for measuring and reporting on its progress towards building a more “successful country, with opportunities for all to flourish through increasing sustainable economic growth.” The framework identifies indicators which are designed to measure and report on the progress made; Purpose Targets and National Indicators. One of the Purpose Targets outlined is concerned with labour market participation.
Participation • To maintain our position on labour market participation as the top performing country in the UK
• To close the gap with the top five OECD economies by 2017
The Participation element of the Purpose Targets is a comparison of Scotland‟s employment levels with the rest of the UK and the OECD countries.
Criteria for recent change
UK An increase of 1 percentage point over the year indicates an improvement
An decrease of 1 percentage point over the year indicates the position is worsening
OECD Closing the gap by 0.5 percentage point over the year indicates an improvement
The gap widening by 0.5 percentage point over the year indicates the position is worsening
The UK comparison data comes from the LFS/APS employment level figure for each country with the UK. The Scottish Government compare this figure quarterly. The OCED comparison can be made using the Scottish figures from the LFS/APS figures compared with OCED countries which are available via OECD.Stat. It should be noted that the OCED statistics for employment figures is based on 15-64 as opposed to 16-64. The Scottish Government compare this figure annually. In the Economy, Energy and Tourism Committee‟s report on their inquiry into Underemployment they suggested that as a result of the economic downturn employment rates “are less useful for measuring the health of the labour market.” This is due to the fact that the employment rate in

10
Scotland may appear to improve relative to other countries due to drops in their employment rates rather than through increases in the Scottish employment rate. This means that Scotland may seem to have closed the gap on the other OCED countries or outperformed the rest of the UK nations regardless of Scottish Government intervention. The committee has therefore called on the Scottish Government to “consider how its labour market targets can be adapted to reflect an ambition to grow the number of hours people are in work, improve the quality of jobs in Scotland and the types of contracts used.”

11
FREQUENTLY ASKED QUESTIONS (FAQ)
1. WHEN ARE FIGURES RELEASED?
Labour Force Survey (LFS) results are published on a UK and Scottish basis, 6 weeks after the end of the survey period. Annual Population Survey (APS) figures, useful for smaller areas such as local authority areas, are released 3 months after the end of the survey period. The Annual Survey of Hours and Earnings is released annually normally in the fourth quarter (usually November or December). Each release is available from 9:30AM on the day of their release usually a Wednesday in the middle of the month. You can keep track of upcoming releases by checking the below release calendars: The ONS release calendar can be found here: http://www.ons.gov.uk/ons/release-calendar/index.html Key Releases: Labour Market Statistics and Regional Labour Market Statistics. The nomis release calendar can be found here: http://www.nomisweb.co.uk/home/release_dates.asp Key Releases: Annual Population Survey and Claimant Count data
2. WHAT IS THE DIFFERENCE BETWEEN UNEMPLOYMENT AND ECONOMIC INACTIVITY?
Unemployed individuals are those aged 16 and over that do not have a job but are actively seeking one. Whereas the economically inactive are individuals aged 16 and over who do not have a job and are not actively seeking one.
3. HOW CAN UNEMPLOYMENT AND EMPLOYMENT GO UP AT THE SAME TIME?
While this may seem counter intuitive it is possible. This can happen due to changes in the size of the labour force which can occur for a number of reasons:
Economically inactive people can move into the economically active part of the labour market by either taking up employment or starting to look for a job, thus either adding to the employment or unemployment figures. See fig. 1.
Population change. This includes immigration or people entering or leaving the job market due to age, e.g. school leavers/retirees.
Fig. 1 Labour market flow

12
4. WHAT IS SEASONAL ADJUSTMENT?
The headline figures on the labour market that are quoted by news agencies like the BBC are the seasonally adjusted figures. Seasonal adjustment occurs because labour market data is susceptible to seasonal movement which is the „effect associated with the time of year.‟ For example during the summer there is a large number of people of working age leaving full-time education or during the festive period shops and warehouses tend to take on extra temporary staff. This effect can make it difficult to identify any underlying trends in the labour market. Seasonal adjustment aims to deal with the problems associated with seasonal movement so that underlying trends in the labour market can be identified and analysed. In order to achieve this, an estimate of the seasonal effect is made and the data is adjusted accordingly (see fig. 2). This alteration allows for direct comparison between time periods, e.g. quarter on quarter, allowing time-series comparison to take place. In terms of the LFS it allows for quarterly comparisons of the key labour supply data. Seasonally adjusted figures from the ONS are only available at the national/region level (i.e. UK, Scotland, England etc.). The ONS provide non-seasonally adjusted figures at local levels (e.g. local authorities or Parliamentary constituency). When comparing non-seasonally adjusted figures it is best to compare them to the same time period in previous years, for example December 2012 and December 2011. This allows direct comparison to be made which will not be affected by seasonal movement.
Fig. 2: Comparison of Non-Seasonally Adjusted and Seasonally Adjusted Claimant Count numbers for Scotland July 2010 to July 2013
110,000
120,000
130,000
140,000
150,000
160,000
July 2010 January 2011 July 2011 January 2012 July 2012 January 2013
Non-Seasonally Adjusted Seasonally Adjusted
5. HOW DO I ACCESS CONSTITUENCY DATA?
Constituency data on the official measures of unemployment, employment and economic inactivity is released quarterly as part of the Annual Population Survey. Claimant count data for constituencies is available monthly. Both the APS and claimant count data can be accessed through the Nomis website. A short guide on how to access data through the Nomis website can be found in Annex A.
13
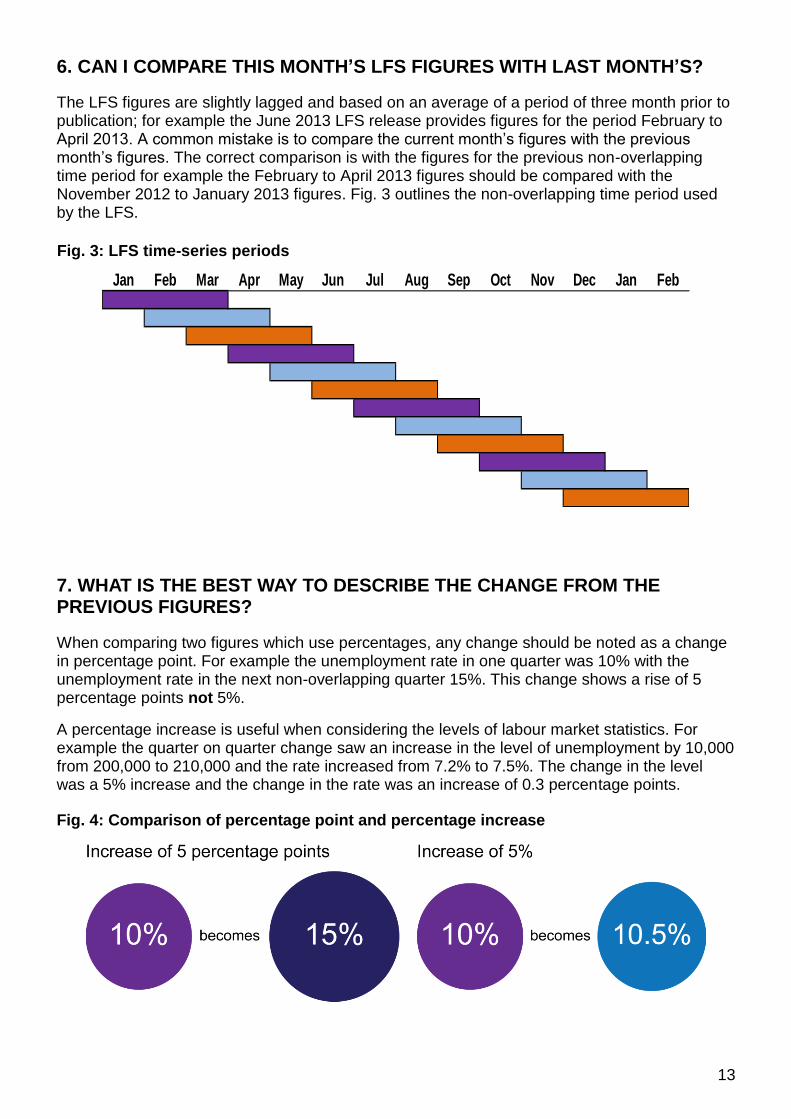
6. CAN I COMPARE THIS MONTH’S LFS FIGURES WITH LAST MONTH’S?
The LFS figures are slightly lagged and based on an average of a period of three month prior to publication; for example the June 2013 LFS release provides figures for the period February to April 2013. A common mistake is to compare the current month‟s figures with the previous month‟s figures. The correct comparison is with the figures for the previous non-overlapping time period for example the February to April 2013 figures should be compared with the November 2012 to January 2013 figures. Fig. 3 outlines the non-overlapping time period used by the LFS.
Fig. 3: LFS time-series periods
Jan Feb Mar Apr May Jun Jul Aug Sep Oct Nov Dec Jan Feb
7. WHAT IS THE BEST WAY TO DESCRIBE THE CHANGE FROM THE PREVIOUS FIGURES?
When comparing two figures which use percentages, any change should be noted as a change in percentage point. For example the unemployment rate in one quarter was 10% with the unemployment rate in the next non-overlapping quarter 15%. This change shows a rise of 5 percentage points not 5%.
A percentage increase is useful when considering the levels of labour market statistics. For example the quarter on quarter change saw an increase in the level of unemployment by 10,000 from 200,000 to 210,000 and the rate increased from 7.2% to 7.5%. The change in the level was a 5% increase and the change in the rate was an increase of 0.3 percentage points.
Fig. 4: Comparison of percentage point and percentage increase
14
8. HOW CAN I ACCESS YOUTH UNEMPLOYMENT FIGURES?
There are a number of sources of youth unemployment/employment data; the Annual Population Survey (APS), the Labour Force Survey (LFS) and Claimant count data.
APS
The APS provides official estimates of unemployment by age, including the 16-24 age range for the UK, Scotland and some smaller areas including constituencies. Data can be accessed through the Nomis website. A short guide on how to access data through the Nomis website can be found in Annex A.
LFS
The ONS publishes estimates of unemployment by age for Scotland, produced as part of the LFS regional labour market release. These include figures for the unemployment level and rate for the 16-24 age group. A short guide on how to access data through the ONS website can be found in Annex A.
It should be noted that these estimates are derived from the same data source as the LFS. Therefore due to the relatively small samples sizes and subsequent sampling variability, the figures should be used with caution and are designated by the ONS as „Experimental Statistics‟.
Claimant count data
While not being the official measure of unemployment, claimant count data provides information on the age of JSA claimants. It is possible to find out the number of individuals aged 18-24 claiming JSA by region, local authority and constituency. (It should be noted that in order to claim JSA individuals should normally be 18 or over).
Data can also be extracted showing the length of time people have been claiming JSA. Both the information on age and length of time claiming can be accessed through the Nomis website. A short guide on how to access this data through the Nomis website can be found in Annex A.

15
ANNEX A – HOW TO ACCESS THE FIGURES
The following section gives a brief guide on how to access the figures outlined in the briefing, through the ONS and Nomis websites. SPICe can provide further information and training on request.
ONS
There are a number of ways to access labour market statistics on the ONS website:
1. Through the Labour Market homepage under the Key Publications in the Summaries and Publications tab http://www.ons.gov.uk/ons/taxonomy/index.html?nscl=Labour+Market#tab-sum-pub
2. Through the release calendar: http://www.ons.gov.uk/ons/release-calendar/index.html
The Labour Market Statistics release gives figures for the UK and each of the nations and regions.
More detailed figures for Scotland can be found in the Regional labour market statistics release.
The time series data for each edition is available under the “In this release” section of the editions page in the “Reference tables.”
This link will take you to a list of the excel tables which are related to the release.
Once you have opened the spreadsheet you want you can view the entire time-series by unhiding the rows with the information by selecting the rows on either side of the hidden row, right clicking and selecting „Unhide.‟ See opposite.
Please note: once the rows are unhidden it provides each months release therefore in order to get the correct time-series the overlapping quarters should be removed. Please see the Time-period portion of the Common Misinterpretation section in this briefing for more information
The Annual Survey of Hours and Earnings (ASHE) can be accessed here: http://www.ons.gov.uk/ons/rel/ashe/annual-survey-of-hours-and-earnings/index.html
Please note: When comparing gross weekly pay it is advised to use the median instead of the mean average as the median will remove the impact extremes when providing an average. For example the impact of a small number of high earners on average wages.

16
NOMIS
Nomis is the main resource for accessing the Annual Population Survey (APS) and Claimant Count data. Nomis can be accessed here: http://www.nomisweb.co.uk/
The Advanced Query tool, accessible from the nomis homepage, allows users to define their own search of the data on nomis.
Once the Advanced Query has been selected you are presented with the list of option in the figure opposite. From the drop down lists: For the APS select: annual population survey (Dec 2004 to Most recent release) For Claimant count data select: claimant count with rates and proportions (Jun 1983 to Most recent release)
In the next screen you will be asked to define the criteria of the data you would like to access. The options for the APS and the claimant count can be seen opposite.
Please note: when selecting the „rates/proportions‟ option for claimant count data „Residence-based proportions‟ is the official measure below national/regional level.
Once you have selected the criteria you are interested in select download data from the list on the bottom of the list. The data will then be retrieved and you can now download the data as an Excel file.
APS Claimant Count

17
SOURCES
Bell and Blanchflower (2013) Underemployment in the UK: http://niesr.ac.uk/press/underemployment-uk-11285 [Accessed 18/06/2013]
GOV.uk, Benefits & credits, Jobseeker's Allowance (JSA) Available at: https://www.gov.uk/jobseekers-allowance/eligibility [Accessed 04/12/2013] International Labour Organisation, Underemployment statistics. http://www.ilo.org/global/statistics-and-databases/statistics-overview-and-topics/underemployment/lang--en/index.htm
Kanabar, R and Ayoubkani, D, Office for National Statistics (2012a), Approaches to the Seasonal Adjustment of Labour Market Flows, November 2012, Available at: http://www.ons.gov.uk/ons/guide-method/method-quality/specific/labour-market/articles-and-reports/seasonal-adjustment-of-flows.pdf. [Accessed 18/06/2013]
NOMIS, Definitions and Explanations, http://www.nomisweb.co.uk/reports/lmp/gor/2092957698/report.aspx#defs
OECD, Glossary of Statistical Terms http://stats.oecd.org/glossary/ [Accessed 18/06/2013]
Office for National Statistics (2010), Characteristics of the underemployed and the overemployed in the UK, http://www.researchonline.org.uk/sds/search/download.do;jsessionid=E4C52D4E831DF251A53724A78DC32505?ref=A29308 [Accessed 18/06/2013]
Office for National Statistics (2011), User Guide Volume 1 – LFS Background and Methodology http://www.ons.gov.uk/ons/guide-method/method-quality/specific/labour-market/labour-market-statistics/volume-1---2011.pdf
Office for National Statistics (2012a), Interpreting Labour Market Statistics, Available at: http://www.ons.gov.uk/ons/dcp171766_294390.pdf [Accessed 18/06/2013]
Office for National Statistics (2012b), People in Work Wanting More Hours Increases by 1 million Since 2008 http://www.ons.gov.uk/ons/dcp171776_289024.pdf
Office for National Statistics (2012c), Consultation on: the production and dissemination of the Claimant count statistics following the introduction of Universal Credits, October 2012 [Online]. Available at: http://www.ons.gov.uk/ons/about-ons/user-engagement/consultations-and-surveys/open-consultations/the-production-and-dissemination-of-claimant-count-statistics-following-the-introduction-of-universal-credit/index.html [Accessed 18/06/2013]
Office for National Statistics (2012d), Responses to the consultation on: the production and dissemination of the Claimant count statistics following the introduction of Universal Credits, October 2012 [Online]. Available at: http://www.ons.gov.uk/ons/about-ons/user-engagement/consultations-and-surveys/open-consultations/the-production-and-dissemination-of-claimant-count-statistics-following-the-introduction-of-universal-credit/index.html [Accessed 18/06/2013]
Office for National Statistics (2012e), Guide Labour Market Statistics, Available at: http://www.ons.gov.uk/ons/dcp171766_294392.pdf [Accessed 18/06/2013]
Office for National Statistics, Guide to Regional and Local Labour Market Statistics, Available at: http://webarchive.nationalarchives.gov.uk/20110218135832/http:/statistics.gov.uk/downloads/theme_labour/Guide_regional_local_lms.pdf [Accessed 18/06/2013]

18
Scottish Government, Scotland Performs, Available at: http://www.scotland.gov.uk/About/Performance/scotPerforms [Accessed 24/06/2013]

19
THIS PAGE IS INTENTIONALLY BLANK

20
RELATED MATERIAL
Monthly Labour Market updates are available on the Economy and Finance page of the Scottish Parliament website.
The latest headline labour market figures are also available on the Financial Scrutiny Unit's page of the Scottish Parliament website.
Scottish Parliament Information Centre (SPICe) Briefings are compiled for the benefit of the Members of the Parliament and their personal staff. Authors are available to discuss the contents of these papers with MSPs and their staff who should contact Andrew Aiton on extension 85188 or email [email protected]. Members of the public or external organisations may comment on this briefing by emailing us at [email protected]. However, researchers are unable to enter into personal discussion in relation to SPICe Briefing Papers. If you have any general questions about the work of the Parliament you can email the Parliament‟s Public Information Service at [email protected].
Every effort is made to ensure that the information contained in SPICe briefings is correct at the time of publication. Readers should be aware however that briefings are not necessarily updated or otherwise amended to reflect subsequent changes.
www.scottish.parliament.uk