labour force in singapore 2020 - ministry of manpower
TRANSCRIPT

|02| Labour Force in Singapore 2020
LABOUR FORCE IN SINGAPORE 2020 (Impact of COVID-19 on the Labour Market)
1. Introduction 1.1 In previous editions, the Labour Force in Singapore report analysed longer-term structural trends of
indicators, e.g. employment rate and income growth, which are not released in quarterly reports. These indicators are collected from the annual Comprehensive Labour Force Survey (CLFS) conducted in mid-year. However, as the conduct of CLFS 2020 coincided with the Circuit Breaker, the data will be largely influenced by this situation. Hence, the 2020 report focuses on analysing the impact of COVID-19 on different segments of the labour force, rather than longer-term trends.2
2. Labour Force
Youth employment rate declined, while that for seniors continued to rise 2.1 The employment rate for residents aged 15 & over declined from 65.2% in 2019 to 64.5% in 2020,
the lowest since 2014. However, this was a smaller decrease than in past recessions, helped by slower population and labour force growth.3 Youths aged 15 to 24 experienced the largest decrease in employment rate among all age groups, reflecting the employment contraction in sectors where they commonly worked such as Food & Beverage Services, Administrative & Support Services and Retail Trade.
2.2 While the employment rate for residents aged 25 to 64 also declined, it remained close to the average
of 80.5% in the past five years. The decrease was also smaller than in past recessions, as the employment rate for females held up (73.2%), given the underlying uptrend in their labour force participation rate. The employment rate for males moderated from 88.8% to 87.9%, the lowest level since 2004. The moderation for males was broad-based across finer age groups.
2.3 In contrast, the employment rate for older residents aged 65 & over continued to increase, from
27.6% in 2019 to 28.5% in 2020, reflecting sustained efforts to raise their employability4 and higher demand for essential services like cleaning and security amid the COVID-19 outbreak. The employment rate for older residents also continued to increase in the last recession in 2009.
2 Data in this report are for June periods and pertain to residents (comprising Singapore citizens and permanent residents) aged 15 & over, unless stated otherwise. 3 The resident population aged 15 & over grew by 0.6% from June 2019 to June 2020. This is significantly lower than in past recessions, at 3.2% in June 2009,
2.2% in June 2003 and 2.1% in June 1998. Source: Singapore Department of Statistics 4 The bulk of the increase was from older workers continuing employment in their current job, as 89% of resident employees aged 65 to 69 had been in their
current job for at least one year.

Labour Force in Singapore 2020 |03|
Chart 1 Employment rate of residents aged 15 and over Per Cent
Chart 2 Resident employment rate by age Per Cent
Chart 3 Employment rate of residents aged 25 to 64 by sex Per Cent

|04| Labour Force in Singapore 2020
Labour force participation rate held steady in 2020 2.4 Structural foundations in the labour market remained firm, as the labour force participation rates of
older residents and females aged 25 to 64 continued to rise in 2020. This balanced the larger than usual decrease in youth labour force participation rate (-2.3%-points over the year), as more youths stayed outside the labour force to pursue education. As a result, the labour force participation rate for residents aged 15 & over in 2020 (68.1%) remained at around the level of 68% since 2015.
Chart 4 Labour force participation rate of residents aged 15 & over
Per Cent
Female share of the labour force trended upwards over the decade, and held steady over the year
2.5 Reflecting their uptrend in labour force participation, over the last decade the share of women in the
resident labour force trended upwards from 44% in 2010 to 46% in 2020. Compared to a year ago, the share of women in the resident labour force and among the employed held steady at 46%, even though they were over-represented in industries more severely impacted by COVID-19 such as Wholesale Trade (47%), Retail Trade (57%), Accommodation (51%), Food & Beverage Services (57%) and Arts, Entertainment & Recreation (50%).
Chart 5 Resident labour force by sex
Number (‘000)

Labour Force in Singapore 2020 |05|
Share of seniors in the labour force continued to rise 2.6 With all post-war baby boomers reaching their mid-50s or beyond, and labour force participation rate
of seniors continuing to rise despite the COVID-19 pandemic, the share of seniors in the resident labour force continued to rise. 26% of the resident labour force in 2020 were aged 55 & over, up from 17% in 2010. Prime working-age residents aged 25 to 54 remained the majority in the resident labour force, despite decreasing from 74% to 67% over the decade. Reflecting falling birth rates and with more youths staying outside the labour force to pursue education over the years, those aged 15 to 24 made up only a small group or 7.1% of the resident labour force in 2020, down from 9.7% in 2010.
Chart 6 Resident labour force by age
Per Cent
2.7 Reflecting the above-average incidence of older workers in their workforce, Land Transport &
Supporting Services (e.g. taxi, private-hire car and bus drivers), Food & Beverage Services (e.g. hawkers, food/drink stall assistants), Retail Trade (e.g. shop sales assistants), Construction (e.g. construction managers, supervisors/general foremen) and Cleaning & Landscaping (e.g. cleaners) were among the industries with the highest number of senior workers aged 55 & over. There were also industries with large number of senior workers because of their relatively large employment sizes overall, namely Wholesale Trade (e.g. wholesale trade managers, clerks, shop sales assistants), Public Administration & Education (e.g. clerks, private tutors, cleaners, teachers) and Health & Social Services (e.g. cleaners, medical/dental receptionists, nurses).

|06| Labour Force in Singapore 2020
Chart 7 Top industries among employed residents aged 55 & over, June 2020 Number (‘000)
More degree holders in the labour force 2.8 With increased opportunities to pursue higher education over the years, the share of degree holders
in the resident labour force continued to increase to 39% in 2020, up from 28% in 2010. Among those in employment, degree holders commonly worked in Public Administration & Education, Financial & Insurance Services, Professional Services, Wholesale Trade, Manufacturing, Information & Communications and Health & Social Services.
Chart 8 Resident labour force by highest qualification attained
Per Cent

Labour Force in Singapore 2020 |07|
2.9 As many of the sectors that degree holders commonly worked in were less impacted by the COVID-19 pandemic, the employment rate of degree holders aged 25 to 64 maintained at 87.6% in 2020. However, degree holders in full-time employment experienced lower median income than a year ago. Degree holders were more likely to be in higher-income groups, where salaries tend to be more closely tied to bonuses and economic performance. Those in management positions may also have taken the lead in pay cuts, for companies more adversely affected by the pandemic. Despite the decrease in 2020, real median income growth for full-time employed degree holders in the recent five years (2015 to 2020) kept pace with the increase in the earlier five years (2010 to 2015).
Chart 9 Employment rate of resident degree holders aged 25 to 64
Per Cent
Chart 10 Median gross monthly income from work (including employer CPF contributions) of full-time employed resident degree holders Dollars

|08| Labour Force in Singapore 2020
2.10 The employment rate for young local polytechnic diploma holders aged 25 to 29 decreased over the year. On the other hand, the employment rate for young degree holders from both the local autonomous universities and private education institutions held up well at around 90%. This was helped by the relatively high proportion of young degree holders who work in industries that were less affected by the COVID-19 outbreak, such as Information & Communications, Financial & Insurance Services and Professional Services. The median incomes for young local polytechnic diploma holders as well as degree holders in 2020 were lower than those in 2019, though they continued to be higher than the median income for the corresponding cohorts five years ago in 2015.
Chart 11 Employment rate of residents aged 25 to 29 from local tertiary institutions
Per Cent
Chart 12 Median gross monthly income from work (including employer CPF contributions)
of full-time employed residents aged 25 to 29 from local tertiary institutions Dollars

Labour Force in Singapore 2020 |09|
The share of PMETs in the resident workforce rose faster, as industries with higher concentration of PMETs remain resilient
2.11 The share of professionals, managers, executives & technicians (PMETs) among employed residents
increased at a faster pace in 2020 than in earlier years, reaching 60%. The number of residents in PMET jobs continued to rise steadily, as sectors with a high concentration of PMETs such as Information & Communications, Financial & Insurance Services and Professional Services were less impacted by the COVID-19 pandemic. On the other hand, the decline in non-PMET employment was larger than usual, pulled down by sectors more severely impacted by COVID-19 such as Wholesale Trade, Retail Trade, Accommodation and Food & Beverage Services. Most of these industries have a higher concentration of non-PMETs in their workforce.
Chart 13 Employed residents by occupation
Per Cent

|10| Labour Force in Singapore 2020
Steeper increase in time-related under-employment rate among non-PMETs, lower-educated and older workers
2.12 The proportion of part-time workers among employed residents declined from 11.2% in 2019 to
10.6% in 2020, as services industries such as Food & Beverage Services (e.g. waiters, food/drink stall assistants), Retail Trade (e.g. shop sales assistants), Education (e.g. private tutors, extracurriculum instructors) and Arts, Entertainment & Recreation (e.g. physical fitness instructors) which typically employed more part-time workers were more impacted by COVID-19 and work stoppages, and cut back on part-time employment.
Chart 14 Share of part-time employed among employed residents
Per Cent
2.13 However, more part-timers were willing and available to work additional hours. The time-related
under-employment rate5 increased from 3.1% to 4.1% over the year, but was below that during the Global Financial Crisis in 2009 (4.3%).
Chart 15 Resident time-related under-employment rate
Per Cent
5 Refers to part-timers who are willing and available to work additional hours as a percentage of all (full-time and part-time) employed residents.

Labour Force in Singapore 2020 |11|
2.14 The time-related under-employment rate increased sharply in industries severely affected by COVID-19, including Retail Trade, Food & Beverage Services, Arts, Entertainment & Recreation, Construction and Transportation & Storage. As these were also sectors that employed more non-PMETs, and whose jobs were less suitable for remote work, non-PMETs experienced larger increases in time-related under-employment rate than PMETs.
2.15 Residents with below-secondary qualifications, and older workers in their 50s and aged 60 & over also
posted sharper increases in time-related under-employment rate over the year.
Chart 16 Resident time-related under-employment rate by characteristics Per Cent

|12| Labour Force in Singapore 2020

Labour Force in Singapore 2020 |13|
Self-employment rose 2.16 The share of self-employed in the resident workforce rose in June 2020 to 14.7%, from 13.5% in
June 2019. The increase was led by own account workers (i.e. individuals who operate their own business or trade without employing any paid employees), from 8.8% in June 2019 to 9.7% in June 2020. There were also slight increases among employers (from 4.3% to 4.4%) and contributing family workers (from 0.4% to 0.6%). The increase in self-employed share of the resident workforce was broad-based, and was more pronounced for older workers, youths, and those in non-PMET jobs.
Chart 17 Proportion of self-employed among employed residents
Per Cent
2.17 A Labour Force Supplementary Survey has been conducted yearly since 2016, to collect additional
statistics on the number of resident workers engaged in own account work. Given the ad hoc and transient nature of own account work, the reference period of this supplementary survey was extended to over the course of the year, rather than over the past week. The longer reference period enables us to capture more accurately the prevalence of own account work, and the experiences of own account workers.

|14| Labour Force in Singapore 2020
Number of regular own account workers increased in 2020 2.18 More residents were engaged in own account work as a regular form of employment over the one-
year period ending mid-20206 (228,200), up from 211,000 in 2019. 2.19 For most residents in regular own account work, own account work was their main job (i.e. primary
own account workers: 190,900), and they formed 8.1% of all employed residents in 2020.7 The remaining residents did own account work on the side (secondary own account workers: 37,300).
2.20 The vast majority were engaged in own account work by choice (190,800 or 84%), mostly because
they enjoyed the flexibility and freedom associated with own account work. 2.21 However, there was a rise in the number of residents who engaged in own account work on a non-
preferred basis8 (from 21,500 in 2019 to 37,400 in 2020), reflecting the weaker labour market conditions in 2020. Nevertheless, the number remained lower than that seen in 2017 (46,700).
Chart 18 Resident regular own account workers
Number (‘000)
6 As the survey captures residents engaged in own account work for the 12-month period ending the middle of the year, it would also cover persons in own
account work prior to the onset of COVID-19. 7 The estimate is derived based on the number of regular primary own account workers, as a proportion of total resident employment (average over 12 months
ending the middle of the year). 8 Persons for whom own account work is not their preferred choice of work refer to those who engage in own account work because they are unable to find
work as an employee. Among multiple job holders, it includes those who are unable to find full-time work. Those for whom own account work is a preferred choice of work refer to the remaining who do not fall into the above estimate.

Labour Force in Singapore 2020 |15|
2.22 It was common for regular own account workers to utilise online channels (59%) to advertise and obtain business, including more than a third (37%) who took up work via online matching platforms9, as online channels have become crucial for business outreach amid the COVID-19 safe distancing measures.
2.23 Among regular primary own account workers, majority were residents aged 40 & over (74%) and had
non-tertiary qualifications (54%). The age profile has shifted slightly over the year towards the older ages of 60 & over (from 22% to 25%) as well as younger workers aged below 30 (8.0% to 9.0%). On the other hand, the share of those aged 30 to 59 fell, though fewer among them were doing own account work by choice.
2.24 In line with the increase in the share of own account workers who were younger, the share who were
tertiary educated also edged up in 2020 (44% to 46%, mostly among those with diploma & professional qualifications).
Chart 19 Resident regular primary own account workers
Per Cent
9 In the absence of internationally agreed statistical definition, online matching platforms are defined as labour sharing platforms that serve as intermediaries to
match or connect buyers with workers who take up piecemeal or assignment-based work. Such platforms could be either websites or mobile applications, covering services such as ride-hailing, goods/food delivery, creative work, etc.

|16| Labour Force in Singapore 2020
2.25 In 2020, there was a significant increase in the number of regular primary own account workers in occupations which usually utilised online matching platforms to obtain work, in particular private-hire car drivers. The number of residents working as private-hire car drivers rose in 2020 to become the most common occupation among regular primary own account workers.10 There was also an increase in car & light goods vehicle drivers, as the suspension of dine-in services during the Circuit Breaker period and other safe distancing measures led to heightened demand for delivery services. Other common occupations include insurance sales agents/brokers, real estate agents and hawkers/stall holders.
Chart 20 Top occupations among resident regular primary own account workers, 2020
Number (‘000)
10 The regular primary own account workers working as private-hire car drivers tend to be non-tertiary educated (70%) and were aged 50 & over (57%). Most of
the increase in private-hire car drivers over the year also came from the non-tertiary educated, as well as residents aged 50 & over.

Labour Force in Singapore 2020 |17|
Own account workers were most concerned about having sufficient work amid the pandemic
2.26 About one in two (52%) regular own account workers faced challenges at work in 2020. This was
significantly higher compared to the preceding year (35%). They were most concerned about the lack of (33%) or uncertainty of finding sufficient work (26%), possibly due to a fall in demand for services, and increased competition for available freelance work. The proportions who have healthcare-related concerns (17%, e.g. insufficient savings for healthcare, lack of medical benefits and paid sick leave), as well as retirement-related concerns (14%), were broadly similar to a year ago.
2.27 Majority (90%) of those who faced challenges in the course of own account work felt that the
difficulties faced were exacerbated by the COVID-19 pandemic. To cope, regular own account workers tend to put in longer hours (37%) or defer large ticket purchases (34%). It was less common for them to take up multiple jobs (20%) or find employee work (12%).
Chart 21 Challenges faced by resident regular own account workers, 2020
Per Cent

|18| Labour Force in Singapore 2020
More non-PMETs in casual/on-call employment 2.28 Among non-PMET employees, there was a decrease in those on permanent and fixed-term contract.
On the other hand, more non-PMETs were on casual/on-call employment such as delivery workers, cashiers, kitchen assistants and security guards. This reflects the shift to online retail sales and food delivery/takeaway, as many retail outlets were temporarily closed and dine-in food services were suspended to stem the spread of COVID-19, as well as higher demand for security services to implement safe management measures.
2.29 Among PMETs, the proportion of permanent, fixed-term contract and casual/on-call employees held
broadly steady over the year. Even though the overall proportion of casual/on-call employees among resident employees also edged up, this was offset by a decrease in fixed-term contract employees. As a result, the share of permanent employees among resident employees remained unchanged at a high of 89.3%.
Chart 22 Incidence of resident PMET and non-PMET employees by type of employment
Per Cent

Labour Force in Singapore 2020 |19|
Overall proportion of multiple job holders held steady, but marked increase observed for plant & machine operators & assemblers and cleaners, labourers & related workers
2.30 The proportion of multiple job holders remained low at 2.8% in 2020, unchanged from a year ago.
The proportion of self-employed workers with more than one job continued to increase from 6.0% in 2019 to 6.7% in 2020, and the pace of increase was faster than the previous year. On the other hand, the proportion of multiple job holders among employees decreased from 2.3% to 2.1%.
Chart 23 Proportion of employed residents holding multiple jobs
Per Cent

|20| Labour Force in Singapore 2020
2.31 Across most occupational groups, the incidence of multiple jobholders decreased or were unchanged from a year ago. However, there was a sharp increase in multiple jobholding among plant & machine operators & assemblers, driven by taxi/private-hire car drivers and delivery workers. Regulations were temporarily eased to allow taxi/private-hire car drivers to use their vehicle to provide delivery services to supplement their incomes given low ridership during the COVID-19 outbreak, while demand for delivery services was high due to the temporary shop closures and suspension of dine-in food & beverage services. There were also increases in multiple jobholding among those who were cleaners, labourers & related workers and associate professionals & technicians (e.g. real estate agents) in their main job.
Chart 24 Proportion of employed residents holding multiple jobs by occupation in main
job Per Cent

Labour Force in Singapore 2020 |21|
3. Training
Training participation held up in 2020 3.1 The training participation rate for the resident labour force aged 15 to 64 was 49% in 2020, similar
to a year ago.11 The rate held up despite restrictions placed on in-person training due to the COVID-19 situation, as more residents turned to online learning.12 Among non-trainees, only a minority (6.6%) deferred training plans due to COVID-19.13
3.2 Trainees spent more days in training, from an average of 13 days in 2019 to 15 days in 2020. As a
result, training intensity, measured by the average number of days of training per adult in the labour force, rose over the year from 6.5 days in 2019 to 7.5 days in 2020.
Chart 25 Training participation rate of resident labour force aged 15 to 64
Per Cent
3.3 The incidence of training was broadly unchanged for the employed (50%) and unemployed (37%).
However, among the employed, there was an increase in training participation for the self-employed, from 27% in 2019 to 37% in 2020. This reflected the prevalence of training support programmes14 for the self-employed to encourage them to upgrade their skills. On the other hand, training participation among employees declined slightly from 53% to 52%, though their training participation rate is still higher than the self-employed.
3.4 Across age groups, the training participation rate either rose or held steady in 2020, except for those
aged 20 to 29. Among non-trainees in their 20s, there was an increase in the share who cited that they were either satisfied with the skills/knowledge they possessed, or that the training schedule would have conflicted with their work demands as the main reasons for not participating in training. Younger resident trainees who participated in online learning also indicated juggling work and online learning as their top challenge. As majority of those aged 20 to 29 were tertiary educated, the decline in training participation for this age group also weighed on the training participation rate for the tertiary educated in 2020. However, they remained more likely than the non-tertiary educated to attend training.
11 This refers to training participation over the 12-month period ending June of the respective years. 12 The proportion of trainees who participated in training online/e-learning doubled from a year ago (from 26% to 51%), largely reflecting the uptake in the first
half of 2020. 13 Those who deferred training due to the COVID-19 situation commonly cited reasons such as work commitments (38%) and preference for face-to-face training
(30%). 14 Under the Self-Employed Persons (SEP) Training Support Scheme and National Trade Union Congress (NTUC) Training Fund introduced by the Government and
NTUC in March 2020, self-employed persons will receive a training allowance when they undergo training under the SkillsFuture Series or selected sector-specific training programmes.

|22| Labour Force in Singapore 2020
Chart 26 Training participation rate of resident labour force aged 15 to 64 Per Cent
3.5 The training participation rate was largely unchanged from a year ago for PMETs (59%), clerical, sales
& service workers (38%) and production & transport operators, cleaners & labourers (24%). However, training participation rates were mixed at the detailed occupation level. Within the production & transport operators, cleaners & labourers group, the slight increase in training participation rate for plant & machine operators & assemblers was largely offset by the pronounced decline in training incidence for a smaller pool of craftsmen & related trades workers as remote training may be less viable for them due to the nature of their work. Associate professionals & technicians also saw a decline in training participation over the year, but they remained more likely than non-PMETs to undergo training in 2020.
3.6 Reflecting the higher concentration of PMETs in these industries, workers in Financial & Insurance
Services (59%), Information & Communications (62%) and Community, Social & Personal Services (62%) continued to post higher than average training participation rates.

Labour Force in Singapore 2020 |23|
Chart 27 Training participation rate of employed residents aged 15 to 64 Per Cent
3.7 More than half (61%) of employed trainees felt that training has become more important in view of
the impact of COVID-19 on the labour market. Training also better prepared them for emerging changes, as a high percentage of employed trainees (80%) felt that their skillsets enable them to thrive or cope with the changes that will emerge post COVID-19.
3.8 Overall, most of the employed trainees were satisfied with the training undertaken in 2020. Training
tends to lead to enhanced workforce skills such as having new job-related skillsets (50%), being more productive on the job (49%), and better service delivery at work (44%). Having greater confidence and self-esteem (41%), as well as being encouraged (37%) and prepared (36%) for further training

|24| Labour Force in Singapore 2020
were also common favourable outcomes for trainees. An immediate boost in pay (4.3%) or career opportunities (promotion, 3.6%; new job, 4.3%) post training was uncommon as these tend to follow with better work performance after trainees hone their skills.
Chart 28 Training outcomes of employed residents aged 15 to 64, 2020
Per Cent

Labour Force in Singapore 2020 |25|
4. Job Mobility and Tenure
Proportion of workers who switched jobs decreased, reflecting subdued hiring sentiments
4.1 As employers deferred hiring amid the height of the restriction measures to curb the COVID-19
outbreak, and employees more likely to stay on in their existing jobs due to fewer opportunities in the job market, the proportion of employed residents who switched jobs in the recent year decreased from 8.9% in June 2019 to 8.2% in June 2020. The decrease was broad-based across all age groups, with a larger magnitude of decrease among younger residents aged below 30. Younger workers are typically in the early stages of their career and exploring different career options, contributing to their relatively higher incidence of job change compared to those older.
Chart 29 Proportion of employed residents who had changed jobs in the last two years
Per Cent

|26| Labour Force in Singapore 2020
Chart 30 Proportion of employed residents who had changed jobs in the last one year by age Per Cent
Marked decrease in employees who started work in their current job in the last six months
4.2 The more subdued hiring sentiments was also observed from the decrease in employees who started
new jobs recently. 8.1% of resident employees in June 2020 started working with their current employer within the recent six months, i.e. approximately in the period since the onset of COVID-19 in Singapore. This was a marked decrease from 9.7% a year ago. With the temporary closure of physical workplaces and a weakened global economy amid the COVID-19 pandemic, some employers may have deferred hiring till the COVID-19 restrictions are eased and economic activities pick up pace.

Labour Force in Singapore 2020 |27|
Chart 31 Distribution of resident employees by years in current job Per Cent
4.3 Similar to the trends for job change, the decrease in proportion of resident employees who had
worked with their current employer for less than six months was broad-based and more pronounced for younger residents aged below 30.
Chart 32 Proportion of resident employees who had worked for less than six months in
their current job by age Per Cent

|28| Labour Force in Singapore 2020
4.4 The proportion of resident employees with years in current job of less than half a year decreased across most industries, especially in Accommodation, Food & Beverage Services and Arts, Entertainment & Recreation. These were among the industries most severely affected by the COVID-19 pandemic.
Chart 33 Proportion of resident employees who had worked for less than six months in
their current job by industry Per Cent

Labour Force in Singapore 2020 |29|
5. Usual Hours Worked
Larger decrease in average usual hours worked of full-timers in 2020 compared with recent years
5.1 The average weekly usual hours worked among full-time employed residents continued to trend
down, from 45.8 hours in 2019 to 45.4 hours in 2020. This was a larger decrease than in recent years, reflecting cutbacks in working hours in industries more heavily impacted by COVID-19 e.g. Arts, Entertainment & Recreation, Retail Trade, Construction, Accommodation and Manufacturing.
5.2 On the other hand, the average usual hours worked of part-timers edged up slightly over the year but
at a slower pace than the previous two years. Despite a relatively large decrease among full-timers in 2020, average weekly usual hours worked of employed residents only dipped slightly over the year as there was a sharp decline in share of part-timers (who worked shorter hours) in the workforce.
5.3 The decrease in usual hours worked was also less pronounced than the decline in paid hours worked,15
as part of the reduction in working hours that workers experienced are temporary decreases during the height of the COVID-19 restrictions.
Chart 34 Average (mean) usual hours worked per week of employed residents by nature
of employment Hours Per Week
15 As reported in the Labour Market Report Second Quarter 2020, average weekly total paid hours worked per employee declined by 1.3 hour over the year in
June 2020.

|30| Labour Force in Singapore 2020
Full-timers saw a decline in average usual hours worked over the year across occupational groups, except plant & machine operators & assemblers
5.4 Among full-timers, the average usual hours worked per week declined across occupational groups
over the year, except for plant & machine operators & assemblers which saw an increase in hours put in. The increase for this group was from the self-employed, and mainly from private-hire car drivers and delivery workers. Private-hire car drivers put in more hours possibly because of the need to make more trips to maintain their earnings, due to lower ridership as more workers were telecommuting and tourist arrivals plunged. On the other hand, delivery workers worked longer hours due to higher demand for delivery services from shop closures and suspension of dine-in services amid COVID-19.
Chart 35 Change in average (mean) usual hours worked per week of full-time employed
residents by occupation Hours Per Week

Labour Force in Singapore 2020 |31|
Proportion of full-timers working long hours continued to decrease 5.5 Other than how long workers usually work on average, another key area of interest in the topic of
working time is the extent to which workers usually work long hours. The proportion of full-time employed residents who usually worked more than 48 hours a week continued to decrease from 24% in 2019 to 22% in 2020. This was significantly lower than the peak of 38% in 2010. Part of the decline this year could have been attributed to reduced work hours in response to COVID-19. Similar to the trends for average hours of work, there was a broad-based decrease in proportion of full-timers usually putting in more than 48 hours of work a week. The exceptions were plant & machine operators & assemblers; and workers in Transportation & Storage, driven by private-hire car drivers and delivery workers.
Chart 36 Proportion of full-time employed residents who usually worked more than 48
hours per week Per Cent

|32| Labour Force in Singapore 2020
6. Working from Home and Reduced Work Hours Due to COVID-19 Situation
6.1 Beyond traditional indicators on employment, unemployment and income of workers, the
Comprehensive Labour Force Survey 2020 also collected additional information on the impact of COVID-19, namely to size the number of persons working from home, and those with reduced working hours.
Nearly half of employed residents worked from home due to COVID-19; Singapore had among the highest prevalence compared to European Union member states
6.2 Nearly half (49%) or 1,094,900 employed residents in Singapore had worked from home because of
COVID-19. This was among the highest compared to European Union (EU) member states (5th).16
Chart 37 Proportion of workers who worked from home because of COVID-19 situation in Singapore and European Union member states, 2020
16 Based on an average of two rounds of e-survey conducted by Eurofound, to cover a period of fieldwork similar to Singapore.

Labour Force in Singapore 2020 |33|
6.3 A larger proportion of PMETs and clerical workers worked from home compared to those in other non-PMET occupations such as service & sales workers, craftsmen and cleaners, whose work typically needs to be done onsite or involve the use of machinery, vehicles or tools.
6.4 Reflecting this, the incidence of workers who worked from home was highest in Information &
Communications, Financial & Insurance Services, Professional Services and Education, all of which had a high concentration of PMETs. Relatively fewer workers from Food & Beverage Services, Transportation & Storage, Accommodation, Retail Trade, Health & Social Services and Administrative & Support Services worked from home.
Chart 38 Proportion of employed residents who worked from home because of COVID-19
situation, June 2020 Per Cent

|34| Labour Force in Singapore 2020

Labour Force in Singapore 2020 |35|
Nearly one in ten employed residents experienced reduced work hours due to COVID-19
6.5 Around one in ten (9.0%) or 201,100 employed residents experienced a reduction in hours worked
due to COVID-19, either in the form of shorter work hours than usual, or no-pay leave. 6.6 A higher share of workers in industries severely affected by COVID-19, namely Accommodation, Food
& Beverage Services, Other Community, Social & Personal Services and Arts, Entertainment & Recreation had reduction in hours worked. Non-PMETs, lower-educated and older workers were also more likely to have experienced reduction in working hours.
Chart 39 Proportion of employed residents who experienced reduction in hours worked
because of COVID-19 situation, June 2020 Per Cent

|36| Labour Force in Singapore 2020

Labour Force in Singapore 2020 |37|
7. Income
Median income fell 7.1 The nominal median income of full-time employed residents17 declined by 0.6% from $4,563 in 2019
to $4,534 in 2020. After adjusting for inflation,18 real median income growth was -0.4% in 2020, compared with the 2.2% in 2019. Notwithstanding the moderation in 2020, real median income growth over the recent five years (2015 to 2020) was close to that of the preceding five years (2010 to 2015), due to sustained income growth prior to 2020.
Steeper decline in income at the 20th percentile, but help from government to supplement incomes mitigated impact
7.2 There was a steep decline in income at the 20th percentile of full-time employed residents over the
year (nominal: -4.8%; real: -4.6%), as industries more adversely affected by COVID-19 have a high concentration of lower-income earners. Incomes of lower-income self-employed workers such as taxi/private-hire car drivers and hawkers were also impacted by the plunge in tourist arrivals, work-from-home arrangements, and temporary suspension of dine-in services at food & beverage outlets during the Circuit Breaker period.
7.3 However, various schemes are in place to mitigate the impact of COVID-19 on lower-income earners.
The qualifying income ceiling for the Workfare Income Supplement (WIS) scheme was raised from $2,000 to $2,300 in 2020, with an increase in quantum of WIS support. Additionally, workers who qualify for WIS in 2019 or 2020 will receive a one-off Workfare Special Payment (WSP) of $3,000. Other temporary schemes to help support workers affected by the COVID-19 pandemic include the Self-Employed Person Income Relief Scheme (SIRS) and COVID-19 Support Grant (CSG). After adding WIS and WSP payouts, the 20th percentile income level in 2020 is similar to the level in 2019.19
7.4 Over the longer term from 2015 to 2020, income growth of full-timers at the 20th percentile (2.9%
p.a.) remained slightly higher than the median income growth (2.6% p.a.).
17 Data includes employer CPF contributions. 18 The Consumer Price Index for all items decreased by 0.2% over the year in 2020. Source: Singapore Department of Statistics 19 Data on WIS and WSP are preliminary, based on latest available data.

|38| Labour Force in Singapore 2020
Chart 40 Gross monthly income from work (including employer CPF contributions) of full-time employed residents Dollars

Labour Force in Singapore 2020 |39|
Chart 41 Annualised change in real* gross monthly income from work (including employer CPF contributions) of full-time employed residents Per Cent Per Annum

|40| Labour Force in Singapore 2020
8. Unemployment20
Non-PMETs experienced a larger increase in unemployment rate than PMETs, with both rates below previous recessionary peaks
8.1 The unemployment rate increased by a larger extent among non-PMETs (+1.7%-point from 2019 to
2020) compared to PMETs (+0.6%-point). Nevertheless, the rates for both groups remained below previous recessionary peaks.
Chart 42 Unemployment rate of resident PMETs and non-PMETs
Per Cent
20 Top-line seasonally adjusted unemployment rates are now reported on a monthly basis, with breakdown by age and highest qualification attained available
quarterly. With a larger sample size, the CLFS enables us to collect additional information of unemployment rates by occupation and industry, reported in this section. The unemployment rates by occupation and industry are non-seasonally adjusted because they pertain only to June periods, and comparisons over time is not affected by seasonality. Therefore, they should be compared with the non-seasonally adjusted unemployment rate at the top-line, rather than the seasonally adjusted rate. For analysis of unemployment trends at the top-line and by age, highest qualification attained and sex, please refer to the Monthly Unemployment Situation and quarterly Labour Market Reports.

Labour Force in Singapore 2020 |41|
8.2 Among non-PMETs, unemployment rates rose steeply across all age groups. The increase for PMETs was comparatively smaller, except for older PMETs aged 50 & over.
Chart 43 Unemployment rate of resident PMETs and non-PMETs by age
Per Cent
8.3 The increase in unemployment rates for both PMETs and non-PMETs were driven by shorter-term
unemployment,21 as the increase in their long-term unemployment rates22 was considerably smaller. PMETs in their 40s experienced a larger increase in long-term unemployment rate compared to other age groups. Among non-PMETs, long-term unemployment rate rose for residents aged below 30 and in their 40s, but held steady for residents aged 50 & over.
21 Referring to those unemployed for less than 25 weeks. 22 This refers to the percentage of persons who have been unemployed for 25 weeks or more to the labour force.

|42| Labour Force in Singapore 2020
Chart 44 Unemployed PMETs and non-PMETs by duration of unemployment Number (‘000)
Chart 45 Long-term unemployment rate of resident PMETs and non-PMETs Per Cent

Labour Force in Singapore 2020 |43|
Chart 46 Long-term unemployment rate of resident PMETs and non-PMETs by age Per Cent
8.4 The increase in unemployment rate was larger in industries more severely affected by the COVID-19
outbreak, due to factors such as the plunge in tourist arrivals and temporary stoppage of work activities that need to be done onsite. Specifically, industries with larger increase in unemployment rate over the year include Accommodation (+5.0%-points), Other Community, Social & Personal Services (+2.4%-points), Construction (+2.3%-points), Retail Trade (+2.2%-points), Food & Beverage Services (+1.8%-point), Education (+1.8%-point) and Administrative & Support Services (+1.7%-point). On the other hand, Public Administration & Defence (-0.3%-point), Professional Services (unchanged) and Real Estate Services (+0.1%-point) were least affected, with their unemployment rates hovering around the levels of a year ago.

|44| Labour Force in Singapore 2020
Chart 47 Resident unemployment rate by industry Per Cent

Labour Force in Singapore 2020 |45|
Marked increase in unemployed residents who were retrenched from their previous job
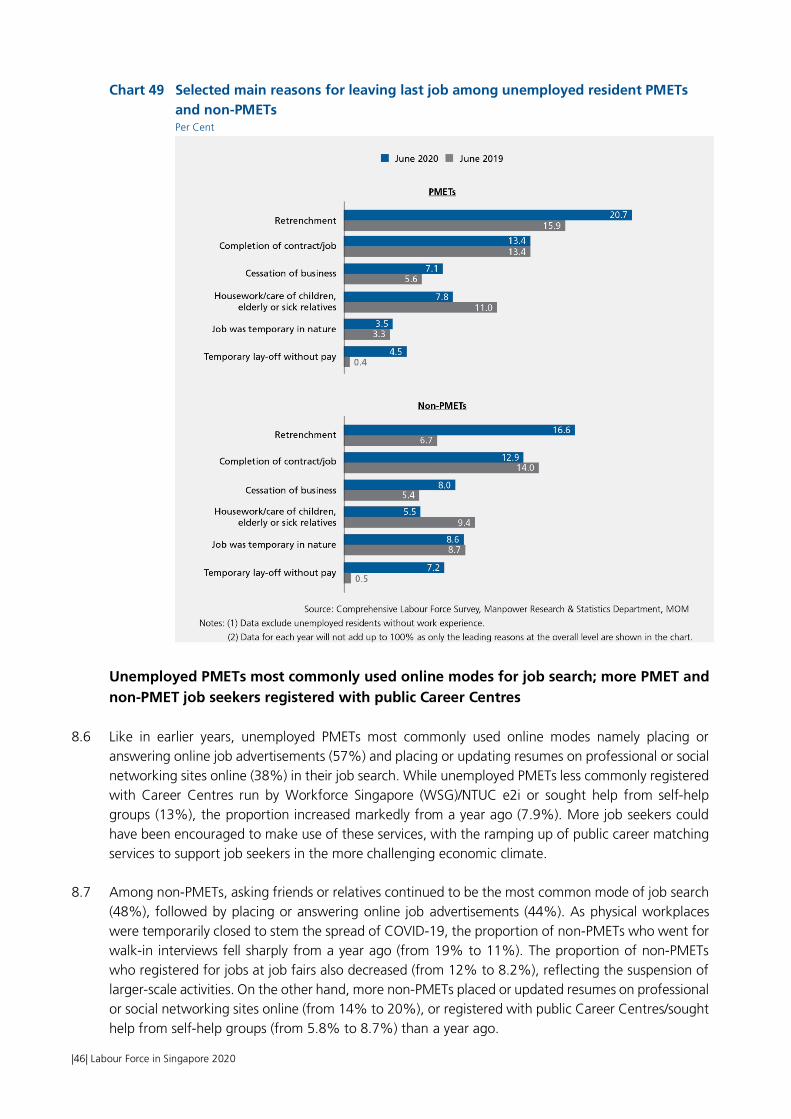
8.5 Reflecting the higher than average number of retrenchments which occurred during COVID-19, the share of unemployed residents who were retrenched from their last job rose sharply from 11% in 2019 to 18% in 2020. Meanwhile, the adoption of temporary cost-saving measures by companies also led to an increase in share of unemployed who were temporarily laid-off without pay23 (from 0.5% to 6.0%). There was also an increase in unemployed residents who lost their job due to business cessation (from 5.5% to 7.6%). As industries more adversely affected by COVID-19 had higher concentration of non-PMETs, the non-PMETs had larger increases in share of unemployed who left their last job due to these reasons than PMETs.
Chart 48 Top main reasons for leaving last job among unemployed residents Per Cent
23 This includes those who are put on temporary layoff without pay/no-pay leave for longer than 3 months or with no definite timeline/guarantee that they will be called back to work, and are actively looking for and available for work. For those on shorter temporary absence of 3 months or less or continued to be paid salary during their absence, they will still be classified as employed.
|46| Labour Force in Singapore 2020
Chart 49 Selected main reasons for leaving last job among unemployed resident PMETs and non-PMETs Per Cent
Unemployed PMETs most commonly used online modes for job search; more PMET and non-PMET job seekers registered with public Career Centres
8.6 Like in earlier years, unemployed PMETs most commonly used online modes namely placing or
answering online job advertisements (57%) and placing or updating resumes on professional or social networking sites online (38%) in their job search. While unemployed PMETs less commonly registered with Career Centres run by Workforce Singapore (WSG)/NTUC e2i or sought help from self-help groups (13%), the proportion increased markedly from a year ago (7.9%). More job seekers could have been encouraged to make use of these services, with the ramping up of public career matching services to support job seekers in the more challenging economic climate.
8.7 Among non-PMETs, asking friends or relatives continued to be the most common mode of job search
(48%), followed by placing or answering online job advertisements (44%). As physical workplaces were temporarily closed to stem the spread of COVID-19, the proportion of non-PMETs who went for walk-in interviews fell sharply from a year ago (from 19% to 11%). The proportion of non-PMETs who registered for jobs at job fairs also decreased (from 12% to 8.2%), reflecting the suspension of larger-scale activities. On the other hand, more non-PMETs placed or updated resumes on professional or social networking sites online (from 14% to 20%), or registered with public Career Centres/sought help from self-help groups (from 5.8% to 8.7%) than a year ago.

Labour Force in Singapore 2020 |47|
Chart 50 Unemployed residents by modes of job search and previous occupation, June 2020 Per Cent

|48| Labour Force in Singapore 2020
9. Persons Outside the Labour Force
Number of residents outside the labour force broadly stable, but more of them were recent job leavers
9.1 As the labour force participation rate was broadly stable, the total number of residents outside the
labour force only edged up slightly from 1.09 million in 2019 to 1.10 million in 2020, reflecting population growth. However with the COVID-19 outbreak in the first half of 2020 and measures to reduce local transmission, there was a marked increase in those outside the labour force who left their last job within the last six months (henceforth described as “recent job leavers”), from 63,300 in 2019 to 98,000 in 2020. This balanced the reduction in number of residents outside the labour force who did not have work experience24 or had left their job for a longer period.
Chart 51 Residents outside the labour force by when left last job
Number (‘000)
9.2 The profile of recent job leavers is quite different from those outside the labour force in general. While
they were also concentrated at the two ends of the age spectrum, recent job leavers were relatively younger, with a higher share of them in their 50s or younger than the overall pool of residents outside the labour force. Proportionately more recent job leavers have secondary, post-secondary (non-tertiary) and diploma & professional qualification than the overall group of residents outside the labour force.
9.3 Given the higher share of youths among recent job leavers outside the labour force, proportionately
more of them were not working to pursue education/training (36%) than the entire pool of residents outside the labour force (27%). The recent job leavers were also commonly taking a break (25%), unlike those outside the labour force in general who were more likely to be taking care of their families, retired or not working due to old age, poor health or disability. While there were relatively more discouraged workers among recent job leavers (6.6%) than in the overall pool of residents outside the labour force (1.5%), they still formed a small minority.
24 The decrease in residents outside the labour force without work experience mostly came from youths aged 15 to 24, possibly because more of them had taken
on vacation jobs or internships previously to gain some work experience while pursuing education.

Labour Force in Singapore 2020 |49|
Chart 52 Profile of residents outside the labour force, June 2020 Per Cent

|50| Labour Force in Singapore 2020
9.4 The International Labour Organisation (ILO) developed new indicators in recent years to identify residents outside the labour force with relatively stronger labour market attachment. Two new descriptors were developed i.e. “unavailable job seekers” – those who are actively looking for work but are currently not available for work as yet, and “available potential job seekers” – those who are not actively looking for jobs but want to and available to work.
Increase in residents outside the labour force with relatively stronger labour market attachment
9.5 There was a notable increase in residents outside the labour force with relatively stronger labour
market attachment. The number of unavailable job seekers rose from 15,300 (1.4% of residents outside the labour force) in 2019 to 23,300 (2.1%) in 2020, and the number of available potential job seekers doubled from 20,700 (1.9%) in 2019 to 41,900 (3.8%). The increases were mostly driven by those who left their last job within the last six months, amid the outbreak of COVID-19.
Chart 53 Unavailable job seekers and available potential job seekers by when left last job
Number (‘000)

Labour Force in Singapore 2020 |51|
Discouraged workers rose to a new high, mainly affecting lower-educated and older residents
9.6 Reflecting the sharp slowdown in economic activities, the number of persons who were not looking
for work because they felt their job search would not yield results (discouraged workers) more than doubled from 7,500 (0.3% of the resident labour force25) in 2019 to 16,400 (0.7%) in 2020.26 This surpassed the previous high of 11,100 (0.6%) in the 2009 recession.
Chart 54 Residents discouraged from seeking work
25 Inclusive of discouraged workers. 26 The ILO’s new definition of discouraged workers included additional criteria that they must be available potential job seekers (i.e. wanted and were currently
available to work even though they did not actively seek employment). Based on this definition, the number of discouraged workers also increased, from 2,200 in 2019 to 7,600 in 2020.

|52| Labour Force in Singapore 2020
9.7 Sharper increases in incidence of discouraged workers were observed among those with non-tertiary qualifications, and older residents aged 60 & over. As a result, the lower-educated and older residents remained the largest groups among discouraged workers. 34% of discouraged workers in 2020 were aged 60 & over, with another 27% in their 50s. Those with below secondary qualifications made up 35% of discouraged workers, with the secondary-educated making up another 23%.
Chart 55 Profile of residents discouraged from seeking work

Labour Force in Singapore 2020 |53|
As many of the recent job leavers outside the labour force intend to return to the labour market, the number of potential entrants rose sharply
9.8 As many of those outside the labour force who had left their jobs recently intend to return to the
labour market, there was a large increase in number of residents outside the labour force who intended to look for jobs within the next two years in 2020. This was a departure from the general downtrend since 2015. These potential entrants numbered 173,300 or 16% of those outside the labour force in 2020, up from the low of 128,600 or 12% in 2019. More residents had left the labour market in the first half of 2020 to pursue education/training or take a break; and some were discouraged about their chances of securing a job at the height of the COVID-19 restrictions. Many of them intend to return to the labour market when the situation improves, contributing to the increase in potential entrants.
Chart 56 Resident potential entrants into the labour force
9.9 The increase in potential entrants mainly came from those who intended to look for a job within six
months of the survey i.e. by around end of 2020 (from 50,300 to 82,100), followed by those who planned to do so within six months to less than a year from the survey i.e. around the first half of 2021 (from 34,900 to 46,000).
9.10 The incidence of potential entrants continued to be higher among residents in the younger prime-
working ages of 25 to 29 (48%) and 30 to 39 (41%). The latter also increased markedly from 31% a year ago. Considering actual numbers, there were more youths and older residents among the potential entrants given their higher likelihood of being outside the labour force, and there were also marked increases in their numbers from the previous year. Within the larger pool of potential entrants in 2020, 40% or 69,700 preferred to work part-time.

|54| Labour Force in Singapore 2020
Annex A
Chart A1 Degree holders in resident labour force by place of study, institution that awarded degree and age, June 2020 Per Cent