labour-based technologies and methods … · and methods for employment intensive construction...
TRANSCRIPT

Best Practice Guideline 1: An overview of labour-based technologies and methods in employment intensive works Page 1 April, 2004: First edition of CIDB document 1022
1 Background Engineers have traditionally used their skills and expertise to ensure that structures or structural components are serviceable and durable in addition to possessing adequate strength and stability. A well designed structure is, normally, considered to be one which meets these requirements in the most economically efficient manner, least cost being the measure of value for money. Engineers similarly design services using the same approach. In recent years, however, the term "value for money" has in South Africa been broadened to take cognisance of socio-economic and political benefits. Government has realised that there is a cost to unemployment and poverty and that there is a price to be paid for the economic empowerment of marginalised communities. Accordingly, value for money is now assessed in a revised context. There are definite relationships between employment opportunities, available skills, entrepreneurship and the use of small scale enterprises in the creation and maintenance of assets. The construction strategies that are adopted can be used to address social and economic needs and concerns and, depending upon how they are structured, to facilitate the economic empowerment of marginalised sectors in a focussed manner. Thus, the process of constructing assets can be just as important as the provision of the assets themselves. Projects involving the creation of assets can also promote sustainable community development should they be structured so as to: • create employment opportunities; • promote community involvement; • impart technical skills to the unskilled and semi-skilled members of the community; • transfer administrative, commercial and managerial skills to the community; • retain, as far as is possible, the funds expended on the project within the community; and • develop contractors from within the community in which they are to be constructed. Projects that address these objectives allow the resources of the community to be built up in an endogenous manner, i.e., to be grown from within.
The Green Paper on Public Sector Procurement Reform in South Africa (1997) suggests that Procurement should facilitate the generation of jobs in South Africa by: • ensuring that the foreign content in contracts involving goods, services and works is minimised. • encouraging the substitution of labour for capital. • supporting the use of “labour friendly” technologies which utilise a higher degree of labour input
than is the case for conventional technologies, or are well suited to implementation by small scale enterprises.
LABOUR-BASED TECHNOLOGIES AND METHODS FOR EMPLOYMENT INTENSIVE CONSTRUCTION WORKS BEST PRACTICE GUIDELINE 1 An Overview of Labour-Based Technologies and Methods in Employment Intensive Works April 2004 First edition of CIDB document 1022

Best Practice Guideline 1: An overview of labour-based technologies and methods in employment intensive works Page 2 April, 2004: First edition of CIDB document 1022
• encouraging and developing small scale enterprises to implement employment intensive practices and “labour-friendly” technologies.
All of the above presupposes that appropriate labour-based methods and technologies are readily available to those engaged in construction works as designers and constructors. 2 The employment potential of construction projects 2.1 An overview Expenditure in any sector of the economy will create employment opportunities. Some sectors of industry are, however, more efficient than others at generating employment opportunities for a given capital inflow. Industries where the potential for the effective substitutions of labour for capital and local resources for imports exist, can expect to achieve enhanced performance in the provision of employment opportunities. The construction industry is an industry that may be regarded as being amongst the most efficient in generating employment for a given capital inflow. The Green Paper on an Enabling Environment for Reconstruction, Growth and Development in the Construction Industry (1997) suggests that the construction industry in 1997 could generate between 11 and 23 direct, indirect and derived jobs per million Rand invested in the different sectors of the industry. (Average of approximately 17 jobs per million Rand invested). It points out, however, that although these figures are slightly higher than other industrial sectors they do not justify infrastructure investment beyond the immediate requirements in order to create jobs. If, however, the number of jobs created can be increased for example by substituting people for machines, investment in infrastructure projects will become more attractive. Employment-intensive works have been highly visible in the civil engineering sector. The civil engineering sector is plant-intensive when compared to the building sector. The building sector, in general, generates more employment opportunities per unit of expenditure than does the civil engineering sector. If, however, labour is substituted for machines, this position can be reversed. Alternatively, if a blend of labour and light equipment is used on civil engineering projects, the difference in labour-intensiveness between the two sectors reduces. Several employment-intensive works programmes have been implemented in Africa and Asia over the last two decades. These labour and resource based programmes have aimed to serve several purposes simultaneously. Above all they have aimed to influence infrastructure investment policies so as to maximise employment and income generation, the creation of productive assets and poverty alleviation. Employment-intensive methods have been employed in South Africa on construction projects which include rural gravel roads; low level bridges; small dams; residential township roads (surfaced and gravel); water and sewerage reticulation for townships; bituminous surfacing of roads; low voltage electrical reticulations; stormwater drainage systems; and on-site sanitation. Road maintenance projects have included regravelling, and routine road maintenance. Other employment-intensive construction-related projects have included materials manufacture (precast concrete products, timber roof trusses, metal window frames); agricultural structures (dams, erosion control measures, irrigation projects); building works (community centres, clinics, schools, classrooms, housing); and electrification. 2.2 Quantitative information on the potential of labour-based technologies and methods1 The authors of a report commissioned in 1994 by the National Housing Forum in South Africa, suggested that there are a number of ways in which employment opportunities in the provision of housing and related infrastructure can be maximised. These relate to forms of construction, construction methods, and manufacturing methods.
1 Refer to Appendix 1 for tabulations of quantitative data obtained from a number of local and international publications.

Best Practice Guideline 1: An overview of labour-based technologies and methods in employment intensive works Page 3 April, 2004: First edition of CIDB document 1022
They recognised that in order to achieve the goal of maximising employment opportunities, quantitive information needed to be made available to developers, architects, engineers and the like as to which technologies, construction methods, materials etc. would be likely to promote high employment. Employment opportunities in the construction of the built environment, i.e., houses, amenities and infrastructure, were examined in some detail in this National Housing Forum study. Manufacturers and producers of a wide range of construction materials were approached to provide information regarding the number of person hours required to produce their products. It appeared logical that this figure should include all the time spent on obtaining raw materials, manufacturing of the item and stockpiling the item prior to distribution and could be based on the total number of person hours worked in the industry (management, administrative staff, workers etc.) and the quantity of the item produced. Some of the results of this survey are summarised in Table 1. The researchers, using the CSIR Division of Building Technology's Housing Delivery Systems Analysis (HDSA) database, were able to estimate the number of person hours required to construct a masonry house for any given floor plan. In this manner, they were able to compare the total number of person hours required to construct houses using different forms of construction (see Table 2). They suggested that employment opportunities should be linked to cost to ensure that sector effectiveness and efficiency were not impaired. Table 3 compares the cost per person hour generated for the different forms of house construction presented in Table 2. Table 1 : Approximate number of person hours required to manufacture some building and construction materials
ITEM
DESCRIPTION
UNIT
PERSON
HOURS PER UNIT
Aggregate Bitumen Cement Clay sewer pipes Clay masonry units Concrete masonry units Concrete paving units Concrete pipes Concrete roof tile Door frames FC Roof sheeting FC Ceiling board FC sewer pipe Gate valve Glass Gypsum ceilings HDPE pipe Paint Polyethylene Polypropylene Precast concrete products Steel roof sheeting Steel sections Timber uPVC pipes Window frames
- sands for mortar, plaster and subbase material - stone for concrete, waterbound macadam; and
road bases - transport (20 km haul) - road grade - OPC - 150 m diam - 150 x 150 junction - 106 x 212 x 73 (high-tech plant) - 106 x 212 x 73 (normal plant) - 140 mm hollow (plant manufacture) - 140 mm hollow (hand manufacture) - 65 mm thick (plant manufacture) - 450 mm dia - 600 mm dia - standard pressed metal - 150 mm dia - 80/90 mm dia RSV - 3 mm float - 32 mm dia (water) - PVA - pipe grade - pipe grade - average - 0,6 mm galvanised - commercial grade angles, channels and IPEs - structural grade - 160 mm dia (sewer, HD) - ND54 - NC1
ton
ton ton
ton ton
100 m 1
1 000 1 000
10 m2 10 m2 10 m2 100 m 100 m 10 m2
1 10 m2 10 m2 100 m
1 100 m2 10 m2 100 m
100 litre ton ton ton ton ton m3;
100 m 1 1
0,12
0,27 0,13
0,7 1,1 68,2 0,9 3
9-9,5 5,6-8,2
22,4 3,6-4,1
100 125 0,9 0,5 4,1 1,9 23 2,0 4,2 3,3 3 5
3,3 5,2 7,8 21,1 10,1 19,6 30 1,3 0,8

Best Practice Guideline 1: An overview of labour-based technologies and methods in employment intensive works Page 4 April, 2004: First edition of CIDB document 1022
Table 2 : Comparison of the number of person hours required to construct non-masonry and masonry houses
NUMBER OF PERSON HOURS (hours)
(NON MASONRY)
NUMBER OF PERSON HOURS FOR
EQUIVALENT MASONRY HOUSES (hours)
CONSTRUCTION
TYPE MATERIALS
SITE
LABOUR
TOTAL
MATERIALS
SITE
LABOUR
TOTAL
Timber (SALMA)
300
1 180
1 480
200
1 700
1 900
Precast concrete panels and posts (Blitz)
150
210
360
120
1 120
1 240
Steel frame with 110 mm brick infill panels (Belaton)
330
880
1 210
160
1 400
1 560
The researchers demonstrated how similar statistics could be generated for the provision of township services. Table 4 presents such statistics for the servicing of stands in a specific low-cost housing development in South Africa (typical electrification costs are included for comparative purposes). Table 5 presents statistics relating to the potential in roadwork activities. Person hours associated with the excavation of trenches using labour-based construction methods, based on statistics derived from Soweto's Contractor Development Programme, were then substituted for those associated with plant-based construction. The implications of using these construction methods are reflected in Table 6. Table 3 : Evaluation of non-masonry house types
ESTIMATED COSTS (1994)
(Rand)
COST/PERSON HOUR
(Rand/person hour)
CONSTRUCTION TYPE
NON-MASONRY
MASONRY
EQUIVALENT
NON-
MASONRY
MASONRY
EQUIVALENT Timber (SALMA)
47 200
46 100
32
24
Precast concrete panels and posts (Blitz)
16 000
20 300
44
16
Steel frame with 110 mm brick infill panels (Belaton)
28 400
30 800
23
20
Table 4 : Person hours required in the provision of infrastructure for a low cost township
using conventional construction methods
ESTIMATED PERSON HOURS (%)
SERVICE
MATERIALS
MANUFACTURE
SITE LABOUR
ESTIMATED TOTAL
NUMBER OF PERSON
HOURS/ERF
COST/PERSON
HOUR (Rand/person
hour) (March 1992)
Water Sewerage Roads (low standard) Stormwater Electricity
13 16 14 8 70
87 84 86 92 30
39 43 21 26 117
20 14 36 16 20

Best Practice Guideline 1: An overview of labour-based technologies and methods in employment intensive works Page 5 April, 2004: First edition of CIDB document 1022
Table 5: The employment potential of various roadwork activities
PERSON HOURS TO PRODUCE AND CONSTRUCT (person hours/m2)
ACTIVITY
THICKNESS
(mm) PLANT-BASED
LABOUR-BASED
Road bed preparation (R&R) Gravel wearing course (G5) Gravel wearing course (G4) Base course (G4) Base course (G3) Subbase (G6) Waterbound macadam base course Slurry Asphalt Concrete blocks Cast insitu (plastic cell) blocks
-
125 150 150 125 150 100 15 25 60 -
0,033 0,160 0,192 0,192 0,165 0,192 1,040 0,110 0,140
0,930+ 0,38
0,350 1,000 1,200 1,200 NA
1,200 1,370 2,011 1,170 2,120# 1,80
+ Factory produced block paving # Blocks manufactured on site using employment-intensive methods Table 6: Provision of water and sewer reticulation in a housing development using
labour-based methods of construction
LABOUR PERSON HOURS/ERF
COST/PERSON HOUR
Rand/person hour) (March 1992)
SERVICE
Plant-based
Labour-based
Plant-based
Labour-based
Water Sewerage
39 43
58 72
20 14
14 9
An analysis of Soweto's Contractor Development Programme, a programme which embraced labour-intensive methods and labour-based technologies and trained and encouraged the community to participate in the managerial, commercial and administrative aspects of construction, revealed some interesting statistics some of which are set out in Tables 7 to 9. The programme generated employment at a cost of approximately R18 /person hour, whereas the average cost for the civil engineering industry in South Africa during the study period amounted to approximately R37-50 /person hour. Table 7 : Estimated number of person hours generated in Soweto's Contractor
Development Programme
ESTIMATED NUMBER OF PERSON HOURS/UNIT (hours/unit)
TYPE OF CONSTRUCTION
UNIT
MATERIALS
SITE LABOUR
MANAGEMENT
TOTAL
Road construction (waterbound macadam + stormwater) Road construction (concrete block paving) + stormwater) Secondary Water Mains House Connection
m2
m2 m erf
0,5
0,7 0,4 0,6
6,8
8,0 5,9
31,4
1,8
1,8 0,9 6,0
9,1
10,5 8,2 38,0

Best Practice Guideline 1: An overview of labour-based technologies and methods in employment intensive works Page 6 April, 2004: First edition of CIDB document 1022
Table 8 : Expenditure per unit of employment generated in Soweto's Contractor Development Programme
TYPE OF CONSTRUCTION
UNIT
ESTIMATED
EXPENDITURE/PERSON HOUR (Rand)
Road construction (waterbound macadam) Road construction (concrete block paving) Secondary Water Mains House connections
m2
m2
m erf
17,9
18,4
17,4 17,1
Table 9 : Percentage of construction cost retained by the community in Soweto's
Contractor Development Programme
DESCRIPTION
ROAD
CONSTRUCTION
SECONDARY WATER
MAINS
HOUSE
CONNECTIONS (PLUMBING)
Labour contract Transport Materials Management Construction Management
26 2 2 7
22 8 3 6
33 9 2 6
TOTAL
37
39
50
2.3 The impact of choice of technology and construction methods on employment An examination of Tables 3 to 8 indicates that the choice of technology has a marked influence on the number and location of employment. For example, a masonry house may generate 3,5 times more person hours of employment than an equivalent precast concrete house. The same precast concrete house may, however, generate 1,25 times more person hours of employment in the manufacture of materials than the masonry equivalent. The choice of construction method can, particularly in the case of civil engineering projects, significantly influence the total number of person hours of employment generated. The construction of conventional masonry housing units, depending upon the standards adopted, realises approximately 50% more employment opportunities per unit of expenditure than plant-based servicing of sites. If, however, sites are serviced using labour-based construction practices, without increasing the total construction cost, this is 50% more effective than the construction of masonry housing units in creating employment opportunities. The choice of manufacturing method of construction components can also significantly affect the number of employment opportunities generated. For example, the ratio of person hours employment generated in conventional construction on-site to that generated in the conventional off-site manufacture of the associated materials is 9 : 1 for house construction and 6,5 : 1 for township services (roads, stormwater drainage, water supply and sewerage). There is, clearly, considerable scope for increasing employment opportunities through the use of employment-intensive methods of manufacture of materials. Changes in methods and technologies, which increase the labour content of construction and the manufacture of materials, can yield increases in the number of employment opportunities generated per unit of expenditure. This however, requires large, well established companies to change their work methods and reduce their reliance on capital intensive technologies; a difficult task. In contrast, small scale enterprises, who, being small, have limited access to capital and invariably operate and conduct their businesses in a more employment-intensive fashion and favour light equipment-based forms of construction, would have little difficulty in adopting new methods and technologies.

Best Practice Guideline 1: An overview of labour-based technologies and methods in employment intensive works Page 7 April, 2004: First edition of CIDB document 1022
Recent research in South Africa has indicated that, provided there is little or no cost premium associated with employment intensive practices, the overall increase in employment opportunities for a given project over conventional plant-based practices may reach a factor of 2 in urban infrastructure and 3 in rural road construction; increases which are extremely valuable. 3 The impact of the choice of technology The choice of technology not only influences employment parameters, as previously described, but determines who is able to participate in a project. The following two examples on the impact of technology choices illustrate this. In the first example, a church community wished to construct a 600 m2 church hall on a site where moderately expansive clays were present. A member of the congregation, who had recently been made redundant, volunteered to construct the building on a labour only basis. He had some building experience and had access to some bricklayers and a small truck and trailer. In addition, he had the necessary commercial credibility to hire any minor equipment which he required. The builder did not, however, have access to carpenters capable of constructing forms for reinforced concrete work. Nor did he own any formwork or have the experience to supervise reinforced concrete works. So, if the hall had been designed as a reinforced concrete framed building, he could not have constructed it and the church would have had to look outside their congregation for someone to construct the hall. To accommodate the builder, the hall was designed as a reinforced masonry structure. Reinforcement was placed in masonry columns and bedjoints, and fabric reinforcement in cavity walls. Using this form of construction, no formwork was required and the builder was able to use his bricklayers to construct the entire structure. The form of construction proved to be very cost effective, particularly in view of the founding conditions. In the second example, a rural community was allocated funds for the construction of school classrooms and toilet blocks, the intention being that the community, with appropriate management and technical support, would itself undertake the construction. Most of the structures were located on expansive clay and total surface movements of approximately 50 mm were predicted. Typically, structures built on sites of this nature in South Africa are founded on stiffened reinforced concrete rafts, or on piles. The community simply did not have the skills necessary for these forms of construction. Alternative solutions were sought. A cellular raft (Boucell, i.e., a foundation system which comprises two horizontal fabric reinforced slabs interconnected by a series of web beams) was finally decided upon. This system did present a few construction challenges that required some innovation to overcome. Old tyres that were obtained at no cost, filled with soil were used as void formers. Masonry was used to create a perimeter beam. (As the width of an average tyre is 170 mm, this solution enabled a course height of 85 mm to be maintained in the structure). The space at the centre of four adjoining tyres proved ample for the placing of shear links. The rafts were readily and economically constructed by the community. Sometimes it is more appropriate to look to old technologies rather than to attempt to optimise current technology. In Zimbabwe and South Africa, rubble masonry, an old technology that was investigated by 19th century engineers has been resurrected. Rubble masonry is a building material comprising uncut stones bound together with cementitious mortar. Several small dams and bridges have recently been constructed at considerably lower costs than conventional alternative designs. The advantages of using this employment intensive technology instead of conventional alternatives, include the following: • The only material purchased is cement • The acquisition costs of sand and stone, sourced in close proximity to the site, are limited to
wages for the gatherers and any blasting of rock which may be necessary. • Transportation costs are minimised, as cement which accounts for approximately 7% of the
mass of the rubble masonry structure is the only material which is hauled any significant distance.

Best Practice Guideline 1: An overview of labour-based technologies and methods in employment intensive works Page 8 April, 2004: First edition of CIDB document 1022
• Rubble masonry requires no vertical formwork to contain it during placement. This technology has not only increased employment opportunities per unit of expenditure, but has also afforded unskilled people, who live in close proximity to the projects, access to employment opportunities in Contractor development in the roads sector can be viewed as a function of the mechanisation level of the contractors as illustrated in Figure 1. As contractors master technologies that make use of light plant, they can purchase and acquire increasingly more costly plant and transform their businesses into fully mechanized ones. Figure 1: Mechanisation level of some labour-intensive construction techniques
Construction technique Level of Mechanisation Discussion
Crushed Stone / Cemented High Machine intensive
100 – 150mm water-/dry bound Macadam High
• Heavy (12 ton) roller required. • Density specification to be met. • Light surfacing types (seals) not
recommended.
Foam gravel bases High • Graded material to be compacted to
specification. • Mechanical mixing often introduced.
100 – 150mm composite Macadam Medium Heavy (12 ton plus) roller required.
Density specification to be met.
Emulsion treated bases Medium • Graded material to be compacted to
specification. • Mechanical mixing often introduced.
Concrete Interlocking blocks Medium Manufacturing considered mechanised.
75mm composite Macadam Low Only light pedestrian rollers required. “Orientation of aggregate sufficient.
Slurry-bound Macadam Low Only light pedestrian rollers required. “Orientation” of aggregate sufficient.
Direct labour Entry point Entry point
4 Implementation mechanisms 4.1 Overview In several countries in Africa and Asia long term national programmes of labour-intensive road construction and maintenance have been established. These national programmes have resulted in the creation of employment and the efficient production of as good a quality of construction and maintenance as is allowed by the funding available. This has usually, however, been executed on a pilot project basis. These programmes have resulted in the development and establishment of the skilled personnel required to supervise the site works, to liase with the beneficiary communities and to plan and administer these programmes.
The World Bank in a paper on expanding labour based methods in road works (1996) has identified six basic delivery/implementing mechanisms, viz.:
I The force account model (“in house” workforce) whereby a government body hires labour
directly (either as individual workers or as worker teams) and provides the necessary supervision, administration and management required to execute the works.

Best Practice Guideline 1: An overview of labour-based technologies and methods in employment intensive works Page 9 April, 2004: First edition of CIDB document 1022
II The conventional model whereby a conventional contractor hires labour directly and provides the supervision, administration and management required to execute the works.
III The sub-contracting model whereby a large contractor or firm sub-contracts the portions of
the projects that are labour-based to small contractors and assumes overall responsibility for the supervision, administration and management required to execute the works.
IV The government-run model whereby the responsibility for all aspects of contractor
development, including small contractor administration and payment, and the overall responsibility for the supervision, administration and management required to execute the works, lies with a government agency.
V The agency model whereby the responsibility for all aspects of contractor development
including small contractor administration and payment and the overall responsibility for the supervision, administration and management required to execute the works, lies with an independent non-profit management agency or with a for-profit consulting firm.
VI The development team model whereby the responsibility for all aspects of contractor
development and the management of the works is divided amongst the Client Body (Employer), a Construction Manager and a Materials Manager.
Models II and III promote the use of labour-based construction practices amongst established contractors; models IV to VI promote the expansion of such methods among small-scale contractors. Model V is commonly encountered in French speaking nations in West Africa where it is referred to as the Agetip model (non-profit contract management agency). Generally, model IV involves fixed rate contracts. Model VI was developed in South Africa and pioneered through Soweto’s Contractor Development Programme. It is sufficiently flexible to be used either to develop and support small scale contractors, particularly in the early stages of their development, or to implement "labour pool worker programmes" in the same manner as is done in the force account model, but with private sector firms (construction or consulting) assuming responsibility for the supervision, administration and the management of the labour, and the risk of cost overruns or failure to achieve the required quality or programme objectives being shared between the parties.
In force account operations (Model I), government has direct control over the outcomes of employment-intensive projects and is at risk for any failure to achieve programme objectives. The Government's control over the works in all the other models is, however, diminished. Its risk of failure in these models is reduced, the extent of which is dependent upon the model which is selected. The total project costs of each of the models which involve the private sector is in turn directly related to how risk is managed and assigned to the contracting parties and the nature and complexity of the work involved. 4.2 The engagement of small scale contractors in construction contracts Construction can be regarded as the synthesis of the following: • Construction management • Materials management • Materials supply • Plant and equipment • Labour
Employment-intensive construction is by nature management-intensive and requires that all the aforementioned functional activities be addressed in a project. This is true irrespective of whether or not the construction work is executed by means of force account or large or small scale contractors. Contractors, as is the case with labour units established within governmental agencies, need to have administrative, managerial and technical skills. In addition contractors, if their businesses are to be sustained, need to have commercial skills. Small contractors, particularly newly established businesses, frequently have limited skills and are unable to control cost, time and quality on their projects. Models IV to VI are structured to address these problems.

Best Practice Guideline 1: An overview of labour-based technologies and methods in employment intensive works Page 10 April, 2004: First edition of CIDB document 1022
Numerous pilot projects in a number of countries, using the abovementioned implementation methods, have demonstrated that providing adequate controls and management are put in place, direct labour and small scale contractors can successfully execute labour-based/employment-intensive projects. The challenge, however, lies in expanding these pilot projects into major programmes which can make a significant impact on the employment problem or program objectives. Many of the aforementioned models attempt to develop small scale contracting capacity to effect employment-intensive works that may previously have been executed using the force account model. Frequently the development of small scale enterprises is seen as a means of expanding programmes in a manner which reduces the management, supervisory and administrative burden placed on government's in-house resources and the risk exposure of cost overruns on programmes. The quantum of work which can be executed by small contractors in terms of models IV to VI on works of a relatively complex nature, or which have significant specialist or high equipment components, is limited as the breaking down of projects into small contracts is not always justifiable from either a cost or management point of view owing to: • the division of responsibilities, interdependence of activities, programming, duplication of
establishment charges and utilisation of resources • the lack of skilled management resources; • the general lack of commercial skills in small scale enterprises; and • the increased administration of such contracts by public bodies and their agents. As a result, the use of large scale contractors to engage more labour or to subcontract to small scale contractors has been reconsidered. Unfortunately, onerous conditions have frequently been imposed on contractors which in many instances has impaired their performance and ability to efficiently and effectively deliver infrastructure. This has often translated into increased construction costs and a concomitant erosion of the total volume of potential employment which can be realised through construction projects. In extreme cases, conventional equipment-based construction may have yielded more employment opportunities for the same amount of expenditure. 4.3 Targeted Procurement Procedures The conventional approach which has generally been adopted in Models II and III has accordingly needed to be re-engineered. An innovative new approach to procurement which addresses the current short comings of Models II and III has been developed in South Africa, viz Targeted Procurement. Targeted Procurement enables Models II and III to be efficiently and effectively implemented with minimal interference on a contractor’s ability to perform. (See Appendix 2) 4.4 Increasing employment opportunities generated per unit of expenditure Two alternative procurement approaches to implementing employment-intensive works methods can be adopted:
Method 1: Lay down the use of specific employment-intensive technologies and methods of construction/manufacture in the tender document (a variation to this approach is to specify the minimum amount of wages which are required to be paid in respect of a particular contract); Method 2: Afford tenderers the opportunity to choose the technology/construction method/method of materials manufacture which they wish to use in order to maximise the participation of labour in construction works and in so doing win bids. Suitable resource specifications can be used in both methods to ensure that the deliverables are attained. Either method may be used to increase the quantity of employment generated per unit of expenditure. Method 1 achieves this objective by restricting the use of certain types of plant/manufacturing methods and by specifying particular technologies. Method 2 (i.e. the Targeted Procurement approach), on the other hand, by means of development objective/price mechanisms and resource specification, enables tenderers to tender the amount of targeted labour, which they undertake to engage in the performance to the contract. Method 2, accordingly, permits tenderers to

Best Practice Guideline 1: An overview of labour-based technologies and methods in employment intensive works Page 11 April, 2004: First edition of CIDB document 1022
use their knowledge, skill and creativity in arriving at an optimum economic mix of equipment, technology and labour in order to meet objectives and win bids. The economic viability of Method 1 is, however, dependent on the ability of the designer/specifier to forecast cost. Any potential price premium in Method 2 can be readily assessed during the adjudication of bids. Method 2 therefore has the distinct advantage that bid prices will usually fall within acceptable limits and economic justification of decisions relating to employment generation will not be necessary. The Green Paper on Public Sector Procurement Reform in South Africa in this regard proposes the following: • A distinction should be made in the targeting of local labour in order to stimulate local economies
and the increase in employment opportunities generated per unit of expenditure. Increased credits in development objective / price mechanisms should be granted to encourage the increase in employment opportunities generated per unit of expenditure where tenderers are permitted to choose technologies and work methods.
• Any premiums to be paid in respect of employment-intensive practices should be determined
and accepted prior to the award contracts. Employment intensive practices should result in the generation of jobs as opposed to the displacement of jobs.
The Interministerial Task Team for Construction Industry Development in their Recommendations on Refinements in Public Sector Procurement Policy, Practices and Procedures in the Construction Sector reinforce the green paper proposals, viz: • Procurement in engineering and construction works should facilitate the generation of jobs in
South Africa by: encouraging the substitution of labour for capital; supporting the use of “labour friendly” technologies which utilise a higher degree of labour
input than is the case for conventional technologies, or are well suited to implementation by small scale enterprises; and
encouraging and developing small scale enterprises to implement employment-intensive practices and “labour-friendly” technologies.
• Targeted Procurement should be used to encourage cost effective employment-intensive
practices. • Any premiums to be paid in respect of employment-intensive practices should be determined and
accepted prior to the award of contracts. Employment intensive practices should result in the generation of jobs as opposed to the displacement of jobs.
Appendix 2 provides guidance on the use of Targeted Procurement Procedures on infrastructure projects to increase employment per unit of expenditure. It should be noted in this regard that SANS 1914-5 (Participation of Targeted Labour) can be used to measure the nature and quantum of employment used in both of the aforementioned procurement approaches to implementing employment-intensive works. SANS 1921-5 (Earthworks activities which are to be performed by hand) identifies earthworks activities and sub-activities which the contractor must executed by hand, can be used to readily describe the scope of work in a contract which is be executed using Method 1. 5 Selected specialist and related literature 1. Standards South Africa: SANS 1914: Targeted construction procurement Part 1:Participation of targeted enterprises Part 2: Participation of targeted partners in joint ventures Part 3: Participation of targeted enterprises and targeted partners in joint ventures Part 4: Participation of targeted enterprises and targeted labour (local resources) Part 5: Participation of targeted labour

Best Practice Guideline 1: An overview of labour-based technologies and methods in employment intensive works Page 12 April, 2004: First edition of CIDB document 1022
2. Standards South Africa: SANS 10396: Implementing Preferential Construction Procurement
Policies using Targeted Procurement Procedures 3. Watermeyer RB. (Ed) Contractor Development in Labour-based Construction. The Contractor
Development Team, Johannesburg 1992. 4. McCutcheon RT, van Zyl CWL, Croswell J, Meyer D and Watermeyer RB. Interim Guidelines for
Labour-based Construction Projects. Development Bank of Southern Africa 1992. 5. Watermeyer RB. Community-based construction : a route to sustainable development. JSA Inst
Civ Eng Vol 36, No. 1, First quarter, 1995. 6. Watermeyer RB. Evaluating employment and community opportunities presented by building and
construction projects. Employment Intensive Construction Fifteenth Annual Transportation Convention, University of Pretoria, June 1995./Volume 5, ATC Research Forum, ISSN 1019-1909, 1995.
7. Watermeyer RB. Soweto's contractor development programme: 1988-1998.City Development
Strategies. Issue no 1 October 1999 8. Watermeyer R.B. Job creation in public sector engineering and construction works projects : why,
what and how ? Commonwealth Engineer’s Council 50th Anniversary Conference : Engineering to survive - human shelter and the relief of poverty : sustainable solutions. Fourways, August 1997.
9. Watermeyer R.B. Mobilising the Private Sector to Engage in Labour-Based Infrastructure works :
A South African Perspective. Sixth Regional Seminar for Labour-based Practitioners. Ministry of Works, Transport and Communications in collaboration with ILO/ASIST, Jinja, Uganda, October 1997.
10. Watermeyer R.B. Socio-economic responsibilities : the challenge facing structural engineers.
The Structural Engineer, September 1999. 11. Watermeyer RB. The use of Procurement as an Instrument of Local Economic Development.
Institute of Municipal Engineers of South Africa’s Biannual conference, Kempton Park, October,1999.
12. Watermeyer R.B. The use of Targeted Procurement as an instrument of Poverty Alleviation and
Job Creation in Infrastructure Projects. Public Sector Procurement Law Review, Number 5 pages 201-266. 2000
13. Watermeyer RB and Band NG. The Development of Small Scale Enterprises, Skills,
Entrepreneurship and Employment Opportunities through the Provision of Housing. Working Group 3, National Housing Forum, November 1994.
14. Watermeyer RB, Nevin G, Amod S and Hallett RA. An evaluation of projects within Soweto's
Contractor Development Programme. JSA Inst Civ Eng, Vol 36, No.2, Second quarter, 1995. 15. Watermeyer R, Gounden S, Letchmiah D and Shezi S. Targeted procurement : a means by
which socio-economic objectives can be realised through engineering and construction works contracts. SA Inst CivEng, March 1998.
16. National Department of Public Works. Guidelines for enhancing employment opportunities in the
delivery of infrastructure projects. A National Public Works Programme Initiative, May 1999. 17. Technical Committee on a Public Works Programme. National Employment Creation Programme
for the Provision of Public Infrastructure Using Labour Intensive Methods. National Economic Forum, April 1994.

Best Practice Guideline 1: An overview of labour-based technologies and methods in employment intensive works Page 13 April, 2004: First edition of CIDB document 1022
18. Department of Transport. Synthesis document on Labour-based work for road and street construction and the development of small business opportunities in South Africa. South African Roads Board.
19. Steidl D. Productivity Norms for Labour-Based Construction. ASIST Information Service
Technical Brief No. 2. International Labour Organisation 1998. 20 Standards South Africa. SANS 1921-5, Construction and management requirements for works
contracts, Part 5: Earthworks activities which are to be performed by hand 22 McCutcheon, RT and Taylor Parkins, FLM (Editors). Employment and High-Standard
Infrastructure. Work Research Centre for Employment Creation in Construction. School of Civil and Environmental Engineering, University of the Witwatersrand, 2003.
Note: The International Labour Organisation has a publication which catalogues a number of key publications
which may be obtained from their ASIST Information Service entitled “The Labour-Based Technology Source Book” (see www.ilo.org/asist for further particulars)

Best Practice Guideline 1: An overview of labour-based technologies and methods in employment intensive works Page 14 April, 2004: First edition of CIDB document 1022
Appendix 1: Quantitative Employment Data on selected Construction Activities List of tables A: HOUSING AND RELATED INFRASTRUCTURE Source: Watermeyer and Band’s National Housing Forum Report (1994) on the Development
of Small Scale Enterprise, Skills, Entrepreneurship and Employment Opportunities through the Provision of Housing (see www.targetedprocurement.com)
Table A1: Approximate number of manhours required to manufacture various building and
construction material Table A2: Comparison of engineering materials Table A3: Manufacture of precast concrete components Table A4: The use of bitumen in plant-based and labour-based surfacing options Table A5: Manhours associated with the manufacture of 150mm diameter sewer pipes Table A6: Typical manhours required in the manufacture of building components Table A7: Number of manhours required in the construction of various masonry houses Table A8: Kwa Thema Extension 7: civil services for 805 erven constructed using conventional plant-
based methods Table A9: Manhours required in the provision of infrastructure for a low cost township using
conventional construction methods Table A10: Comparison of the number of manhours required to construction non-masonry and
masonry houses Table A11: Kwa Thema Extension 7: water and sewer reticulation for 805 erven using labour-based
methods of construction Table A12: Manhours required to provide and construct various township roads Table A13: Manhours associated with roadwork layers Table A14: Manhours required to surface roads Table A15: Manhours required to provide and construct an in-situ paved blocked pavement Table A16: Productivities for piece and task work in KwaZulu Table A17: Trends in excavation rates for pickable material in various projects Table A18: Trench excavation rates for a 6-hour task Table A19: Manhours associated with layerworks and kerbing on various township roads B: MINIMUM PRODUCTIVITY LEVELS Source: Notice in terms of Section 70(2) of the Labour Act, 1992. Agreement on conditions of
employment entered into between the Metal and Allied Namibian Works Union and the Construction Industries Federation of Namibia 6 April 2000, Government Gazette 31 May 2000 (No. 2340).
No Tables C: ESTIMATED PRODUCTION RATES FOR CONCRETE BLOCK PAVING Source: A Nkambule: A review of Labour Intensive Concrete Block Paving van Wyk andLouw
Inc. Table C1: Labour intensive production rates

Best Practice Guideline 1: An overview of labour-based technologies and methods in employment intensive works Page 15 April, 2004: First edition of CIDB document 1022
D: CONCRETE MASONRY GRAVITY DAMS CONSTRUCTION Source: King CD. Employment creation through the design and construction of medium
sized concrete masonry gravity dams in South Africa using Labour-based construction methods: A comparison of alternative technologies. A project report submitted to the faculty of engineering, university of the Witwatersrand, Johannesburg in partial Fulfillment of the requirements for the degree of Master of Science in engineering Johannesburg, 1994.
Table D1: Balfour dam: Productivity figures for required construction activities E: EXCAVATION Source: A critical analysis of the community-based Public Works Programme in South Africa.
A discertation submitted to the Faculty of Engineering, University of the Witwatersrand, Johannesburg, in fulfillment of the requirements for the degree of Master of Science in Engineering, Johannesburg, July 1996
Table E1: Productivity data for excavation by hand F: LABOUR-BASED STONE PAVED ROADS Source: S A1-Fayadh. Labour-based Stone Paved Roads. Kampang Cham Province
International Labour Organisation. Technical Assistance to the Labour-based Rural Infrastructure Works Programme CMB/97/M02/S10
Table F1: Work Norms: Labour-based stone paved roads G: EARTHWORKS Source: McCutcheon, RT, van Zyl CWL, Croswell J, Meyer D and Watermeyer RB. Interim
guidelines for Labour-based construction projects. Construction and Development series. Number 2 Development Bank of Southern Africa February 1993.
Table G1: Average Task Output Values Table G2: Detailed task rates for excavation H: STORMWATER DRAINAGE Source: Balmaceda P, John R and Horak E. Planning and construction of a stormwater
system by labour-intensive methods in an urban environment. Fifteenth Annual Transportation Convention, 1995.
Table H1: Output data assumed for feasibility analysis Table H2: Laying concrete pipes – summary of information from work study J: BITUMEN SURFACING Source: SABITA Labour enhanced construction for bituminous surfacings Manual II March
1993 Table J1: Preliminary South African bitumen surfacing production rates under average conditions

Best Practice Guideline 1: An overview of labour-based technologies and methods in employment intensive works Page 16 April, 2004: First edition of CIDB document 1022
K: ROAD PROJECTS Source: Greyling MR, Critical analysis of labour-intensive road projects in South Africa
funded form the sale of strategic oil. A dissertation submitted to the faculty reservers of Engineering, University of the Witwatersrand, Johannesburg, in fulfillment of the requirements for the degree of Master of Science of Engineering, 1994.
Table K1: Productivity achieved per activity (Pa) for each road authority Table K2: Productivity data for standard conditions Table K3: Adjustment factors applied to standard productivity data (According to Coukis et al, 1983:
Table 7.7) Table K4: Range of adjustment factors applied to standard productivity data (Coukis et al, Table 7.7
1983) Table K5: Productivity ratings (Pr-1) per activity (Assessment 1) Table K6: Productivity achieved in Kenya (de Veen, 1983) and Malawi (Relf, Hagen and Akute, 1987) Table K7: Productivity rating (Pr-2) Assessment 2 L: ROADWORKS Source: Watermeyer R(ed) Contractor Development in Labour-based Construction M: EARTHWORKS Source: Steidl D. Productivity Norms for Labour-Based Construction ASSIST Information
Service Technical Brief No. 2 International Labour Organisation 1998. Table M1: Soil excavation characteristics Table M2: Site clearing norms – country data Table M3: Site clearing norms – recommended values Table M4: Excavation norms – country data Table M5: Excavation norms – recommended values Table M6: Wheelbarrow haulage norms – country data Table M7: Wheelbarrow haulage norms – recommended values Table M8: Typical haulage rates for manually loaded equipment Table M9: Loading, unloading and spreading norms – country data Table M10: Loading, unloading and spreading norms – recommended values Table M11: Compaction norms – country data and recommended values Table M12: Culvert laying norms – country data Table M13: Culvert laying norms – recommended values Table M14: Typical equipment/labour combinations for gravelling Table M15: Summary of recommend values Table M16: Average worker input for completed operations Table M17: Country data for site clearing activities Table M18: Country data for excavation activities Table M19: Country data for haulage activities Table M20: Country data for loading, unloading and spreading activities Table M21: Country data for compaction activities Table M22: Country data for culvert laying activities N: TASK OUTPUT RATES Source: Department of Public Works: Guidelines for enhancing employment opportunities in
the delivery of infrastructure projects – a national Public Works Programme Initiative Table N1: Task output rates

Best Practice Guideline 1: An overview of labour-based technologies and methods in employment intensive works Page 17 April, 2004: First edition of CIDB document 1022
O: TYPICAL TASK RATES Source: McCutcheon and Marshall. Labour-intensive construction and maintenance of rival
roads: Guidelines for the training of road builders. Construction and Development Series, November 14, Development bank of Southern Africa. Development Paper 60, November 1996.
Table O1: Average task output values Table O2: Detailed task rates for excavation

Best Practice Guideline 1: An overview of labour-based technologies and methods in employment intensive works Page 18 April, 2004: First edition of CIDB document 1022
APPENDIX 1: QUANTITATIVE EMPLOYMENT DATA ON SELECTED CONSTRUCTION ACTIVITIES Comprehensive quantitative data on employment generated by various construction activities is generally lacking in the literature. The data which follows, however, appears in the literature. Users of this data should consult the publications referenced to obtain the assumptions behind the reported data. A: HOUSING AND RELATED INFRASTRUCTURE Source: Watermeyer and Band’s National Housing Forum Report (1994) on the Development of Small
Scale Enterprises, Skills, Entrepreneurship and Employment Opportunities through the Provision of Housing (see www.targetedprocurement.com)
Chapter 2: Employment opportunities through the provision of housing Table A1 : Approximate number of manhours required to manufacture various building and
construction materials
ITEM DESCRIPTION UNIT MANHOURS PER UNIT
SOURCE OF INFORMATION
REMARKS
Aggregates - sands for mortar, plaster and subbase material - sands for concrete - stone for concrete; aggregate for waterbound macadam; crushed stone for road base courses - transport
ton ton ton ton
0,12 0,15 0,27 0,13
Hippo Quarries (M Doyle)
20 km haul distance, 12 ton truck; one mechanic to 10 trucks
Asbestos ton 41,5 Central Asbestos (Pty) Ltd (J Maree)
Bitumen road grade ton 0,7 SABITA (R Vos) Distribution to within 200km. Excludes imported crude oil.
Cement OPC ton
1,1 Anglo Alpha (C Ehrke)
Transport and distribution excluded
Clay sewer pipe 150 mm diam - raw material - manufacture TOTAL 100 mm diam pipe - raw material - manufacture TOTAL 150x150mm junction - raw material - manufacture TOTAL 100 mm 90 Bend - raw material - manufacture TOTAL
100 m 100 m No No
1,90 66,30 68,20 1,03 45,04 46,07 0,01 0,86 0,87 0,01 0,30 0,31
Vitro Building Products (H Grobler)
Including constituent materials, but no distribution
Clay masonry units
106 x 212 x 73 - hightech plant - normal plant
No 1 000
3 9 - 9,5
Clay Brick Association (N Louw)
Production manhours vary depending on plant used.
Concrete masonry units
140 mm (hollow) - materials - production
10 m2
0,6 5,1 - 7,6
Concrete Masonry Association (P Kelly)
Excludes transport to site. Production

Best Practice Guideline 1: An overview of labour-based technologies and methods in employment intensive works Page 19 April, 2004: First edition of CIDB document 1022
TOTAL 140 mm (solid) - materials - production TOTAL 140 mm (hollow) - materials - production TOTAL
10 m2 10 m2
5,6 - 8,2 1,1 5,1 - 7,6 6,2 - 8,8 2,4 20,0 22,4
Portland Cement Institute (B Raath)
manhours vary depending on plant used. Manual equipment Own quarry Hand mixing
Concrete paving units
65 mm thick - materials - production TOTAL
10 m2
0,5 3,1 - 3,6 3,6 - 4,1
Concrete Masonry Association (P Kelly)
Excluding transport to site
Concrete pipes Stormwater pipe 450 mm diam 600 mm diam - material - production TOTAL 900 mm diam - material - production TOTAL 1 350 mm diam - material - production TOTAL Sewer pipe 450 mm 600 mm 900 mm 1 350 mm
100 m 100 m 100 m 100 m 100 m 100 m 100 m 100 m
100 45 80 125 100 100 200 215 120 335 104 132 210 350
Fraser Fyfe (Pty) Ltd (A Dutton)
Including raw materials Including raw materials and sacrificial lining
Concrete roof tile
- production - materials TOTAL
10 m2 0,66 0,22 0,88
Watson Tile Corporation (K Watson)
Door frames standard No 0,5 Wispeco (N Crosby)
Excludes steel in frame
FC Roof sheeting
- production - materials TOTAL
10 m2 3,9 0,2 4,1
Everite (P North)
FC Ceiling board 4 mm - production - materials TOTAL
10 m2 1,8 0,1 1,9
Everite (P North)
FC sewer pipe 150 mm diam 100 m 23 AC Pipes Klipriver (A Kapp)
Includes all constituent materials
Gate valve 80/90 mm diam RSV No 2,0 Czechtech cc (R Garrett)
Includes casting, machining, assembly and overheads
Glass 3 mm float - production - materials TOTAL
100 m2
3,6 0,6 4,2
PFG Flat Glass (J Henning)
Gypsum ceilings 10 m2 3,25 Gypsum Industries (Snowden)
12,5 mm
HDPE pipe 600 mm spiral wound - material - production TOTAL 32 mm dia (water) - materials - manufacture TOTAL
100 m 100 m
7 178 185 1 2 3
Spiropipe (A Rex) Main Industries (D Chesney-Jones)
Class 12
Hyson-cells 100 m2 0,03 Hyson-cells (J Brokenshire)

Best Practice Guideline 1: An overview of labour-based technologies and methods in employment intensive works Page 20 April, 2004: First edition of CIDB document 1022
Paint PVA 100 litre 5 Plascon Group
Services (R Johannsen)
Excludes raw materials
Polyethylene/ (Pipe grade)
- raw material - production - quality control - stockpiling TOTAL
ton 0,08 2,59 0,55 0,06 3,28
Safripol (J Kellerman)
Polypropylene/ (Pipe grade)
- raw material - production - quality control - stockpiling TOTAL
ton 0,08 4,54 0,56 0,06 5,23
Safripol ( J Kellerman)
Precast Concrete Products
- raw materials - mixing process - casting of concrete - transport - administration - maintenance TOTAL
ton 0,54 0,14 4,02 1,77 0,66 0,75 7,82
Blitz Betonwerke (N Erasmus)
Average for product range
Steel roof sheeting
0,6 mm galvanised - mining of iron ore,
dolomite, coal, etc - Steel making to
profiled section TOTAL
ton 1,1 20 21,1
Iscor (S Evans) Includes mining, etc, but excludes production of zinc for galvanising
Steel sections Commercial grade angles, channels and IPEs - mining of iron ore,
dolomite and coal, etc - steel making to rolling
into sections TOTAL
ton 1,1 9,0 10,1
Iscor (S Evans) Includes mining, etc.
Timber Structural grade - planting/ thinning/ pruning - harvesting - transport of logs to sawmill subtotal - processing - preservative treatment - transport to merchants - handling by merchants subtotal TOTAL
1 m3 2,5 2,5 0,3 5,3 10,0 2,0 0,3 2,0 ____ 14,3 19,6
SALMA (P Bryant) Planting to saw mill represents a 28 year period. Processing to handling by merchants represents a 6 week period.
uPVC sewer pipe
160 mm diam (sewer) - materials - manufacture - distribution TOTAL 90 mm diam (water) - materials - manufacture - distribution Total
100 m 100 m
1 22 7 30 1 24 7 32
Main Industries (Pty) Ltd (D Chesney-Jones)
Heavy duty pipe Class 12
Window frames - ND 54 - NC1 - NC2
No No No
1,25 0,8 0,9
Wispeco (N Crosby)
Excludes steel in frame.
Zinc ton 25,4 Zinc Corporation of South Africa (Ltd) (M Buncombe)

Best Practice Guideline 1: An overview of labour-based technologies and methods in employment intensive works Page 21 April, 2004: First edition of CIDB document 1022
Table A2 : Comparison of engineering materials
MATERIAL MANHOURS TO PRODUCE A CUBIC METRE
MANHOURS TO PRODUCE A TON
REMARKS
Concrete + High density polyethylene Masonry (class II mortar) Polypropylene Steel Timber
1,6 3,1 5,0 4,9 78,8 19,6
0,7 3,3 2,3 5,2 10,1 39,2
Pipe grade quality Pipe grade quality Angles, channels and IPEs Structural grade
+ Mechanical batching and mixing included. * Pipe extrusion excluded ' Laying of units and mixing of mortar excluded
Table A3 : Manufacture of precast concrete components
OPERATION ACTIVITIES MANHOURS/ TON
Raw materials Cement : production; transport to yard; pump into silo Aggregates : quarry operations; loading; transport
0,54 Mixing process Boomscraper; weigh process; water supply 0,14 Casting of concrete Cleaning of moulds : brushing; cleaning; carrying to
cleaning area; mixing of oil; applying of oil to moulds; move to casting yard.
Mesh reinforcement : cutting, carrying; placing. Casting and finishing : transport moulds; casting; vibrating;
smoothing off Curing : cover moulds with canvas; placing of wet steamer; firing
of boilers; steaming; filling of water tank; stacking; Remoulding : loosen sides; strip mould; transport to stacking area;
stacking; carry moulds to steaming area
4,02 Transport Load on fork truck; drive to truck; load truck with labour; cover load
with netting; transport to erection area/township; offload
1,77 Administration 0,66 Maintenance of moulds Welding; repairing; straightening; inspecting 0,75 TOTAL 7,82
Table A4 : The use of bitumen in plant-based and labour-based surfacing options
TYPE OF CONSTRUCTION DESCRIPTION Manhours/ ton of bitumen
Plant-based Hot-mix asphalt Chip and spray Slurry
0,8 2,4 - 4,3 2,4
Labour-based Cape seal and chip and spray Coarse slurry Hot-mix asphalt
30 60 15 - 20
* Sum of manhours involved in manufacture of materials, transport of materials and placing of surfacing Table A5 : Manhours associated with the manufacture of 150 mm diameter sewer pipes
PIPE MATERIAL MANHOURS REQUIRED TO PRODUCE A METRE OF PIPE
UNIT COST/MANHOUR (Rand/manhour)
Clay UPVC Fibre cement
0,68 0,23 0,23
R27-94 R65-22 R86-96
* No allowance for transport and distribution included.

Best Practice Guideline 1: An overview of labour-based technologies and methods in employment intensive works Page 22 April, 2004: First edition of CIDB document 1022
Table A6 : Typical manhours required in the manufacture of building components
COMPONENT UNIT APPROXIMATE NUMBER OF MANHOURS
REQUIRED TO MANUFACTURE A
UNIT
REMARKS
Ceilings - 4 mm fibre cement - 6,4 mm gypsum Concrete - Cladding - 12,7 mm gypsum Doors - external - internal Masonry - 90 mm walls - 110 mm wall - 140 mm walls - 220 mm walls Paint Plaster - one coat (external) - one coat (internal) Roofing - concrete tiles - galvanised iron - fibre cement Roof trusses55 - concrete tiles - fibre cement - galvanised iron Screeds Windows
m5 m5 m5 m5 No No m5 m5 m5 m5 m5 m5 m5 m5 m5 m5
m5 m5 m5 m5 m5
0,3 0,3 1,2 0,35 2,2 1,4 0,45 0,55 0,7 1,1 -
0,95 0,9 0,2 0,2 0,5
0,3 0,25 0,25 1,2 1,0
Including timbers supports Grade 15 or 20 Excludes timber supports Standard door (timber) + frame Negligible Includes purlins/battens 6 m span assumed; Fabrication excluded Includes glass and frames
* Imported asbestos excluded. Table A7 : Number of manhours required in the construction of various masonry houses
FLOOR AREA (m2)
PHYSICAL FACTOR
STRUCTURE AND FINISHES
NUMBER OF MANHOURS (hours)
MATERIALS' SITE LABOUR+
TOTAL
45 38,6 • No water and sanitary fittings. • No electricity. • Double pitched, sheeted roof. • Ceilings • Bagged and painted internally and
externally.
120 1 120 1 240
51 56,5 • Internal water and sanitary fittings. • Internal electrical reticulation. • Double pitched sheeted roof. • Ceilings • Plastered and painted internally and
externally.
160 1 400 1 560
80 82,3 • Internal water and sanitary fittings. • Internal electrical reticulation. • Double pitched sheet roof. • Ceilings • Plastered and painted internally and
externally.
200 1 700 1 900
+ Estimated from Figure 2.1 ' Estimate for basic structure and finishes based on house plans and Table 2.11; manhours involved in sanitary services,
electrical services and sundry items such as carpentry are not included.

Best Practice Guideline 1: An overview of labour-based technologies and methods in employment intensive works Page 23 April, 2004: First edition of CIDB document 1022
Table A8: Kwa Thema Extension 7 : civil services for 805 erven constructed using conventional plant based methods
SERVICE LEVEL OF
SERVICE UNITS/ ERF
COST/ ERF
ESTIMATED NUMBER OF MANHOURS (manhours/erf)
MATERIALS CONSTRUC- TION +
TOTAL
Water • Class 9 uPVC pipes (63 mm to 200 mm diam.)
• Resilient seal gate valves and fire hydrants
• Erf connections and water meters in boxes
10,0 m 789 5 34 39
Sewer • 100 mm diam clay sewer pipes. • Manholes and erf connection
8,4 m 618 7 36 43
Stormwater • 450 - 750 mm diam concrete pipes
Junction boxes, manholes and catchpits
• Headwalls and stone pitching • Concrete stormwater channels
across roads • Earth drains
0,9 m 403 2 24 26
Roads • Cast insitu kerbing • Cable ducts • 25% asphalt, surfaced roads
on crushed stone bases; remainder provided with a gravel wearing course
47 m2 755 3 18 21
TOTAL All services 2565 17 112 129
* Including P & G but excluding VAT and professional fees (March 1992) + Construction labour including non-productive P & G time (Average between two construction companies) ' Estimate based on Table 2.7
Table A9 Manhours required in the provision of infrastructure for a low cost township using conventional construction methods+
SERVICE ESTIMATED MANHOURS (%) ESTIMATED TOTAL
NUMBER OF MANHOURS/ERF
COST/MANHOUR (Rand/manhour)
MATERIALS SITE LABOUR Water Sewerage Roads Stormwater Electricity
13 16 14 8 70
87 84 86 92 30
39 43 21 26 117
20 14 36 16 20
+ Based on Tables 2.14 and 2.15 Table A10 : Comparison of the number of manhours required to construct non-masonry and
masonry houses
CONSTRUCTION TYPE
NUMBER OF MANHOURS (hours) NUMBER OF MANHOURS FOR EQUIVALENT MASONRY HOUSES (hours)*
MATERIALS+ SITE LABOUR
TOTAL MATERIALS+' SITE LABOUR TOTAL
Timber (SALMA)12
300 1 180 1 480 200 1 700 1 900
Precast concrete panels and posts (Blitz)11
150 210 360 120 1 120 1 240
Steel frame with 110 mm brick infill panels (Belaton)56
330 880 1 210 160 1 400 1 560
+ Based on information received by manufacturers and estimates from Table 2.12; manhours involved in sanitary services, electrical services and sundry items not included.
* See Table 2.13. ' Plant-based masonry manufacture.

Best Practice Guideline 1: An overview of labour-based technologies and methods in employment intensive works Page 24 April, 2004: First edition of CIDB document 1022
Table A11 : Kwa Thema Extension 7 : water and sewer reticulation for 805 erven using labour-based
methods of construction
SERVICE LABOUR MANHOURS/ERF∗ COST/MANHOUR+ Rand/manhour)
Plant-based Labour-based Plant-based Labour-based Water
Sewerage 39 43
58 72
20 14
14 9
* Includes manhours in respect of P & G and manufacture of materials. + Based on assumption that plant-based and labour-based technologies have no effect on cost. Table A12 : Manhours required to provide and construct various township roads
ROAD CONSTRUCTION TECHNOLOGY
WIDTH (m)
Man-hours/m2+
Man-hours/km +
Labour-based to
plant-based ratio
Manhours for gravel roads Class D: light gravel
Plant-based Labour-based
5 5
0,24 1,86
1 215 9 300
7,7
Class D: heavier gravel
Plant-based Labour-based
5 5
0,50 3,67
2 475 18 350
7,4
Manhours for 3 m wide surfaced Class D roads
Slurry with gravel base Plant-based Labour-based
3 3
1,48 8,06
4 431 24 183
5,5
Slurry with WBM base Plant-based Labour-based
3 3
2,27 7,75
6 819 23 253
3,4
Asphalt with G3 base
Plant-based Labour-based
3 3
1,50 6,39
4 500 19 155
4,3
Asphalt with WBM base
Plant-based Labour-based
3 3
2,30 6,96
6 909 20 880
4,6
Concrete block Plant-based Labour-based
3 3
2,19 6,82
6 555 20 460
3,1
Manhours for 5 m wide surfaced Class D roads Slurry with gravel base Plant-based
Labour-based 5 5
1,18 7,54
5 885 37 705
6,4
Slurry with WBM base Plant-based Labour-based
5 5
1,95 7,13
9 765 35 655
3,7
Asphalt with G3 base
Plant-based Labour-based
5 5
1,19 5,72
5 950 28 575
4,8
Asphalt with WBM base
Plant-based Labour-based
5 5
1,99 6,33
9 965 31 650
3,2
Concrete block Plant-based Labour-based
5 5
1,77 6,02
8 825 30 100
3,4
Manhours for 6 m wide surfaced Class B roads Slurry with gravel base Plant-based
Labour-based 6 6
1,13 6,61
6 750 39 636
5,8
Slurry with WBM base Plant-based Labour-based
6 6
2,05 7,62
12 270 45 726
3,7
Asphalt with G3 base
Plant-based Labour-based
6 6
1,20 6,08
7 170 36 450
5,1
Asphalt with WBM base
Plant-based Labour-based
6 6
2,12 7,09
12 690 42 540
3,3
Concrete block Plant-based Labour-based
6 6
2,01 8,19
12 072 49 140
4,1
+ Estimates based on assumptions set out in Appendix 2A.

Best Practice Guideline 1: An overview of labour-based technologies and methods in employment intensive works Page 25 April, 2004: First edition of CIDB document 1022

Best Practice Guideline 1: An overview of labour-based technologies and methods in employment intensive works Page 26 April, 2004: First edition of CIDB document 1022
Table A13: Manhours associated with roadwork layers
LAYER THICKNESS MANHOURS TO PRODUCE AND CONSTRUCT (manhours/m2)
PLANT-BASED 39 LABOUR-BASED Road bed preparation(R & R) Gravel wearing course(G5) Gravel wearing course(G4) Base course (G4) Base course (G3) Subbase (G6) Waterbound Macadam base course)
125 150 150 125 150 100
0,033 0,160 0,192 0,192 0,165 0,192 1,040
0,350 1,000 1,200 1,200 - 1,200 1,370
Table A14 : Manhours required to surface roads
SURFACING MANHOURS IN RESPECT OF MATERIALS AND CONSTRUCTION
(manhours/m2) TYPE THICKNESS (mm) PLANT-BASED LABOUR-BASED
Slurry Asphalt Concrete blocks
15 mm 25 mm 60 mm
0,110 0,140
0,930 +
2,011 1,170
2,120 + Factory produced block paving ' Blocks manufactured on site using labour-intensive equipment Table A15: Manhours required to provide and construct an in-situ paved block pavement41
OPERATION MANHOURS/m2 OPTION NUMBER 1 2 3 4 Concrete pump mixer
and front end loader Concrete pump mixer and wheel barrows to
place grout
Hippo drums and wheel barrows
with crushing own stone and sieving sand
Laying of cells. Place stones and compact. Mix and place grout. Finishing.
0,06 0,10
0,10
0,03
0,06 0,37
0,19
0,03
0,06 0,37
0,37 0,03
0,06 0,99
0,72
0,03
TOTAL 0,38 0,65 0,83 1,80 * Sum of manhours involved in manufacture of materials, transport of materials and construction of surfacing. Preparation of
insitu soil not included. Manhours in respect of materials based on information contained in Table 2.7. Chapter 4: RECENT DEVELOPMENTS IN EMPLOYMENT OPPORTUNITIES IN THE PROVISION OF
INFRASTRUCTURE Table A16 : Productivities for piece and task work in KwaZulu
ACTIVITY RATE LAST 500 m SECTION B
(PIECEWORK) REMAINDER OF PROJECT
(TASK WORK) Clearing (Medium to thick bush) Setting out (bulk earthworks & surfacing) - team size (4 + 1) Bulk earthworks (including spreading and levelling) Excavation of stormwater drains (Average depth 1m, 350 mm width) Drifts (unlined) - team size (5 + 1) Surfacing
34 m�/person/day 125 /day 3,3 m�/person/day 1,5 m�/person day 1 drift/day for 5 man team 5,5 m/person/day
20 to 45 m�/person/day 100 m/day 0,8 to 1,8 m/person/day 0,9 to 2 m�/person/day � drift/day for 5 man team 5 m/person/day

Best Practice Guideline 1: An overview of labour-based technologies and methods in employment intensive works Page 27 April, 2004: First edition of CIDB document 1022
Table A17 : Trends in excavation rates for pickable material in various projects 6
Project/Programme Production rates for excavation in pickable material
Soweto's Contractor development Programme6 Kenyan Rural Roads Programme2 Kwa Zulu road construction80 Kwa Zulu road construction12 Gazankulu and Venda81 Ciskei82 Ilinge27 Ibhayi34 Siviele Konstruksie41 SAFCEC21 - up to 1,0 m deep - up to 1,5 m deep
2,8 to 3,2 m3/6 hour task 3,0 m3/man day 0,7 to 1,0 m3/man day 0,3 to 1,1 m3/man day 1,0 m3/person day 0,6 to 0,8 m3/man day 2,3 m3/man day 6,0 m3/man/day 5 - 12 m3/man day 2,5 - 5,0 m3/man day 1,1 - 4,0 m3/man day
World Bank standard85 3,0 to 4,0 m3/man day Typical production rates, based on the authors' experience, for a 6 hour task, in soft materials
where the depth of excavation does not exceed 2,5 m, are presented in Table 4.5.79 It can be seen from Table 4.5 that productivity drops sharply as the material becomes more difficult to excavate by hand, the approximate ratios between soft class 1 : soft class 2 : soft class 3 being approximately 2,1:1,6:1,0 and for depths of 0-1,0:1,0-1,5:1,5-2,0:2,0-2,5 being approximately 2,2:1,9:1,5:1,0. Alternative excavation rates for different types of material, including hard rock, are presented in Table 4.6. It should be noted that productivities can vary between communities, for the same ground conditions. This may be attributed to different work ethics being prevalent. Thus although the figures contained in Table 4.5 may be regarded as being typical, they do not necessarily apply in all communities.
Table A18: Trench excavation rates for a 6 hour task79
EXCAVATION TYPE TYPICAL PRODUCTION PER 6 HOUR TASK FOR DEPTH RANGE (m3)
0 - 1,0 1,0 - 1,5 1,5 - 2,0 2,0 - 2,5 soft class 1 soft class 2 soft class 3
3,5 2,8 1,7
3,0 2,4 1,5
2,4 1,9 1,2
1,6 1,3 0,8
* Refer to Appendix B for classification of material types. Productivity is also affected by the level of skill. This is clearly evident in certain of the production
rates presented in Table 4.6. A document prepared for the South African Roads Board makes the observation that improved productivity can be expected once skills have been extensively developed. The people involved will realise that they can improve their income by producing more of the finished or required product. This will develop a healthy competition for the available work.40
APPENDIX A : STUDY ON LABOUR COMPONENT OF ROADS Basis for calculation Estimates of the number of manhours/m2 of road constructed are based on the sum of the
following, as appropriate : ∗ labour required to produce raw materials such as cement in a cement plant. ∗ labour required to manufacture precast concrete products either in a factory or on site. ∗ labour required to obtain materials in quarrying operations. ∗ labour to transport materials or precast concrete products to the site. ∗ labour to construct layers and items. Assumptions The following assumptions were made : ∗ plant productivity is equal to SAFCEC norms.

Best Practice Guideline 1: An overview of labour-based technologies and methods in employment intensive works Page 28 April, 2004: First edition of CIDB document 1022
∗ labour-based tasks are based on an 8 hour day and plant-based tasks on a 9,5 hour day. ∗ all gravel materials are available at a 20 km haul distance. ∗ crushed stone is available at a 20 km haul distance. ∗ all plant and equipment are freely available on the site in question. ∗ roadway has single camber ∗ ground surface has a fall parallel to the camber. ∗ depth of final road surface is 120 mm below original ground level. ∗ box cut extends 300 mm beyond kerb. ∗ all material from box cut is spoilt. ∗ double handling is required with respect to excavated material as spoil is stockpiled prior to
spoiling in labour-based approach. ∗ hand quarrying and hand loading assumed in labour-based approach. ∗ all excavated material is classified as soft class 2. Table A19 : Manhours associated with layerworks and kerbing on various township roads44
LAYER TYPE MANHOURS REQUIRED TO CONSTRUCT A SQUARE METRE OF ROAD
Plant-based Labour-based Light gravel road, 5 m wide
Wearing course Box cut to spoil R&R subgrade Kerbing
125 G5 nil
0,160 0,050 0,033 -
1,000 0,510 0,350 -
TOTAL 0,243 1,860 Heavier gravel road, 5 m wide
Wearing course Subbase Box cut to spoil R&R subgrade Kerbing
150 G4 125 G5 nil
0,192 0,160 0,110 0,033 -
1,200 1,000 1,120 0,350 -
TOTAL 0,495 3,670 Class D road, 3 metre wide, with bituminous slurry surfacing
Surfacing Basecourse Subbase Box cut to spoil R&R subgrade Kerbing
Slurry 15 mm 150 G4 150 G6 Mountable
0,110 0,192 0,192 0,220 0,033 0,730
2.011 1,200 1,200 1,320 0,350 0,980
TOTAL 1,477 8,061 Class D road, 3 metre wide, slurry surfacing, WBM
Surfacing Basecourse Subbase Box cut to spoil R&R subgrade Kerbing
Slurry 15 mm 100 WBM 125 G6 Mountable
0,110 1,040 0,160 0,200 0,033 0,730
2,011 1,370 1,000 2,040 0,350 0,980
TOTAL 2,273 7,751 Class D road, 3 metre wide, with asphalt surfacing
Surfacing Basecourse Subbase Box cut to spoil R&R subgrade Kerbing
Asphalt 25 mm 125 G3 150 G6 Mountable
0,140 0,165 0,192 0,240 0,033 0,730
1,170 0,165 1,200 2,520 0,350 0,980
TOTAL 1,500 6,385 Class D road, 3 metre wide, asphalt, WBM
Surfacing Basecourse Subbase Box cut to spoil R&R subgrade Kerbing
Asphalt 25 mm 100 WBM 125 G6 Mountable
0,140 1,040 0,160 0,200 0,033 0,730
1,170 1,370 1,000 2,090 0,350 0,980
TOTAL 2,303 6,960

Best Practice Guideline 1: An overview of labour-based technologies and methods in employment intensive works Page 29 April, 2004: First edition of CIDB document 1022
Class D road, 3 metre wide, concrete block surfacing
Surfacing Basecourse Box cut to spoil R&R subgrade Kerbing
Concrete block 150 G4 Mountable
1,040 0,192 0,190 0,033 0,730
2,310 1,200 1,980 0,350 0,980
TOTAL 2,185 6,820 Class D road, 5 metre wide, with bituminous slurry surfacing
Surfacing Basecourse Subbase Box cut to spoil R&R subgrade Kerbing
Slurry 15 mm 150 G4 150 G6 Mountable
0,110 0,192 0,192 0,210 0,033 0,440
2,011 1,200 1,200 2,190 0,350 0,590
TOTAL 1,177 7,541 Class D road, 5 metre wide, slurry surfacing, WBM
Surfacing Basecourse Subbase Box cut to spoil R&R subgrade Kerbing
Slurry 15 mm 100 WBM 125 G6 Mountable
0,110 1,040 0,160 0,170 0,033 0,440
2,011 1,370 1,000 1,810 0,350 0,590
TOTAL 1,953 7,131 Class D road, 5 metre wide, with asphalt surfacing
Surfacing Basecourse Subbase Box cut to spoil R&R subgrade Kerbing
Asphalt 25 mm 125 G3 150 G6 Mountable
0,140 0,165 0,192 0,220 0,033 0,440
1,170 0,165 1,200 2,240 0,350 0,590
TOTAL 1,190 5,715 Class D road, 5 metre wide, asphalt, WBM
Surfacing Basecourse Subbase Box cut to spoil R&R subgrade Kerbing
Asphalt 25 mm 100 WBM 125 G6 Mountable
0,140 1,040 0,160 0,180 0,033 0,440
1,170 1,370 1,000 1,850 0,350 0,590
TOTAL 1,993 6,330 Class D road, 5 metre wide, concrete block surfacing
Surfacing Basecourse Box cut to spoil R&R subgrade Kerbing
Concrete block 150 G4 Mountable
0,930 0,192 0,170 0,033 0,440
2,120 1,200 1,760 0,350 0,590
TOTAL 1,765 6,020 Class B road, 6 metre wide, with bituminous slurry surfacing
Surfacing Basecourse Subbase Box cut to spoil R&R subgrade Kerbing
Slurry 15 mm 125 G3 150 C4 Mountable
0,110 0,165 0,267 0,190 0,033 0,360
2,011 0,165 1,600 1,990 0,350 0,490
TOTAL 1,125 6,606 Class B road, 6 metre wide, slurry surfacing, WBM
Surfacing Basecourse Subbase Box cut to spoil R&R subgrade Kerbing
Slurry 15 mm 125 WBM 150 G5 Mountable
0,110 1,160 0,192 0,190 0,033 0,360
2,011 1,580 1,200 1,990 0,350 0,490
TOTAL 2,045 7,621 Class B road, 6 metre wide, with asphalt surfacing
Surfacing Basecourse Subbase Box cut to spoil R&R subgrade Kerbing
Asphalt 30 mm 125 G3 150 C4 Mountable
0,170 0,165 0,267 0,200 0,033 0,360
1,400 0,165 1,600 2,070 0,350 0,490
TOTAL 1,195 6,075

Best Practice Guideline 1: An overview of labour-based technologies and methods in employment intensive works Page 30 April, 2004: First edition of CIDB document 1022
Class B road, 6 metre wide, asphalt, WBM
Surfacing Basecourse Subbase Box cut to spoil R&R subgrade Kerbing
Asphalt 30 mm 125 WBM 150 G5 Mountable
0,170 1,160 0,192 0,200 0,033 0,360
1,400 1,580 1,200 2,070 0,350 0,490
TOTAL 2,115 7,090 Class B road, 6 metre wide, concrete block surfacing
Surfacing Basecourse Subbase Box cut to spoil R&R subgrade Kerbing
Concrete block 150 C3 150 G5 Mountable
0,930 0,267 0,192 0,230 0,033 0,360
2,120 1,600 1,200 2,430 0,350 0,490
TOTAL 2,012 8,190

Best Practice Guideline 1: An overview of labour-based technologies and methods in employment intensive works Page 31 April, 2004: First edition of CIDB document 1022
B: MINIMUM PRODUCTIVITY LEVELS Source: Notice in terms of Section 70(2) of the Labour Act, 1992. Agreement on conditions of
employment entered into between the Metal and Allied Namibian Works Union and the Construction Industries Federation of Namibia 6 April 2000, Government Gazette 31 May 2000 (No. 2340).
The minimum wage rate as determined and agreed under item 3 above are subject to minimum productivity levels as below. Failure to maintain productivity levels will be addressed by additional training or disciplinary and incapacity procedures as the case may be. 1. Labourer Excavations in pickable material 2 to 7m³ / day (not exceeding 2m deep) Filling under surface beds 5 to 7m³ / day Concrete (mix and place in terms of 1 artisan / 10 labourers) 3 to 6m³ / day 2. Bricklayer / Plasterer Stock bricks 685 no. / day Face bricks 450 no. / day Plaster to horizontal surfaces 22,5m² / day Plaster to vertical surfaces 31,5m² / day 3. Carpenter Rough formwork to all structures 22,5m² / day Smooth formwork to all structures 16,2m² / day Hanging doors with furniture 8 no. / day Ceilings including brandering 27m² / day Roof covering including purlins 67,5m² / day 4. Tiler Glazed tiles to walls 19,8m² / day Ceramic tiles to floors 21,6m² / day 5. Painter/Glazier Undercoat and two coats paint to walls 37,8m² / day Undercoat and two coats paint to ceilings 30,6m² / day Two coats varnish to wood 32,4m² / day Prime, first coat and two coats enamel to surfaces 32,4m² / day Glazing generally 31,5m²/day 6. VA Tile / Carpet Layer VA tiles to floor 72m² / day Carpet plus underfelt to floors 67,5m² / day

Best Practice Guideline 1: An overview of labour-based technologies and methods in employment intensive works Page 32 April, 2004: First edition of CIDB document 1022
C: ESTIMATED PRODUCTION RATES FOR CONCRETE BLOCK PAVING Source: A Nkambule: A review of Labour Intensive Concrete Block Paving van Wyk and Louw
Inc. Table C1: Labour Intensive Production rates
Operation Activity Minimum task Site clearance
Bush clearing Stripping and grubbing Tree and stump removal
(R McCutcheon) 150 – 750 m²/day 100 – 200 m²/day Experience
Earth works
Slotting Excavation to level: Cut < 250 mm
> 250 mm Borrow to fill: Excavate & load (throwing 0-4m) in:- loose soil firm soil hard soil Haulage (wheelbarrow): 0-20m 40-60m 80-100m Spreading
4m³/day (R McCutcheon) 5 m³/day 4 m³/day 3.5m³/day (K25-Work study) 2.5m³/day 1.5m³/day 13.5m³/day (R McCutcheon) 8.0m³/day 5.5m³/day 12m³/day
Edge restraint
Lay precast kerb units Backfill to side wall and hand tamping Concrete edge beam
10m/day (C. Dyer) 3m³/day 10m/day (Montshioa Report)
Block paving
Placing the bedding sand, laying the units, compacting the units, filling the joints and removing excess sand.
16m²/day (SA Const World Oct 1994) 100m²/5 persons/day (Montshioa Report)

Best Practice Guideline 1: An overview of labour-based technologies and methods in employment intensive works Page 33 April, 2004: First edition of CIDB document 1022
D: CONCRETE MASONRY GRAVITY DAMS CONSTRUCTION
Source: King CD. Employment creation through the design and construction of medium sized concrete masonry gravity dams in South Africa using Labour-based construction methods: A comparison of alternative technologies. A project report submitted to the faculty of engineering, university of the Witwatersrand, Johannesburg in partial Fulfillment of the requirements for the degree of Master of Science in engineering Johannesburg, 1994.
Table D1: BALFOUR DAM: PRODUCTIVITY FIGURES FOR REQUIRED CONSTRUCTION
ACTIVITIES
Activity Date Output Stone collecting 1991
September 1994
0,09m³/man/day
0,57m³/man/day
Concrete building September/October 1993
October/November 1993
November/January 1994
January/February 1994
September 1994
0,71m³/man/day
0,61m³/man/day
0,43m³/man/day
0,74m³/man/day
2,29m³/man/day
Block making September/October 1993
October/November 1993
November/January 1994
January/February 1994
September 1994
3,14 blocks/man/day
2,2 blocks/man/day
2.14 blocks/man/day
2,83 blocks/man/day
4,56 block/man/day
NOTE:
(i) Items like stone collecting is not on-going everyday. The team is used for excavating and cleaning as well, so accurate figures are not obtainable.
(ii) Stones are added to the concrete when it is cast in the wall. These two operations can only match the volumes of concrete batched and the teams cannot thus control their own productivity.

Best Practice Guideline 1: An overview of labour-based technologies and methods in employment intensive works Page 34 April, 2004: First edition of CIDB document 1022
E: EXCAVATION Source: A critical analysis of the community-based Public Works Programme in South Africa.
A discertation submitted to the Faculty of Engineering, University of the Witwatersrand, Johannesburg, in fulfillment of the requirements for the degree of Master of Science in Engineering, Johannesburg, July 1996
Table E1: Productivity data for excavation by hand
Excavation only cu.m/man-day Material Type Daily paid Task work Piece work
Soft/very loose soil 1.67-5.00 3.34-10.00 6.67-20.00 Firm/loose soil 1.04-3.13 2.09-6.26 4.17-12.50 Stiff/compact soil 0.75-2.25 1.50-4.50 3.00-9.00 Very stiff/dense soil 0.60-1.79 1.19-3.57 2.38-7.14 Hard/very dense soil 0.49-1.47 0.98-2.94 1.96-5.88 Soft rock 0.42-1.25 0.84-2.51 1.67-5.01
Source: Derived Table from World Bank (in Coukis, 1983:180 & 284)

Best Practice Guideline 1: An overview of labour-based technologies and methods in employment intensive works Page 35 April, 2004: First edition of CIDB document 1022
F: LABOUR-BASED STONE PAVED ROADS Source: S A1-Fayadh. Labour-based Stone Paved Roads. Kampang Cham Province
International Labour Organisation. Technical Assistance to the Labour-based Rural Infrastructure Works Programme CMB/97/M02/S10
Table F1: Work Norms: Labour-based stone paved roads
Task Method Unit Work Norm Unit/day
Remarks
Breaking stone boulders
Crowbar and sledgehammer Blocks 17
20
200mm thick blocks
150mm thick blocks Loading and unloading blocks from trucks or oxcarts
Wheelbarrow and/or by hand Blocks 180 Unskilled labour
Shaping the blocks Club hammer and cutting tools Blocks 100 Unskilled labour Dressing the blocks Club hammer and cutting tools Blocks 50 Unskilled labour Box cutting, sand cushioning and construction filter drains
How, shovel, spade, rake / spreader, pickaxe, mattock, bungee or basket, wheelbarrow, hand rammer and watering can
m³ 1.75 Unskilled labour
Packing stones Club hammer and by hand m² 6.50 Skilled labour Filling voids Shovel, spade, rake / spreader,
bungee or basket and wheelbarrow m² 30 Unskilled labour
Compaction Plate compactor and pedestrian roller m² 30 Unskilled labour Construction of shoulder Hoe, shovel, spade, rake / sp reader,
pickaxe, mattock, bungee or basket, wheelbarrow, hand rammer and watering can
m² 20 Unskilled labour
Clearing the site m 20 Unskilled labour

Best Practice Guideline 1: An overview of labour-based technologies and methods in employment intensive works Page 36 April, 2004: First edition of CIDB document 1022
G: EARTHWORKS Source: McCutcheon, RT, van Zyl CWL, Croswell J, Meyer D and Watermeyer RB. Interim
guidelines for Labour-based construction projects. Construction and Development series. Number 2 Development Bank of Southern Africa February 1993.
Table G1: Average Task Output Values
Operation Activity Minimum Task Site clearance Bush clearing - dense
- light to medium Stripping and grubbing Tree and stump removal Boulder removal
Determine on site 150m² – 750m²/day 100m² - 200m²/day experience 200 day/km
Earthworks Slotting Excavation to level Cut < 0,25m > 0,25m borrow to fill Haulage (wheelbarrow) 0-20m 40-60m 80-100m Spreading
4m³/day 5m³/day 4m³/day 4m³/day 13,5m³/day 8,0m³/day 5,5m³/day 12m³/day
Drainage Ditching Sloping Camber formation Mitre drains Catchwater drains Scour checks Culvert installation
3,75m³/day 3,75m³/day 100m²/day 3,75m³/day 3,75m³/day 25/day max. 20 days/line
Gravelling Excavation Load Spreading
3m³/day 6m³ (loose)/day 12m³/day
Source: McCutcheon (1983) an Simpson (1980) Table G2: Detailed task rates for excavation
Task Rates (m³/man-day) Throwing Distance (m)
Soil type Tools
0-4 4-6 6-8 Loose, not sticky soil Firm soil Very hard soil, hard soil mixed with stones
Shovel, jembe Shovel, fork jembe Pickaxe, fork jembe, shovel
5,0-6,0
3,5-4,5
2,0-3,0
4,5-5,5
3,0-4,0
1,8-2,5
3,5-4,5
2,5-3,5
1,7-2,5
Source: de Veen (1980)

Best Practice Guideline 1: An overview of labour-based technologies and methods in employment intensive works Page 37 April, 2004: First edition of CIDB document 1022
H: STORMWATER DRAINAGE Source: Balmaceda P, John R and Horak E. Planning and construction of a stormwater
system by labour-intensive methods in an urban environment. Fifteenth Annual Transportation Convention, 1995.
Table: H1: Output data assumed for feasibility analysis
MAIN ACTIVITY
SUBACTIVITY GANG SIZE PRODUCTION RATE
Excavation of soft soil Only supervisor 100 m³ Excavation of soft rock Only supervisor 30 m³
Machine Excavation
Excavation of hard rock Only supervisor 6 m³ Excavation of soft soil,10 man-gang 10-man gang 20 m³ Hand
Excavation Excavation of soft rock, 10 man-gang 10-man gang 10 m³ Concrete pipes (ø 450mm): trimming, bedding, laying, backfilling & compaction
5-man gang 14,4 m Pipe laying by machine
Concrete pipes (ø 600mm): trimming, bedding, laying, backfilling & compaction
5-man gang 14,4 m
Concrete pipes (ø 450 mm): trimming, bedding, laying, backfilling & compaction
10-man gang 12 m
Concrete pipes (ø 600 mm): trimming, bedding, laying, backfilling & compaction
10-man gang 9,6 m
Pipe laying by hand
Plastic pipes (ø 450 mm): trimming, bedding, laying, backfilling & compaction
5-man gang 18 m
Batching, mixing and pouring concrete for channel floor 5-man gang 3 m³ Construction of brick-wall for culvert (transport, batching and mixing concrete)
10-man gang 60 m²
Construction of kerb-inlets, manholes and grids (max length of chamber: 2,4m) (Transport, batching and mixing of mortar, machine backfilling & compaction)
5-man gang 0,33 number
Masonry
Construction of kerb-inlets, manholes and grids (max length of chamber: 2,4m) (Transport, batching and mixing of mortar, hand backfilling & compaction)
5-man gang 0,25 number
Table H2: Laying concrete pipes – summary of information from work study
PIPE DIAMETER
COSTING INFO GANG UTILIZATION INPUT/OUTPUT COEFF OPTIMUM GANG SIZE
(mm) (Man-hours/m) Idle time
%
Utilization
%
(min/pipe) (m/hour) (number)
450 1,16 49,4 50,6 27,782 5,2 6
525 1,16 49,4 50,6 27,782 5,2 6
600 1,16 49,4 50,6 27,782 5,2 6
675 1,54 55,2 44,8 27,782 5,2 8
750 1,54 55,2 44,8 27,782 5,2 8

Best Practice Guideline 1: An overview of labour-based technologies and methods in employment intensive works Page 38 April, 2004: First edition of CIDB document 1022
J: BITUMEN SURFACING Source: SABITA Labour enhanced construction for bituminous surfacings Manual II March 1993 Table J1: Preliminary South African bitumen surfacing production rates under average
conditions
ITEM METHOD PRODUCTION RATE
Sweep basecourse Hand broom 1 000m²/man-day
Tractor, trailer, 2 000 litre tank,
pump, spraybar
6 100m²/5 man-days
Bakkie, 750 litre tank, handlances 3 800m²/5 man-days
Load and spray water and prime
200 litre drum on trolley 3 300m²/5 man-days
Tractor, trailer, 2 000 litre tank,
pump, spraybar
2 800²/5 man-days
Bakkie, 750 litre tank, handlances 1 800m²/5 man-days
Load, heat, spray dust palliative or
bitumen onto geotextile
200 litre drum on trolley 1 500m²/5 man-days
Spread chip and backchip as
required
Stone or sand 200-400m²/man-day
Slurry mix on site and spread Small concrete mixer, hand tools 10m³/15 man-days

Best Practice Guideline 1: An overview of labour-based technologies and methods in employment intensive works Page 39 April, 2004: First edition of CIDB document 1022
K: ROAD PROJECTS Source: Greyling MR, Critical analysis of labour-intensive road projects in South Africa
funded form the sale of strategic oil. A dissertation submitted to the faculty reservers of Engineering, University of the Witwatersrand, Johannesburg, in fulfillment of the requirements for the degree of Master of Science of Engineering, 1994.
Table K1: Productivity achieved per activity (Pa) for each road authority
ACTIVITY UNIT (1)
KWZ QWA LEB KWD GAZ & VEN (2)
BOP CIS TRN-QMC
TRN-DWE
TRN-DAF
Site clearance
(grubbing)
Excavation - loose
- stiff
Loading (1m rise)
Unloading
(300mm)
Spreading/shaping
Watering: cart
: cans
Compaction
vibratory
-roller
-tamper
m²/md
m³/md
m³/md
m³/md
m³/md
m²/mcd
m²/md
m³/mcd
m³/md
20-45
3
-
6
6
12
15-30
1.5-2.5
1-2
6
7
2.5
25
-
12
-
-
0.8
0.6
-
-
-
-
-
-
-
-
-
0.3-0.5
-
-
93
-
35
-
9
1
-
-
-
2.5
-
-
-
-
15-95
1.2-1.9
0.5-0.8
1.4-1.9
1.4-2.2
6
12-64
-
17-53
-
64-210
0.4-0.8
-
15
3
1.7
-
14.7
-
1.5
-
1.3
0.8
-
-
1-2
-
-
-
-
-
2.0
-
2.0
-
2
-
-
52
-
25
1.3
0.8
2.0
-
2.5-3
-
-
20
-
Grouted stone
pitching
Loose stone
packing
Pipe laying
Fencing
Rock Collection
(1km)
Masonry walls
Drifts (dry
masonry)
Concrete mix &
pour
Setting out
Gabion
construction
Haul -
tractor/trailer
- truck 3km
-w/barrow (100m)
m³/md
m³//md
m/md
m/md
m³//md
m³//md
no./md
m³//md
m/md
m³//md
m³//mcd
m³//mcd
m³//md
1
0.5
0.5
0.2
125
0.6
-
0.8
-
1
0.6-1.5
0.6
1.5
-
0.45
-
-
2
-
0.4
0.4
-
0.4
1.5-
2
-
1.5
-
0.4-
0.6
-
-
2.5
-
0.4
-
-
-
0.02
2
-
-
-
57
-
-
1
1.5
-
-
-
0.2
0.4
-
-
-
-
-
-
-
-
50
-
-
0.03
-
48
-
10-19
-
-
-
3-6
-
3.5
0.5
0.75
-
-
-
1-2
2
15
1
-
-
-
-
-
1
0.8-
1.5
-
-
-
-
37
-
0.2
0.6
1
-
-
0.3
0.6
0.6
-
-
-
-
-
-
-
-
-
-
-
-
-
-
-
-
-
-
NOTE:
1) md = man-days; mcd – machine-days 2) measurement and control of productivity only carried out on a limited basis 3) TPA, PAO,NPA CPA and KaNgwane have been excluded due to either the plant – intensive nature of their projects or
lack of sufficient representative data.
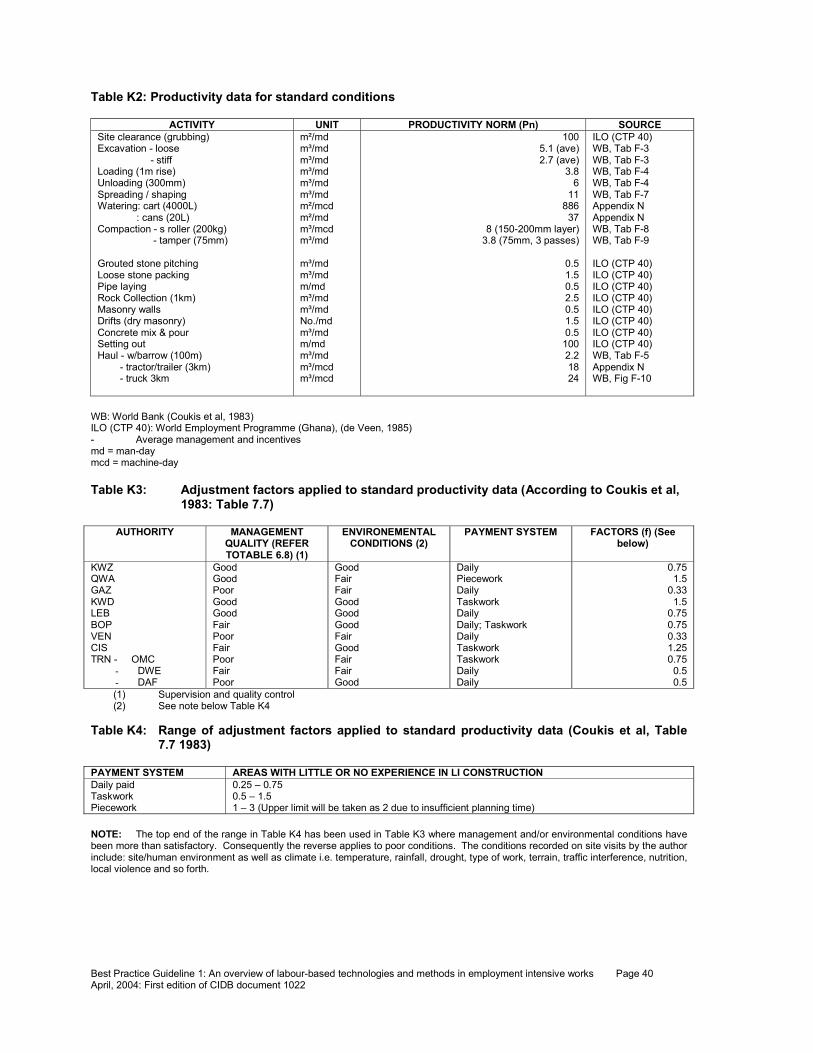
Best Practice Guideline 1: An overview of labour-based technologies and methods in employment intensive works Page 40 April, 2004: First edition of CIDB document 1022
Table K2: Productivity data for standard conditions
ACTIVITY UNIT PRODUCTIVITY NORM (Pn) SOURCE Site clearance (grubbing) Excavation - loose - stiff Loading (1m rise) Unloading (300mm) Spreading / shaping Watering: cart (4000L) : cans (20L) Compaction - s roller (200kg) - tamper (75mm) Grouted stone pitching Loose stone packing Pipe laying Rock Collection (1km) Masonry walls Drifts (dry masonry) Concrete mix & pour Setting out Haul - w/barrow (100m) - tractor/trailer (3km) - truck 3km
m²/md m³/md m³/md m³/md m³/md m³/md m²/mcd m²/md m³/mcd m³/md m³/md m³/md m/md m³/md m³/md No./md m³/md m/md m³/md m³/mcd m³/mcd
100 5.1 (ave) 2.7 (ave)
3.8 6
11 886 37
8 (150-200mm layer) 3.8 (75mm, 3 passes)
0.5 1.5 0.5 2.5 0.5 1.5 0.5 100 2.2 18 24
ILO (CTP 40) WB, Tab F-3 WB, Tab F-3 WB, Tab F-4 WB, Tab F-4 WB, Tab F-7 Appendix N Appendix N WB, Tab F-8 WB, Tab F-9 ILO (CTP 40) ILO (CTP 40) ILO (CTP 40) ILO (CTP 40) ILO (CTP 40) ILO (CTP 40) ILO (CTP 40) ILO (CTP 40) WB, Tab F-5 Appendix N WB, Fig F-10
WB: World Bank (Coukis et al, 1983) ILO (CTP 40): World Employment Programme (Ghana), (de Veen, 1985) - Average management and incentives md = man-day mcd = machine-day Table K3: Adjustment factors applied to standard productivity data (According to Coukis et al, 1983: Table 7.7)
AUTHORITY MANAGEMENT QUALITY (REFER TOTABLE 6.8) (1)
ENVIRONEMENTAL CONDITIONS (2)
PAYMENT SYSTEM FACTORS (f) (See below)
KWZ QWA GAZ KWD LEB BOP VEN CIS TRN - OMC
- DWE - DAF
Good Good Poor Good Good Fair Poor Fair Poor Fair Poor
Good Fair Fair Good Good Good Fair Good Fair Fair Good
Daily Piecework Daily Taskwork Daily Daily; Taskwork Daily Taskwork Taskwork Daily Daily
0.75 1.5
0.33 1.5
0.75 0.75 0.33 1.25 0.75 0.5 0.5
(1) Supervision and quality control (2) See note below Table K4
Table K4: Range of adjustment factors applied to standard productivity data (Coukis et al, Table
7.7 1983) PAYMENT SYSTEM AREAS WITH LITTLE OR NO EXPERIENCE IN LI CONSTRUCTION Daily paid Taskwork Piecework
0.25 – 0.75 0.5 – 1.5 1 – 3 (Upper limit will be taken as 2 due to insufficient planning time)
NOTE: The top end of the range in Table K4 has been used in Table K3 where management and/or environmental conditions have been more than satisfactory. Consequently the reverse applies to poor conditions. The conditions recorded on site visits by the author include: site/human environment as well as climate i.e. temperature, rainfall, drought, type of work, terrain, traffic interference, nutrition, local violence and so forth.

Best Practice Guideline 1: An overview of labour-based technologies and methods in employment intensive works Page 41 April, 2004: First edition of CIDB document 1022
Table K5: Productivity ratings (Pr-1) per authority per activity (Assessment 1) ACTIVITY UNIT KWZ QWA LEB KWD GAZ-
VEN BOP CIS TRN-
OMC TRN-DWE
TRN-DAF
%
Site clearance(grubbing)
Excavation - loose
- stiff
Loading (1m rise)
Unloading (300mm)
Spreading / shaping
Watering: cart (4000L)
: cans (20L)
Compaction - v roller (200 kg)
- tamper 75 mm
m²/md
m³/md
m/md
m³/md
m³/md
m³/md
m²/md
m²/md
m³/mcd
m³/md
2
4
5
5
5
1
2
2
5
4
1
1
5
1
2
1
1
5
1
3
3
3
2
2
3
2
3
1
5
5
1
2
2
1
2
2
2
2
1
5
5
2
5
3
3
3
5
3
5
50
51
40
83
65
48
20
100
40
Grouted stone pitching
Loose stone packing
Pipe laying
Rock Collection 91km)
Masonry walls
Drifts (dry masonry)
Concrete mix & pour
Setting out
Haul - w/barrow 100m
- tractor/trailer (3km)
- truck (3km)
m³/md
m³/md
m/md
m³/md
m³/md
No./md
m³/md
m/md
m³/md
m³/mcd
m³/mcd
5
5
2
1
5
4
5
2
5
2
5
3
2
5
1
5
5
5
3
1
5
5
5
5
2
5
1
3
5
5
1
5
2
1
3
5
5
5
4
4
5
5
4
5
87
84
93
30
100
46
100
80
50
60
87
Rating (%) 75 63 60 65 69 55 49 67 86 73 66 Where:
Pr Range 5 4 3 2 1
Pa ≥ fPn 0.75fPn ≤ Pa < fPn 0.5fPn ≤ Pa < 0.75fPn 0.25fPn ≤ Pa < 0.5fPn 0 ≤ Pa < 0.25fPn
Pa = productivity achieved (Table K1) Pn = productivity norm (Table K2) f = factor (Table K3) Pr-1 = productivity rating (/activity) Table K6: Productivity achieved in Kenya (de Veen, 1983) and Malawi (Relf, Hagen and Akute,
1987) ACTIVITY UNIT PRODUCTIVITY
RANGE AVERAGE SOURCE
Site clearance (grubbing) Excavation - loose - stiff Loading – 1m rise (loose) Haulage – w/barrow (100m) Spreading / shaping Compaction – tamper Pipe laying Masonry walls Concrete mix & pour Grouted stone pitching Loose stone packing
m²/man-day m³/man-day m³/man-day m³/man-day m³/man-day m³/man-day m³/man-day m /man-day m³/man-day m³/man-day m³/man-day m³/man-day
100-250 5-6 3.5-4.5 12-15 5.5-7 12 12-15 1.7 1.3 1.6 1.75 3
175 5.5 4 13.5 6.3 12 13.5 1.7 1.3 1.6 1.75 3
K.R.A.R.P K.R.A.R.P K.R.A.R.P K.R.A.R.P K.R.A.R.P K.R.A.R.P K.R.A.R.P D.R.I.M.P D.R.I.M.P D.R.I.M.P D.R.I.M.P D.R.I.M.P

Best Practice Guideline 1: An overview of labour-based technologies and methods in employment intensive works Page 42 April, 2004: First edition of CIDB document 1022
Table K7: Productivity rating (Pr-2) Assessment 2 ACTIVITY UNIT KWZ QWA LEB KWD GAZ &
VEN BOP CIS TRN-
OMC TRN-DWE
TRN-DAF
%
Site clearance (grubbing)
Excavation - loose
- stiff
Loading – 1m rise (loose)
Haulage – w/barrow
(100m)
Spreading / shaping
Compaction – tamper
Pipe laying
Masonry walls
Concrete mix & pour
Grouted stone pitching
Loose stone packing e.g.
drifts
m³/md
m³/md
m³/md
m³/md
m³/md
m³/md
m³/md
m/md
m³/md
m³/md
m³/md
m³/md
1
3
-
2
-
5
-
2
-
-
-
2
1
2
2
2
2
1
-
2
4
4
2
1
-
1
1
-
-
-
-
1
5
4
-
1
-
-
1
-
-
-
-
1
-
5
5
1
1
1
-
-
-
1
-
4
-
2
-
2
2
2
1
1
-
3
-
-
-
-
-
1
4
1
-
1
1
1
1
-
3
-
-
5
-
1
1
-
-
1
-
-
4
-
-
2
-
2
-
1
-
1
-
3
1
2
1
1
1
1
1
1
-
-
-
-
-
-
-
-
33
31
23
27
30
37
-
43
68
68
53
36
Rating (%) 50 42 43 52 37 33 43 36 30 20* 41 NOTE: md = man-day *Transkei (D.A.F): Too few activities were monitored for an accurate assessment to be made.

Best Practice Guideline 1: An overview of labour-based technologies and methods in employment intensive works Page 43 April, 2004: First edition of CIDB document 1022
L: ROADWORKS Source: Watermeyer R(ed) Contractor Development in Labour-based Construction Since task work forms the basis of measurement and payment in labour-based construction work, construction rates need to be assessed at an early stage of a project. Pilot schemes (small scale, trial or demonstration projects) can be run before the main project to determine these rates. A recent road building pilot project undertaken in Soweto yielded the following production rates for a contractor employing 25 labourers:
Activity Daily Production (production / contractor/day)
Task (production / labourer/day)
Soft excavation Intermediate excavation Loading and carting away of spoil Leveling of road bed Picking of road bed Compaction of road bed Construction of kerbing: straight curved Spreading of waterbound macadam Leveling of waterbound macadam Spreading of fines (dry processing) Compacting of waterbound macadam
80,0 m³ 40,0 m³
137,5 m³ 1 500,0 m² 1 000,0 m²
500,0 m²
162,5 m 50,0 m
1 250,0 m² 625,0 m²
1 250,0 m² 500,0 m²
3,2 m³ 1,6 m³ 5,5 m³
60,0 m² 40,0 m²
-
6,5 m 2,0 m
50,0 m² 25,0 m² 50,0 m² 20,0 m²

Best Practice Guideline 1: An overview of labour-based technologies and methods in employment intensive works Page 44 April, 2004: First edition of CIDB document 1022
M: EARTHWORKS Source: Steidl D. Productivity Norms for Labour-Based Construction ASSIST Information
Service Technical Brief No. 2 International Labour Organisation 1998. Table M1: Soil excavation characteristics
Activity definition
Soil description Suitable tools
Cohesive Non-cohesive
Soft Soft Very loose Easily excavated with a shovel or hoe
Medium Firm Loose Can be dug with a shovel
Hard Stiff Compact Mattock, pick or other swung tool required
Very hard Very stiff or hard Dense or very dense Crowbar required in addition to pick
Rock Rock Sledge hammer and chisels required
Table M2: Site clearing norms – country data
Average productivity by type of cover m² per worker day
Country Dense bush
Medium bush Light bush Grubbing De-stumping
Botswana — 750 750 150 — Cambodia 30 60 100 15 0.75 Ghana — — 375 375 — Indonesia 130 175 — 37.5 1 Kenya 50 150 300 100 — Lesotho 50 100 250 65 — Tanzania 50 100 250 150 3.5 Zimbabwe 200 — 300 250 — WB Study — — 150 15 — Median 50 125 275 100 1
Table M3: Site clearing norms – recommended values
Average productivity by type of cover m² per worker day
Dense bush
Medium bush
Light bush
Grubbing De-stumping
Country median 50 125 275 100 1 Site trials 105 209 311 209 — RARP 320 480 640 I75 — Recommended value 100 200 350 175 By experience

Best Practice Guideline 1: An overview of labour-based technologies and methods in employment intensive works Page 45 April, 2004: First edition of CIDB document 1022
Table M4: Excavation norms – country data
Country Average productivity by soil classification m³ per worker day
Soft Medium Hard Very hard Rock
Botswana 4.15 3.8 2.5 1.9 — Cambodia 2.75 2 1.25 0.75 — China 9 7.0 3 2 — Ghana 3.75 3.75 3.75 3.75 — Indonesia — — 2.5 — — Kenya 5 3.5 2.25 1.75 0.75 Lesotho 4.5 3.5 2.75 1 0.5 Nepal — 3.3 2.5 — 0.61 Tanzania 5.5 4.5 4 2.5 — Zimbabwe 5.5 5.5 4 3.5 2 WB Study 6.7 2.1 3 2 1.7 Median 5.00 3.50 2.75 2.00 0.75 Table M5: Excavation norms – recommended values
Average productivity by soil classification m3 per worker day
Soft Medium Hard Very hard Rock
Country median 5.00 3.50 2.75 2.00 0.75 Site trials 3.6 3.2 3.45 2.2 0.8 RARP 5.5 4 3 2 — Recommended value
5.0 3.5 3.0 2.0 0.8
Table M6: Wheelbarrow haulage norms – country data
Country Wheelbarrow haulage norms by haul distance m3 per worker day
0-20m 20-40m 40-60m 60-80m 80-100m 100-150m
Botswana 8.4 7 6.7 5.6 5.2 4.7
Kenya 10.5 10.5 8 6.5 5.5 4.5
Lesotho 8 6 5 4.5 4 —
Tanzania 11 11 8.25 6.25 5.25 5
Zimbabwe 5 5 5 5 5 4
Median 8.4 7 6.7 5.6 5.2 4.6 Table M7: Wheelbarrow haulage norms – recommended values
Wheelbarrow haulage norms by haul distance m³ per worker day
0-20m 20-40m 40-60m 60-80m 80-100m 100-150m
Country median 8.4 7.0 6.7 5.6 5.2 4.6 Site trials 5.3 4.8 4.6 4.3 4.2 4.1 RARP 13.5 10.5 8.5 6.5 5.5 — Recommended value 8.5 7.0 6.5 5.5 5.0 4.5

Best Practice Guideline 1: An overview of labour-based technologies and methods in employment intensive works Page 46 April, 2004: First edition of CIDB document 1022
Table M8: Typical haulage rates for manually loaded equipment
Haul route condition Good Average Poor
Haul distance (km) 2 4 6 8 10 2 4 6 8 10 2 4 6 8 10
Trips per day per truck 22 19 16 11 8 18 15 12 8 6 16 12 10 7 5
Trips per day per tractor/trailer combination
20 12 8 6 4 18 11 6 5 4 16 9 4 4 3
Table M9: Loading, unloading and spreading norms – country data
Country Average productivity rates m³
Loading Unloading Spreading
Botswana 12 — 14
Cambodia 8 15.5 5.25
Ghana 6.7 10 —
Kenya 10 9 13.5
Lesotho 5 — 14.25
Tanzania 11 — 15
Zimbabwe 8.5 — 9
World Bank — — 11
Median 8.5 10 13.5 Table M10: Loading, unloading and spreading norms – recommended values
Average productivity rates m³ per worker day
Loading Unloading Spreading
Country median 8.5 10 13.5 Site Trials 6.5 11 12 RARP 8.5 — 13.5 Recommended value 8.5 10 13.5 Table M11: Compaction norms – country data and recommended values
Country Manual compaction Equipment compaction
m3 per worker day m2 per roller day
Cambodia 10 —
China 3.2 —
Kenya 7.5 700
Lesotho 15 700
Tanzania 9 700
Median 9.0 700
Recommended value 9.0 700

Best Practice Guideline 1: An overview of labour-based technologies and methods in employment intensive works Page 47 April, 2004: First edition of CIDB document 1022
Table M12: Culvert laying norms – country data Country Activity
Culvert installation m per worker day
Concrete m³ per worker day
Masonry m³ per worker day
Cambodia — 1.25 1.25 China 1.2 — — Kenya 0.3 1 1.5 Lesotho 1.1 1.75 1.35 Zimbabwe 0.8 0.8 0.75 Median 0.9 1.13 1.3 Table M13: Culvert laying norms – recommended values
Country Activity
Culvert installation
m per worker day
Concrete m³ per worker day
Masonry m³ per worker day
Country median 0.9 1.13 1.3
Site trials 0.95 0.6 0.6
Recommended value
0.9 1.0 1.0
Table M14: Typical equipment /labour combinations for gravelling
Haul distance Loads per day
Total volume Excavation Loading Un-loading Spreading
Km unit Loose m3 Workers per tractor
Workers per tractor Workers per tractor
Workers per tractor
0 to 2 18 54 18 7 6 4 2 to 4 11 33 11 4 4 2 4 to 6 7 21 7 3 2 2 6 to 8 5 15 5 2 2 1
8 to 10 4 12 4 2 1 1
Table M15: Summary of recommended values SITE CLEARING
Average productivity by type of cover m² per worker day
Dense bush Medium bush
Light bush Grubbing De-stumping
Recommended value
100 200 350 175 By experience
EXCAVATION
Average productivity by soil classification m3 per worker day
Soft Medium Hard Very hard Rock
Recommended value 5.0 3.5 3.0 2.0 0.8

Best Practice Guideline 1: An overview of labour-based technologies and methods in employment intensive works Page 48 April, 2004: First edition of CIDB document 1022
WHEELBARROW HAULAGE Wheelbarrow haulage norms by haul distance
m³ per worker day 0-20m 20-40m 40-60m 60-80m 80-100m 100-150m
Recommended value 8.5 7.0 6.5 5.5 5.0 4.5
LOADING, UNLOADING AND SPREADING
Average productivity rates m³ per worker day
Loading Unloading Spreading
Recommended value 8.5 10 13.5
COMPACTION
Manual compaction
Equipment compaction
m3 per worker day m2 per roller day
Recommended value 9.0 700
CULVERT LAYING
Culvert installation
Concrete Masonry
m per worker day m³ per worker day m³ per worker day
Recommended value
0.9 1.0 1.0
TYPICAL HAULAGE RATES FOR MANUALLY LOADED EQUIPMENT
Haul route condition
Good Average Poor
Haul distance (km) 2 4 6 8 10 2 4 6 8 10 2 4 6 8 10
Trips per day per truck
22 19 16 11 8 18 15 12 8 6 16 12 10 7 5
Trips per day per tractor/trailer combination
20 12 8 6 4 18 11 6 5 4 16 9 4 4 3
TYPICAL EQUIPMENT / LABOUR COMBINATIONS FOR GRAVELLING
Haul distance
Loads per day
Total volume
Excavation Loading Un-loading Spreading
Km unit Loose m3 Workers per tractor
Workers per tractor
Workers per tractor Workers per tractor
0 to 2 18 54 18 7 6 4
2 to 4 11 33 11 4 4 2
4 to 6 7 21 7 3 2 2
6 to 8 5 15 5 2 2 1
8 to 10 4 12 4 2 1 1

Best Practice Guideline 1: An overview of labour-based technologies and methods in employment intensive works Page 49 April, 2004: First edition of CIDB document 1022
Table M16: Average worker input for completed operations
Project Operation Input
Construction of worker days/km
Botswana Earth road 1981
Botswana Gravel topping only 2157
Ghana DFR Gravel lowland road 1580
Kenya MRP Earth lowland road 1442
Kenya MRP Gravel topping only 1819
Kenya MRP Regravelling 1209
Laos LAO/90/MO1/FRG Gravel lowland road 2203
Lesotho LCU Gravel lowland road 2645
Lesotho LCU Gravel mountain road 4400
Zimbabwe LBDU Gravel lowland road 3260

Best Practice Guideline 1: An overview of labour-based technologies and methods in employment intensive works Page 50 April, 2004: First edition of CIDB document 1022
ANNEX 2: Country productivity data Note: There are many gaps in the tables below. However, it is hoped that the publication and dissemination of this Brief will stimulate readers to contribute to filling in the gaps. If you have relevant data, please send it to one of the ASIST offices (see the back cover for addresses).
Table M17: Country data for site clearing activities
Production Bush clearing Other clearing targets Dense Medium Light Grubbing De-stumping Boulder removal m² m² m² m² m² m² m² m² No No No NoCountry Min Max Min Max Min Max Min Max Min Max Min MaxBotswana 750 750 150 Cambodia 20 40 40 80 80 120 10 20 1 1 China Ghana 350 400 350 400 5 15India 130 150 200 30 45 1 Kenya 50 150 300 0 200 Exp ExpLesotho 50 100 250 30 100 1 DsMozambique Tanzania 50 100 250 150 2 5 Ds DsThailand Zimbabwe 200 300 200 300 1 10World Bank 150 15 Minimum 20 40 40 80 80 120 0 15 1 1 1 10Maximum 20 200 150 750 350 750 350 400 2 5 5 15Average 20 87 95 230 215 315 103 153 1 2 3 13Median 20 50 95 125 215 275 30 150 1 1 3 13Number of records 1 6 2 6 2 8 6 9 2 4 2 2
Actual output Unit Botswana Ghana Kenya Lesotho Mozambique Zimbabwe Clearing Hr/task Max Hr/task Max Hr/task Max Hr/task Max Hr/task Max Hr/task Max Dense Bush m2 17.4 33.9 11.3 Medium Bush m2 29.2 53.8 27.5 45 Light Bush m2 35 64.9 52.5 65Grubbing <20 cm m2 27.5 31.3 75De-stumping > 20 cm No Boulder removal No
Ds = Depends upon the size; Exp = By experience

Best Practice Guideline 1: An overview of labour-based technologies and methods in employment intensive works Page 51 April, 2004: First edition of CIDB document 1022
Table M18: Country data for excavation activities
Production targets for excavation in cubic metres per task Soft Medium Hard Very hard Rock
Country Min Max Min Max Min Max Min Max Min Max Botswana 3.8 4.5 3.1 4.5 2.5 2.5 1.9 1.9 Cambodia 2.5 3.0 1.5 2.5 1.0 1.5 0.5 1.0 China 9.0 7.0 3.0 2.0 Ghana 3.0 4.5 3.0 4.5 3.0 4.5 3.0 4.5 Indonesia 1.7 3.5 2.5 Kenya 4.0 6.0 2.0 5.0 1.5 3.0 1.5 2.0 0.5 1.0 Lesotho 4.0 5.0 3.0 4.0 2.5 3.0 0.5 1.5 0.5 1.5 Mozambique Tanzania 5.0 6.0 4.0 5.0 3.5 4.5 2.0 3.0 Thailand Zimbabwe 5.0 6.0 5.0 6.0 3.0 5.0 3.0 4.0 1.0 3.0 World Bank 6.7 4.2 3.0 2.0 1.7 Minimum 2.5 3.0 1.5 2.5 1.0 1.5 0.5 1.0 0.5 1.0 Maximum 5.0 9.0 5.0 7.0 3.5 5.0 3.0 4.5 1.0 3.0 Average 3.9 5.6 2.9 4.6 2.4 3.3 1.8 2.4 0.7 1.8 Median 4.0 6.0 3.0 4.5 2.5 3.0 1.9 2.0 0.5 1.6 Number of records 7 9 8 10 7 10 7 9 3 4
Actual output of excavation in cubic metres per task Soft Medium Hard Very hard Rock
Country Hr/task Max Hr/task Max Hr/task Max Hr/task Max Hr/task Max Botswana 5.2 3.6 5.2 3.2 5.2 2.9 Cambodia 6.0 6.0 6.0 6.0 6.0 China 10.0 10.0 10.0 10.0 Ghana 5.0 4.1 5.0 4.1 5.0 4.1 5.1 4.2 Indonesia Kenya 4.0 3.0 5.0 2.5 5.0 2.0 1.5 1.3 5.0 0.9 Lesotho 3.3 2.9 1.4 0.7 Mozambique Tanzania Thailand Zimbabwe 5.0 5.0 5.0 4.5 5.0 4.0 5.0 3.0 World Bank Minimum 4.0 3.0 5.0 2.5 5.0 2.0 1.5 1.3 5.0 0.7 Maximum 10.0 5.0 10.0 4.5 10.0 4.1 10.0 4.2 6.0 0.9 Average 5.9 3.8 6.0 3.4 6.0 3.3 5.5 2.5 5.5 0.8 Median 5.1 3.6 5.1 3.2 5.1 3.5 5.1 2.2 5.5 0.8 Number of records 6 5 6 5 6 4 5 4 2 2

Best Practice Guideline 1: An overview of labour-based technologies and methods in employment intensive works Page 52 April, 2004: First edition of CIDB document 1022
Table M19: Country data for haulage activities
Production targets for hauling in cubic metres per task 0-20 m 20-40 m 40-60 m 60-80 m 80-100 m 100-150 m
Country Min Max Min Max Min Max Min Max Min Max Min Max Botswana 8.4 7.0 6.7 5.6 5.2 4.7 Cambodia China Ghana Indonesia Kenya 10.5 10.5 8.0 6.5 5.5 4.5 Lesotho 8.0 6.0 5.0 4.5 4.0 - Mozambique Tanzania 10.0 12.0 10.0 12.0 7.5 9.0 6.0 6.5 5.0 5.5 5.0 Thailand Zimbabwe 5.0 5.0 5.0 5.0 5.0 4.0 World Bank Minimum 10.0 5.0 10.0 5.0 7.5 5.0 6.0 4.5 5.0 4.0 0.0 4.0 Maximum 10.0 12.0 10.0 12.0 7.5 9.0 6.0 6.5 5.0 5.5 0.0 5.0 Average 10.0 8.8 10.0 8.1 7.5 6.7 6.0 5.6 5.0 5.0 0.0 4.6 Median 10.0 8.4 10.0 7.0 7.5 6.7 6.0 5.6 5.0 5.2 0.0 4.6 Number of records 1 5 1 5 1 5 1 5 1 5 0 4
Actual output of excavation in cubic metres per task 0-20 m 20-40 m 40-60 m 60-80 m 80-100 m 100-150 m
Country Hr/task Max Hr/task Max Hr/task Max Hr/task Max Hr/task Max Hr/task MaxBotswana 5.0 6.0 5.0 5.0 5.0 4.5 5.0 4.0 5.0 3.8 5.0 3.3Cambodia China Ghana 5.9 4.6 5.9 4.6 5.9 4.6 5.9 4.6 5.9 4.6 5.9 4.6Indonesia Kenya Lesotho 3.5 3.5 3.5 3.5 3.5 3.5Mozambique Tanzania Thailand Zimbabwe 5.0 9.0 5.0 9.0 5.0 8.0 5.0 7.0 6.0 6.0 6.0 5.0World Bank Minimum 5.0 3.5 5.0 3.5 5.0 3.5 5.0 3.5 5.0 3.5 5.0 3.3Maximum 5.9 9.0 5.9 9.0 5.9 8.0 5.9 7.0 6.0 6.0 6.0 5.0Average 5.3 5.8 5.3 5.5 5.3 5.2 5.3 4.8 5.6 4.5 5.6 4.1Median 5.0 5.3 5.0 4.8 5.0 4.6 5.0 4.3 5.9 4.2 5.9 4.1Number of records 3 4 3 4 3 4 3 4 3 4 3 4

Best Practice Guideline 1: An overview of labour-based technologies and methods in employment intensive works Page 53 April, 2004: First edition of CIDB document 1022
Table M20: Country data for loading, unloading and spreading activities
Production targets Botswana Cambodia China Ghana Indonesia Kenya Load, unload, spread Unit Min Max Min Max Min Max Min Max Min Max Min MaxLoading soil m3 12 8 12 8 10Loading gravel m3 5 7 6.7 8 10Unloading soil m3 15 20 8 10Unloading gravel m3 12 15 10 8 10Spreading soil m3 10 5 7.5 12 15Spreading soil m2 50 60 Spreading gravel m3 18 3.5 5 12 15Spreading gravel m2 50 75 35 50
Production targets Lesotho Mozambique Tanzania Thailand Zimbabwe World BankLoad, unload, spread Unit Min Max Min Max Min Max Min Max Min Max Min MaxLoading soil m3 12 15 Loading gravel m3 5 7 10 8 9 Unloading soil m3 Unloading gravel m3 Spreading soil m3 14 16 15 18 7 10 11Spreading soil m2 90 60 90 Spreading gravel m3 12 15 12 10 Spreading gravel m2 60 60
Actual output Botswana Cambodia China Ghana Indonesia Kenya Load, unload, spread Unit Hr/task Max Hr/task Max Hr/task Max Hr/task Max Hr/task Max Hr/task MaxLoading soil m3 6 6 9Loading gravel m3 6 6.25 6.5 6 9Unloading soil m3 6 9Unloading gravel m3 6 12.7 6 9Spreading soil m3 6 Spreading soil m2 5.4 91 6 13Spreading gravel m3 6 6 13Spreading gravel m2 5.8 86
Actual output Lesotho Mozambique Tanzania Thailand Zimbabwe World BankLoad, unload, spread Unit Hr/task Max Hr/task Max Hr/task Max Hr/task Max Hr/task Max Hr/task MaxLoading soil m3 5 6 Loading gravel m3 5 6 Unloading soil m3 5 11 Unloading gravel m3 5 11 Spreading soil m3 5 11 Spreading soil m2 Spreading gravel m3 5 11 Spreading gravel m2

Best Practice Guideline 1: An overview of labour-based technologies and methods in employment intensive works Page 54 April, 2004: First edition of CIDB document 1022
Table M21: Country data for compaction activities
Production targets Handrammer Formation Structures Slopes m³ m³ m³ Country Min Max Min Max Min MaxBotswana Cambodia 10.0 12.5 7.5 10.0China 5.7 2.5 1.5Ghana Indonesia Kenya 6.0 9.0 6.0 9.0Lesotho Mozambique Tanzania 8.0 10.0Thailand Zimbabwe World Bank Minimum 8.0 5.7 6.0 2.5 6.0 1.5Maximum 10.0 12.5 6.0 9.0 7.5 10.0Average 9.0 9.4 6.0 5.8 6.8 6.8Median 9.0 10.0 6.0 5.8 6.8 9.0Number of records 2 3 1 2 2 3
Production targets Mechanical Formation Structures Slopes Structures Slopes Structures m³ m³ m³ m² m² m² Country Min Max Min Max Min Max Min Max Min Max Min MaxBotswana Cambodia 75.0 100.0 10.0 13.5 China 16.7 Ghana Indonesia Kenya Lesotho 100.0 150.0 700.0 Mozambique Tanzania 140.0 700.0 Thailand Zimbabwe 250.0 World Bank 170.0 280.0 Minimum 75.0 16.7 10.0 13.5 0.0 700.0 Maximum 170.0 280.0 10.0 13.5 0.0 700.0 Average 115.0 156.1 10.0 13.5 0.0 700.0 Median 100.0 145.0 10.0 13.5 0.0 700.0 Number of records 3 6 1 1 0 2
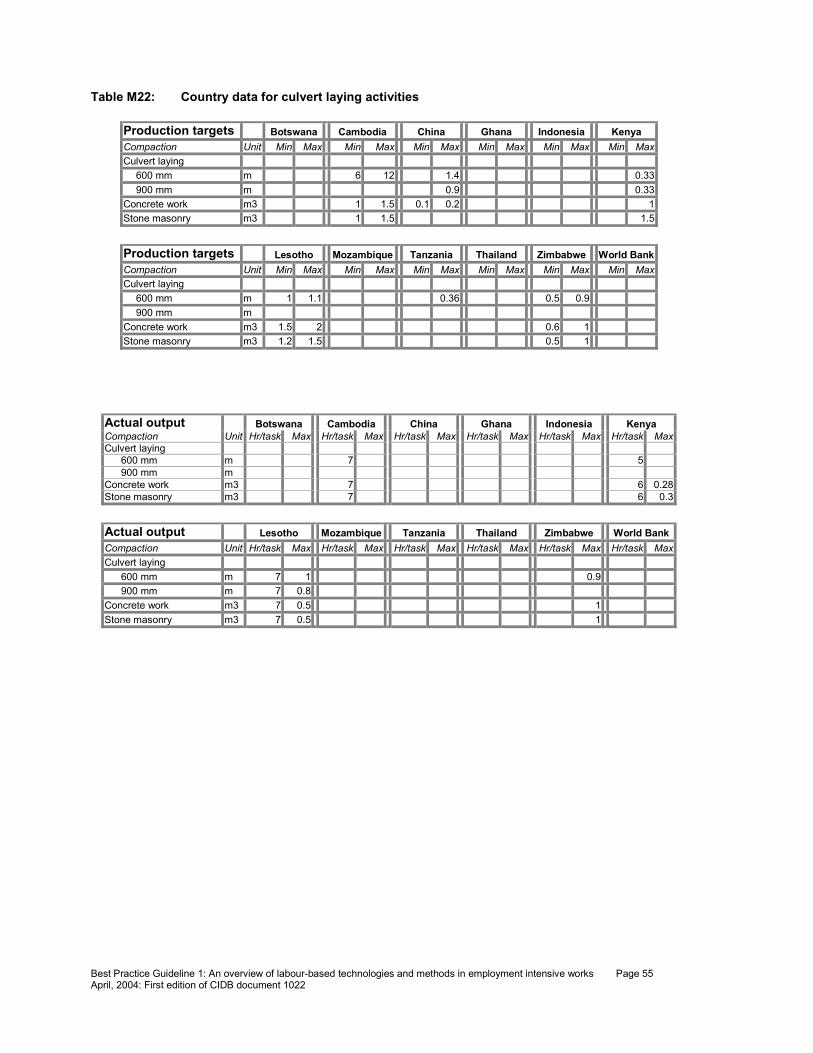
Best Practice Guideline 1: An overview of labour-based technologies and methods in employment intensive works Page 55 April, 2004: First edition of CIDB document 1022
Table M22: Country data for culvert laying activities
Production targets Botswana Cambodia China Ghana Indonesia Kenya Compaction Unit Min Max Min Max Min Max Min Max Min Max Min MaxCulvert laying 600 mm m 6 12 1.4 0.33 900 mm m 0.9 0.33Concrete work m3 1 1.5 0.1 0.2 1Stone masonry m3 1 1.5 1.5
Production targets Lesotho Mozambique Tanzania Thailand Zimbabwe World BankCompaction Unit Min Max Min Max Min Max Min Max Min Max Min MaxCulvert laying 600 mm m 1 1.1 0.36 0.5 0.9 900 mm m Concrete work m3 1.5 2 0.6 1 Stone masonry m3 1.2 1.5 0.5 1
Actual output Botswana Cambodia China Ghana Indonesia Kenya Compaction Unit Hr/task Max Hr/task Max Hr/task Max Hr/task Max Hr/task Max Hr/task MaxCulvert laying 600 mm m 7 5 900 mm m Concrete work m3 7 6 0.28Stone masonry m3 7 6 0.3
Actual output Lesotho Mozambique Tanzania Thailand Zimbabwe World BankCompaction Unit Hr/task Max Hr/task Max Hr/task Max Hr/task Max Hr/task Max Hr/task MaxCulvert laying 600 mm m 7 1 0.9 900 mm m 7 0.8 Concrete work m3 7 0.5 1 Stone masonry m3 7 0.5 1

Best Practice Guideline 1: An overview of labour-based technologies and methods in employment intensive works Page 56 April, 2004: First edition of CIDB document 1022
N: TASK OUTPUT RATES Source: Department of Public Works: Guidelines for enhancing employment opportunities in
the delivery of infrastructure projects – a national Public Works Programme Initiative 1. Indicative production rates for selected activities
The following production rates are presented as a guide only. Actual production rates may vary, depending on local conditions. Table N1: Task output rates
ACTIVITY DESCRIPTION UNIT PRODUCTION RATES (Various sources)
RECOMMENDED PRODUCTION RATE
Clearing m² 150 250 150
300-800
150-300
Clear and grub
Clearing and grubbing m² 150 60 80 100 180
-
80-150
Trenches (± 0.5 m wide) (0.0 m to 1.0 m deep)
m 9.5 7.5 10
7-10
Trenches (± 0.5 m wide) (1.0 m to 1.25 m deep)
m 7.0 5.5 6.0
5-7
Excavation
Trenches (normal trench width and depth)
m³ 6.0 5.6 4.5 2.5 2.0 3.5
3-6
Earthworks - Soft class 1 soil) (In wider excavations double handling might have to be allowed for)
m³ 4.0-5.5 4.8
2-5.5 4.0
2.8-3.2 3.0 2.3 6.0
5-12 2.5-5.0 3.0-4.0 4.8-5.5
3.0 2.5 3.5 3.3
2.0-4.0 1.6-2.4 2.0-3.0
2,5-5,0
- Intermediate (soil) (In wider excavations double handling might have to be allowed for)
m³ 2.5-3.5 3.3 4.0 2.5 2.0
2.0-3.0
EXCAVATION
- Hard (soil) (In wider excavations double handling might have to be allowed for )
m³ 2.1-2.2 2.0 1.6
0.5-2.0
1.0-2.0
BORROWPITS Select and load rock Feed crusher Load gravel
m³
m³
m³
2
3.5
6
2
3.5 6
SPREADING Earthworks
m³
12.0 7.0
12.0-16.0
7.0-12.0

Best Practice Guideline 1: An overview of labour-based technologies and methods in employment intensive works Page 57 April, 2004: First edition of CIDB document 1022
Remove oversize material Verge (incl. Compaction)
m³
m³
2.5
4.7
2-3
4-5 Hauling Wheelbarrow
0m-20m 40m-60m 60m-80m 80m-100m
m³
m³
m³
m³
13.5 10.5
10.5 8.0
8.0 6.5
7.0 5.0
10-13
8-10
6-8
5-6
Backfilling Trenches Excavations
m³
m³
4.0 10.5
2.0-5.0
4-8
2-5 Waterbound Macadam (WBM)
Construct Spread coarse material Spread and broom fines
m³
m³ m³
0.8 0.6 0.16 4.7 4.7
0.5-0.8
4.7 4.7
Surfacing Sweep basecourse Spread chips and backchip Slurry mix and spread Spread asphalt
m³
m²
m³
m³
490 1 000
300
200-400 1.5 0.67
0.4
1 000
200-400
0.8-1.2
0.4 Concrete blocks
Laying of blocks m² 20 17
15-20
Kerbs
Laying of pre-cast m 10 26
10-20
Manhole construction Place precast manhole rings (300 mm high) Mix and place benching Place precast manhole cover-slabs
no.
no.
no.
4.5
2
2.5
4.5 2
2.5
Concrete Mixing Placing
m³
m³
0.7-3.0
1.1-4.0
0.7-1.5
1.0-4.0
Roadmarking Painting (100 mm line)
m 150 150
Pipe laying 100-150 mm diameter sewer 100-150 mm diameter water HDPE water pipe
m
m
m
19-24
14-19
125
19-24
14-19
125

Best Practice Guideline 1: An overview of labour-based technologies and methods in employment intensive works Page 58 April, 2004: First edition of CIDB document 1022
O: TYPICAL TASK RATES Source: McCutcheon and Marshall. Labour-intensive construction and maintenance
of rival roads: Guidelines for the training of road builders. Construction and Development Series, November 14, Development bank of Southern Africa. Development Paper 60, November 1996.
Table O1: Average task output values
Operation Activity Minimum Task Site clearance Bush clearing – dense light to medium
Stripping and grubbing Tree and stump removal Boulder removal
Determine on site 150m² - 750m²/day 100m² - 200 m²/day Experience 200 day/km
Earthworks Slotting Excavation to level Cute < 0,25 m > 0,25 m Borrow to fill Haulage (wheelbarrow) 0-20 m 40-60m 80-100m Spreading
4m³/day 5m³/day 4m³/day 4m³/day 13,5m³/day 8,0m³/day 5,5m³/day 12m³/day
Drainage Ditching Sloping Camber formation Mitre drains Catchwater drains Scour checks Culvert installation
3,75m³/day 3,75m³/day 100m² /day 3,75m³/day 3,75m³/day 25/day max. 20 days/line
Gravelling Excavation Load Spreading
3m³/day 6m³ (loose)/day 12m³/day
Source: McCutcheon (1983) and Simpson (1980) Table O2: Detailed task rates for excavation
Task rates (m³/man-day) Throwing distance (m)
Soul Type Tools
0-4 4-6 6-8 Loose, not sticky soil Firm soil Very hard soil, hard soil mixed with stones
Shovel, jembe Shovel, for k jembe Pickaxe, fork jembe, shovel
5,0-6,0
3,5-4,5
2,0-3,0
4,5-5,5
3,0-4,0
1,8-2,5
3,5-4,5
2,5-3,5
1,7-2,5
Source: De Veen (1980, 1983)

Best Practice Guideline 1: An overview of labour-based technologies and methods in employment intensive works Page 59 April, 2004: First edition of CIDB document 1022
Table O3: Resource inputs, example from Lesotho
Plant Materials Ref Work item Unit Labour m.d tpd rd ftd Spray day cd Mixer day Cement
pkt Stone cu.m
Bitume drum
Weldimesh sq/m
1 2 3
Formation work Excavation 1500 cu m/km 2000 cu m/km 2500 cu m/km 3000 cu m/km Gravelling -haul = 0-2 km 5m wide -haul = 2-7 km 5m wide -haul = 7-20 km 5m wide Road maintenance (lengthmen system)
km km km km km km km
1280 1480 1730 1980 823 1025 1175
14 20 41
10 10 10
4 5 6 7 8 9 10
Dry stone masonry =w.bhaul of stone =tphaul of stone Cement bound Stone masonry =w.bhaul of stone & sand =tphaul of stone & sand 1:2:4 concrete =w.bhaul of stone & sand =tphaul of stone & sand 1:3:6 concrete =w.bhaul of stone & sand =tphaul of stone & sand Track excavation Ditch excavation Ditch lining =w.bhaul of stone & sand =tphaul of stone & sand
cu.m cu.m cu.m cu.m cu.m cu.m cu.m cu.m km km lin.m lin.m
2,5 2 3,7 3,1 3,5 3 3,7 3,1 336 224 1 0,84
0,065 0,022 0,098 0.091 0,161 0,065 0,141 0,007 0,029
0,5 0,5
9 5,6
1,7 1,7 7 7 5 5
11 12
Grassing Gabions =w.bhaul of stone =tphaul of stone
sq.m cu.m cu.m
0,1 3,2 2,7
0,05 0,12
,006 ,003
13 14
600 pipe culvert 900 pipe culvert Stone slab culvert =w.bhaul of stone & s and
per culv per culv per culv per culv
11 12 42 41
0,3 0,5 0,212 0,374
8 8

Best Practice Guideline 1: An overview of labour-based technologies and methods in employment intensive works Page 60 April, 2004: First edition of CIDB document 1022
15 =tphaul of stone & sand Culvert headwalls =w.bhaul of stone & sand =tphaul of stone & sand
per culv per culv
6 5
0,039 0,185
3 3
16 17 18 19 20 21
Vented ford =w.bhaul of concrete =tphaul of stone & sand Vented ford (rock) =w.bhaul of stone & sand =tphaul of stone & sand Minibridge =w.bhaul of stone & sand =tphaul of stone & sand (wingwalls) =w.bhaul of stone & sand =tphaul of stone & sand Pipe arch =w.bhaul of stone & sand =tphaul of stone & sand (wingwalls) =w.bhaul of stone & sand =tphaul of stone & sand
lin.m lin.m lin.m lin.m per arch per arch m/bridge m/bridge per arch per arch per struc per struc
29 25 18 15 63,3 54,7 51 44 731 635 375 323
0.53 1,05 0,3 0,63 1,1 2,26 0,26 1,18 12 25 2 9
0,25 0,25
44 44 25 25 76 76 20 20 800 800 150 150
2 shts 2 shts 2 shts 2 shts 16,2 16,2
22 23 24 25
Lime stab base =gravel hl=0-2km 5m wide =gravel hl=2-7km 5m wide =gravel hl=7-20 5m wide Thickened edge (bitumen surfacing) Double seal surfacing Cape seal surfacing
km km km km km km
1589 1800 1950 56 630 830
14 20 41
20 20 20 20 10
2 25 15
35 25
2500li 2500li 2500li 10
20 107 99
48 123 87
26 27 28 29 30
Concrete blocks (production) Concrete blockwork (building) Random rubble masonry (building) Pointing (masonry) Security fencing
100 blocks 100 sq.m cu.m 100 sq.m 100 lin.m
4,1 7+4,5* 3+2,5* 3,3+8* 30
0,065 2,05 0,105 0,062
0,5
5,1 71 1,7 3,4 14


Best Practice Guideline 1: An overview of labour-based technologies and methods in employment intensive works Page 62 April, 2004: First edition of CIDB document 1022
sq.m square meters cu.m cubic metres quantity m.d. man-day tpd tipper day std spray truck day
m² st m² stone db drum bitumen ftd flat truck day bp budge productivity cl collect and load h haul
lu load & unload cd day lpkt lime packet sqmwm sq.m weldmesh mp mix and place lh load and haul
rd roller day sc spread and compact bit. bitumen emulsion cpkt cement packet swm sweet weldmesh
* Skilled labour Source: Extracted from Taylor, 1987. Labour-Construction Unit; Scott Wilson Kirkpatrick REFERENCES
The framework agreement for public works projects using labour-intensive construction systems. Johannesburg: COSATU. De Veen, JJ 1980 and 1983. The Rural Access Roads Programme: Appropriate Technology in Kenya. Geneva: ILO. The Productivity of Labour in Labour Based Infrastructure Works 1996. Zimbabwe: ILO. Little Rob 1993. Earth roads: Team task calculation aids. Durban: University of Natal. Scott W 1983. Labour Construction Unit: Technical Manual. (Paper included in Labour-Based Construction of Civil Engineering Projects: Information ex Lesotho Nov 1988). Simpson, J 1980. The Design, Construction and Maintenance of Low Cost Roads. In: International Roads Federation 4th African Conference. Nairobi, Kenya, 20-25 January 1980. WB study on substitution of labour for equipment 1995. Washington DC: World Bank. Simpson J 1980. The design, construction and maintenance of low cost roads. In: Proceedings of the 4th IRF Conference (held in Nairobi, Kenya, 20-25 January 1980.

Best Practice Guideline 1: An overview of labour-based technologies and methods in employment intensive works Page 63 April, 2004: First edition of CIDB document 1022
Appendix 2: Implementing employment intensive infrastructure projects which target the increase of employment opportunities generated per unit of expenditure (Annex G of SANS 10396: Implementing Preferential Construction Procurement Policies using Targeted Procurement Procedures) G1 Introduction Changes in methods and technologies, which increase the labour component in construction and the manufacture of materials, yield the greatest increase in the number of employment opportunities generated per unit of expenditure. This requires established companies to reduce their reliance on capital intensive technologies. Suitable methods and technologies are usually readily implemented by small scale enterprises, who by being small, have limited access to capital and invariably operate and conduct their businesses in a more employment-intensive fashion and favour light, non-equipment-based forms of construction. Various statistics have been put forward to quantify the impact of introducing employment-intensive construction practices. Many of them relate to the methods of measurement which are adopted. The following parameters are commonly used to evaluate employment-intensive construction practices: The multiplier in employment opportunities (i.e. the ratio of the total number of personhours generated in the construction of a specified structure, service or activity using labour-based technologies, to that using plant-based technologies). Expenditure per unit of employment generated (i.e. the ratio of total construction costs excluding VAT but including any management fees directly related to construction activities to total volume of employment-generated (manhours) in the construction of a structure or service. Construction expenditure retained within the community. This informative annex focuses on the use of the SANS 1914-5 targeted construction procurement (Participation of Targeted Enterprises) standard to encourage cost effective employment intensive practices. NOTE : The fundamental difference between the SANS 1914-4 targeted construction procurement standard (Participation of Targeted Enterprises and Targeted Labour (Local Resources)) and the SANS 1914-5 standard (Participation of Targeted Labour) is that the former targets enterprises and labour whereas the latter targets only labour. Many of the techniques presented in this Annex can also be applied to the targeting of labour in terms of the SANS 1914-4 standard. G2 Defining targeted labour Increases in employment opportunities generated per unit of expenditure on infrastructure projects can best be achieved by targeting unskilled / semi-skilled labour. Targeted labour may accordingly be defined in terms of statutory wage rates, e.g., persons who earn not more than one and a half times the minimum statutory wage rate. In some instances, there may be merit, in the interests of local economic development, to include residency within a broad geographical area in the definition.
SAMPLE DEFINITION South African citizens who permanently reside within the boundaries of t .............................. and earn wages and allowances amounting to less than R......... per hour. It is incumbent on individuals to demonstrate their claims to such residency on the basis of identification and association with and recognition by members of the community residing within the aforementioned areas.

Best Practice Guideline 1: An overview of labour-based technologies and methods in employment intensive works Page 64 April, 2004: First edition of CIDB document 1022
G3 Encouraging contractors to make more use of targeted labour in excavation activities In order to meet goals for the engagement of targeted labour, or to tender increased contract participation goals, contractors may have to undertake some, or all, soft excavations by the use of hand labour. In order to minimise their risk exposure in performing such activities, there needs to be : a labour policy in place which sets out the conditions of employment for temporary workers (i.e. project specific workers) a mechanism in terms of which contractors can define the portion of the excavation works which will be excavated by hand methods. If this is not done, contractors will not be able to increase job opportunities in earthworks activities as they would be exposed to unacceptable risks. The abovementioned employment policy and mechanism should accordingly be clearly set out in the tender documents and form an integral part of the contract. The conditions of employment pertaining to the employment of temporary workers (i.e. project specific workers) can be described in the Works Information. (These conditions will not be necessary should project specific workers be engaged in terms of statutory labour provisions. It may, however, in certain circumstances be desirable to vary such provisions in order to increase the participation of targeted lanour, in which case such conditions should be fully described.). SANS 1914-5 requires contractors to enter into formal contracts with targeted labour. Credit towards the attainment of contract participation goals can be denied should contractors fail to engage targeted labour in accordance with the conditions of employment as laid down in the Works Information. A suitable mechanism to enable contractors to define portions of excavation work which may be carried out by hand methods is to permit contractors during the tender stage to nominate the quantity of materials which they wish to excavate using hand methods. The approach outlined below is suggested. The initial classification of material to be excavated should be in accordance with the relevant provisions of a standard system of measurement. However, soft excavation to be undertaken by hand labour, using hand tools, can be further broken down by the introduction of an additional class of material, viz., soft excavation Class A, in accordance with the provisions of the Contract Prices as follows :
Criteria for classifying material as soft excavation Class A *
Granular materials Cohesive materials Dynamic cone penetrometer - minimum number of blows required to penetrate 100 mm 7-15 + 6 to 8 +
Consistency Dense - high resistance to penetration by the point of a geological pick; several blows required for removal of material.
Stiff / Very stiff Stiff - can be indented by thumb-nail; slight indentation produced by pushing geological pick point into soil; cannot be moulded by fingers. Very stiff - indented by thumb-nail with difficulty; slight penetration of point produced by blow of geological pick.
* Soft excavation Class A is material which, using a pick or equivalent hand swing tool, can only be excavated with difficulty. The total estimated quantity of excavation, as classified in terms of a standard system of measurement, should be indicated in the Contract Prices. The contractor should be permitted to sub-divide this quantity into two components, viz., the quantity of material to be excavated

Best Practice Guideline 1: An overview of labour-based technologies and methods in employment intensive works Page 65 April, 2004: First edition of CIDB document 1022
by the use of powered, mechanical equipment and the quantity to be excavated by hand labour using hand tools. One third (1/3) of every quantity of excavation to be undertaken by hand labour should be entered against the appropriate extra-over items provided in the Contract Prices, but left blank, for soft excavation Class A. This will ensure that material which can be picked with difficulty is catered for and the transition from hand excavation to machine excavation is graded. Should the contractor fail to indicate a quantity of excavation to be undertaken by hand labour, notwithstanding that he would find it necessary to utilize hand labour, it will be assumed that all excavation, whether undertaken by machine, or by hand labour, is to be paid for at the rates tendered for machine excavation. The contractor, should be required to undertake at least the quantities of excavation by hand labour which he tendered, unless the total quantity of excavation proves to be less than scheduled, in which case the minimum quantity to be undertaken by hand labour will be reduced pro-rata by the Employer’s Representative. This procedure will also provide a basis for reducing contract participation goals should such adjustments be necessary. Should the total quantity of excavation prove to be greater than that scheduled, the contractor may choose the method of excavation for the excess quantity, unless the rates for excavation by machine would result in lower costs than for hand excavation, in which case the Employer’s Representative will have the right to instruct the contractor to undertake the excavation by machine.
The Contract Prices can reflect this mechanism as follows :
ITEM NO. DESCRIPTION UNIT QUANTITY
RATE AMOUNT R C
3.1 3.1.1 3.1.2 3.1.3 3.2
Earthworks Excavate trenches in all materials, backfill and dispose of surplus material for stormwater pipes not exceeding 1,5 m deep (Total quantity 1 500 m³) to be allocated in items 3.1.1 and 3.1.2 below in accordance with Part 3 of the Conditions of Tender. Machine excavation Hand excavation Extra over 3.1.2 for hand excavation in soft class A. (Quantity to be one third of quantity entered under 3.1.2) Extra over items 3.1.1 and 3.1.2 for :- : Intermediate excavation : Hard rock excavation
m³ m³ m³ m³ m³
............... * ............... * ............... * 250 150
* To be completed by the contractor.
Insert the following into the conditions of tender:SOFT EXCAVATION In order to meet goals for the engagement of Targeted Labour, the Tenderer may intend to undertake some, or all, soft excavations by the use of hand labour. The initial classification of material to be excavated shall be in accordance with the relevant provisions of ……... However, soft excavation to be undertaken by hand labour, using hand tools, shall be further broken down by the introduction of an additional class of material, viz., soft excavation Class A, in accordance with the provisions of the project specification. The total estimated quantity of excavation, as classified in terms of ……… is indicated in the Contract Prices. The tenderer may sub-divide this quantity into two components, viz., the quantity of material to be excavated by the use of powered, mechanical equipment and the quantity to be excavated by hand labour using hand tools. One third (1/3) of every quantity of excavation to be undertaken by hand labour must be entered against the appropriate extra-over items provided in the Schedules for soft excavation Class A. Should the tenderer fail to indicate a quantity of excavation to be undertaken by hand labour, notwithstanding that he would find it necessary to utilize hand labour, it will be assumed that all excavation, whether undertaken by machine, or by hand labour, is to be paid for at the rates tendered for machine excavation

Best Practice Guideline 1: An overview of labour-based technologies and methods in employment intensive works Page 66 April, 2004: First edition of CIDB document 1022
G4 Encouraging contractors to implement employment-intensive road technologies The labour intensiveness of roadworks is highly dependent upon the choice of technology and the cost of roadworks is, accordingly, sensitive to the choice of technology. If, however, the contractor is permitted to select the technology and contracts are awarded in terms of a development objective price mechanism, a balance between price and the attainment of socio-economic deliverables can be achieved. A simple way to do this is to present contractors with a range of options which are acceptable to the employer and to permit contractors to tender and price what they see to be the most competitive options. Contract Prices can reflect this mechanism as follows :
ITEM NO
DESCRIPTION UNIT QUANTITY RATE AMOUNT R C
1.1 BASE Option A: Construct base course with graded crushed stone from commercial sources Option B: Construct dry/-waterbound Macadam base course with stone imported from designated sources. Construct base course using Option . . . . . . . . . . . . . . . . . . (to be completed by contractor)
m2
2010
ITEM NO
DESCRIPTION UNIT QUANTITY RATE AMOUNT R C
1.2 PAVEMENT STRUCTURE Option A : 150mm C4 subbase, 100mm G1 base, 20mm AC wearing course, complete Option B : 100mm C4 subbase, 100mm WM2 base, 20mm AC wearing course complete Option C : 100mm G7 subbase, 20mm bedding sand, 60mm type SA interlocking blocks complete Construct pavement using option . . . . . . . . . . . . . . . . . . . (to be completed by contractor)
m2
2000
The following clause should be inserted into the Conditions of Tender in order to cater for the different quantities which result from the different thicknesses of layerworks. This is important in the adjudication of tenders.
PAVEMENT STRUCTURES In order to meet the contract participation goal, the Contractor may select a pavement structure from the alternatives presented on the drawing. Each option or component thereof is scheduled separately in the Contract Prices. The Contractor must state in his tender under the relevant scheduled item which alternative his tender is based on. Contractors will be bound to the pavement structure so selected. The quantities scheduled in respect of earthworks are based on the pavement design with the greatest depth. Adjustments will be made by the engineer in the tendered price to reflect changes in earthworks costs arising from pavement selections prior to the awarding of points for price.