laboratory simulation of anaerobic digestion of municipal solid waste
TRANSCRIPT
This article was downloaded by: [The UC Irvine Libraries]On: 24 October 2014, At: 20:23Publisher: Taylor & FrancisInforma Ltd Registered in England and Wales Registered Number: 1072954 Registered office: MortimerHouse, 37-41 Mortimer Street, London W1T 3JH, UK
Journal of Environmental Science and Health, PartA: Toxic/Hazardous Substances and EnvironmentalEngineeringPublication details, including instructions for authors and subscription information:http://www.tandfonline.com/loi/lesa20
Laboratory Simulation of Anaerobic Digestion ofMunicipal Solid WasteProfessor Stanislaw Ledakowicz a & Katarzyna Kaczorek aa Department of Process and Environmental Technology , Technical University of Lodz ,Lodz, PolandPublished online: 06 Feb 2007.
To cite this article: Professor Stanislaw Ledakowicz & Katarzyna Kaczorek (2004) Laboratory Simulation of AnaerobicDigestion of Municipal Solid Waste, Journal of Environmental Science and Health, Part A: Toxic/Hazardous Substances andEnvironmental Engineering, 39:4, 859-871, DOI: 10.1081/ESE-120028398
To link to this article: http://dx.doi.org/10.1081/ESE-120028398
PLEASE SCROLL DOWN FOR ARTICLE
Taylor & Francis makes every effort to ensure the accuracy of all the information (the “Content”) containedin the publications on our platform. However, Taylor & Francis, our agents, and our licensors make norepresentations or warranties whatsoever as to the accuracy, completeness, or suitability for any purpose ofthe Content. Any opinions and views expressed in this publication are the opinions and views of the authors,and are not the views of or endorsed by Taylor & Francis. The accuracy of the Content should not be reliedupon and should be independently verified with primary sources of information. Taylor and Francis shallnot be liable for any losses, actions, claims, proceedings, demands, costs, expenses, damages, and otherliabilities whatsoever or howsoever caused arising directly or indirectly in connection with, in relation to orarising out of the use of the Content.
This article may be used for research, teaching, and private study purposes. Any substantial or systematicreproduction, redistribution, reselling, loan, sub-licensing, systematic supply, or distribution in anyform to anyone is expressly forbidden. Terms & Conditions of access and use can be found at http://www.tandfonline.com/page/terms-and-conditions
JOURNAL OF ENVIRONMENTAL SCIENCE AND HEALTH
Part A—Toxic/Hazardous Substances & Environmental Engineering
Vol. A39, No. 4, pp. 859–871, 2004
Laboratory Simulation of Anaerobic Digestion
of Municipal Solid Waste
Stanislaw Ledakowicz* and Katarzyna Kaczorek
Department of Process and Environmental Technology,
Technical University of Lodz, Lodz, Poland
ABSTRACT
Landfill processes were simulated in lab-scale bioreactors—lysimeters. The
changes in leachate characteristics as well as the influence of the leachate
recirculation on the processes taking place in the landfill were investigated.
Lysimeters were filled with material simulating municipal waste in the city of
Lodz, Poland. Compost in the amount of 30%w/w and the methanogens
inoculum were added in order to enhance a development of methanogenic phase.
Leachate produced in lysimeters was recirculated once, twice a week, or everyday.
The leachate composition and biogas changes showed trends confirming that the
bench-scale lysimeters appeared suitable to simulate processes taking place in the
landfill. It was also proved that leachate recirculation accelerate these processes.
Key Words: Biogas; Landfill; Leachate; Lysimeter; Recirculation.
INTRODUCTION
Landfilling is the most common method of waste disposal in Poland (95%).According to the current Polish legislation landfilling should be the last solution for
*Correspondence: Professor Stanislaw Ledakowicz, Department of Process and
Environmental Technology, ul. Wolczanska 213, Technical University of Lodz, 93 005
Lodz, Poland; Fax: (þþ48 42) 631 37 38; E-mail: [email protected].
859
DOI: 10.1081/ESE-120028398 1093-4529 (Print); 1532-4117 (Online)
Copyright & 2004 by Marcel Dekker, Inc. www.dekker.com
Dow
nloa
ded
by [
The
UC
Irv
ine
Lib
rari
es]
at 2
0:23
24
Oct
ober
201
4
ORDER REPRINTS
MSW treatment. Although recycling of materials and composting reduce the amount
of landfilled MSW, landfilling is the only option for many materials.[1] The research
concerning the landfill behavior is still of the great importance in Poland.According to Stegmann[2] the construction and operation of landfill test cells or
large-scale lysimeters are very time-consuming, costly, and not easy to control. The
laboratory scale experiments enable the measurements of gas production and
leachate quality. It is possible to vary parameters and study their influence on the
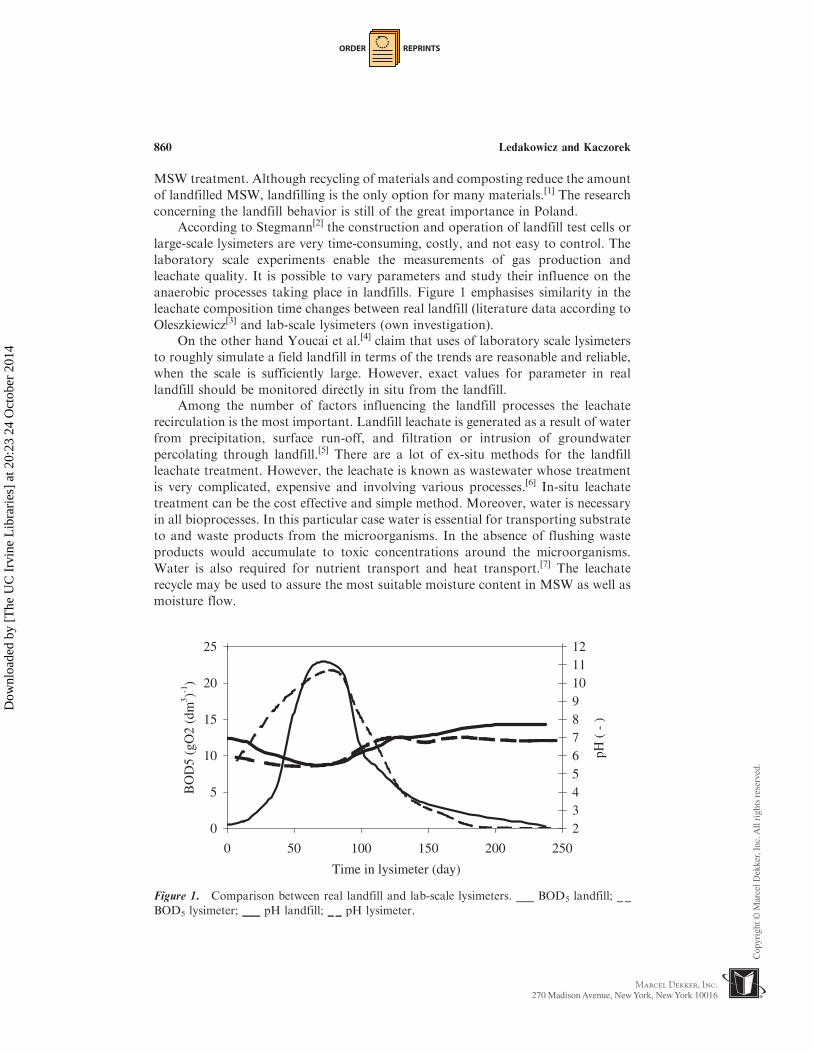
anaerobic processes taking place in landfills. Figure 1 emphasises similarity in the
leachate composition time changes between real landfill (literature data according to
Oleszkiewicz[3] and lab-scale lysimeters (own investigation).On the other hand Youcai et al.[4] claim that uses of laboratory scale lysimeters
to roughly simulate a field landfill in terms of the trends are reasonable and reliable,
when the scale is sufficiently large. However, exact values for parameter in real
landfill should be monitored directly in situ from the landfill.Among the number of factors influencing the landfill processes the leachate
recirculation is the most important. Landfill leachate is generated as a result of water
from precipitation, surface run-off, and filtration or intrusion of groundwater
percolating through landfill.[5] There are a lot of ex-situ methods for the landfill
leachate treatment. However, the leachate is known as wastewater whose treatment
is very complicated, expensive and involving various processes.[6] In-situ leachate
treatment can be the cost effective and simple method. Moreover, water is necessary
in all bioprocesses. In this particular case water is essential for transporting substrate
to and waste products from the microorganisms. In the absence of flushing waste
products would accumulate to toxic concentrations around the microorganisms.
Water is also required for nutrient transport and heat transport.[7] The leachate
recycle may be used to assure the most suitable moisture content in MSW as well as
moisture flow.
0
5
10
15
20
25
0 50 100 150 200 250
Time in lysimeter (day)
BO
D5
(gO
2 (d
m3 )-1
)
23456789101112
pH (
- )
Figure 1. Comparison between real landfill and lab-scale lysimeters. ___ BOD5 landfill; _ _
BOD5 lysimeter; ___ pH landfill; _ _ pH lysimeter.
860 Ledakowicz and Kaczorek
Dow
nloa
ded
by [
The
UC
Irv
ine
Lib
rari
es]
at 2
0:23
24
Oct
ober
201
4
ORDER REPRINTS
The leachate recirculation back into the landfill body has been claimed tostrongly improve biodegradation of the waste.[8] On the other hand the progressiveaccumulation of salts in the leachate may negatively affect microorganismsactivity.[9] Although the leachate recirculation is an area that has attracted a lot ofthe investigations, further investigations on the leachate recirculation are stillnecessary.
This article shows results of the MSW landfill simulation in the bench-scalelysimeters as well as the leachate recirculation impact on the processes taking place inthe landfills.
EXPERIMENTAL PROCEDURES
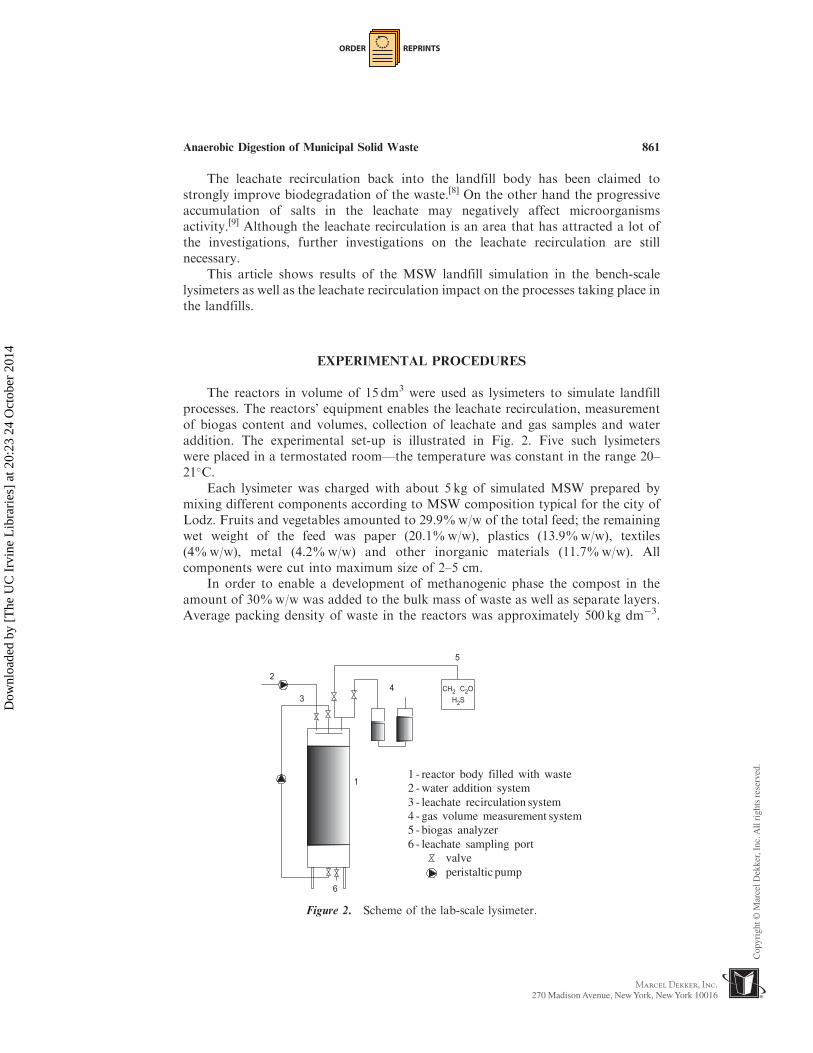
The reactors in volume of 15 dm3 were used as lysimeters to simulate landfillprocesses. The reactors’ equipment enables the leachate recirculation, measurementof biogas content and volumes, collection of leachate and gas samples and wateraddition. The experimental set-up is illustrated in Fig. 2. Five such lysimeterswere placed in a termostated room—the temperature was constant in the range 20–21�C.
Each lysimeter was charged with about 5 kg of simulated MSW prepared bymixing different components according to MSW composition typical for the city ofLodz. Fruits and vegetables amounted to 29.9%w/w of the total feed; the remainingwet weight of the feed was paper (20.1%w/w), plastics (13.9%w/w), textiles(4%w/w), metal (4.2%w/w) and other inorganic materials (11.7%w/w). Allcomponents were cut into maximum size of 2–5 cm.
In order to enable a development of methanogenic phase the compost in theamount of 30%w/w was added to the bulk mass of waste as well as separate layers.Average packing density of waste in the reactors was approximately 500 kg dm�3.
1 - reactor body filled with waste2 - water addition system3 - leachate recirculation system4 - gas volume measurement system5 - biogas analyzer6 - leachate sampling port
valveperistaltic pump
1
2
34
6
5
CH2 C2O
H2S
Figure 2. Scheme of the lab-scale lysimeter.
Anaerobic Digestion of Municipal Solid Waste 861
Dow
nloa
ded
by [
The
UC
Irv
ine
Lib
rari
es]
at 2
0:23
24
Oct
ober
201
4

ORDER REPRINTS
The porosity was 34%v/v. at the beginning of the experiment and 26%v/v after theexperiment.
A methanogens inoculum was added in the amount of 200mL pro reactor on the60th day. The inoculum was a sludge taken from an anaerobic digester at themunicipal wastewater treatment plant.
Two runs of experiments were performed. In the first run the leachate wasrecirculated twice a week. The main research stress was put on the AdvancedOxidation Processes (AOPs) influence on the leachate biodegradation in thelysimeters. The results are to be presented in the other publication.
In the second run the leachate in the one of the lysimeters was recirculated daily,in the second once per week, while the waste in the third one was completelysubmerged in the leachate.
The biogas probes were analyzed with the gas analyzer LMS GasData, biogasproduction was measured by Ritter gas meter. The following analytical methodswere applied to the leachate:
— pH (pH-meter WTW pH 540 GLP),— redox potential (redox electrode, pH-meter WTW pH 540 GLP),— biological oxygen demand BOD5 (dillution method, standard method[10]),— chemical oxygen demand COD (standard dichromate method, Hach),— volatile fatty acids VFA (distillation method, Buchi distillation unit),— ammonia nitrogen N-NH4
þ (distillation method, Buchi distillation unit),— total Kiejdahl nitrogen TKN (Buchi digestion unit),— total phosphorus Pt (method 8048, Hach),— total organic carbon TOC (coulometeric method, Strohlein coulometer)— toxicity (ToxAlert�, Vibrio fischeri NRRL B-11177, Merck).
RESULTS AND DISCUSSION
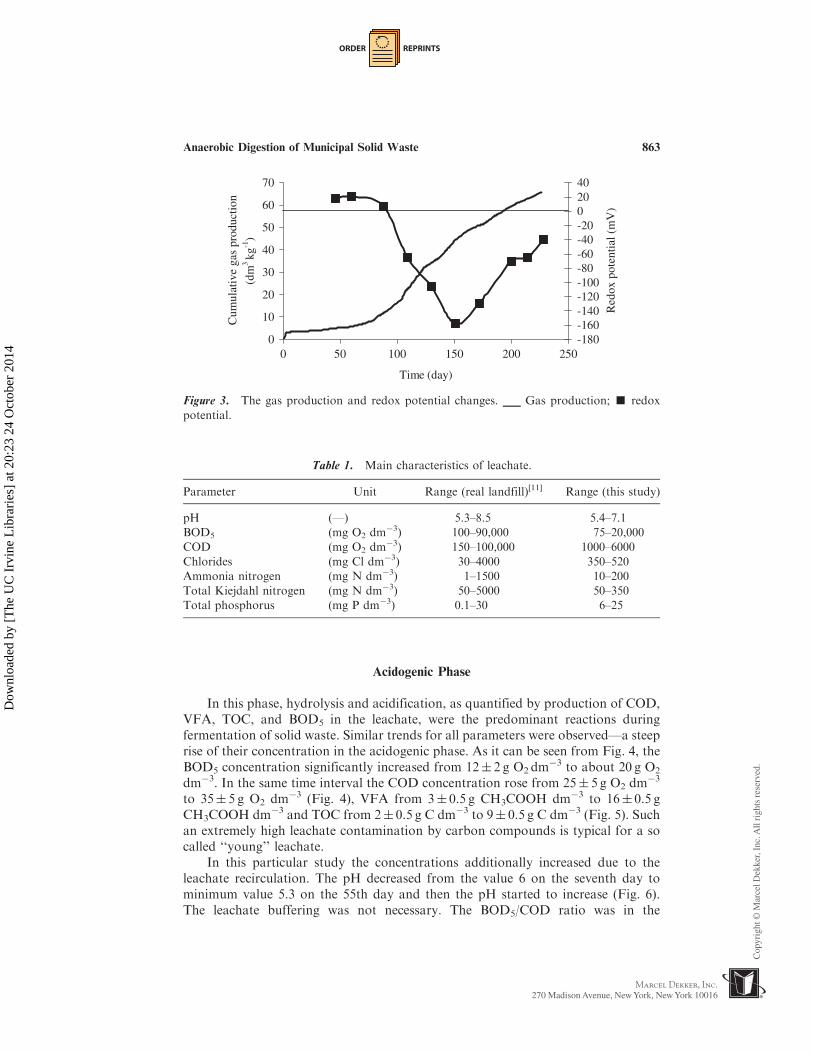
The acidogenic and methanogenic phases were visible both in the leachate andbiogas composition changes. The acidogenic phase was distinguished from themethanogenic phase due to pH and redox potential changes in the leachate togetherwith the increase in the biogas production and the biogas composition. The redoxpotential change from positive to negative value is considered as the beginning of themethanogenic phase. It can be seen from Fig. 3 that redox potential dropped belowzero simultaneously with biogas curve rapid rise.
The addition of compost and the methanogens inoculum as well as theleachate recirculation led to the process acceleration. The acidogenic phase inthe lysimeters lasted about 80 days, while it takes usually few years in the reallandfill. After 250 days of the lysimeter operation the biogas production wasnegligible.
Although, the processes took much shorter time than in the real landfill,the leachate main characteristic is similar to the literature values (Table 1).Moreover, the biogas composition changes were analogous to the landfill gasvariation.
862 Ledakowicz and Kaczorek
Dow
nloa
ded
by [
The
UC
Irv
ine
Lib
rari
es]
at 2
0:23
24
Oct
ober
201
4
ORDER REPRINTS
Acidogenic Phase
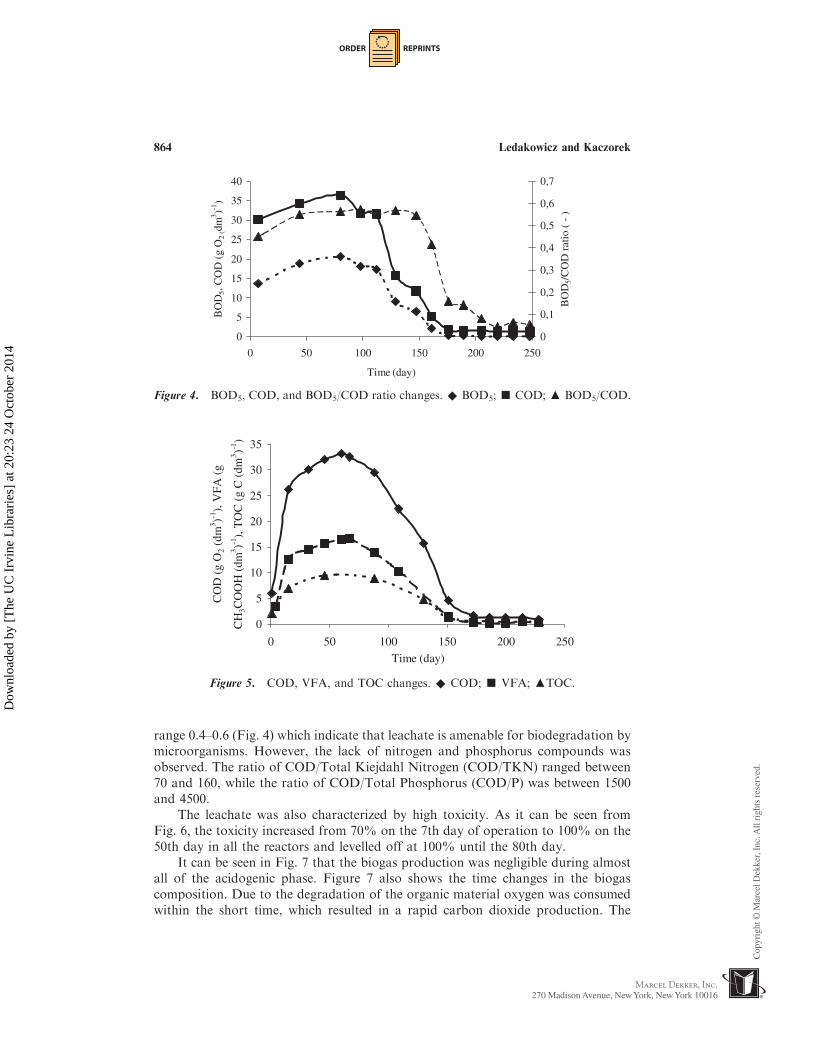
In this phase, hydrolysis and acidification, as quantified by production of COD,VFA, TOC, and BOD5 in the leachate, were the predominant reactions duringfermentation of solid waste. Similar trends for all parameters were observed—a steeprise of their concentration in the acidogenic phase. As it can be seen from Fig. 4, theBOD5 concentration significantly increased from 12� 2 g O2 dm
�3 to about 20 g O2
dm�3. In the same time interval the COD concentration rose from 25� 5 g O2 dm�3
to 35� 5 g O2 dm�3 (Fig. 4), VFA from 3� 0.5 g CH3COOH dm�3 to 16� 0.5 gCH3COOH dm�3 and TOC from 2� 0.5 g C dm�3 to 9� 0.5 g C dm�3 (Fig. 5). Suchan extremely high leachate contamination by carbon compounds is typical for a socalled ‘‘young’’ leachate.
In this particular study the concentrations additionally increased due to theleachate recirculation. The pH decreased from the value 6 on the seventh day tominimum value 5.3 on the 55th day and then the pH started to increase (Fig. 6).The leachate buffering was not necessary. The BOD5/COD ratio was in the
0
10
20
30
40
50
60
70
0 50 100 150 200 250
Time (day)
Cum
ulat
ive
gas
prod
ucti
on
(dm
3 kg
-1)
-180-160-140-120-100-80-60-40-2002040
Red
ox p
oten
tial
(m
V)
Figure 3. The gas production and redox potential changes. ___ Gas production; g redox
potential.
Table 1. Main characteristics of leachate.
Parameter Unit Range (real landfill)[11] Range (this study)
pH (—) 5.3–8.5 5.4–7.1
BOD5 (mg O2 dm�3) 100–90,000 75–20,000
COD (mg O2 dm�3) 150–100,000 1000–6000
Chlorides (mg Cl dm�3) 30–4000 350–520
Ammonia nitrogen (mg N dm�3) 1–1500 10–200
Total Kiejdahl nitrogen (mg N dm�3) 50–5000 50–350
Total phosphorus (mg P dm�3) 0.1–30 6–25
Anaerobic Digestion of Municipal Solid Waste 863
Dow
nloa
ded
by [
The
UC
Irv
ine
Lib
rari
es]
at 2
0:23
24
Oct
ober
201
4
ORDER REPRINTS
range 0.4–0.6 (Fig. 4) which indicate that leachate is amenable for biodegradation bymicroorganisms. However, the lack of nitrogen and phosphorus compounds wasobserved. The ratio of COD/Total Kiejdahl Nitrogen (COD/TKN) ranged between70 and 160, while the ratio of COD/Total Phosphorus (COD/P) was between 1500and 4500.
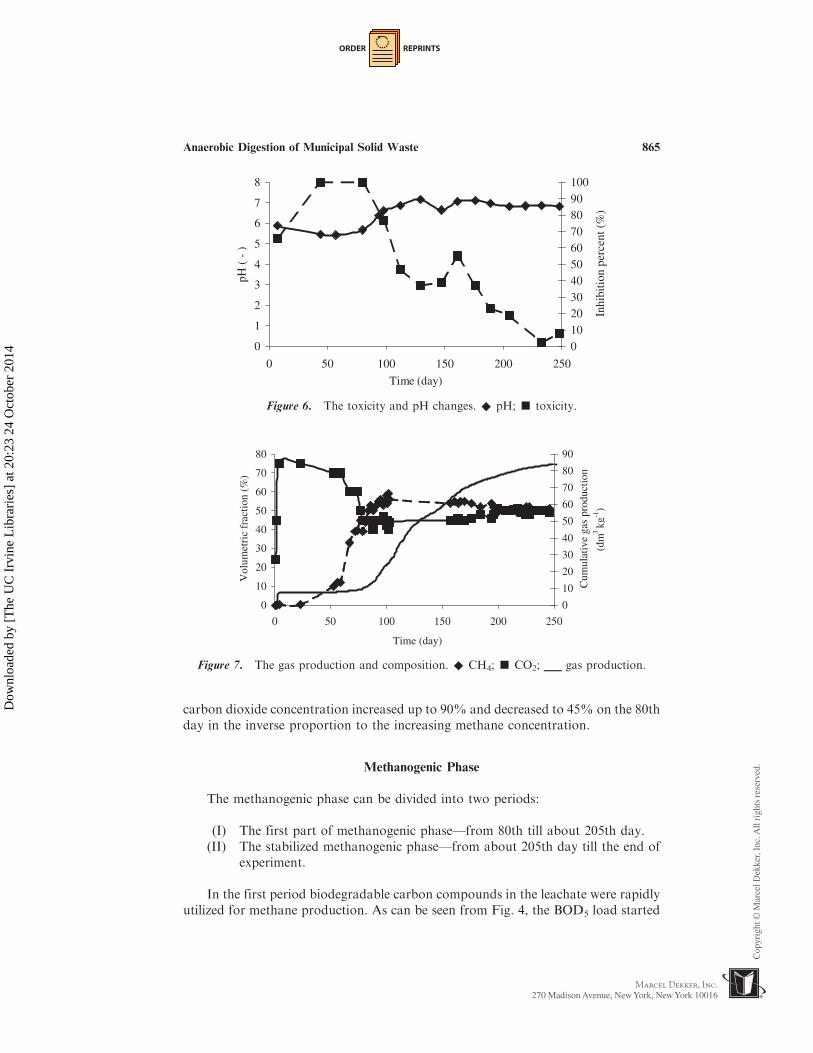
The leachate was also characterized by high toxicity. As it can be seen fromFig. 6, the toxicity increased from 70% on the 7th day of operation to 100% on the50th day in all the reactors and levelled off at 100% until the 80th day.
It can be seen in Fig. 7 that the biogas production was negligible during almostall of the acidogenic phase. Figure 7 also shows the time changes in the biogascomposition. Due to the degradation of the organic material oxygen was consumedwithin the short time, which resulted in a rapid carbon dioxide production. The
0
5
10
15
20
25
30
35
0 50 100 150 200 250
Time (day)
CO
D (
g O
2 (d
m3 )-1
), V
FA (
g
CH
3CO
OH
(dm
3 )-1),
TO
C (
g C
(dm
3 )-1)
Figure 5. COD, VFA, and TOC changes. ^ COD; g VFA; mTOC.
0
5
10
15
20
25
30
35
40
0 50 100 150 200 250
Time (day)
BO
D5,
CO
D (
g O
2 (d
m3 )-1
)
0
0,1
0,2
0,3
0,4
0,5
0,6
0,7
BO
D5/
CO
D r
atio
( -
)
Figure 4. BOD5, COD, and BOD5/COD ratio changes. ^ BOD5; g COD; m BOD5/COD.
864 Ledakowicz and Kaczorek
Dow
nloa
ded
by [
The
UC
Irv
ine
Lib
rari
es]
at 2
0:23
24
Oct
ober
201
4
ORDER REPRINTS
carbon dioxide concentration increased up to 90% and decreased to 45% on the 80thday in the inverse proportion to the increasing methane concentration.
Methanogenic Phase
The methanogenic phase can be divided into two periods:
(I) The first part of methanogenic phase—from 80th till about 205th day.(II) The stabilized methanogenic phase—from about 205th day till the end of
experiment.
In the first period biodegradable carbon compounds in the leachate were rapidlyutilized for methane production. As can be seen from Fig. 4, the BOD5 load started
0
1
2
3
4
5
6
7
8
0 50 100 150 200 250
Time (day)
pH (
- )
0102030405060708090100
Inhi
bitio
n pe
rcen
t (%
)
Figure 6. The toxicity and pH changes. ^ pH; g toxicity.
0
10
20
30
40
50
60
70
80
0 50 100 150 200 250
Time (day)
Vol
umet
ric
frac
tion
(%)
0
10
20
30
40
50
60
70
80
90
Cum
ulat
ive
gas
prod
uctio
n
(dm
3 kg
-1)
Figure 7. The gas production and composition. ^ CH4; g CO2; ___ gas production.
Anaerobic Digestion of Municipal Solid Waste 865
Dow
nloa
ded
by [
The
UC
Irv
ine
Lib
rari
es]
at 2
0:23
24
Oct
ober
201
4
ORDER REPRINTS
to decrease from about 20 g O2 dm�3 to 0.13 g O2 dm
�3. COD decreased from 30 gO2 dm�3 to 1.3 g O2 dm�3 (Fig. 4), VFA from 16 g CH3COOH dm�3 to 0.3 gCH3COOH dm�3 and TOC from 9 g C dm�3 to 0.5 g C dm�3 (Fig. 5). The COD/TOC ratio dropped to about 2.5.
About the 170th day of operation the biodegradable fraction of organic loadwas so significantly exhausted that BOD5/COD ratio dropped from 0.55 on the 80thday to 0.2 (Fig. 4).
Figure 3 shows that the pH was increasing steadily from the value 5.5 on the80th day to 7.1 on the 130th day. It was the period of the most rapid biogasproduction (Fig. 7). After the 130th day the pH value levelled off to about 7.0. It wasconnected with organic acids utilization.
The nitrogen compounds were consumed more rapidly than carbon compoundsbetween the 80th and 130th days. It resulted in the peak of the COD/TKN ratio-180 g O2 (g N)�1 on the 130th day. From the 130th day the COD/TKN ratiodecreased to 20 g O2 (g N)�1 on the 205th day. The COD/P ratio decreased steadilyfrom the 112th day to the end of the experiment reaching the level of 150 g O2 (g P)
�1
on the 205th day (data not shown).The methanogenic phase was also efficient in the toxicity reduction. It can be
seen in Fig. 6 that the percent of inhibition fell from about 100% on the 80th day toabout 10% at the end of the experiment. According to Pohland and Kim[12] it can beexplained by the precipitation of heavy metal loadings and evidence of a reducingenvironment conductive to further transformation in organic loadings.
The above mentioned trends led to the conclusion that the leachate from the firstpart of the methanogenic phase (from about 80th till 170th day) showed very goodbiodegradability—BOD5/COD ratio about 0.5 (Fig. 4). It was characterized by thelow COD and BOD5 loads, neutral pH, and toxicity lower than 50% (Fig. 6).
As it can be seen from Fig. 7, the biogas production increased rapidlyat the beginning of the methanogenic phase. The methane concentration reached50–60%v/v. This methane concentration level was maintained till the end of theexperiment.
The stabilized methanogenic phase was established about the 200th day of theexperiment. The biodegradable carbon compounds were utilized almost completely.The BOD5 concentration dropped below 100mg O2 dm
�3 while COD fell to about1 g O2 dm
�3 (Fig. 4). The BOD5/COD ratio decreased to the value 0.06 (Fig. 4). Thenitrogen compounds decreased to such low values that they were comparable to theaccuracy of the Total Kiejdahl and ammonia nitrogen determination. The leachatetoxicity was reduced almost completely (Fig. 6).
Moreover, at the end of the methanogenic phase the biogas production wasnegligible. As it can be seen in Fig. 7, the cumulative curve of biogas productionshowed the characteristic plateau.
Leachate Recycle
In order to investigate the influence of the leachate recirculation on the landfillprocesses three lysimeters were used during the second run of the experiments.The leachate in the first rector was recirculated daily, in the second one once a week.
866 Ledakowicz and Kaczorek
Dow
nloa
ded
by [
The
UC
Irv
ine
Lib
rari
es]
at 2
0:23
24
Oct
ober
201
4

ORDER REPRINTS
The waste in the third one was completely submerged in the leachate. The
submergence of waste was used as an asymptotic case of the constant recirculation of
the leachate. The results from the control lysimeter in the first run of the experiments
(leachate recirculation twice a week) were also taken into consideration.The leachate recirculation can lead to the inhibition of methanogenesis as it may
cause high concentrations of organic acids (low pH), which may be toxic for the
methanogens. According to Stegmann[2] this problem can be avoided by the addition
of stabilized material. As biologically stabilized MSW was not accessible, compost
was added to the MSW in the lysimeters. Although high concentration of organic
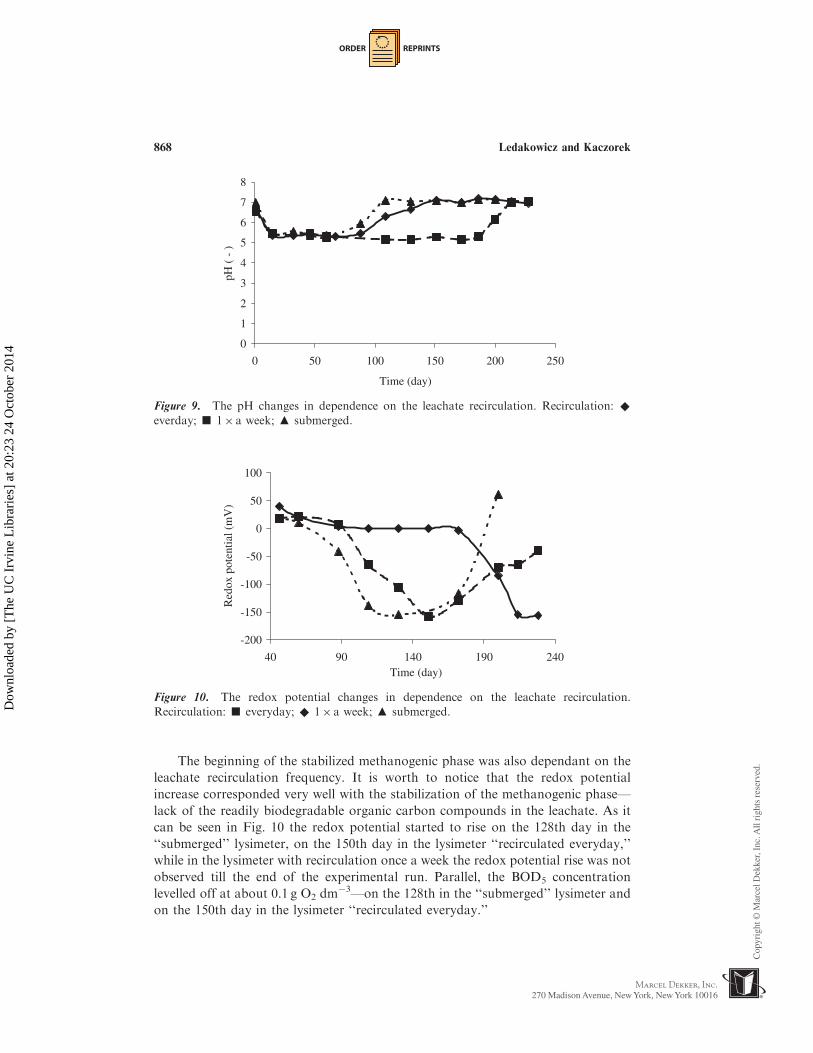
acids were observed (Fig. 5) the recirculation had a positive effect.Figure 8 shows the dependence between the recirculation frequency and start-up
of the methanogenic phase—the beginning of the rapid biogas production. The more
frequent the leachate recycle was, the earlier the methanogenic phase was
established. This trend was confirmed by the leachate composition changes as
well. It can be seen in Fig. 9 that pH value increased from 5.31 on the 67th day to
6.29 on the 109th day in the lysimeter with daily recirculation, while the similar
changes in the lysimeter recirculated once a week was not visible until 186th day. The
redox potential change from positive to negative value was observed on the 70th day
in the first lysimeter (daily recirculation) whilst on 172nd day in the second one
(recirculation once a week, Fig. 10). The rapid utilization of organic carbon
compounds in the leachate also started earlier in the first reactor. By the way of
example, the BOD5 concentration changes in the all lysimeters with a different
recirculation rate are shown on the Fig. 11.The submergence of waste by the leachate additionally accelerated the
establishment of the methanogenic phase. As can be seen from the Fig. 5 the
methanogenic phase started the earliest in the ‘‘submerged’’ lysimeter. It was also
visible in the pH and redox potential changes (Figs. 9 and 10). Due to the dilution of
the leachate the BOD5 concentration peak for the submerged lysimeter was 15 g
O2 dm�3 while it was 20 g O2 dm
�3 for the others (Fig. 11). Moreover, the beginning
of the BOD5 decrease was observed earlier than in the other lysimeters (Fig. 11).
Figure 8. The gas production dependence on the leachate recirculation.
Anaerobic Digestion of Municipal Solid Waste 867
Dow
nloa
ded
by [
The
UC
Irv
ine
Lib
rari
es]
at 2
0:23
24
Oct
ober
201
4
ORDER REPRINTS
The beginning of the stabilized methanogenic phase was also dependant on the
leachate recirculation frequency. It is worth to notice that the redox potential
increase corresponded very well with the stabilization of the methanogenic phase—
lack of the readily biodegradable organic carbon compounds in the leachate. As it
can be seen in Fig. 10 the redox potential started to rise on the 128th day in the
‘‘submerged’’ lysimeter, on the 150th day in the lysimeter ‘‘recirculated everyday,’’
while in the lysimeter with recirculation once a week the redox potential rise was not
observed till the end of the experimental run. Parallel, the BOD5 concentration
levelled off at about 0.1 g O2 dm�3—on the 128th in the ‘‘submerged’’ lysimeter and
on the 150th day in the lysimeter ‘‘recirculated everyday.’’
-200
-150
-100
-50
0
50
100
40 90 140 190 240Time (day)
Red
ox p
oten
tial (
mV
)
Figure 10. The redox potential changes in dependence on the leachate recirculation.
Recirculation: g everyday; ^ 1� a week; m submerged.
0
1
2
3
4
5
6
7
8
0 50 100 150 200 250
Time (day)
pH (
- )
Figure 9. The pH changes in dependence on the leachate recirculation. Recirculation: ^
everday; g 1� a week; m submerged.
868 Ledakowicz and Kaczorek
Dow
nloa
ded
by [
The
UC
Irv
ine
Lib
rari
es]
at 2
0:23
24
Oct
ober
201
4

ORDER REPRINTS
CONCLUSIONS
The results obtained in the performed studies confirmed that the bench-scalelysimeters are a satisfactory method to simulate processes taking place in the landfill.The changes in biogas and leachate from lysimeters showed trends typical for landfillbehavior but in a much shorter time—less than one year.
The leachate produced in the acidogenic phase was highly contaminatedwith organic compounds—COD values about 30 g O2 dm�3, BOD5 about 20 gO2 dm
�3, and TOC about 9 g C dm�3. The ‘‘young’’ leachate were characterized byBOD5/COD ratio amenable for biodegradation (0.4–0.6) but also by the lack ofnitrogen and phosphorus compounds as well as high toxicity (100% inhibition).
The leachate characteristics at the beginning of the methanogenic phaseshowed the better biodegradability in comparison to the leachate from theacidogenic phase:
— lower carbon compounds loads (e.g., 5 g O2 dm�3 for COD),
— BOD5/COD ratio about 0.5,— lower toxicity (about 50%).
At the end of experiments BOD5/COD ratio in the leachate decreased to thelevel typical for nonbiodegradable wastewater—below 0.1.
The redox potential appeared to be a good indicator of the phase changes. Thedecrease of the redox potential below zero is connected with the end of theacidogenic phase. At the beginning of the stabilized methanogenic phase the redoxpotential reached minimum value and started to increase.
0
5
10
15
20
25
0 50 100 150 200 250Time (day)
BO
D5
(gO
2 (d
m3 )-1
)
Figure 11. The BOD5 concentration dependance on the leachate recirculation. Recirculation:
^ everday; g 1� a week; m 2� a week; T submerged.
Anaerobic Digestion of Municipal Solid Waste 869
Dow
nloa
ded
by [
The
UC
Irv
ine
Lib
rari
es]
at 2
0:23
24
Oct
ober
201
4

ORDER REPRINTS
It was also proved that the leachate recirculation led to the significant process
acceleration. The more frequently the leachate was recirculated, the earlier the
methanogenic phase was established and faster biodegradation completed. The
obtained results might be an indication for landfill operators to perform the waste
biodegradation under the most possible wet conditions—with the frequent leachate
recirculation.
ACKNOWLEDGMENTS
A financial support from KBN Grant No. 3T09C02817 is acknowledged.Authors also thank Ms. Ewa Stelmach, Ms. Barbara Sencio and Ms. Urszula
Szalewska for their valuable help in the analytical work.
REFERENCES
1. Burton, S.A.Q.; Watson-Craik, I.A. Ammonia and nitrogen fluxes in landfill
sites: applicability to sustainable landfilling. Waste Manage. Res. 1998, 16 (1),
41–53.2. Stegmann, R. Description of Laboratory Scale Method to Investigate Anaerobic
Degradation Process Taking Place in Solid Waste, In Proceedings Sardinia ‘97.
Sixth International Waste Management and Landfill Symposium, Cagliari,
Italy, October 13–17, 1997; Vol. 2, 37–43.3. Oleszkiewicz, J. Landfill Operation—Handbook; LEM PROJEKT sc: Krakow,
1999 (in polish).4. Youcai, Z.; Luochon, W.; Renhua, H.; Dimin, X.; Guowei, G.A. Comparison
of refuse attenuation in laboratory and field scale lysimeters. Waste Manage.
2002, 22, 29–35.5. Ince, N.H. Light-enhanced chemical oxidation for tertiary treatment of
municipal landfill leachate. Water Environ. Res. 1998, 70 (6), 1161–1169.6. Dichtl, N.; Kayser, R.; Steensen, M. Einleitung. In Weitergehende Reinigung
von Deponiesickerwassern durch chemische Oxidation/UV—Bestrahlung mit
biologischer Vor—und Nachbehandlung; Abschlussbericht, Institut fur
Siedlungwasserwirtschaft, Technische Universitat Braunschweig, 1997; 1–3.7. Chugh, S.; Clarke, W.; Pullammanappallil, P.; Rudolph, V. Effect of
recirculated leachate volume on MSW degradation. Waste Manage. Res.
1998, 16 (6), 564–573.8. El-Fadel, M. Leachate recirculation effects on settlement and biodegradation
rates in MSW landfills. Environ. Technol. 1999, 20, 121–133.9. Rolle, E.; Boni, M.R.; Carucci, G. Effects of leachate salinity on the aerobic
and anaerobic mineralization of the municipal solid waste organic fraction.
Environ. Technol. 1997, 18, 203–209.10. APHA. Standard Methods for the Examination of Water and Wastewater, 18th
Ed.; American Public Health Association (APHA): Washington, DC, 1992.
870 Ledakowicz and Kaczorek
Dow
nloa
ded
by [
The
UC
Irv
ine
Lib
rari
es]
at 2
0:23
24
Oct
ober
201
4
ORDER REPRINTS
11. Christensen, T.H.; Cossu, R.; Stegmann, R. Chemical and biological charac-
teristics of landfill leachate. In Landfilling of waste: leachate; Elsevier Applied
Science: London and New York, 1992; 65–88.12. Pohland, F.G.; Kim, J.C. In situ anaerobic treatment of leachate in landfill
bioreactors. Water Sci. Technol. 1999, 40 (8), 203–210.
Anaerobic Digestion of Municipal Solid Waste 871
Dow
nloa
ded
by [
The
UC
Irv
ine
Lib
rari
es]
at 2
0:23
24
Oct
ober
201
4
Request Permission/Order Reprints
Reprints of this article can also be ordered at
http://www.dekker.com/servlet/product/DOI/101081ESE120028398
Request Permission or Order Reprints Instantly!
Interested in copying and sharing this article? In most cases, U.S. Copyright Law requires that you get permission from the article’s rightsholder before using copyrighted content.
All information and materials found in this article, including but not limited to text, trademarks, patents, logos, graphics and images (the "Materials"), are the copyrighted works and other forms of intellectual property of Marcel Dekker, Inc., or its licensors. All rights not expressly granted are reserved.
Get permission to lawfully reproduce and distribute the Materials or order reprints quickly and painlessly. Simply click on the "Request Permission/ Order Reprints" link below and follow the instructions. Visit the U.S. Copyright Office for information on Fair Use limitations of U.S. copyright law. Please refer to The Association of American Publishers’ (AAP) website for guidelines on Fair Use in the Classroom.
The Materials are for your personal use only and cannot be reformatted, reposted, resold or distributed by electronic means or otherwise without permission from Marcel Dekker, Inc. Marcel Dekker, Inc. grants you the limited right to display the Materials only on your personal computer or personal wireless device, and to copy and download single copies of such Materials provided that any copyright, trademark or other notice appearing on such Materials is also retained by, displayed, copied or downloaded as part of the Materials and is not removed or obscured, and provided you do not edit, modify, alter or enhance the Materials. Please refer to our Website User Agreement for more details.
Dow
nloa
ded
by [
The
UC
Irv
ine
Lib
rari
es]
at 2
0:23
24
Oct
ober
201
4