laboratory manual for illumination engineering
TRANSCRIPT

Diwakar Bista
Department of electrical and electronics engineering. Kathmandu university
Laboratory Manual
For
Illumination Engineering
i
Abstract
With the advancement in efficient lighting technology, need of implementing these
technologies in developing countries has been comprehended. The technology
transference demands skilled manpower and can be attained by introducing relevant
courses at higher education institutions of the developing world. With this vision, project
to promote energy efficient lighting education in Nepal and Bhutan is initiated by Aalto
University and is co-funded by ERASMUS+ program of European Union. The project
primarily aims to promote lighting education by curricula development and laboratory
establishment at higher education institution in Nepal and Bhutan. With the development
of curricula and establishment of laboratory, there is a need of laboratory manual to guide
students and teachers to conduct experiments that are relevant to illumination engineering
courses.
The main objective of this manual is to guide teachers and students at higher education
institution in Nepal and Bhutan to carry experiments related to optical and electrical
characteristics of light and light sources.
The manual incorporates explanation of technical definitions and units, description of
measurement standards and related equipment and laboratory exercises with objectives,
experiment procedure and necessary assignments. Designed experiments are compatible
to available laboratory equipment at partner higher education institution in Nepal and
Bhutan.

ii
List of Abbreviation
Abbreviation Full form
ASSIST Alliance for Solid-State Illumination Systems and Technologies CCT Correlated Colour Temperature CIE Commission Internationale de l‘Éclairage (International
Commission of Illumination) CT Colour Temperature LED Light Emitting Diode PWM Pulse Width Modulation RGB Red Green Blue RLEF Relative Luminous Efficiency Function SLR Single-Lens Reflex SPD Spectral Power Distribution WLED White Light Emitting Diode

iii
Table of Content
ABSTRACT ..................................................................................................................................................... I
LIST OF ABBREVIATION ................................................................................................................................ II
1. THEORETICAL INTRODUCTION ................................................................................................................. 1
1.1 LIGHT .......................................................................................................................................................... 1 1.2 HUMAN VISION ............................................................................................................................................ 2 1.3 RELATIVE LUMINOUS EFFICACY FUNCTION (RLEF) ................................................................................................ 2
2. RADIOMETRY, PHOTOMETRY AND COLORIMETRY .................................................................................. 4
2.1 RADIOMETRY AND RADIOMETRIC UNITS ............................................................................................................. 4 2.2 PHOTOMETRY AND PHOTOMETRIC UNITS ............................................................................................................ 5 2.3 COLORIMETRY AND COLORIMETRIC UNITS ........................................................................................................... 6 2.4 CIE CHROMATICITY DIAGRAM ......................................................................................................................... 7 2.5 WHITE COLOUR AND COLOUR TEMPERATURE ...................................................................................................... 8 2.6 COLOUR RENDERING INDEX (CRI) .................................................................................................................... 9
3. MEASUREMENT STANDARDS AND TECHNIQUES ................................................................................... 10
3.1 OPTICAL MEASUREMENTS ............................................................................................................................. 10 3.1.1 Illumination Measurement ............................................................................................................. 10 3.1.2 Average intensity ............................................................................................................................ 10 3.1.3 Angular intensity distribution ......................................................................................................... 11 3.1.4 Linear illumination .......................................................................................................................... 11 3.1.5 Total and Partial Flux Measurement .............................................................................................. 12 3.1.6 Luminance Measurement ............................................................................................................... 13 3.1.7 Spectral Power Distribution Measurement.................................................................................... 14 3.1.8 CCT, CRI, Chromaticity and Luminous Efficacy Measurement ........................................................ 15
3.2 ELECTRICAL MEASUREMENT .......................................................................................................................... 15 3.2.1 Voltage - Current Characteristic Measurement .............................................................................. 15 3.2.2 Current – luminous flux measurement ........................................................................................... 16
3.3 THERMAL MEASUREMENT ............................................................................................................................. 16 3.3.1 Surface temperature measurement ............................................................................................... 16 3.3.2 Junction Temperature Measurement ............................................................................................. 16
4. LAB EXERCISES ....................................................................................................................................... 18
4.1 VERIFICATION OF INVERSE SQUARE LAW ........................................................................................................... 18 4.2 AVERAGE ILLUMINANCE MEASUREMENT .......................................................................................................... 20 4.3 EVALUATION OF LED LAMP ILLUMINATION DISTRIBUTION PATTERN AND RELATION OF LUMINOUS INTENSITY WITH INPUT
POWER. ........................................................................................................................................................... 22 4.4 EVALUATION OF LED LAMP LUMINOUS FLUX OUTPUT AND RELATION OF LUMINOUS FLUX WITH INPUT POWER. .............. 24 4.5 MEASUREMENT OF COLORIMETRIC QUANTITIES OF LED BULB .............................................................................. 25 4.6 COLOUR MIXING AND SPD COMPARISON ......................................................................................................... 26
REFERENCES .............................................................................................................................................. 28

1
1. Theoretical Introduction
1.1 Light
Light is an electromagnetic radiation of wavelength in the range that is detected by human
eye. Nature of light is defined by its wavelength. The wavelength is related to frequency by
relation = v/f, where v is the velocity of light and f is the frequency. Electromagnetic
spectrum exhibit character like wave of water, distance between the wave of water is the
wavelength and time rate of flow of wave is the frequency. Graphical representation of
wavelength and velocity of light is represented in figure 1.1 below.
Figure 1.1: Wavelength and velocity of light [20]
Visible rang of light is perceived by human eye and has wavelength in the range of 380 to
780 nm. Each wavelength in the range has specific colour characteristics. Huan eye
distinguish colour based on the wavelength of light. Mixture of all wavelength in the visible
range is white light. [13]
Figure 1.2: Electromagnetic Spectrum [21]
Light is an eliminatory particle that has energy but do not have mass and is termed as
photons or in other words light is delivered in photons. Photons travel in straight line in free
space and uniform medium. Stream of photons is considered/perceived as ray of light.

2
Human eye observes sensation of light when photons strike human retina. Energy of
photons determine colour and number of photons determines brightness.
1.2 Human Vision
Human beings are capable to distinguish object based on the wavelength of light reflected
by the object. This capability to distinguish and identify colour is termed as colour vision.
When light enters human eye and strike retina, the light sensing cells (receptors) in retina
generate nerve pulse and this pulse is transmitted to human brain via optic nerve and
processed to engender sensation of vision. [10]
There are two types of receptors in human eye:
- Rods, which are used for scotopic vision (e.g. under moonlight)
- Cones, which are used for photopic vision (e.g. under sunlight)
Cone cells being responsible for colour vision are of three types to discretely sense for red,
green and blue colour. Small type or Cynolabe, medium type of Chlorolabe and large type
of Erythrolabe are sensitive to blue, green and red respectively. [10]
Figure 1.3: Sensitivity of cone cells [22]
1.3 Relative luminous efficacy function (RLEF)
The relative luminous efficiency functions are defined by CIE (Commission Internationale
de l‘Éclairage) the International commission on illumination. A luminosity function or
luminous efficiency function indicated the level of sensitivity of human eye for a particular
value of wavelength in the visible range of electromagnetic spectrum. Optical radiation in
the visible range but beyond the boundary of RLEF is not useful for human vision.
There are two luminous efficiency functions [10]:
- V(λ), RLEF for photopic vision
• Spectral sensitivity during daytime
• Defined in the range 380-780 nm
• Range of luminance is from 1 to 10 6 cd/m²
• Peak value=1 at 555nm
• Indicated by white curve in figure 1.4

3
- V’(λ), RLEF for scotopic vision
• Spectral sensitivity during night
• Range of luminance is from 10-2 to 10-6 cd/m²
• Peak value=1 at 507nm
• Indicated by black curve in figure 1.4
Figure 1.4: Relative Luminous Efficacy Function [10]
Another recently derived RLEF is Vmes(λ) for mesopic vision. Mesopic vision is also termed
as rod-cone vision and is active in low light condition. When luminance level is not
completely dark but in the range of 0.001 to 3 cd/m2, it considered as mesopic condition.
In mesopic condition both rods and cone cells are active. Object viewed under street light
during night is an example of mesopic vision. Example of image for different vision can be
seen in figure 1.5.
Photopic vision Scotopic vision Mesopic vision
Figure 1.5: Example of photopic, scotopic and mesopic vision [22]

4
2. Radiometry, Photometry and Colorimetry
2.1 Radiometry and radiometric units
Radiometry is the branch of physics that studies the measurement of electromagnetic
radiation (radiant energy), including visible light. [8][10]
Radiant energy (Q): Energy of electromagnetic wave. Its measurement unit is Joule.
Radiant flux (Φe)/ Radiant power: Flow (emitted, reflected, transmitted or received) of radiant
energy per unit time. Its measurement unit is Watt.
e
Q
t
=
(2.1)
Where, t is the time and e signify flux for energetic
Radiant Intensity (Ie): Radiant flux per unit solid angle in a given direction (Watt/sr)
ee
dI
d
=
(2.2)
Where, dΩ is the unit solid angle
Figure 2.1: Point source and solid angle [12]
Radiance (Le): Radiant power per unit solid angle per unit projected source area(W/sr.m2)
21cos
cos
e ee
d dIL
d dA dA
−= =
(2.3)
where, dA is per unit projected source area
Irradiance (Ee): Radiant power incident on a surface (W/m2)
ee
dE
dA
=
(2.4)
Figure 2.2: Flux incident on unit surface [12]
Point Source

5
Radiant efficiency (ηe): It is the ratio of radiant flux to power consumed and expressed in
percentage. It indicates the aptitude of source to engender radiation for a given amount of
power.
ee
P
=
(2.5)
Where, P is power consumed by the radiating source
2.2 Photometry and photometric units
Photometry deals with visual sensation of brightness, which is actuated by light. It differs
from radiometry in that it measures visual response. [8][10]
Luminous flux (Φv): Quantity of light emitted by light source that is useful for human vision
so is often also termed as perceived power of light. Its unit of measurement is Lumen (Lm). 780
380
683 / ( ) ( )v lm W v s d = (2.6)
Where, V(λ) is RLEF for photopic vision and s(λ) is spectral power distribution
Luminous Intensity (Iv): Quantity of light that is radiated in a particular direction. The
direction is measured in terms of per unit solid angle. Its unit of measurement is Candela
(Cd).
vv
dI
d
=
(2.7)
Luminance (Ev): Describes the amount of light that passes through or is emitted from a
particular area and falls within a given solid angle. It describes on the one hand a light
source’s impression of brightness, and on the other, a surface and therefore depends to a
large extent on the degree of reflection (colour and surface). Its unit of measurement is
Candela per meter square. 2
1coscos
V VV
d dIL
d dA dA
−= =
(2.8)
Illuminance (Ev): Density of luminous flux incident on a surface. Its unit of measurement is
Lux.
vv
dE
dA
=
(2.9)
6
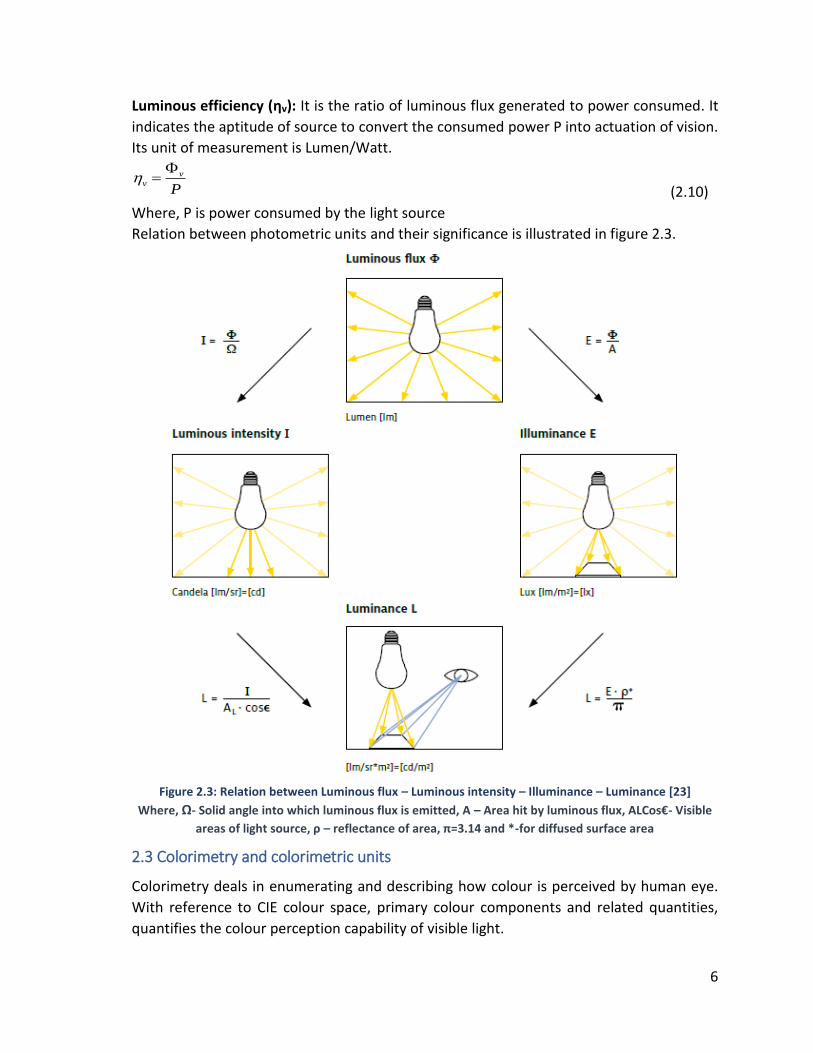
Luminous efficiency (ηv): It is the ratio of luminous flux generated to power consumed. It
indicates the aptitude of source to convert the consumed power P into actuation of vision.
Its unit of measurement is Lumen/Watt.
vv
P
=
(2.10)
Where, P is power consumed by the light source
Relation between photometric units and their significance is illustrated in figure 2.3.
Figure 2.3: Relation between Luminous flux – Luminous intensity – Illuminance – Luminance [23]
Where, Ω- Solid angle into which luminous flux is emitted, A – Area hit by luminous flux, ALCos€- Visible
areas of light source, ρ – reflectance of area, π=3.14 and *-for diffused surface area
2.3 Colorimetry and colorimetric units
Colorimetry deals in enumerating and describing how colour is perceived by human eye.
With reference to CIE colour space, primary colour components and related quantities,
quantifies the colour perception capability of visible light.

7
Tristimulus Values: Most colours can be imitated by a mixture of three primary colour
component referred as stimuli. The three primary stimuli are [R] – Red, [G] – Green and [B] –
Blue.
Colours appearance of a particular spectrum is derived from the proportion of stimuli in the
spectrum. Colours closer to monochromatic are hard to realize using these stimuli. To
eliminate above inconvenience imaginary stimuli [X], [Y] and [Z] were introduced and
defined for Y as luminance, Z is quasi-equal to blue stimulation and X is a mix. The X Y Z
tristimulus values are linear to cone sensitivity of human eye.
Imaginary tristimulus values are calculated using colour matching functions
( ), ( ) ( )x y and z also known as CIE standard observer. CIE standard observer are
graphically indicated in figure 2.4. These functions mathematically describe the spectral
sensitivity of observer to within visible range.
Figure 2.4: CIE standard observer [10]
Imaginary tristimulus values are evaluated as.
( ) ( )
( ) ( )
( ) ( )
X x S d
Y y S d
X z S d
=
=
=
(2.11)
2.4 CIE Chromaticity Diagram
The CIE system exemplifies any colour by a luminance and colour coordinate in the
chromaticity diagram. [22]
Colour coordinate is indicated by (x,y) within the “horseshoe”. Monochromatic colours
have chromaticity on the “horseshoe”. The value of (x,y) is calculated using imaginary
Tristimulus values X,Y and Z.
Xx
X Y Z=
+ +1
Yy and z x y
X Y Z= = − +
+ + (2.12)
CIE chromaticity diagram with x,y coordinates is indicated in figure 2.5

8
Figure 2.5: CIE x y chromaticity diagram [22]
2.5 White colour and colour temperature
White colour in CIE xy chromaticity diagram can be observed along the Planckian locus.
Planckian locus is the locus of points for black body radiation of different temperature.
Planckian locus is indicated by black curve line within the chromaticity diagram of figure
2.5. Chromaticity coordinates very close to Planckian locus may be defined by colour
temperature (CT). Sometimes CCT (correlated colour temperature) may be used to match
the chromaticity of a source with that of the black body radiation.
A standard numerical representation termed as CIE Illuminants are used to represent
spectral power distribution of different white light sources as shown in table 2.1. Table 2.1 CIE Illuminants

9
2.6 Colour Rendering Index (CRI)
CRI is a unit that measures how correctly a light source can reproduce colour with reference
to original colour or colour represented by natural light (sunlight). Best possible value of
CRI as produced by sunlight is 100. Reflectivity spectra of eight test samples are used to
evaluate the chromaticity shifts in respect of a reference source (blackbody radiator). These
eight standard samples used for evaluating reflectivity spectra are indicated in figure 2.7.
Figure:2.7: CIE reflectivity spectra test sample [10]
Special colour rendering indices are calculated using
100 4.6 ; 1.....8i iR E i= − = (2.13)
Where ∆E is the colour difference.
General colour rendering indices is calculated using
1
1
8
n
a i
i
R R=
= (2.14)
Where R1 to R8 are the value of reflectance observed from standard test samples.

10
3. Measurement Standards and Techniques
3.1 Optical Measurements
3.1.1 Illumination Measurement
Illuminance is a measure of density of luminous flux incident on a surface. Unit of
measurement is lux (lumens per square meter) or foot-candles (lumens per square foot).
Measured illuminance of a surface or plane follows the inverse square law. Illuminance
(Lux) meter is used to measure illuminance. An illuminance meter is equipped with diffuser
to eliminate cosine error for light falling on the sensor. Without cosine correction the error
offered is greater than 20 percent. [8] [12]. A typical illuminance meter manufactured by
Konica Minolta is indicated in figure 3.1.
2
VV
IE
d= (3.1)
Where,
Ev is the measured illuminance,
Iv is the luminous intensity of the light source and
d is the measurement distance. Figure:3.1: Typical illuminance (Lux) meter
3.1.2 Average intensity
The average intensity measurement is specifically designed for LED based light source only
one in its kind which has well defined standard for measurement. The conditions are
specified in CIE Publication 127, and results are termed “averaged LED intensity”. Applying
specified techniques, averaged LED luminous intensity, averaged LED radiant intensity and
averaged LED spectral radiant intensity can be measured. Standard condition for
measurement is illustrated in figure 3.2. The standard defines two measurement conditions
ILED A (condition A) and ILED B (Condition B).
Mechanical Axis
Distance (D)
1 cm2 circular detector
Figure 3.2: Standard condition according CIE publication 127 [12]
Circular detector with an opening (aperture) of 1 cm2 is considered for both conditions.
Both light source and detector should be centrally aligned with the aperture along the

11
mechanical axis. The two conditions A and B differ from each other only due to distance
between source and detector. Distance between light source and detector is 316 mm and
100 mm for condition A and B respectively.
The averaged LED intensity ILED is calculated as,
2
LED A LED BLED
I II +
= (3.2)
Where, ILED A and ILED B are values of luminous intensity defined for CIE conditions A and B
respectively.
3.1.3 Angular intensity distribution
Angular intensity distribution is used to measure illumination distribution of light source in
polar coordinate system. Important factors determined by the test is illumination
distribution pattern and view angle of light source. Goniophotometers are used for
automatic measurements but manual measurement can be done by measuring illumination
at different angle using photometer. A typical angular illumination measurement plot can
be seen on figure 3.3.
Figure 3.3: Typical plot of angular illumination measurement [12]
3.1.4 Linear illumination
Linear Illumination gives the illuminance distribution on flat surface. There are no defined
standards regarding distance between lamp and detector but while comparing light source
an identical measurement condition needs to be considered. A typical linear illumination
measurement plot can be seen on figure below.
Figure 3.5: Typical plot of linear illumination measurement [12]

12
3.1.5 Total and Partial Flux Measurement
Total flux output from a light source is often required for many applications. Total flux may
be measured by using either an integrated sphere or a goniophotometers. Measurement
using integrated sphere is less time consuming than goniophotometers.
Measurement using integrated sphere assumes that the sphere reflectivity is uniform
throughout the inner wall, the sphere wall reflectance is Lambertian and there is no object
in the sphere. Light source is placed inside the sphere and this may cause error in
measurement as the light source itself acts as a foreign body inside the sphere. Light from
the source be absorbed or reflected by the source itself. This problem is eliminated by using
an auxiliary lamp inside the sphere to compensate errors. Another component of the
measurement is the light detector and is placed at exit port situated at the outer wall of the
sphere. A light blocking structure known as baffle is place in between light source and
detector as well as in between auxiliary source and detector to prevent direct light from
the source reaching the detector [13]. Schematic of measurement using integrated sphere
and typical integrating sphere is shown in figure 3.6. and figure 3.7 respectively.
Light Source
Auxiliary Lamp
Baffle
Exit Port
Detector
Sphere
Figure 3.6: Schematic representation of an integrating sphere [12]
Figure 3.7: Typical integrating sphere from Konica Minolta

13
Partial flux measurement technique was specified by CIE in their technical report 127. In
Partial flux measurement flux emitted within a given cone angle is considered. Concept of
cone angle can be seen on figure 3.8 [10]
Sour
ce
−
Cone Angle
Figure 3.8: Concept of cone angle for partial flux measurement [12]
Partial flux measurement evaluates amount of flux leaving the source along its central axis
through given cone angle. The measurement is applicable for condition where luminous
flux radiating in a forward direction is utilized for illumination.
3.1.6 Luminance Measurement
Luminance is measured for either a surface or of a point. Luminance of a surface can be
measured by using a normal SLR (single-lens reflex) camera or luminance camera whereas
luminance of a point is measured using luminance meter. Measurements are done for
instance to evaluate the brightness of a source, reflectance of a surface or the luminance
distribution of an area or surface. A typical luminance measurement image of a tunnel
measured using luminance camera and a luminance camera from Konica Minolta can be
seen in figure 3.9 and 3.10 respectively.
Figure 3.9: Typical luminance measurement from a luminance camera [25]

14
Figure 3.10: Luminance camera from Konica Minolta
3.1.7 Spectral Power Distribution Measurement
Spectral Power Distribution (SPD) illustrates the distribution of power produced by the light
source, at each wavelength across the spectrum. It also provides rough idea about colour
property and Colour Rendering index (CRI) of light source. SPD of light source is measured
using spectrophotometer. Light generated by the source is projected to array of optical
sensor of the spectrophotometer either directly through lens or in case where sensor is
isolated from light source, combination of integrating sphere and optical fiber is used.
Measurable range of spectrum is determined by the type of filter and sensor used in the
spectrophotometer. A typical spectral power distribution curve and spectrophotometer is
demonstrated in figure 3.11 and 3.12 respectively.
Another method of measuring the SPD is by using a reflectance surface and a digital camera.
Light from the source is projected to a reflectance surface (usually made with
Polytetrafloride, Russian Opal or Barium sulphate) and a digital image is taken and further
processed in computer for evaluating SPD. [9][13]
Figure 3.11: Typical spectral power distribution curve [26]
Figure 3.12: Spectrophotometer from Konica Minolta

15
3.1.8 CCT, CRI, Chromaticity and Luminous Efficacy Measurement
CCT provides basic understanding for the composition of colour components in a white light
source and primarily used to express degree of redness (warm) or blueness (cool) of a white
light source. CCT is numeric value of temperature in degree Kelvin and this value
corresponds to the temperature to which one would have to heat a theoretical black body
source to produce light of the same visual colour. Standard measurement technique for CCT
is specified in C78.377 of ANSI. In course of evaluating CCT, initially value of (x,y) coordinate
is evaluated from spectral power distribution and with reference to CIE chromaticity
diagram, the (x,y) coordinate is corelated to nearest point in the Planckian locus.
Measurement of CCT, CRI, chromaticity and luminous efficacy is suggested by ASSIST
(Alliance for Solid-State Illumination Systems and Technologies) in their third volume of
ASSIST Recommends [18]. The measurement is carried out in two stages, at the initial stage
SPD and lumen value is evaluated using integrating sphere and spectrophotometer and
utilizing these data in later stage CCT, CRI chromaticity and luminous efficacy is evaluated
mathematically. But for luminous efficacy input power to lamp should also be measured
using power analyzer.
Alternately for measuring total flux and SPD of a luminaire, instruments like Flux-O-Meter
can also be used. Flux-O-Meter measures luminous flux and SPD at many points around the
virtual sphere surrounding the luminaire. The main advantage of this instrument is, it does
not require minimum distance between it and luminaire. These devices are independent of
size, position colour and shape of the luminaire. [9] [11] [12]
3.2 Electrical Measurement
All modern artificial light source is driven by electric power. Visible radiation is produced
due to flow of current through the light source circuit. So electric measurement establishes
relation between supplied voltage, current through the light source and light output form
the source. [14]
3.2.1 Voltage - Current Characteristic Measurement
Voltage - Current (V-I) Characteristic measurement of light source determines the relation
between supplied voltage and current flowing through the circuit. Measurement of V-I
characteristic of light source is quite straightforward compared to other measurements. A
voltmeter and an ammeter can be implemented and current through light source is
measured for corresponding value of voltage. This method is tedious and requires lots of
accuracy. V-I characteristic may also be analyzed by using an automated system capable of
automatically varying voltage over a range and logging the data for both voltage across and
current through light source. A typical V-I characteristic plot of LED is demonstrated in
fugure 3.13 below. [12][14]

16
Figure 3.13: Typical Voltage-Current characteristic of LED [12]
3.2.2 Current – luminous flux measurement
Current vs luminous flux measurement of a light source is done to evaluate the efficiency
and to determine the linearity of lumen output against power input. Usually it is assumed
that light output increase with increase in input current, but this does not hold true in all
the cases. Current vs luminous flux can be measured by using current source and integrating
sphere.
Figure 3.14: Typical Luminous flux / supply current [12]
3.3 Thermal measurement
3.3.1 Surface temperature measurement
Surface temperature of light source of a light source is measured to observe the thermal
loss and in case of LED, it is used to measure the efficiency of thermal circuit and predict
the life expectancy of LED. Surface temperature is measured using temperature sensors or
infrared imaging. An image from an infrared camera is compared against lookup chart to
evaluate temperature from a hot body.
3.3.2 Junction Temperature Measurement
This measurement is specifically for LED. It has been already verified that the operating
temperature of semiconductor device known as the junction temperature affects not only

17
the efficiency but also the reliability of the devices. Accurate junction temperature
measurement of LED is important in investigating efficiency of LED. Increment in junction
temperature is the main cause for failure of semiconductor material. Increment in junction
temperature decreased light output and affects the emission spectrum. Generally, there is
increment of 0.03-0.13 nm/°C in emission wavelength. So higher temperatures of the LED
will result in reduced lumen maintenance and shorten useful life. [3]
There are numerous methods for measuring the junction temperature of LED. Voltage–
temperature relation, noematic liquid crystal thermograph, peak wavelength shift method
etc. are some of the methods. Among which voltage-temperature relation is the most
versatile, simple and provides most accurate results. Results obtained from voltage-
temperature relation method is quite like peak wavelength shift method. Concept of
junction temperature measurement using voltage-temperature relation method originates
from Shockley diode equation. [12][17] ( / )
0
eV nkTI I e= (3.3)
Where,
I is the diode current,
I0 is the reverse saturation current,
e is the electronic charge,
V is the diode voltage,
n is the emission coefficient, also known as the ideality factor,
k is the Boltzmann’s constant and
T is the absolute junction temperature.
For analyzing voltage-temperature relation, equation describing voltage-current
characteristic curve is considered. ( / )
0aE kT
ssI I e= (3.4)
Where, Ea is the activation energy of semiconductor and Iss is constant.
Subsisting equation 4 into 3 gives equation 5, which is used for evaluating junction
temperature.
ln( ) a
ss
IeV nkT nE
I= + (3.5)
The voltage-temperature relation method involve measurement in two steps. Initially
calibration measurement is done which is followed by actual junction temperature
measurement. Calibration measurement establishes relation between forward voltage and
junction temperature. In second step, LED is driven with different current and voltage
across diode is measured. Ultimately, using data obtained in previous steps and equation
above, junction temperature is evaluated. [3]

18
4. Lab Exercises
4.1 Verification of inverse square law
Objective:
To verify inverse square law by means of linear intensity measurement
Apparatus: Light source, Illuminance meter, power supply for light source and measuring
scale attached to a flat surface.
Theory:
Optical radiation is one of the field of physics that obey inverse square law. Illuminance
offered by a point source tend to decrease with the increase in distance and the value of
illuminance at any pint at distance r is given by relation below.
𝐸 =𝐼
𝑟2 (4.1.1)
Where,
E is illuminance and I is intensity at surface of the light source and r is distance between
source and surface of measurement. [8]
Figure E1.1: Demonstration of inverse square law [22]
Optical radiation from a point source with strength S and tendency of optical radiation along
distance r is illustrated in figure E1.1 above.
Experimental setup:
1.....2.....3.....4.....5.....6.....7.....8.....9.....10.....11.....12.....13.....14.....15.....16.....17.....18
Light SourceIlluminance Meter
Flat surface with cm scale
Line of movement
Moveable platform
Figure E1.2: Experimental setup

19
Procedure:
1) Fix light source on a moveable platform upon scaled flat surface as shown in figure
E1.2.
2) Fix illuminance meter or its detector at the other end of the flat surface.
3) Connect light source to rated power supply.
4) The experiment should be conducted in dark room where no light from external
source or light reflected from other surface interact with direct light form light
source to sensor.
5) Turn on the light bulb and measure the illumination value at every 5 cm starting
from the initial position of the light source to 5 cm away from the detector. Distance from light source 1/(Distance from light source) 2 Illumination value
6) Plot graph for distance from light source Vs Illumination and 1/ (Distance from light
source) 2 Vs Illumination.
Questions:
1) Out of two plots plotted in procedure 6, which one verifies inverse square law, and
which one demonstrate direct relationship?
2) Evaluate illumination value if distance between light source and sensor is tripled.
3) Explain the applicability of inverse square law in other domain of physics.
Conclusion:
20
4.2 Average Illuminance Measurement
Objective:
To evaluate average illumination of a work space
Apparatus:
Measuring scale, point marker and illuminance meter
Theory:
Average illumination is the mean value of illumination at several points of a workplace. A
general workplace demands adequate and uniformly distributed illuminance as per nature
of work. Less variance in illumination level throughout the workspace is preferred.
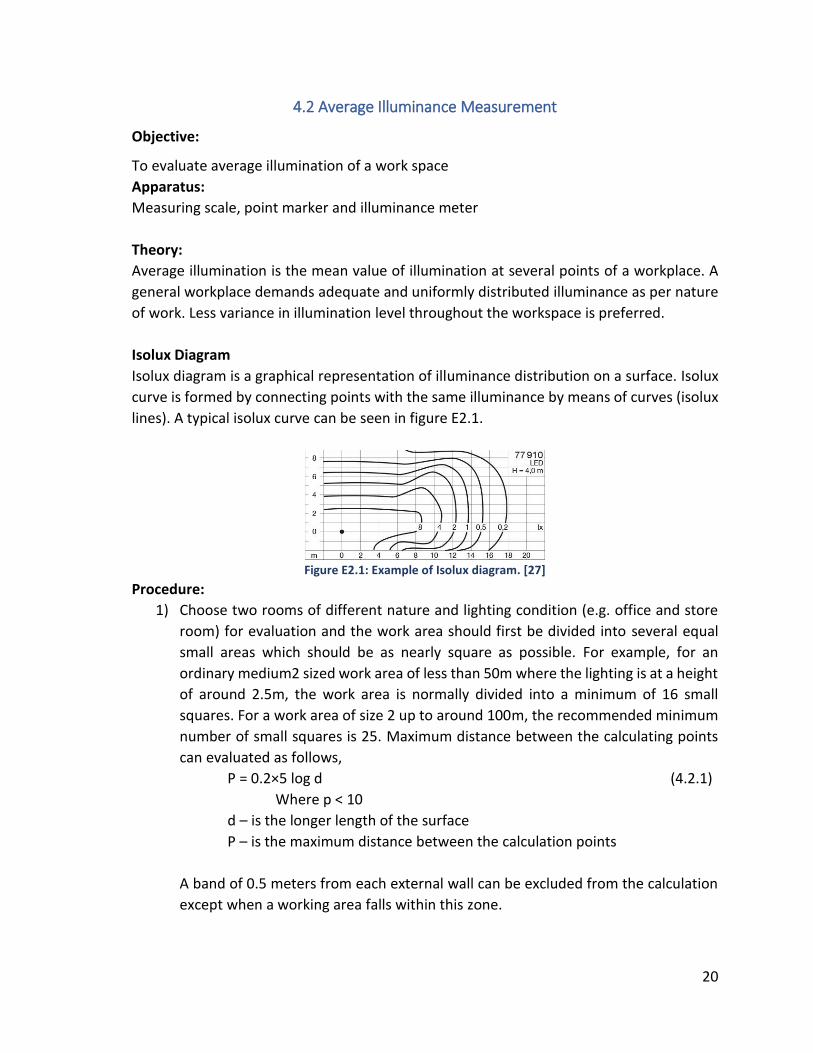
Isolux Diagram
Isolux diagram is a graphical representation of illuminance distribution on a surface. Isolux
curve is formed by connecting points with the same illuminance by means of curves (isolux
lines). A typical isolux curve can be seen in figure E2.1.
Figure E2.1: Example of Isolux diagram. [27]
Procedure:
1) Choose two rooms of different nature and lighting condition (e.g. office and store
room) for evaluation and the work area should first be divided into several equal
small areas which should be as nearly square as possible. For example, for an
ordinary medium2 sized work area of less than 50m where the lighting is at a height
of around 2.5m, the work area is normally divided into a minimum of 16 small
squares. For a work area of size 2 up to around 100m, the recommended minimum
number of small squares is 25. Maximum distance between the calculating points
can evaluated as follows,
P = 0.2×5 log d (4.2.1)
Where p < 10
d – is the longer length of the surface
P – is the maximum distance between the calculation points
A band of 0.5 meters from each external wall can be excluded from the calculation
except when a working area falls within this zone.

21
P1 P2 P3 P4
P5 P6 P7 P8
P9 P10 P11 P12
P13 P14 P15 P16
Length
Wid
th
Figure E2.2 – Grid formation in a room
2) After setting the small squares, the assessor may take illuminance measurement at
the center of each square (P1, P2 etc. as indicated in figure E2.2) with an illuminance
(Lux) meter.
3) Plot illuminance value against point number to observe the evenness of illumination
distribution in a room.
4) Evaluate average illumination Iaverage in the room by taking average of all illumination
divided by number of cells.
1 2.......P P Pnaverage
I I II
n
+= where, Iaverage is average illumination, Ip1….Ipn illumination
value at all the points and n is the number of cells.
5) Evaluate illuminance uniformity using,
Minimumuniformity
average
II
I= Where, IMinimum is the minimum value of illumination among all
the cells
6) Draw Isolux diagram based on grid measurement carried out in 2.
Questions:
1) Evaluate whether an appropriate level of illuminance is provided for the
purpose, by comparing the obtained value with the optimum average
illumination provided in the publication “Guidelines for Good Occupational
Hygiene Practice in a Workplace”.
2) What measures can be taken if the illumination at a work space is not evenly
distributed?
3) What is the relation between average illumination distribution of a room and
illumination distribution pattern of a luminaire used?
Conclusion.

22
4.3 Evaluation of LED lamp illumination distribution pattern and relation of luminous
intensity with input power.
Objective: To become familiar with luminous intensity and its relationship with input
power. Illumination distribution pattern of various nature and evaluate view angle of lamp
Apparatus:
Dark room, Goniophotometer, power supply, three samples of LED lamp with same power
rating and different illumination distribution patter,
Theory:
LED being a pointed source, light from LED do not spread as fluorescent or incandescent
lamp. The distribution patter of light form LED is determined by the construction of epoxy
dome and optics involved in it.
Light generated inside LED travels through various stages before it if finally emitted out to
the surrounding. Majority of light is trapped inside or reflected back because of total
internal reflection caused by high refractive index of air-epoxy interface. So, amount of light
that come out of LED and its distribution is totally dependent upon the type of epoxy dome
and lamp diffuser.
LEDs and LED lamps are equipped with diverse types of epoxy structure and diffuser: some
focus most of the light to a point while other offer wider view angle and spread light to a
wider diameter. Both types are important depending upon nature of application. WLEDs
with wide view angle are suitable for general purpose lighting application. Compared to
narrow angel LED, luminous intensity at optical axis is always less for wide angle LED as
most of the light spreads in other direction. Sometimes as in case of batwing pattern of
illumination distribution, luminous intensity at optical axis is less in comparison to another
angle.
View angle of LED lamp is defined as twice the angle at which the luminous intensity is half
the peak value. [12]
Figure E3.1: Example of LED illumination distribution pattern [12]

23
Procedure:
Experiment 1:
1) Connect LED lamp to goniometer at stationary position and connect lamp to
regulated power source.
2) Vary the current to supply power from 0 to twice the rated power.
3) Power should be varied at an interval of 1% of the rated power and at each interval
luminous intensity is to be measured.
4) Repeat step 1-3 for all three samples of LED bulb.
5) Plot the curve for luminous intensity Vs rated power.
Experiment 2:
1) Connect LED lamp to goniometer as per specification of the instrument.
2) Start the goniometer with setting of power supply as per lamp specification.
3) Perform single axis measurement to evaluate peak intensity and view angle of LED
lamp.
4) Perform measurement in all three axis to obtain 3D illumination distribution pattern
of light source.
Questions:
1) Comment on linearity of luminous intensity vs lamp power consumption.
2) What is the relation between peak intensity and view angle of LED lamp?
3) Write short notes on application of LED lamps based on illumination distribution
pattern.
4) Briefly describe the characteristic of 3D illumination distribution pattern as obtained
in experiment 2.
Conclusion:

24
4.4 Evaluation of LED lamp luminous flux output and relation of luminous flux with
input power.
Objective:
To become familiar with luminous flux and observe the relation of lamp lumen output
verses input power. To evaluate luminous efficacy of light bulb.
Apparatus:
Integrating sphere, Light bulb (LED preferable), power supply with power analyzer.
Theory:
Light output from any light source is measured in terms of total lumen output. Total
luminous flux is evaluated by adding luminous flux emitted by light source in all direction.
This is done by means of integrating sphere or goniometer. After getting value of lamp
lumen output, luminous efficacy of light source can be derived by dividing luminous flux by
input electrical power. [11]
Procedure:
1) Install light bulb inside the integrating sphere
2) Connect power source and power analyzer to integrating sphere
3) Connect and configure auxiliary lamp to the opening of integrating sphere as per
instruction of the equipment.
4) Vary the current to supply power from 0 to twice the rated power.
5) Power should be varied at an interval of 1% of the rated power and at each interval
luminous flux is to be measured.
6) Plot the curve for luminous intensity Vs rated power.
7) Drive the lamp with its rated power.
8) Measure luminous flux and evaluate luminous efficacy.
9) Repeat step 7 for five times at an interval of five minutes.
10) Drive the lamp with 200 Hz, 50% duty cycle pulse width modulated signal with power
twice the rated power and note the value of luminous flux.
Questions:
1) Comment on linearity of luminous flux vs lamp power consumption.
2) Comment on effect of overdriving light source with constant higher power.
3) Compare and comment on the value of luminous flux obtained in step 7 and 9.
4) Write short notes on the importance of luminous efficacy in evaluating performance
of light source.
Conclusion:

25
4.5 Measurement of colorimetric quantities of LED bulb
Objective:
To become familiar with different colorimetric units and its importance in lighting design
Apparatus:
LED bulb with different SPD and CT, Spectrophotometer and power supply with power
analyzer.
Theory:
Quality of light from any light source is determined based on its colour quality. Specially in
case of phosphor converted white LED, measurement of colorimetric quantity is very
important to insure better quality of white light. [5]
Procedure:
1) Install light bulb inside the integrating sphere and supply rated power.
2) Follow the procedure provided by equipment manufacturer and measure CT, CRI,
chromaticity coordinates value, SPD curve, colour purity and luminous flux.
3) Repeat step 1 and 2 for all three set of test sample.
Question:
1) Observing the SPD curve, how can you say that the LED is phosphor converted blue
LED?
2) What is the relation between CRI and SPD?
3) Based on obtained (x,y) value of CIE chromaticity diagram explain the relation
between CT and CCT?
4) Is there any relationship between CT and CRI? Do LED lamp with low CT has higher
CRI?
5) What is colour purity and what does it signifies?
6) With reference to obtained SPD curve, CRI and luminous flux, explain why there is
trade off between luminous efficacy and CRI for phosphor converted WLED.
Conclusion:

26
4.6 Colour mixing and SPD comparison
Objective:
To demonstrate method of colour mixing and its effect on SPD and CRI.
Apparatus:
Test luminaire constructed with separate high-power Red, Green and Blue LED with 1A
current rating, spectrophotometer integrated with integrating sphere, variable PWM
current source with power analyzer.
Theory:
One of fundamental aspects of colorimetry is colour mixing and matching. Colour stimuli
can be produced by two methods: additive and subtractive colour mixing. Colour mixing of
light source follows additive colour mixing.
Procedure:
1) Build a test luminaire with Red, Green and Blue LED with each type connected in
series and independent from each other as per figure E6.1.
Red
LE
D a
rray
Gre
en L
ED
arr
ay
Blu
e L
ED
arr
ay+Ve Supply +Ve Supply +Ve Supply
Figure E6.1: LED arrangement for RGB luminaire
2) For the optical arrangement, all LED should be fixed to a common housing with milky
white diffuser on the top.
3) Install the luminaire inside the integrating sphere and connect it to three different
power supplies with current regulator.
4) Turn on power supply for red channel with current equal to the rated current for
red LED and measure forward voltage, SPD and CRI.
5) Repeat step 4 for green and blue LED.
6) Turn on all the source with current setting of 1A and duty cycle of PWM signal as
per table below, and take reading for SPD, CRI and CT.

27
Table E6.1: PWM duty cycle chart
SN Red Green Blue
1 50% 20% 20%
2 20% 50% 20%
3 20% 20% 50%
4 50% 50% 50%
5 100% 100% 100%
7) Observing continuous spectrum and CCT reading, evaluate duty cycle of all three
LEDs to obtain warm light of CCT 2000-degree Kelvin and cool light of CCT 6000-
degree Kelvin.
8) Observe CRI value and adjust the duty cycle to obtain white light with CRI above 90.
9) Adjust PWM duty cycle to obtain relative intensity of all three source at same level
and observe difference in power consumed by all three sources.
Questions:
1) Comment on tradeoff between luminous efficacy and colour quality.
2) What does negative value of CRI indicate?
3) Why is luminous efficacy of RGB mixed led is less compared to phosphor converted
WLED lamp?
4) Is there any relation between CRI and CCT in case of mixed white LED lamp?
5) What are different application areas where RGB colour mixing can be implemented?
Conclusion:
28
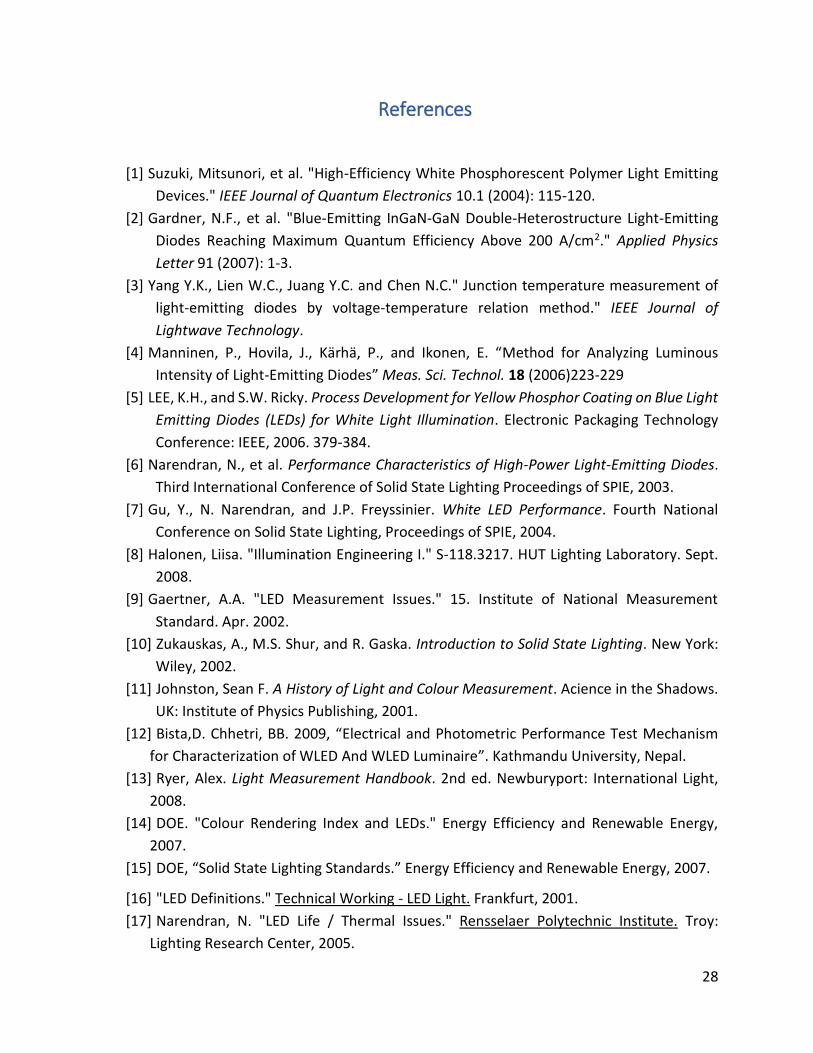
References
[1] Suzuki, Mitsunori, et al. "High-Efficiency White Phosphorescent Polymer Light Emitting
Devices." IEEE Journal of Quantum Electronics 10.1 (2004): 115-120.
[2] Gardner, N.F., et al. "Blue-Emitting InGaN-GaN Double-Heterostructure Light-Emitting
Diodes Reaching Maximum Quantum Efficiency Above 200 A/cm2." Applied Physics
Letter 91 (2007): 1-3.
[3] Yang Y.K., Lien W.C., Juang Y.C. and Chen N.C." Junction temperature measurement of
light-emitting diodes by voltage-temperature relation method." IEEE Journal of
Lightwave Technology.
[4] Manninen, P., Hovila, J., Kärhä, P., and Ikonen, E. “Method for Analyzing Luminous
Intensity of Light-Emitting Diodes” Meas. Sci. Technol. 18 (2006)223-229
[5] LEE, K.H., and S.W. Ricky. Process Development for Yellow Phosphor Coating on Blue Light
Emitting Diodes (LEDs) for White Light Illumination. Electronic Packaging Technology
Conference: IEEE, 2006. 379-384.
[6] Narendran, N., et al. Performance Characteristics of High-Power Light-Emitting Diodes.
Third International Conference of Solid State Lighting Proceedings of SPIE, 2003.
[7] Gu, Y., N. Narendran, and J.P. Freyssinier. White LED Performance. Fourth National
Conference on Solid State Lighting, Proceedings of SPIE, 2004.
[8] Halonen, Liisa. "Illumination Engineering I." S-118.3217. HUT Lighting Laboratory. Sept.
2008.
[9] Gaertner, A.A. "LED Measurement Issues." 15. Institute of National Measurement
Standard. Apr. 2002.
[10] Zukauskas, A., M.S. Shur, and R. Gaska. Introduction to Solid State Lighting. New York:
Wiley, 2002.
[11] Johnston, Sean F. A History of Light and Colour Measurement. Acience in the Shadows.
UK: Institute of Physics Publishing, 2001.
[12] Bista,D. Chhetri, BB. 2009, “Electrical and Photometric Performance Test Mechanism
for Characterization of WLED And WLED Luminaire”. Kathmandu University, Nepal.
[13] Ryer, Alex. Light Measurement Handbook. 2nd ed. Newburyport: International Light,
2008.
[14] DOE. "Colour Rendering Index and LEDs." Energy Efficiency and Renewable Energy,
2007.
[15] DOE, “Solid State Lighting Standards.” Energy Efficiency and Renewable Energy, 2007.
[16] "LED Definitions." Technical Working - LED Light. Frankfurt, 2001.
[17] Narendran, N. "LED Life / Thermal Issues." Rensselaer Polytechnic Institute. Troy:
Lighting Research Center, 2005.

29
[18] ASSIST Programe. <http://www.lrc.rpi.edu/programs/solidstate/assist/index.asp>
[19] Lighting Research Center. <http://www.lrc.rpi.edu>.
[20] National Telecommunications and Information Administration.
<https://www.ntia.doc.gov>
[21] Electromagnetic and Radiation Space.
<http://fundamental.art.pl/WORKSHOP_ERS.html>
[22] Wikipedia. <https://en.wikipedia.org>
[23] Zumtobel – Lighting Handbook. < https://www.zumtobel.com>
[24] Internalin Commission of Illumination. < http://www.cie.co.at>
[25] Asselum. <http://www.asselum.com>
[26] kW Engineering. < http://kw-engineering.com>
[27] Bega. <http://www.bega.com>