laboratory and pilot scale testwork with 8 t rom iron ore ... · the screening after hpgr at 1 mm...
TRANSCRIPT
A7451_NordicIronOre_Blötberget_report.docx
Laboratory and pilot scale testwork
with 8 t ROM iron ore sample from
Blötberget deposit (Sweden)
for
Nordic Iron Ore AB (Danderyd, Sweden)
Liebenburg-Othfresen, 2016, May 25th
Report
on

SGA Studiengesellschaft für Eisenerzaufbereitung GmbH & Co. KG
A7451_NordicIronOre_Blötberget_report.docx 2
Index
1. Introduction .................................................................................................................................3
2. Delivered iron ore samples .........................................................................................................5
3. Rougher stage low intensity magnetic separation .......................................................................7
3.1. Rougher LIMS Feed ..........................................................................................................7
3.2. Rougher LIMS – Pilot scale test ........................................................................................8
4. Rougher stage spiral separation ................................................................................................10
4.1. Laboratory scale tests with Rougher LIMS Tailings - 'Material 1' .................................10
4.2. Rougher stage spiral separation - Pilot scale test ............................................................12
5. Cleaner stage low intensity magnetic separation ......................................................................15
5.1. Laboratory scale tests with Rougher LIMS concentrate - 'Material 2' ............................15
5.2. Cleaner LIMS - Pilot scale test ........................................................................................16
6. Regrinding of rougher stage spiral concentrates .......................................................................18
7. Scavenger stage processing.......................................................................................................19
7.1. Laboratory scale test with rougher stage spiral tailings ..................................................19
7.2. Iron recovery in scavenger stage .....................................................................................21
8. Cleaner stage spiral separation ..................................................................................................25
8.1. Laboratory scale tests with Reground rougher spiral concentrate - 'Material 6' .............25
8.2. Cleaner stage spiral separation - Pilot scale test ..............................................................26
8.3. Iron recovery from Cleaner spiral tailings.......................................................................28
9. Flotation for apatite removal .....................................................................................................30
9.1. Laboratory scale flotation tests for apatite removal ........................................................30
9.2. First pilot scale flotation test for apatite removal ............................................................33
9.3. Laboratory scale tests for apatite removal .......................................................................34
9.4. Second pilot scale flotation test for apatite removal .......................................................35
10. Summary ............................................................................................................................39

SGA Studiengesellschaft für Eisenerzaufbereitung GmbH & Co. KG
A7451_NordicIronOre_Blötberget_report.docx 3
1. Introduction
On behalf of Nordic Iron Ore AB (“NIO”; Danderyd, Sweden), Studiengesellschaft für
Eisenerzaufbereitung (“SGA”) has performed laboratory and pilot scale testwork with an 8 t
ROM iron ore sample from Blötberget deposit in Sweden.
The testwork comprised of
- receipt and preparation of three separate bulk sample materials
- the combination of these three ore types to produce a head sample representing the first
five years of run of mine (‘ROM’) at Blötberget,
- pilot scale testwork for upgrading the iron content and reduce the phosphorus content and
- accompanying laboratory scale testwork.
In previous testwork a flowsheet for beneficiation of this ore had been developed. On the one
hand this programme of work was expected to verify the suitability of that flowsheet, but the
main purpose was to improve the iron recovery in the hematite recovery circuit.
The projects’ intermediate and final results were discussed and mutually agreed between NIO,
Tata Steel Consulting and SGA.
All findings and test results in this report refer to the tested sample only.
SGA Studiengesellschaft für Eisenerzaufbereitung GmbH & Co. KG
A7451_NordicIronOre_Blötberget_report.docx 4
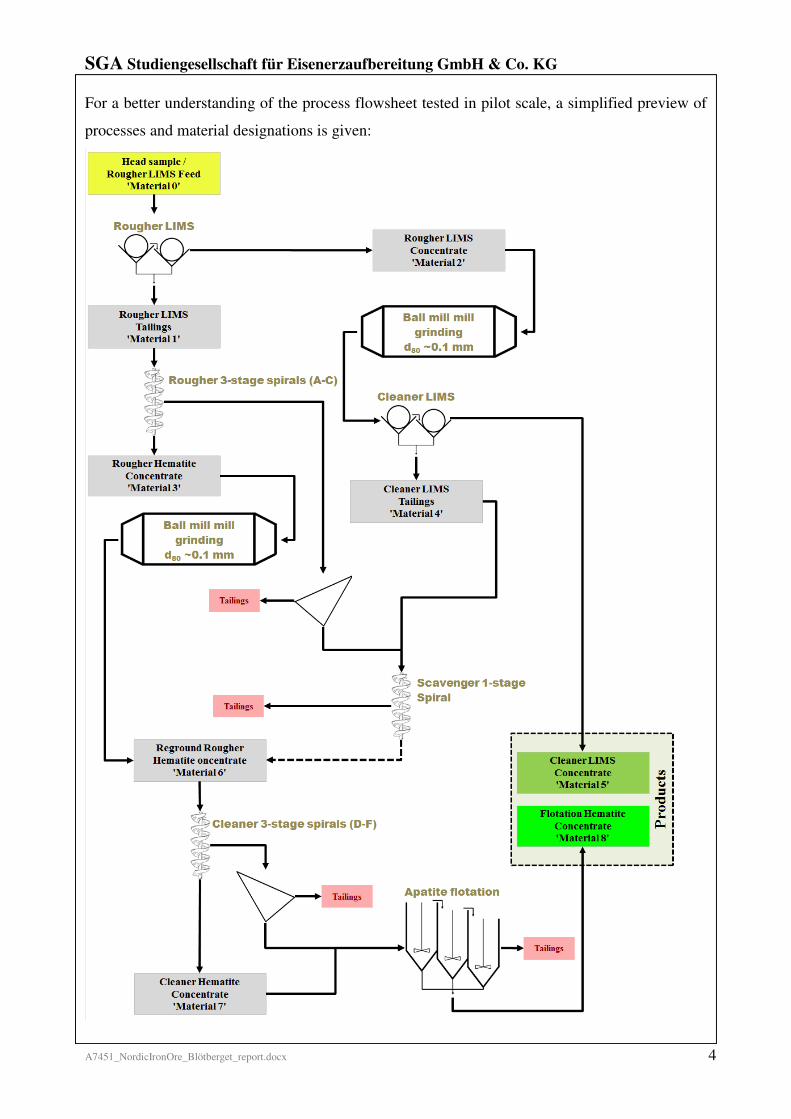
For a better understanding of the process flowsheet tested in pilot scale, a simplified preview of
processes and material designations is given:

SGA Studiengesellschaft für Eisenerzaufbereitung GmbH & Co. KG
A7451_NordicIronOre_Blötberget_report.docx 5
2. Delivered iron ore samples
On 28th October 2015, the first delivery with 16 big bags of Blötberget iron ore samples was
received at SGA.
The delivery was spilt up as follows:
� 6 big bags ~6 t ‘Guldkannan (GK)’ / Magnetite
� 8 big bags ~8 t ‘Hugget (HG)’ / Hematite
� 2 big bags ~1.7 t ‘Footwall (FW)’ / Waste
The delivered ores were sized up to 500 mm. Each subsample was crushed individually using
SGA’s jaw crusher to <40 mm and subsequently homogenized and a sample for chemical
analysis was split out. A short description of the jaw crusher is given in Appendix E-1.
The chemical analyses are listed in Appendix 2-11.
Guldkannan is a magnetitic type of crude ore with 33.9 % Fetot and 40.8 % Magnetite. The ratio
of iron bound to magnetite and total iron content is at 87.1 %.2
Hugget is a crude ore with both magnetitic and hematitic portions, the iron content was found at
55.2 % Fetot, the Magnetite at 40.6 %. The ratio of iron bound to magnetite and total iron content
is at 53.2 %. Accordingly, roughly a half of the iron can be recovered by low intensity magnetic
separation.
Footwall showed low iron and magnetite content, i.e. 7.6 % Fetot and 4.7 % Magnetite.
With these three chemical compositions, the client instructed SGA to prepare a blend or
composite sample according to the following proportions:
� 17.5 % ‘Guldkannan (GK)’ / Magnetite
� 52.5 % ‘Hugget (HG)’ / Hematite
� 30.0 % ‘Footwall (FW)’ / Waste
A 2 t sample, sized <40 mm, was combined accordingly, homogenized and sent to
WEIR Minerals’ test center (Cologne, Germany) for HPGR-testwork (High Pressure Grinding
Rolls).
1 The numeration of appendices refers to the respective chapter in the report: Appendix 2 is linked to Chapter 2. The used equipment including its main characteristics is listed in Appendix E at the very end.
2 The calculation of the percentage of iron bound to magnetite is as follows:
[%Feboundtomagn./Fetot] =[%[Fe
boundtomagn.]
[%Fetot]∗ 100% =
[%Magn.]·0,72358
[%Fetot]

SGA Studiengesellschaft für Eisenerzaufbereitung GmbH & Co. KG
A7451_NordicIronOre_Blötberget_report.docx 6
However, to have sufficient head sample for all requested testwork at SGA, it became necessary
to send additional ‘Footwall (FW)’ material. That second delivery was received at SGA on 22nd
December 2015 and comprised of 3 big bags with a total of ~2.5 t.
To avoid unduly delays to the programme, SGA had already commencing crushing material
from Guldkannan and Hugget individually to <1 mm. For this SGA’s HPGR unit
(Appendix E-2) and dry screen (Appendix E-3) was used. The ores were charged to HPGR in
single pass at 3750 kN/m² and dry screened subsequently at 1 mm. The screen oversize was
returned to the HPGR.
Upon receipt of the additional material, the footwall sample was crushed to <1 mm applying the
same procedure.
All three samples were homogenized individually and weighed in according to the ratio
mentioned above for final mix of head sample, representing Blötberget ROM.
The combination of the delivered subsamples is shown in Appendix 2-2.
The mixed head sample, 7900 kg in total, is designated as ‘Material 0‘ or as Rougher LIMS Feed
according to the initial processing step.

SGA Studiengesellschaft für Eisenerzaufbereitung GmbH & Co. KG
A7451_NordicIronOre_Blötberget_report.docx 7
3. Rougher stage low intensity magnetic separation
3.1. Rougher LIMS Feed
Chemical composition
The head sample – Rougher LIMS Feed (‘Material 0‘) was analysed for its chemical
composition, which is shown in Appendix 3.1-1.
The iron content was analysed to 37.6 % Fetot. Based on FeO content at 9.99 %, the theoretical
magnetite content would be calculated to about 33.2 % Mag. Magnetite content was determined
by Satmagan to 30.3 %, the lower value determined indicates that some FeO is bound to
silicates. This might be proven by mineralogical survey of the material, which wasn’t performed
in this test programme.
From the determined magnetite content a ratio of Febound to magnetite/Fetot can be calculated to
58.3 %. That means that 58.3 % of the samples’ iron is bound to magnetite and can be recovered
mostly by low intensity magnetic separation after liberation grinding. The magnetite content
gives an indication for the expected final weight recovery in multi-stage low intensity magnetic
separation (“LIMS”) after liberation grinding.
Silica was analysed for Rougher LIMS Feed to 35.35 % SiO2 and alumina to 5.0 % Al2O3.
Further, 1.25 % CaO and 1.77 % MgO were found. Loss on ignition (LOI) was at -0.38 %.3
Phosphorus content was at 0.236 % P, titanium dioxide at 0.185 % TiO2 and Vanadium at
0.022 % V. P, TiO2 and V have the tendency to concentrate in some or all of the final
concentrates, therefore these elements are monitored throughout the project.
Alkalis were at 1.72 % Na2O and 0.69 % K2O, sulphur content was at 0.004 % S. The contents
of the other analysed elements were low as well.
Size distribution
The result of the wet screen analysis is shown in Appendix 3.1-2.
The screening after HPGR at 1 mm resulted in only 6.0 % being larger than 0.63 mm. On the
other hand only 18.4 % <0.040 mm were found. The d80-value is calculated to 0.37 mm and the
median size was at 0.15 mm.
3 The given value is the weight loss during ignition. The weight gain caused by oxidation of magnetite had not been determined and separated. The negative value means that the weight gain caused by oxidation of magnetite is higher than the impurities being removed by ignition.

SGA Studiengesellschaft für Eisenerzaufbereitung GmbH & Co. KG
A7451_NordicIronOre_Blötberget_report.docx 8
Davis Tube Tests
On client’s request two Davis tube tests were performed. (Davis tube unit is described in
Appendix E-4). One test was performed with the <1.0 mm sample. For the other one, the head
sample was screened at 0.63 mm and oversize reground to <0.63 mm top size.
The results of both Davis Tube Tests are shown in Appendix 3.1-3.
The iron content of Davis tube concentrate was at 68.0 % Fetot for <1.0 mm and 68.7 % Fetot for
<0.63 mm. The iron recovery was at 57.3 and 56.8 % Ferec, respectively. Silica was found at 3.5
and 3.13 % SiO2. Accordingly 96.9 and 97.2 % of the silica were removed.
3.2. Rougher LIMS – Pilot scale test
Based on the suspicion that the ores from Blötberget would contain rather martite than hematite,
it was suggested that a medium intensity magnetic separation (‘MIMS’) step be used in an
attempt to reject tailings low in iron. Therefore a MIMS unit was put ahead the low intensity
magnetic separation (‘LIMS’) for the rougher stage LIMS pilot scale test.
Hence the set-up for processing Rougher LIMS Feed (‘Material 0‘) in pilot scale was as follows:
� 1-stage MIMS of Rougher LIMS Feed (‘Material 0‘)
(1 drum concurrent at 3500 Gauss; FST type; Appendix E-5)
� 3-stage LIMS of MIMS concentrate
(1 drum counter-current at 1000 Gauss; Eriez type; Appendix E-6) and
(2 drums counter-current at 600 Gauss; SALA type; Appendix E-7) 4
Short to 7.9 t of ROM-sample (Rougher LIMS Feed – ‘Material 0’) were processed in this pilot
scale at 1800 kg/h. After reaching steady state, samples were taken and analysed for mass flow,
size distribution and chemical composition. Appendix 3.2-1 gives an overview on the flowsheet.
4 The magnetic separators SGA used for pilot plant testing have the same diameter of 0.6, 0.9 and 1.2 m as industrial scale separators, therefore also the same configuration of the magnets. Only width is lower, industrial scale separators were manufactured up to 3.0 m of width, pilot plant units usually have a width of 0.4-0.2 m. Despite of this, the needed pulp flow from pilot units is still high, 8-15 m³/h. In case pulp density for feeding pilot scale units would be in the common range for an industrial one, about 400 kgsolid/m³slurry, solid feed rate would sum up to 3.2-6 t/h. These high quantities of material cannot be handled in pilot scale upstream or downstream, for example grinding devices. When feeding pilot units of LIMS with only 0.5 t/h or less, a high flow rate has to be assured to avoid any sedimentation of solid in the course of separation. Because of this fact all pilot plant testwork of LIMS, not only at SGA, are operating with rather low pulp densities. Several processing plants have been built based on SGA’s findings from pilot plant testing and almost all of the values predicted for weight recoveries and grades could be reached.

SGA Studiengesellschaft für Eisenerzaufbereitung GmbH & Co. KG
A7451_NordicIronOre_Blötberget_report.docx 9
Appendix 3.2-2 and Appendix 3.2-3 show the detailed chemical and screen analyses of the
different samples.
62.4 %v/o of Rougher LIMS Feed’s weight was rejected by the MIMS unit (3500 Gauss). These
tailings carried 37.4 %v/o Ferec of the crude ores iron (22.5 % Fetot).5 Hence, it must be concluded
that the assumption that final tailings with sufficiently low Fe content could be rejected by
MIMS was incorrect.
With the first LIMS unit (1000 Gauss) another 3.7 %v/o of weight were rejected, with
19.8 % Fetot, 53.8 % SiO2 and 0.46 % P.
The last rougher LIMS unit (600 Gauss) removed only little weight (0.5 %v/o) but improved the
grade of the magnetite pre-concentrate from 67.2 to 67.9 % Fetot. The tailings from the last
rougher unit contained 31.5 % Fetot, 37.6 % SiO2 and 0.74 % P.
The three tailings combine for magnetite losses of 2.5 %v/o Magn.rec which is a typical value for a
cobber magnetic separation stage.
All recovered tailings were combined and designated as Rougher LIMS Tailings ('Material 1').
As described in Chapter 4, this material was tested for further hematite recovery.
The magnetite concentrate from this process step is designated as Rougher LIMS Concentrate
(‘Material 2’). It was recovered at a weight recovery of 33.4 %v/o based on crude ore (v/o).
Despite that ‘Material 2’ is considered as a pre-concentrate, the grade was already quite high.
The iron content was analysed to 67.9 % Fetot, which calculates to an iron recovery of
60.3 %v/o Ferec. The magnetite content was determined by Satmagan to 90.5 %.
Silica was found at 3.67 % SiO2. The phosphorus content was analysed to 0.070 % P. Titanium
oxide was at 0.10 % TiO2 and Vanadium at 0.050 % V.
The d80-value of Rougher LIMS Concentrate was determined 0.455 mm. The specific surface
was found at 295 Blaine.
The further testwork on Cleaner stage LIMS with Rougher LIMS Concentrate (‘Material 2’) is
described in Chapter 5.
5 The iron recovery (based on crude ore sample) in this report is always calculated as follows:
%�/� !"#$ =%%/&['()*+,-./-+0123-'(4-356(378893('-::+,0:2-9:]·%;#<&<[7,785:-.6(33-:9-'2+4-:7)98-]
%;#<&<[="�>$"?@#�"#ABACDEFE]
The magnetite, silica and Phosphorus recoveries are calculated concurringly.

SGA Studiengesellschaft für Eisenerzaufbereitung GmbH & Co. KG
A7451_NordicIronOre_Blötberget_report.docx 10
4. Rougher stage spiral separation
4.1. Laboratory scale tests with Rougher LIMS Tailings - 'Material 1'
The Rougher LIMS Tailings ('Material 1’) were combined from tailings from Rougher stage
LIMS and represent 66.6 %v/o of crude ore’s weight. Before proceeding to a pilot scale test, the
properties of Rougher LIMS Tailings were investigated in laboratory.
Chemical composition
The chemical composition of this material is given in Appendix 4.1-1.
The iron content was analysed to 24.6 % Fetot, which calculates to an iron recovery of
43.6 %v/o Ferec. 1.1 % of magnetite were determined by Satmagan (2.4 %v/o Magn.rec).
Further 49.7 % SiO2, 0.24 % P, 0.20 % TiO2 and 0.006 % V were determined.
Size distribution and screen metal analysis
Both, the size distribution and a screen metal analysis (size-by-size-assay) are displayed in
Appendix 4.1-2.
The d80-value is calculated to 0.36 mm and the median size to 0.165 mm. Specific density was
determined to 3.20 g/cm³.
The size fraction <0.040mm, which must be considered as difficult to recover by spiral
concentration, represented a mere 11.6 % of the weight, with an iron content of 19.4 % Fetot.
With exception of the >0.5 mm fraction, the iron content decreases and the silica increases for
smaller particle sizes. The content of phosphorus increases distinctly towards the finer. Also
titanium dioxide showed a slight increase. For vanadium no remarkable differences could be
seen for the different particle sizes.
Shaking table test
A shaking table test was performed with ‘Material 1’ to investigate the potential of gravity
separation. For this test a 3.2 m by 1.3 m sized table (Appendix E-8) was used which gave in
many cases a good estimate for a 3-stage spiral configuration (Rougher, cleaner, re-cleaner). The
results for this tests are given in Appendix 4.1-3.1 (weight recoveries and chemical analyses)
and Appendix 4.1-3.2 (size distributions).
In this test, four products were recovered: Concentrate going over the short edge at the end of the
table, Middlings, Tailings 1 and Tailings 2 going over the long edge at the side.

SGA Studiengesellschaft für Eisenerzaufbereitung GmbH & Co. KG
A7451_NordicIronOre_Blötberget_report.docx 11
A very high grade hematite concentrate was generated at a weight recovery of 15.2 % (or
10.1 %v/o based on crude ore). The concentrate was composed of 67 % Fetot (18.6 %v/o Ferec) and
only 0.37 % SiO2. Also the phosphorus content was advantageously low at 0.033 % P, further,
0.31 % TiO2 and 0.011 % V were analysed. As mentioned above, this concentrate would be of
favorable chemical quality and had a typical sizing for sinter concentrates.
A quarter of the feed (16.6 %v/o) was recovered to Middlings which carried with 18.9 %v/o Ferec a
significant portion of the crude ore’s iron (42.8 % Fetot).
47.0 % of the feed or 31.3 %v/o based on crude ore were rejected to Tailings 1. With an iron
content of 4.1 % Fetot, an iron recovery of 3.4 %v/o Ferec were discarded.
Mostly very fine particles were rejected to Tailings 2 (d80-value at 0.041 mm) at a weight
recovery of 12.8 % (8.6 %v/o). Due to the losses of fine sized hematite in this product, the iron
content is with 9.9 % Fetot higher than in Tailings 2. Iron loss is calculated to 2.2 %v/o Ferec.
Sink float analysis
The gravity separation was analysed in a more analytic approach by sink float analysis. The
procedure is briefly described in Appendix E-9, the results are shown in Appendix 4.1-4.
It can be seen clearly that hematite is mostly liberated. The iron content for particles heavier than
3.3 kg/l was at 67.9 % Fetot, silica content was at 1.5 % SiO2. It can be mentioned that 77.7% of
the iron from Rougher LIMS tailings (‘Material 1’) reported to fractions with >3.3 kg/l and
>0.063 mm, which favors recovery in a spiral separation circuit.
The iron content for particles lighter than 2.7 kg/l was at only 1.4 % Fetot.
Both, phosphorus and SiO2, accumulated in the middle density fraction (2.7-3.3 kg/l).
WHIMS – Wet high intensity magnetic separation
A recovery of wet high intensity magnetic separation (‘WHIMS’) was tested on a laboratory
scale. The applied equipment is introduced in Appendix E-10.
As can be seen in Appendix 4.1-5, only a low grade concentrate (55.7 % Fetot, 14.8 % SiO2)
could be generated. Accordingly, it was agreed with client that further investigations in this area
were not warranted.

SGA Studiengesellschaft für Eisenerzaufbereitung GmbH & Co. KG
A7451_NordicIronOre_Blötberget_report.docx 12
4.2. Rougher stage spiral separation - Pilot scale test
For the pilot scale test of rougher stage spiral separation, a set-up of three consecutive spirals
was chosen. The 2nd Spiral B was fed with the concentrate from previous Spiral A, and Spiral C
was fed with the concentrate from Spiral B. The spirals used are introduced in Appendix E-11.
It was agreed with the client to run the pilot scale test of rougher stage spiral separation in two
phases:
1st phase: open spiral circuit rejecting tailings from all spirals (Appendix 4.2-1),
2nd phase: closed spiral circuit rejecting only the tailings from Spiral A (Appendix 4.2-2).
Furthermore, based on the experience that iron losses would occur mainly for smaller sized
particles, it was agreed that the tailings from Spiral A were screened at 0.1 mm. For this, a
Derrick screen DF 120 was used (Appendix E-12).
For Phase 2 with Tailings B and C being recirculated, the slurry density had to be reduced using
a dewatering cyclone (which is mentioned in Appendix E-11 as well). For operational reasons
during Phase 2, the feed (‘Material 1’) had to pass this cyclone, too.
About 3600 kg of Rougher LIMS tailings (‘Material 1’) were to be processed, conveying
66.6 %v/o weight recovery and 43.6 %v/o Ferec iron recovery (based on crude ore). The spiral
circuit was fed at a rate of 1500 kg/h.
After adjusting the spirals’ washing water and splitters for optimum separation with low iron
losses to tailings, a washing water consumption of 3000 l/h was recorded for Spiral A and
1300 l/h each for Spirals B and C.
Phase 1 – Open spiral circuit
After about 30 minutes of stable operation in open circuit (Phase 1), samples were taken for the
three spiral tailings and the concentrate from the last spiral. Appendix 4.2-1.1 gives an overview
on the flowsheet. Appendix 4.2-1.2 and Appendix 4.2-1.3 show the detailed chemical and
screen analyses of the four obtained samples.
The recovered concentrate was analysed to an iron content of 65.9 % Fe. With a weight recovery
of 20.3 %v/o (30.5 % of feed rate), an iron recovery of 35.6 %v/o Ferec is calculated.
The silica content was at 3.49 % SiO2. Further 0.13 % P, 0.30 % TiO2 and 0.01 % V were found.
The size distribution of that concentrate was slightly coarser than the feed (d80-value at
0.397 mm, median size at 0.235 mm).

SGA Studiengesellschaft für Eisenerzaufbereitung GmbH & Co. KG
A7451_NordicIronOre_Blötberget_report.docx 13
The tailings from first Spiral A were determined to a weight recovery of 36.8 %v/o (55.2 % of the
feed). The chemical analysis resulted in 4.4 % Fe and 72.6 % SiO2.
In the other two Spirals B and C, 7.3 % and 2.8 % of the feed were rejected, that is 4.9 %v/o and
1.8 %v/o of the crude ore’s weight, respectively. Iron content was found at 13.0 and 20.7 % Fetot,
silica at 63.2 and 53.9 % SiO2.
A sample from cyclone overflow was not taken at this occasion; the properties were taken over
for balancing from Phase 2’s sampling.
The iron losses from Tailings A to C and cyclone overflow combine for 7.0 %v/o Ferec.
Phase 2 – Closed spiral circuit
After sampling for Phase 1, the set-up was quickly changed for recirculation of Tailings B and C
from the latter two spirals to the feed of Spiral A. Process overview is given in
Appendix 4.2-2.1.
The spirals’ washing water and splitter settings were re-adjusted for minimizing iron losses. The
water consumption of the spirals was finally the same as above (3000/1300/1300 l/h). Well
before exhaustion of the fed ‘Material 1’, samples were taken from the process and analysed for
weight and chemical composition. Appendix 4.2-2.2 and Appendix 4.2-2.3 show the detailed
chemical and screen analyses of the samples.
The Tailings B and C were recirculated at a weight recovery of 7.4 and 4.3 % of feed rate (4.9
and 2.9 % v/o).
The first spiral rejected Tailings A at a weight of 65.4 % or 43.5 %v/o based on crude ore. Iron
content was analysed to 5.4 %, hence iron rejection of 6.3 %v/o Ferec was calculated.
As mentioned above, the iron losses are connected primarily to fine sized particles. Hence
Tailings A were screened on a Derrick screen DF 120 at 0.1 mm with a view to investigate a
scavenger operation with screen underflow.
Tailings A <0.1 mm – screen underflow – were analysed to 9.35 % Fe, hence 4.3 %v/o Ferec of the
crude ore’s iron could be recovered to this middlings product (weight recovery at 26.2 % or
17.5 %v/o). However, with phosphorus content of 0.54 % P a major portion of the crude ore’s
phosphorus accumulated in this product (39.9 %v/o Prec).

SGA Studiengesellschaft für Eisenerzaufbereitung GmbH & Co. KG
A7451_NordicIronOre_Blötberget_report.docx 14
Tailings A >0.1 mm – screen overflow – were recovered at a weight of 39.4 % (26.2 %v/o based
on crude ore). The iron content was only at 3.15 % Fe, which calculates to 2.2 %v/o Ferec. It was
agreed to consider the screen overflow as final tailings.
The dewatering cyclone, which was needed for operational reasons in this pilot scale test,
rejected 4.2 % of the feed (or 2.8 %v/o) together with the unwanted water flow. The iron content
of the solids was analysed to 11. 5 % Fe which is calculated to iron recovery of 0.8 %v/o Ferec.
Again, the P-content is comparably high at 0.48 % P resulting in rather high 5.7 %v/o Prec. This
material could be combined with Tailings A <0.1 mm for scavenger processing.
The concentrate (from Spiral C) was recovered at 30.2 %, that is 20.1 %v/o based on crude ore.
The chemical analysis revealed an already decent grade: The iron was at 66.2 % Fe
(35.4 %v/o Ferec). Silica content of 2.98 % is already lower than in many other sinter concentrates
on the market. phosphorus content, however, is rather high at 0.15 % P and clearly above
favorable levels for blast furnace processing route.
The size distribution of this concentrate was similar to the first one above (d80-value at
0.380 mm, median size at 0.204 mm).
In respect of weight and iron recovery, open and closed circuit spiral operation show similar
results. However, the grade of the concentrate was better in closed circuit operation.
The collected rougher spiral concentrates and middlings from screen underflow and cyclone
overflow were stored for later testwork discussed in Chapters 6 and 7.
Combined rougher stage concentrates
As mentioned above, both concentrates, magnetite concentrate from rougher stage LIMS and
hematite concentrate from rougher stage spirals, have shown a reasonably high Fe grade, fully or
partly suitable for processing in blast furnace route.
For the scenario of a combined product, both concentrates were virtually mixed according to
their respective weight recoveries. This calculation is shown in Appendix 4.2-3.
Again, the iron content calculated to 67.3 % and the silica content of ~3.4 % SiO2 is well on par
or better than many other sinter concentrates on the market.
But the combined P-content of 0.10 % P exceeds the phosphorus levels desired by most
European still mills. These typically prefer concentrates with 0.05 % P or lower to avoid
additional downstream processing costs for P-removal in the steel shop.

SGA Studiengesellschaft für Eisenerzaufbereitung GmbH & Co. KG
A7451_NordicIronOre_Blötberget_report.docx 15
The higher magnetite content of 56.9 % results typically in a reduced productivity, but also in a
reduced coke breeze consumption in the sinter plant.
5. Cleaner stage low intensity magnetic separation
5.1. Laboratory scale tests with Rougher LIMS concentrate - 'Material 2'
The Rougher LIMS Concentrate ('Material 2') was collected from Rougher stage LIMS and
represents 33.4 %v/o of crude ore’s weight. Before proceeding to a pilot scale test, the properties
of Rougher LIMS Concentrate were investigated at laboratory scale.
Chemical composition
The chemical composition of this material is given in Appendix 5.1-1.
The iron content was analysed to 67.1 % Fetot, which calculates to an iron recovery of
59.5 %v/o Ferec. 89.6 % of magnetite were found (98.8 %v/o Magn.rec).
Further 4.82 % SiO2, 0.076 % P, 0.097 % TiO2 and 0.048 % V were determined.
In comparison to the chemical composition of the Rougher LIMS Concentrate sample taken
during pilot test, it can be noticed that the product pile is lower in iron and higher in silica. On
the one hand, such a pile always contain of products from run-up and close-down phases which
sometimes are worse than the steady state product. It is assumed also that the typical margin of
results from sample taking, sample splitting and so added up unfavourably.
Size distribution
The size distribution is listed in Appendix 5.1-2. The d80-value is calculated to 0.40 mm and the
median size to 0.17 mm. Specific density was determined to 4.95 g/cm³.
Bond mill work index
The energy demand in ball mill grinding was estimated for 'Material 2' by performing a Bond
ball mill test at a cut size of 0.1 mm. The Bond mill work index was determined to 20.1 kWh/t.
Detailed results are shown in Appendix 5.1-3, the Bond test equipment is briefly introduced in
Appendix E-13.
Laboratory scale LIMS at 0.100 mm
For receiving an indication on the cleaner stage LIMS (Low Intensity Magnetic Separation),
‘Material 2’ was ground in a laboratory scale rod mill (Appendix E-14) and subsequently

SGA Studiengesellschaft für Eisenerzaufbereitung GmbH & Co. KG
A7451_NordicIronOre_Blötberget_report.docx 16
processed in laboratory scale LIMS unit with 1200 G (“Blue Ribbon”, Appendix E-15). The
results can be seen in Appendix 5.1-4.
The grinding in lab rod mill resulted in a d80-value of 0.101 mm. The ground ‘Material 2’
(Rougher LIMS concentrate) was processed for 3 stages. This methodology typically achieves
concentrates similar to those produced from SGA's pilot scale Finisher LIMS units (at the same
sizing).
At d80 of 0.101 mm and exceptionally high grade magnetite concentrate could be produced, at a
weight recovery of 91.1 % or 30.4 %v/o.
The Fe-content was analysed to 71.39 % Fe, which calculates to an iron recovery of 57.8 % Ferec.
The magnetite content was determined by Satmagan to 98.5 %, this calculates to a magnetite
recovery of 98.9 %v/o Magn.rec.6
The silica content was at only 0.52 % SiO2. Also phosphorus was very low at 0.019 % P.
Titanium dioxide was found at 0.085 % TiO2, vanadium at 0.055 % V.
This concentrate has a very high grade and shall be well suitable for processing in direct
reduction route.
The weight rejection of tailings was at 8.9 % of the feed (3.0 %v/o based on crude ore).
5.2. Cleaner LIMS - Pilot scale test
About 2 t of Rougher LIMS concentrate (‘Material 2’) was processed in pilot scale test of
cleaner stage LIMS.
For this pilot scale test a Derrick screen (Appendix E-12) with a DF 74 screen panel (~0.15 mm)
was used for screening the feed. The screen overflow >0.15 mm was reground in a ball mill with
a net power of 5.5 kW (Appendix E-16).7 The ball mill discharge was recirculated to the screen.
The screen underflow <0.15 mm was separated in 2 LIMS-units at 600 and 500 Gauss, arranged
in series, which are introduced in Appendix E-7 (2 drums counter-current at 600 Gauss; SALA
type) and Appendix E-17 (2 drums counter-current at 500 Gauss; Thune type).
6 This value is higher than for the feed (98.7 % versus 98.9 %v/o Magn.rec). This can be explained by the reduced accuracy of Satmagan for contents close to 100 %. 7 The ball mill rotation was at 72 % Ncritical. The slurry density in the mill was determined to ~1050 kgsolid/m³slurry. This is lower than aspired but a result of minimum slurry flow and the comparably low mill feed (screen overflow).

SGA Studiengesellschaft für Eisenerzaufbereitung GmbH & Co. KG
A7451_NordicIronOre_Blötberget_report.docx 17
Feed rate of Rougher LIMS Concentrate ('Material 2') was set to 542 kg/h in order to adjust
specific grinding energy to 10.1 kWh/t (net power consumption of ball mill was at 5.47 kW).
After reaching steady state, samples were taken and analysed for mass flow, size distribution and
chemical composition. Appendix 5.2-1 gives an overview on the flowsheet. Appendix 5.2-2 and
Appendix 5.2-3 show the detailed chemical and screen analyses of the different samples.
About 69 % of the feed (23 %v/o) reported to the Derrick screen overflow (DF 74, ~0.15 mm).
The screen overflow >0.15 mm with a d80-value of 0.65 mm was ground by ball mill to d80 of
0.066 mm.
Screen underflow <0.15 mm was found slightly coarser than typical for this screen panel. D80-
value was determined by screen analysis to 0.141 mm.
The first LIMS-unit (2 drums, 600 Gauss) removed 8.1 % of the feed (2.7 %v/o based on crude
ore feed). The iron content of these Cleaner 1+2 tailings was at 27.5 % Fe, accordingly
2.0 %v/o Ferec were rejected.
The magnetite content of these tailings was at 11.9 %. This is considered as higher than typical
for this kind of equipment set-up.8 The magnetite rejection is calculated to 1.1 %v/o Magn.rec –
not being untypically high. It is assumed that few factors as for example lower slurry density in
pilot scale operation will not take effect in industrial operation, hence fewer losses are expected.
The concentrate from Cleaner LIMS 1+2 was analysed to 70.4 % Fetot and 1.32 % SiO2.
The subsequent Cleaner LIMS 3+4 rejected another 0.3 % of the feed or 0.1 %v/o based on crude
ore feed. With an iron content of 51.5 % Fetot, an iron rejection of 0.1 %v/o Ferec is calculated.
The magnetite content of 52.7 % results in a rejection of 0.2 %v/o Magn.rec.
Cleaner LIMS concentrate (‘Material 6’) is the final magnetite product from the process and it
was recovered at a rate of 91.6 %, that is 30.6 %v/o of the crude ore feed. The iron content was
analysed at 70.6 % Fetot, which means an iron recovery of 57.4%v/o Ferec. Satmagan determined
93.9 % magnetite; hence a magnetite recovery of 94.8 %v/o Mag.rec is calculated. This overall
magnetite recovery at ~95 %v/o Mag.rec is at a typical level, especially if the high grade is taken
into consideration.
The silica content was analysed to 1.15 % SiO2. Phosphorus content was at only 0.033 % P.
Furthermore, 0.084 % TiO2 and 0.057 % V were found.
8 Many other pilot scale testing using this or similar kind of set-up show – typically at a slightly finer sizing – 2 to 8 % magnetite in these tailings. (The tailings from the subsequent 500 Gauss-unit are again very typical in regard of magnetite content and mass rejection.)

SGA Studiengesellschaft für Eisenerzaufbereitung GmbH & Co. KG
A7451_NordicIronOre_Blötberget_report.docx 18
The screen analysis resulted in a d80-value of 0.131 mm and a median size of 0.052 mm, 31.3 %
of particles smaller 0.025 mm were found. Specific surface was determined to 830 Blaine,
specific density to 5.09 g/cm³.
A pile of about 1750 kg of Cleaner LIMS concentrate (‘Material 6’) were collected,
homogenized and sampled. The full chemical analysis is listed in Appendix 5.2-4, the size
distribution in Appendix 5.2-5.9
The iron content of the product pile was 70.5 % Fetot, the magnetite content was at 93.6 %.
1.31 % SiO2, 0.24 % Al2O3, 0.21 % CaO and 0.21 % MgO combined for the gangue. The LOI
was negative at -3.08 % due to oxidation of magnetite.
Phosphorus was analysed to 0.039 % P, favorably low. All other impurities including 0.002 % S
and 0.036 % Na2O+K2O were satisfactorily low. Titaniumdioxide was found at 0.083 %,
vanadium at 0.054 %.
This magnetite concentrate is of such high grade that it is even eligible for iron making in direct
reduction route. Hence it will be attractive to steel producers as well who are looking to increase
the iron content of the ferrous burden thereby reducing slag volume, reductant rate and
increasing the productivity of the blast furnace. As for every other concentrate, the portion in
sinter mixture will be limited due to sizing in order to avoid detrimental impacts on the sinter
operation such as sinter strength, permeability and production rate.
The d80-value of the product pile was at 0.141 mm, the median size d50 at 0.057 mm. The
specific surface was determined to 965 Blaine. The specific density was at 5.10 g/cm³.
6. Regrinding of rougher stage spiral concentrates
The Rougher hematite concentrate (‘Material 3’) was subjected to a stage of regrinding with the
aim of improving liberation between the hematite and the gangue minerals, apatite in particular
For the pilot scale test, ‘Material 3’ was fed to a Derrick screen (Appendix E-18) which was
equipped with a screen panel DF 74 (0.15 mm). The screen overflow >0.15 mm was reground in
9 A screen metal analysis was requested at a later point in this project, it is listed in Appendix 5.2-6.

SGA Studiengesellschaft für Eisenerzaufbereitung GmbH & Co. KG
A7451_NordicIronOre_Blötberget_report.docx 19
SGA’s small ball mill (Appendix E-19). 10 With the feed rate of 200 kg/h, a specific grinding
energy of 10.0 kW/t is calculated.
Prior to exhaustion of feed material, samples were taken and assessed for size distribution and
mass flow. Appendix 6-1 shows an overview for this pilot scale test and Appendix 6-2 lists the
size distributions.
Based on feed rate, 68.4 % were held back by the screen and directed to the ball mill. The
regrinding reduced the d80-value from 0.42 mm (screen overflow) to 0.078 mm (mill discharge).
The screen underflow, however, was coarser than anticipated and the d80-value at 0.151 mm was
untypically high and not smaller than the opening of the screen. A reason for this might be the
slightly longer than square-shaped slots in the screen panel. An underestimation of the needed
grinding energy was also identified as contributing factor.
For complementing the available information, it was agreed to include a Bond ball mill test with
‘Material 3’. The Bond ball mill was determined to 25.2 kWh/t (cut size 0.1 mm,
Appendix 6-3), about 25 % higher than for the Rougher LIMS Concentrate - 'Material 2'.
7. Scavenger stage processing
As mentioned earlier, an important objective of this test program was to minimize iron losses.
Accordingly, some tests were performed to investigate possibilities for reclaiming additional
magnetite and, in particular, hematite.
7.1. Laboratory scale test with rougher stage spiral tailings
As discussed in Chapter 4.2, Tailings A <0.1 mm (from first rougher stage spiral) were
considered worthwhile for scavenger processing, as they are carrying 4.7 %v/o Ferec of crude
ore’s iron. For this, some explorative laboratory scale tests were performed.
Wet high intensity magnetic separation (WHIMS)
The high intensity magnetic separation was performed in laboratory scale (Appendix E-10), the
test results are listed in Appendix 7.1-1.
10 The ball mill rotation was at 74.3 % Ncritical. The slurry density in the mill was determined to ~1030 kgsolid/m³slurry. This is lower than aspired but a result of minimum slurry flow and the comparably low mill feed (screen overflow).

SGA Studiengesellschaft für Eisenerzaufbereitung GmbH & Co. KG
A7451_NordicIronOre_Blötberget_report.docx 20
About 10 % of the charge were recovered to the WHIMS concentrate which contained
51.7 % Fetot. Accordingly, a good half of the iron could be recovered (52.9 % Ferec,
2.5 %v/o Ferec). Silica content was analysed to 15.3 %. Phosphorus was rather higher at 0.84 % P.
Another 5 % of feed went to middlings with 18.3 % Fetot – 0.4 %v/o Ferec. Almost 85 % of feed
ended up in tailings with 1.8 %v/o Ferec iron losses.
Upstream separation
A hindered settling, or upstream separation, test was carried out on the Tailings A <0.1 mm using
a laboratory scale column, see Appendix E-20. It became apparent during the test that the size
range of the feed material was much too wide for effective separation to occur. Due to the size
effect, no separation could be effected between large, light gangue particles and small, heavy
hematite. Therefore the test was aborted. In Appendix 7.1-2 the mass balance and a photo of the
dried products are shown. It is easy to see by the colors that no significant enrichment had taken
place.
Shaking table test
Further, the Tailings A <0.1 mm were subjected to a shaking table test (Appendix E-8). A
shaking table test typically provides a useful guidance for a material's amenability to spiral
separation. The results are shown in Appendix 7.1-3.1 and 3.2.
As this feed material is rather fine sized and light weighted compared to hematite, the adjusting
range of the splitter between concentrate and middlings turned out to be not sufficient as a
consequence, a small portion of material could not be directed into the concentrate where it
should have gone, but ended up in middlings. Hence it should be kept in mind that weight
recovery of concentrates could have been better. Nevertheless, 6.3 % of feed (1.1 %v/o) were
recovered to concentrate which had a decent grade with 62.2 % Fetot and 5.3 % SiO2, considering
that feed was at 10.1 % Fetot and 66.0 % SiO2. Iron recovery was calculated to 1.8 %v/o Ferec.
Again, the phosphorus content was rather higher at 0.58 % P.
The majority of the feed was recovered to middlings (78.2 % or 13.7 %v/o). Middlings’ iron
content was analysed to 6.1 % Fetot (2.2 %v/o Ferec). Considering that also some of these
6.1 % Fetot had been contributed by material which should have been directed to concentrate (see
remark above), this middlings product must be considered as final tailings.
The tailings from this shaking table test were analysed to 8.0 % Fetot, higher than for the
middlings. With the weight recovery of 15.5 % (2.7 %v/o) the iron loss is calculated to

SGA Studiengesellschaft für Eisenerzaufbereitung GmbH & Co. KG
A7451_NordicIronOre_Blötberget_report.docx 21
0.6 %v/o Ferec. It should be mentioned that the iron losses to this product derive from very fine
sized hematite which is likely to be lost in any processing.
Comparison
Upstream separation did not yield positive results owing to the wide size distribution of the feed
material.
The WHIMS (Wet High Intensity Magnetic Separation) resulted in a higher iron recovery
(2.5 %v/o Ferec) compared to shaking table separation (1.8 %v/o Ferec), but the grade of WHIMS
concentrate was clearly worse (51.7 % Fetot vs. 62.2 % Fetot). Both concentrates showed a
relatively high P-content at 0.84 and 0.58 % P, respectively.
Considering that, as mentioned above, the iron recovery in gravity separation can be expected
slightly better than the reported 1.8 % Fetot and that spirals are much cheaper to purchase and to
operate than WHIMS-units, it was decided that the pilot scale test on scavenging shall be
performed on spirals.
7.2. Iron recovery in scavenger stage
The Cleaner LIMS pilot scale test (Chapter 5.2) was performed in parallel to the laboratory scale
test on scavenger processing described above. It turned out that weight recovery and iron content
of non-magnetics rejected in Cleaner stage LIMS was low, it was therefore agreed that these
cleaner LIMS tails would be better fed into scavenger stage than to process them in cleaner stage
spirals as initially intended. Consequently, the available Tailings A <0.1 mm and Cleaner LIMS
tailings were mixed according to their weight recovery based on crude ore feed for generating
the Scavenger stage feed.
The chemical composition of both components as well as the mixed Scavenger stage feed are
listed in Appendix 7.2-1. Scavenger stage feed represented 20.3 %v/o of crude ore feed with
7.0 %v/o Ferec, it contained 12.9 % Fetot, 62.5 % SiO2 and 0.54 % P.
Due to the low available weight for scavenger stage feed (365 kg) it was not possible to run a full
pilot scale test with three consecutive spirals. It was therefore decided to run this test on a single
spiral which is briefly described in Appendix E-21. Feed rate was adjusted to 1000 kg/h.
The slurry was of more or less uniformly grey colour, which made it impossible to identify clear
borders between better and worse material at the discharge of the spiral, hence the adjustment of

SGA Studiengesellschaft für Eisenerzaufbereitung GmbH & Co. KG
A7451_NordicIronOre_Blötberget_report.docx 22
splitters became uncertain. A photo from the discharge is added to the result table in
Appendix 7.2-2.1.
However, the result of this batch test was significantly worse than that of the previous shaking
table test (which is supposed to be more selective on finest hematite particles). The scavenger
Concentrate 1 was collected through the central outlets into the central column, it was analysed
to (only) 41.0 % Fetot. The weight recovery was 8.7 % (1.8 %v/o). Accordingly, iron recovery is
calculated to 1.9 %v/o Ferec. SiO2 was at 28.1 %
Only a very tiny weight was collected from the inner discharge of the spiral – Concentrate 2 that
contained 32.0 % Fetot and 36.7 % SiO2. Weight was determined to 0.5 % of feed – 0.1 %v/o of
crude ore feed.
Both concentrates were high in phosphorus, 0.94 and 1.35 % P, respectively.
The middlings of this batch test had a chemical composition similar to the feed and were
determined to a weight recovery of 5.9 %, which is 1.2 %v/o. Consequently, the tailings were the
largest product by far with 84.8 % weight recovery (17.2 %v/o). Iron content was at 9.6 % Fetot,
accordingly 4.4 %v/o Ferec were lost.
Appendix 7.2-2.2 lists the size distributions of the products. In summary, this single spiral batch
test could not produce a scavenger concentrate with a sufficient grade; the iron recovery was,
however, on the same level of ~2.0 %v/o as the previous shaking table test. It is conceivable that
three stage spiral operation might improve scavenger concentrates’ grade to a certain degree.
After the insufficient result of the spiral batch test, more laboratory scale tests were performed
with scavenger feed for investigating different approaches.
Screen metal analysis
At first, a screen metal analysis of scavenger stage feed was made to receive information on the
distribution of hematite/iron, it is listed in Appendix 7.2-3.
D80 was at 0.108 mm, median size at 0.068 mm. It also can be seen that iron content increases for
the finer particle sizes – the finer the size fractions, the higher the portion of hematite lost on
rougher spirals.
Phosphorus is distributed more or less evenly between 0.54 % and 0.76 % P, only the largest size
fraction showed a lower content at 0.31 % P.
SGA Studiengesellschaft für Eisenerzaufbereitung GmbH & Co. KG
A7451_NordicIronOre_Blötberget_report.docx 23
Sink float analysis
The sink float analysis should investigate the grade of liberation or dissemination, hence whether
a gravity separation can be successful at all.
As can be seen in Appendix 7.2-4, all products with a density of >3.3 kg/l display high iron
contents (67.5-68.1 % Fetot) and low silica contents (0.9-1.8 % SiO2); vice versa, the products
with density <2.7 kg/l were low in iron (0.5-2.2 % Fetot) and very high in silica (75.0-
81.3 % SiO2). The >3.3 kg/l fractions also displayed comparatively high levels of
titaniumdioxide, 0.45-0.72 % TiO2.
However, only a low portion of 5.6% (by weight) of the fraction -1+0.1mm of the scavenger feed
were found in the >3.3 kg/l product, hence potentially recoverable.
It can be concluded that in the previous scavenger test the gravity separation did not succeed
despite a fully sufficient liberation, probably because of larger silicate particles interfering with
the smaller hematite. Furthermore, it can be noticed that the majority of phosphorus accumulates
in the 2.7-3.3 % kg/l density fraction.
Silica flotation
Also the applicability of silica flotation was tested, results are displayed in Appendix 7.2-5. The
lab flotation cell is introduced in Appendix E-22.
After four stages of flotation with Flotigam EDA, only a twentieth of charged feed had remained
in the cell. Iron content was at only 25.8 % Fetot.
It must be concluded that silica flotation is no option for scavenger processing.
Upstream separation after screening
Based on findings from screen metal analysis (Appendix 7.2-3), it was decided that screening of
scavenger stage feed to <0.040 mm would remove more weight than iron and that a more narrow
size distribution could improve performance in upstream separation (hindered settling). This was
tested with a 1 kg-sample, the results are listed in Appendix 7.2-6.1 for the first step of
screening and in Appendix 7.2-6.2 for upstream separation.
The screen underflow <0.40 mm (22.5 % / 4.6 %v/o weight recovery) contained 30.5 % Fetot and
carried 3.7 %v/o Ferec.
The concentrate from upstream separation was determined to a weight recovery of 1.6 %v/o. Iron
content was analysed to 54.8 % Fetot, which means an iron recovery of 2.4 % Ferec. Silica was at

SGA Studiengesellschaft für Eisenerzaufbereitung GmbH & Co. KG
A7451_NordicIronOre_Blötberget_report.docx 24
14.7 % SiO2. The phosphorus content was with 0.40 % P lower than for most of the other
concentrates discussed in this chapter.
Summary
Summarizing all tests on scavenger operation within this chapter, it can be concluded that
producing a scavenger concentrate with iron content on the level of 50-55 % Fetot is possible, up
to 2.5 %v/o Ferec could be recycled.
Silica flotation showed very little potential and is there not recommended to be pursued.
The option to charge such scavenger concentrate directly to apatite flotation or to mix it to the
final product was also discussed with client. Since the scavenger concentrate is only a minor
contribution, it may be blended, if necessary and possible, with the other concentrates to obtain a
blend with acceptable iron and phosphorus contents.
For the subsequent stages of this testwork program, it was decided that no products from the
scavenger testwork would be recycled, mainly because the concentrate available from spiral
batch test was too low in iron (41 % Fetot) to be of advantage and too low in weight (1.8 %v/o) to
have a significant impact on testwork.

SGA Studiengesellschaft für Eisenerzaufbereitung GmbH & Co. KG
A7451_NordicIronOre_Blötberget_report.docx 25
8. Cleaner stage spiral separation
8.1. Laboratory scale tests with Reground rougher spiral concentrate
- 'Material 6'
As mentioned above, it was decided that only Reground rougher spiral concentrate
(‘Material 6’) was to be processed in cleaner stage spiral separation. A set of exploratory
laboratory tests was undertaken ahead of the pilot test testwork. These are described in detail
below.
Chemical composition
Appendix 8.1-1 lists the full chemical analysis of ‘Material 6’.
Iron was analysed to 66.2 % Fetot, magnetite was at 1.6 %. The gangue was composed of
3.04 % SiO2, 0.61 % Al2O3, 0.55 % CaO and 0.20 % MgO.
Phosphorus content was at 0.149 %, TiO2 was found at 0.30 % and vanadium at 0.010 %.
All other impurities measured were favorably low.
Screen metal analysis
As shown in Appendix 8.1-2, d80-value was calculated to 0.148 and median size to 0.072 mm.
The specific surface was determined at 780 Blaine. Specific density was at 5.07 g/cm³.
If the small fraction of largest particles 3.4 % >0.2 mm was disregarded, a clear trend for
increasing iron content and decreasing silica content towards the finer could be found (64.4-
67.9 % Fetot, 1.47-5.0 % SiO2).
The size fractions 18.8 % 0.063-0.1 mm and 38.1 % 0.1-0.2 mm carried the majority of
phosphorus. For the finer size fraction, P-content decreases from 0.088 to 0.053 % P.
TiO2 and V are more or less evenly distributed.
Shaking table test
The results of shaking table test with Reground rougher spiral concentrate are given in
Appendix 8.1-3.1 and -3.2.
Approximately two thirds of the feed were recovered to Concentrates 1 and 2 (10.7 %v/o +
2.0 %v/o). The concentrates combine for an iron recovery of 23.3 %v/o Ferec.

SGA Studiengesellschaft für Eisenerzaufbereitung GmbH & Co. KG
A7451_NordicIronOre_Blötberget_report.docx 26
Especially the Concentrate 1, which was recovered over the short edge at the end of the table
(see photo in Appendix E-8, revealed a very high grade with 69.2 % Fetot, 0.16 % SiO2 and
0.020 % P.
The Concentrate 2 from the far end of the long table edge was analysed at 66.2 % Fetot,
2.46 % SiO2 – still a favorable grade. The phosphorus content was, however, higher at 0.26 % P.
The middlings (16.7 % of feed, 3.3 %v/o of crude ore) were at 55.1 % Fetot (4.9 % Ferec.). Silica
was analysed to 14.15 % SiO2, phosphorus to 0.58 % P.
With 20 % (4.0 %v/o) of tailings produced at 66.4 % Fetot it could be anticipated that high iron
losses from small sized hematite were to be expected. The iron losses for these tailings were
calculated to 7.1 %v/o Ferec. Furthermore, 3.13 % SiO2 and only 0.080 % P were analysed,
indicating again that these tailings contain mainly fine sized hematite losses.
Based on the same assumption, middlings were screened for a visual assessment whether the iron
accumulates in the finer size fractions. The size distribution of middlings is listed in
Appendix 8.1-3.2.
Sink float analysis
A sink float analysis of ‘Material 6’ revealed, as can be seen in Appendix 8.1-4, for both tested
size fractions that particles with a density >3.3 kg/l were made of rather pure hematite with
0.3 % SiO2 and 0.023-0.036 % P.
Only low or negligible amounts of particles with low density <2.7 kg/l were detected.
For particles with density between 2.7 and 3.3 kg/l the iron content was determined at 62.3 and
55.4 % Fetot, respectively. Phosphorus was at 0.87 and 0.57 % P.
8.2. Cleaner stage spiral separation - Pilot scale test
For the pilot scale test of cleaner stage spiral separation, the set-up of three consecutive spirals
known from rougher stage pilot’s Phase 2 was chosen. The second Spiral E was fed with the
concentrate from previous Spiral D, and third Spiral F was fed with the concentrate from
Spiral E. The Tailings from Spirals E and F were recirculated to Spiral D after passing a
dewatering cyclone. Tailings from Spiral D and cyclone overflow were discharged to individual
thickening cones. Spirals and dewatering cyclone are introduced in Appendix E-11.
SGA Studiengesellschaft für Eisenerzaufbereitung GmbH & Co. KG
A7451_NordicIronOre_Blötberget_report.docx 27
About 900 kg of Reground rougher spiral concentrate (‘Material 6’) were to be processed,
conveying 20.1 %v/o weight recovery and 35.4 %v/o Ferec iron recovery (based on crude ore). It
was fed at a rate of 1500 kg/h.
After adjusting the spirals’ washing water addition and splitters for optimum separation with low
iron losses to tailings, the washing water consumption of 2500 l/h was recorded for Spiral D and
1300 l/h each for Spirals E and F.
Well before exhaustion of the fed ‘Material 6’, samples were taken from the process and
analysed for weight and chemical and physical properties. Process overview is given in
Appendix 8.2-1, detailed chemical and screen analyses of the samples are shown in
Appendix 8.2-2 and Appendix 8.2-3.
The Tailings E and F were recirculated at a weight recovery of 7.7 and 2.7 % of feed rate (1.5
and 0.5 % v/o), respectively.
The first spiral rejected Tailings D at a weight of 21.2 % or 4.3 %v/o based on crude ore. Iron
content was analysed to 63.27 %, hence iron losses were high at 7.2 %v/o Ferec.
Silica was analysed to 6.24 % SiO2. The P-Content was comparably low at 0.110 % P.
The dewatering cyclone, which was needed for operational reasons in this pilot scale test,
rejected 7.2 % of feed (or 1.4 %v/o) together with the unwanted water flow. Iron content of solids
was analysed to 66.62 % Fetot which is calculated to iron recovery of 2.6 %v/o Ferec. Again, the P-
content is comparably low at 0.077 % P.
The concentrate (from Spiral F) was recovered at 71.6 %, that is 14.4 %v/o based on crude ore.
The chemical analysis revealed an iron content of 66.85% Fetot (25.6 %v/o Ferec). Silica content
was reduced to 2.14 %, again lower than in many other sinter concentrates on the market.
Phosphorus content, however, was increased by 0.04 to 0.190 % P (11.6 %v/o Prec) and clearly
above favorable levels for blast furnace processing route.
As can be seen in Appendix 8.2-3, Tailings D and Cyclone overflow were very fine sized with
d80-values of 0.036 and 0.021 mm, respectively.
As mentioned above, the iron losses are connected primarily to fine sized particles. To receive
more information on that, Tailings D, Cyclone overflow as well as recirculated Tailings E and F
were assayed in screen metal analyses which are listed in Appendices 8.2-4 to 7. For all four
(intermediate) products can be seen that the size fractions smaller 0.040 mm are low in SiO2
and P.

SGA Studiengesellschaft für Eisenerzaufbereitung GmbH & Co. KG
A7451_NordicIronOre_Blötberget_report.docx 28
About 550 kg of Cleaner spiral concentrate (‘Material 7’) were collected. The full chemical
analysis and a screen metal analysis are given in Appendix 9.1-1 and -2, they are discussed in
Chapter 9.1.
8.3. Iron recovery from Cleaner spiral tailings
As discussed above, high losses of iron occur on small sized particles. For investigating this two
scenarios of screening off fines are calculated.
Scenario of screening Reground rougher spiral concentrate (‘Material 6’) at 0.040 mm
In Appendix 8.3-1 is calculated (based on screen metal analysis of Reground rougher spiral
concentrate (‘Material 6’), Appendix 8.1-2) what kind of product would be generated if the feed
to the spirals was screened at 0.040 mm.
The virtual screen underflow is calculated to 67.9 % Fetot, 1.5 % SiO2 and only 0.063 % P. This
concentrate would not necessarily need apatite flotation; in all other aspects this would be
suitable for iron making.
This product would represent 9.2 %v/o of the crude ore’s weight and 16.6 %v/o Ferec of the iron. It
could even be used for iron making in direct reduction (‘DR’) route.
Another advantage of this scenario is that the operation of cleaner spirals will be much easier and
iron losses also will decrease significantly. Possibly even the rejection of apatite already on
spirals might improve.
Scenario of screening Tailings D at 0.063 mm
For the next scenario shown in Appendix 8.3-2, the Tailings D are virtually screened at
0.063 mm (based on respective screen metal analysis given in Appendix 8.2-4).
With this, only 6.1 % of the Tailings D weight was rejected to the screen overflow >0.063 mm,
but the grade would improve distinctly. Silica was reduced from 6.2 to 2.7 % SiO2, iron
increased from 63.7 to 66.6 % Fetot. Also phosphorus decreased to 0.084 % P. Despite these clear
improvements, the iron losses were at only 0.1 %v/o Ferec.
Laboratory scale screening of Tailings D at 0.040 mm and upstream separation
As the first scenario was not available any more after the cleaner spiral pilot test has been
performed, the second scenario was investigated further in laboratory scale. At first, Tailings D
were screened at 0.040 mm. Appendix 8.3-3.1 displays this on a calculatory basis.

SGA Studiengesellschaft für Eisenerzaufbereitung GmbH & Co. KG
A7451_NordicIronOre_Blötberget_report.docx 29
The screen underflow <0.040 mm is calculated to a weight recovery of 89.2 % (3.8 %v/o) and a
chemical composition with 66.9 % Fetot, 2.3 % SiO2 and 0.075 % P.
The screen underflow <0.040 mm was subsequently tested in laboratory scale upstream column
(Appendix E-20), the results are shown in Appendix 8.3-3.2.
The upstream water flow was increased in three stages from 0.40 over 0.62 to 2.64 mm/s with
overflow from each stage collected separately.
With the first two stages at comparably low water velocity, 8.2 % of screen underflow has been
removed. By this a decrease to ~1.6 % SiO2 and ~0.06 % P is calculated (in the lower part of the
table). Iron recovery at that point would be at 6.3 %v/o Ferec (~67.7 % Fetot).
With the third stage at higher upstream, 58.9 % of the fed Tailings D <0.040 mm has been
rejected. By this, the grade of the sediment/concentrate improved to (analysed) 68.4 % Fetot,
1.04 % SiO2 and 0.046 % P. But the iron losses would increase significantly to 4.0 % Ferec.
With some more tests an optimum upstream water velocity could be found, somewhere in
between 0.6 (Stage 2) and 2.6 mm/s (Stage 3), that would enable a good compromise between
iron losses and recovered concentrate grade.
Pilot scale screening Tailings D at 0.053 mm
Before the subsequent pilot scale flotation it was agreed to perform the iron recovery from
Tailings D by screening with a Derrick screen panel DF200 (0.053 mm). The mass balance and
chemical analysis for this pilot scale batch test are shown in Appendix 8.3-4.1, screen analysis
in Appendix 8.3-4.2.
With screen overflow – Tailings D >0.053 mm – 9.2 % of the feed (0.4 %v/o) were rejected. With
an iron loss of 40.7 % Fetot, 0.4 %v/o Ferec is calculated.
With screen underflow – Tailings D <0.053 mm – 90.8 % weight was recovered. D80-value was
determined at 0.036 mm, specific surface at 1160 Blaine. The iron content was analysed at
66.1 % Fetot, hence the iron recovery was at 6.8 % Ferec. Furthermore, the chemical analysis
resulted in 3.49 % SiO2 and 0.099 P.
The collected screen underflow should be recycled and combined for pilot scale flotation with
concentrate and cyclone overflow from Cleaner spiral pilot scale test.

SGA Studiengesellschaft für Eisenerzaufbereitung GmbH & Co. KG
A7451_NordicIronOre_Blötberget_report.docx 30
9. Flotation for apatite removal
The Blötberget ores contain a certain amount of apatite, a phosphorus bearing mineral, which
tends to concentrate in the hematite processing line. The phosphorus content should be as low as
possible for iron making due to inherent processing costs caused by downstream P-removal in
steel shop. P-content in iron ores is preferred at 0.04 % P or lower. However, it should be noted
that may Brazilian and Australian ores exceed these levels, and in consideration of the generally
increasing P-content of iron ore supplies, a P-content of 0.05 % will likely find acceptance on the
market.
The apatite removal during this project was performed by flotation using AkzoNobel’s collector
Atrac 1563.
9.1. Laboratory scale flotation tests for apatite removal
The initial phase of laboratory scale flotation tests was performed with Cleaner spiral
concentrate (‘Material 7’), the chemical analysis of the collected product pile is given in
Appendix 9.1-1.
Iron was analysed to 66.7 % Fetot. The silica content was with 2.45 % SiO2, 0.3 points higher
than in the sample taken during pilot scale test. Gangue was composed also from 0.54 % Al2O3,
O.6 % CaO and 0.19 % MgO. Phosphorus content was analysed to 0.175 % P. Furthermore
0.33 % TiO2 and 0.011 % V were found. All other impurities were on favorably low levels.
The size distribution and screen metal analysis are given in Appendix 9.1-2. D80 was determined
to 0.166 mm, median size to 0.099 mm. Specific surface was at 780 Blaine, specific density at
5.07 g/cm³.
The screen metal analysis shows that silica is carried mainly by particles >0.063 mm and super
fines <0.025 mm. The same is true for phosphorus. TiO2 and V are more or less evenly
distributed.
Regarding apatite flotation, the following generalization for reagent regime and flotation
procedure can be given:
- Initial conditioning with 500 g/t water glass (sodium silicate) for supporting desagglo-
meration,
- pH-value was never adjusted, it was raised though by sodium silicate addition to ~9.0 pH,
- 1st addition of apatite collector (~100 g/t Atrac 1563 from AkzoNobel) with conditioning,

SGA Studiengesellschaft für Eisenerzaufbereitung GmbH & Co. KG
A7451_NordicIronOre_Blötberget_report.docx 31
- 1st flotation stage after frother addition (30 g/t MIBC)11,
- 2nd addition of apatite collector (~50 g/t Atrac 1563), for most tests also some conditioning
time was given,
- 2nd flotation stage after frother addition (30 g/t MIBC).
The actual flotation procedure is given in detail in the respective result table for each test.
The laboratory scale tests were performed in a 1 l flotation cell which is introduced in
Appendix E-22.
The initial laboratory test, Test #A1, was carried out very early on in the programme using a
sample of reground rougher spiral concentrate as feed material. At that point only Reground
rougher spiral concentrate (‘Material 6’) was available. The main objective of this test was to
develop an early understanding of the amenability of the hematite concentrate to flotation.
Reagent regime and test procedure were selected on the basis of previous flotation testwork with
Blötberget ore and best industry practice. The results are shown in Appendix 9.1-3. The
procedure given in the upper part of result table summarizes, besides water glass conditioning,
the total addition of 150 g/t apatite collector (Atrac 1563), and 60 g/t frother (MIBC). The
cumulated flotation time was 5.5 minutes.
The flotation concentrate was recovered from flotation cell at 96.2 % weight recovery
(13.9 %v/o). The phosphorus content of this concentrate was analysed to only 0.024 % P.
It can be seen in the calculations on the bottom part of Appendix 9.1-3 that already three
quarters of the phosphorus had been removed after the third stage of flotation (3.5 min) and the
concentrate would have a satisfactory P-content of ~0.03 % P.
3.8 % (0.5 %v/o) of the weight was rejected with the froths. The iron losses to rejected froths
were rather low at 0.2 %v/o Ferec after third stage and at 0.8 %v/o Ferec after the entire test. The
concentrate’s iron content was at 66.5 % Fe.
The silica content was analysed to 3.35 % SiO2, about 0.3 points higher than the feed. This is
caused by two effects which are also valid for other flotation tests in this project: The removed
froths are low in silica (the Atrac collector did not show any affinity towards quartz or silicates),
hence the recovered concentrate must increase in silica content, and 500 g/t water glass addition
(sodium silicate) add also a small amount of silica and sodium to the concentrate.
The following Test #A2 to #A5 used Cleaner spiral concentrate (‘Material 7’) as feed.
11 MIBC is the abbreviation for methyl isobutyl carbinol (IUPAC name: 4-Methyl-2-pentanol).

SGA Studiengesellschaft für Eisenerzaufbereitung GmbH & Co. KG
A7451_NordicIronOre_Blötberget_report.docx 32
For the next Test #A2 the flotation time was reduced to 2.5 minutes, the collector addition was
slightly increased to 165 g/t and frother was added only once.
As can be seen in Appendix 9.1-4, this resulted in a concentrate with only 0.017 % P
(~0.075 % P after the first stage of 1.5 min). Iron losses were calculated to 1.0 %v/o Ferec. Weight
rejection was at 4.7 % (0.7 %v/o).
For Test #A3 the flotation procedure was divided into smaller increments: After a first flotation
stage of 1.5 min applying 60 g/t Atrac 1563, three more stages of 1.0 min and 20 g/t Atrac 1563
addition each followed. 20 g/t MIBC (frother) was given twice before first and third flotation
stage. This is also shown in Appendix 9.1-5.
The weight rejection to froths was only at 1.5 % (0.2 %v/o). The phosphorus removal is more or
less constant for the first three stages (2.2-3.1 %v/o Prec).
The concentrate produced was analysed to 0.037 % P. The loss of iron was extraordinarily low at
0.1 %v/o Ferec.
The flotation procedure should be consolidated for Test #A4 to only two flotation stages with
50 g/t Atrac 1563 and 1.5 min flotation time each. Frother addition was at 60 g/t in total.
The results from this test are shown in Appendix 9.1-6. However, the decrease of collector
addition resulted in a worse P-removal, the recovered concentrate was analysed to 0.081 % P.
The weight of the froths was at 1.1 % (0.2 %v/o). Accordingly, the iron loss was low at
0.1 %v/o Ferec.
The fifth Test #A5 investigated apatite flotation in a single flotation stage (2.0 min, 100 g/t
Atrac 1563, 30 g/t MIBC). As can be seen in Appendix 9.1-7 and quite similar to the previous
test, 0.2 %v/o of the weight and 0.1 %v/o Ferec of the iron were rejected. The concentrate was
analysed to 0.078 % P.
The initial conditioning was performed at a higher slurry density than before (55.6 instead of
previously used 35.7 % solids). An effect from the higher slurry density during conditioning
could not be noticed.
Summarizing the previous laboratory scale flotation tests, a consumption of >100 g/t Atrac 1563
(collector) with >50 g/t MIBC (frother) and a flotation time of 3 minutes appeared most
effective.

SGA Studiengesellschaft für Eisenerzaufbereitung GmbH & Co. KG
A7451_NordicIronOre_Blötberget_report.docx 33
9.2. First pilot scale flotation test for apatite removal
As discussed in Chapter 8.3, Tailings D <0.053 mm and cyclone overflow from cleaner spirals
should be recycled for reducing iron losses. Accordingly, these two middlings were combined
with Cleaner spiral concentrate (‘Material 7’) according to their respective weight recovery.
The combination of these three intermediate products, representing 19.7 %v/o weight of the crude
ore, was fed to pilot scale flotation test.
However, it was agreed with the client to allow a small deviation from the calculated feed
composition (increase of proportion of cleaner spiral concentrate from theoretical 73 % 74.8 %)
in order to maximize the material available for flotation. This is displayed together with the
chemical analysis of Flotation feed in Appendix 9.2-1.
Flotation feed was analysed to 66.5 % Fetot which calculates to an iron recovery of
34.9 %v/o Ferec. Silica was at 2.72 % SiO2. Phosphorus was found at 0.157 % P. 0.31 % TiO2 and
0.010 % V are again on the known level.
The pilot flotation test set-up was discussed and mutually agreed with the client.
Appendix 9.2-2 gives an overview of the first pilot scale flotation test, Appendix 9.2-3 provides
some details of the actual flotation procedure.
For operational reasons (required minimum slurry flow vs. available feed/test time), the slurry
density had to be decreased to 24.2 % solids.
The initial conditioning with water glass (sodium silicate) was performed in an agitated vessel
(Appendix E-23) for a retention time of 9.6 min.
For the flotation, all six pilot flotation cells were applied, they are briefly introduced in
Appendix E-24.
According to general industry practice, the retention (or flotation) time was increased by a factor
two at pilot scale (Note: the retention time for was rounded up due to volume of pilot flotation
cells).
The initial addition of apatite collector Atrac 1563 was at 100 g/t. The collector was conditioned
for 6.0 min (in two of the larger cells with agitation, but no air injection).
It followed the first flotation stage with 3.0 min retention time. Frother MIBC was added at
30 g/t to the cell’s inlet.

SGA Studiengesellschaft für Eisenerzaufbereitung GmbH & Co. KG
A7451_NordicIronOre_Blötberget_report.docx 34
The second flotation stage followed without conditioning where another 50 g/t Atrac 1563 and
30 g/t MIBC were added to the flotation cell’s inlet. The second flotation stage was performed in
three smaller cells which combine for a retention time of 3.6 min.
No pH-adjustment was applied, pH increased to 8.6 as a consequence of water glass addition and
then decreased to 8.2 during the process.
Both, the removed froths and the recovered concentrate were collected in settling cones.
Before exhaustion of flotation feed, samples of Froth 1 (1st stage), Froth 2 (2nd stage) and
concentrate were taken. Chemical compositions and balances are displayed in Appendix 9.2-4,
size distributions of feed and concentrate are listed in Appendix 9.2-5.
The rejected froths were both low in weight and phosphorus content, especially when compared
to the results of the laboratory testwork. Microscopic inspection of the concentrate suggested that
the selectivity towards apatite in the first pilot test was far less than optimum.12
More important, the P-content of the concentrate was analysed to 0.139 % P, only 0.018 points
lower than the feed.
Hence, the first pilot scale flotation must be considered as failed. It was concluded at the time
that the feed material was very probably too coarse for effective flotation to occur. This view
was supported by the following observations: The slurry flow was not able to transport all of the
feed out of the flotation cells, a considerable amount of residual material was found in the cells
upon completion of the test. Also, as mentioned above, larger greenish particles could not be
found under microscope in froths samples, contrary to previous laboratory scale tests’ froths.
Last but not least, a screen metal analysis of the recovered flotation concentrate (see
Appendix 9.2-6) shows that the P-content in the size fractions >0.063 mm could not be lowered
sufficiently.
9.3. Laboratory scale tests for apatite removal
A series of laboratory flotation was undertaken to investigate further the cause of the
unsatisfactory pilot scale flotation testwork. Test #A6 repeated the pilot flotation procedure in
laboratory scale (including the use of 1:2 retention time ratio between laboratory and pilot scale)
with flotation concentrate from first pilot scale test. The results are shown in Appendix 9.3-1.
12 The color of apatite is transparent-to-translucent/green/sometimes yellow, described here as “greenish”. This matches with many particles known from microscopic surveys in binocular during this project that are consequently suspected as apatite.

SGA Studiengesellschaft für Eisenerzaufbereitung GmbH & Co. KG
A7451_NordicIronOre_Blötberget_report.docx 35
In this laboratory scale test, the phosphorus content decreased to 0.057 % P already after the first
flotation stage (1.5 min) –from an initial 0.130 % P. The concentrate was analysed after the
second flotation stage (another 1.5 min) to 0.033 % P.
Hence two conclusions can be drawn from this test: First, the phosphate minerals (apatite)
respond to the applied reagent regime and process conditions - at least in laboratory scale. And
second, another flotation can be done on the flotation concentrate from first pilot scale test.
To investigate the effect of particle size upon the flotation performance, a further two laboratory
tests were performed after regrinding the flotation concentrate from first pilot scale test (d80-
value of 0.152 mm).
For Test #A7, the flotation concentrate was ground for 10 min in lab rod mill resulting in a d80-
value of 0.12 mm. The results of lab flotation test with this reground feed are shown in
Appendix 9.3-2.
Using the same flotation procedure but finer sizing, the P-content in concentrate decreased to
0.026 % P (compared to 0.033 % P in Test #A6’s concentrate). Weight and iron rejection
increased only very slightly and were based on crude ore feed on the same level at 0.3 %v/o and
0.4 %v/o Ferec, respectively.
For Test #A8, the feed size was decreased further by subjecting the pilot flotation concentrate to
25 min of regrinding using a laboratory rod mill. The d80-value was determined as 0.083mm. The
laboratory scale flotation Test #A8 is shown in Appendix 9.3-3.
Test #A8 produced a concentrate with a P-content of only 0.011 % P. The iron content was
analysed to 66.9 % Fetot which means an iron recovery of 33.8 % Ferec. Weight and iron losses
were still satisfactorily low albeit slightly higher than observed in tests #A6 and #A7. There is
clear evidence of a slight increase in losses as the particle size of the feed decreases.
9.4. Second pilot scale flotation test for apatite removal
On the basis of the findings of laboratory tests #A6-A8, it was mutually agreed to undertake a
further pilot flotation test using the conditions of Test #A8, i.e. aim for a feed with a d80 of
~0.080mm. This test was fed with recombined products from the first, failed pilot test.
As can be seen in Appendix 9.4-1, the product piles of concentrate and froths as well as the
remainders recovered from the cells were recombined in a proportion aiming to match the
chemical composition of first test feed as closely.

SGA Studiengesellschaft für Eisenerzaufbereitung GmbH & Co. KG
A7451_NordicIronOre_Blötberget_report.docx 36
The recombined feed was reground before processing by flotation using SGA's HIG tower mill,
it is introduced in Appendix E-25. To avoid overgrinding, and specifically to minimise the
increase in ultrafine particles <0.040mm, the HIG tower mill was run out of high efficient
conditions. Therefore the grinding media charge was decreased from the typical 60% to 25% of
the mill volume and it was shifted slightly to a coarser than typical size distribution. As main
measure for removing finer sized particles from the HIG tower mill, slurry flow rate was
increased to 12 l/min (720 l/h). Accordingly the slurry density quite low at 417 kgsolid/m³slurry.
The mill is supposed to reach static state after 3-4 retention times (6-8 min). For adjusting the
needed grinding energy (by changing rotational speed), samples of mill discharge were taken
very early during the test and assessed for size distribution These samples displayed d80-values in
line with expectations, 0.080-0.095 mm.
Specific grinding energy was finally determined to 10.1 kWh/t. The mill was operated in open
circuit in line with the subsequent flotation plant. Water was added to the mill charge to adjust
the slurry flow; this resulted in an average 27.2 % solids in the feed to flotation.
The process overview is given in Appendix 9.4-2, details on flotation are listed in
Appendix 9.4-3.
The process conditions of the second pilot flotation tests followed in essence those of the first
test: Initial addition of apatite collector Atrac 1563 at 100 g/t with conditioning for 6.0 min (in
two flotation cells with agitation, but no air injection). Followed by the first flotation stage with
3.0 min retention time, frother MIBC was added at 30 g/t to the cell’s inlet. The second flotation
stage followed without conditioning, another 50 g/t Atrac 1563 and 30 g/t MIBC were added to
the flotation cell’s inlet. The second flotation stage was performed in three cells which combine
to a retention time of 3.6 min.
Prior to exhaustion of recombined flotation feed, samples were taken. The chemical analyses and
mass balances are shown in Appendix 9.4-4, size distributions in Appendix 9.4-5.
It must be noted that the size analysis of mill discharge resulted in a coarser sizing than
anticipated by earlier ‘check’ samples and coarser than targeted. D80 was calculated to
0.106 mm. The median size d50 was at 0.057 mm, hence at the very minimum, overgrinding of
the flotation feed was avoided.
The flotation removed 1.3 % (0.3 %v/o) of the weight with Froth 1 and another 0.3 % (0.1 %v/o)
with Froth 2. The P-content (5.6 % and 4.1 %) of these froths as well as their weight were not as
high as in the previous laboratory scale tests. The iron loss was calculated to 0.5 %v/o Ferec.
SGA Studiengesellschaft für Eisenerzaufbereitung GmbH & Co. KG
A7451_NordicIronOre_Blötberget_report.docx 37
As a result, the P-content of the concentrate sample again fell short of those achieved in the
previous laboratory tests, #A6-A8. The chemical analysis resulted in 0.083 % P. Although this
result is already a considerable improvement over the first pilot test, this phosphorus content is
above desired levels for iron making.
98.4 % of the feed (19.4 %v/o) were recovered as flotation concentrate.
The concentrate’s iron content was analysed to 66.4 % Fetot (34.3 %v/o Ferec), silica content to
2.92 % SiO2. Besides, 0.31 % TiO2 and 0.010 % V were found. Evidently, the apatite removal in
the second pilot flotation test was still far less than optimum. Screen metal analyses of the mill
discharge (i.e. feed to second pilot flotation) and the flotation concentrate, given in Appen-
dices 9.4-6 and -7, show that the P-content in the finer sized fractions was reduced sufficiently,
however not in the coarser ones.
Another laboratory scale Test #A9 was performed on a subsample of the feed to the second pilot
flotation to confirm also that insufficient P-reduction is mainly caused by froth behaviour in pilot
scale and not by insufficient liberation of the apatite from the iron oxide minerals. The flotation
procedure replicated exactly the one from pilot scale testing, that means that also the slurry
density was lower at 27.1 % solids and that the second Atrac conditioning was omitted. The
results are shown in Appendix 9.4-8.
The phosphorus content of the concentrate was at 0.022 % P, as could be expected well in
between the previous Tests #A7 and #A8 with coarser and finer sizing, respectively.
The iron losses in Test #A9 were very much higher when compared to all previous tests.13
The difficulties in transition from laboratory scale to pilot scale were discussed with experts
from AkzoNobel, the supplier of Atrac 1563. They confirmed the suspicion that the structural
strength of the froth is not sufficient to lift larger particles for more than a lab cell's overflow.
AkzoNobel’s reference application on industrial apatite flotation of iron ore (a Swedish
Magnetite) is performed at much finer size – pelletizing fineness. Some alternative reagents were
proposed with the aim of achieving a stronger froth structure. However, there was insufficient
time and sample to investigate this issue further.
375 kg of flotation concentrate product pile were recovered from the test. This product pile is
designated as Flotation Hematite Concentrate (‘Material 8’).
13 This couldn’t be followed up due to constrains in time and available sample. It is assumed that this was caused by the presence of superfine limonite particles which formed during drying of the mill discharge sample..

SGA Studiengesellschaft für Eisenerzaufbereitung GmbH & Co. KG
A7451_NordicIronOre_Blötberget_report.docx 38
The full chemical analysis of that final concentrate is listed in Appendix 9.4-9. Iron content was
at 66.45 % Fetot. Magnetite content was determined by Satmagan to 1.7 %. The gangue was
composed of 3.0 % SiO2, 0.6 % Al2O3, 0.4 % CaO and 0.2 % MgO.
Phosphorus content of the product pile was analysed to 0.096 % P.
Sodium oxide was increased and analysed to 0.091 % Na2O, probably by water glass
conditioning.
All other analysed impurities were on a preferably low level, including 0.008 % S, 0.020 % K2O
and 0.015 % Mn. The contents of titanium dioxide and vanadium were at 0.31 % TiO2 and
0.011 % V, respectively.
As can be seen in Appendix 9.4-10, the sizing of the product pile was with 0.116 mm d80,
0.060 mm d50 and 760 Blaine, slightly coarser than the sample taken during the pilot test. This is
also the reason for the slightly worse grade.
This hematite concentrate is well on par or better than many other sinter concentrates on the
market, only the phosphorus content must be considered as higher than desired. It is assumed
that such concentrate will be accepted as sinterfeed as long as the portion in the ore mix is not
too high.
If the two pilot concentrates were blended according to their respective weights, a Combined
final concentrate assaying 69.0 % Fetot and 1.84 % SiO2 would be obtained (Appendix 9.4-11).
This is well on par or better than most other sinter concentrates on the market.
Although the combined P-content of 0.052 % P is slightly higher than desired for iron making
(due to inherent processing costs caused by downstream P-removal in steel shop), it is not
assumed to be critical. However, it should be noted that may Brazilian and Australian ores
exceed these levels, and in consideration of the generally increasing P-content of iron ore
supplies, a P-content of 0.05 % will likely find acceptance on the market.
The higher magnetite content of 58.1 % results typically in a reduced productivity, but also in a
reduced coke breeze consumption in the sinter plant.
As for every other concentrate, the portion in sinter mixture will be limited due to its sizing and
the inherent effect on sinter productivity.

SGA Studiengesellschaft für Eisenerzaufbereitung GmbH & Co. KG
A7451_NordicIronOre_Blötberget_report.docx 39
10. Summary
On behalf of Nordic Iron Ore AB (“NIO”; Danderyd, Sweden), Studiengesellschaft für
Eisenerzaufbereitung (“SGA”) has performed laboratory and pilot scale testwork with an 8 t
ROM iron ore sample from Blötberget deposit in Sweden.
The testwork comprised of
- receipt and preparation of three separate bulk sample materials
- the combination of these three ore types to produce a head sample representing the first
five years of run of mine (‘ROM’) at Blötberget,
- pilot scale testwork for upgrading the iron content and reduce the phosphorus content and
- accompanying laboratory scale testwork.
In previous testwork a flowsheet for beneficiation of this ore had been developed. On the one
hand this programme of work was expected to verify the suitability of that flowsheet, but the
main purpose was to improve the iron recovery in the hematite recovery circuit.
The projects’ intermediate and final results were discussed and mutually agreed between NIO,
Tata Steel Consulting and SGA.
All findings and test results in this report refer to the tested head sample only.
The chemical composition of head sample – Rougher LIMS Feed (‘Material 0‘) – revealed an
iron content of 37.6 % Fetot and a magnetite content of 30.3 %. Silica was analysed to
35.35 % SiO2. Titanium dioxide was at 0.185 % TiO2 and Vanadium at 0.022 % V.
Further, phosphorus content was analysed for the head sample to 0.236 % P. As established
during the testwork, this Blötberget ore sample contained a certain amount of apatite, a calcium
phosphate containing mineral. The phosphorus content in iron ore products should be as low as
possible for iron making due to inherent processing costs caused by downstream P-removal in
steel shop. P-content in iron ores is preferred at 0.04 % P or lower. However, it should be noted
that may Brazilian and Australian ores exceed these levels, and in consideration of the generally
increasing P-content of iron ore supplies, a P-content of 0.05 % will likely find acceptance on the
market.
The phosphate minerals appear to be more intimately associated with hematite (martite) than
with magnetite. Its removal from the hematite concentrate was performed by flotation using
AkzoNobel’s collector Atrac 1563.

SGA Studiengesellschaft für Eisenerzaufbereitung GmbH & Co. KG
A7451_NordicIronOre_Blötberget_report.docx 40
About 7900 kg head sample, crushed in SGA’s HPGR to <1 mm, were tested in laboratory and
pilot scale for the following processing steps:
� Rougher stage low intensity magnetic separation (‘LIMS’)
with head sample – Rougher LIMS Feed (‘Material 0‘)
� Rougher stage spiral separation with LIMS Tailings ('Material 1’)
� Cleaner stage LIMS with Rougher LIMS Concentrate ('Material 2')
� Regrinding of Rougher hematite concentrate (‘Material 3’)
� Scavenger stage processing with Tailings A <0.1 mm from rougher stage spiral separation
and Cleaner LIMS Tailings
� Cleaner stage spiral separation with Reground rougher spiral concentrate (‘Material 6’)
� Removal of phosphorus (apatite) from Cleaner spiral concentrate (‘Material 7’) by reverse
froth flotation
On the following page, the pilot scale results and some selected results from laboratory scale are
summarized on a flowsheet.
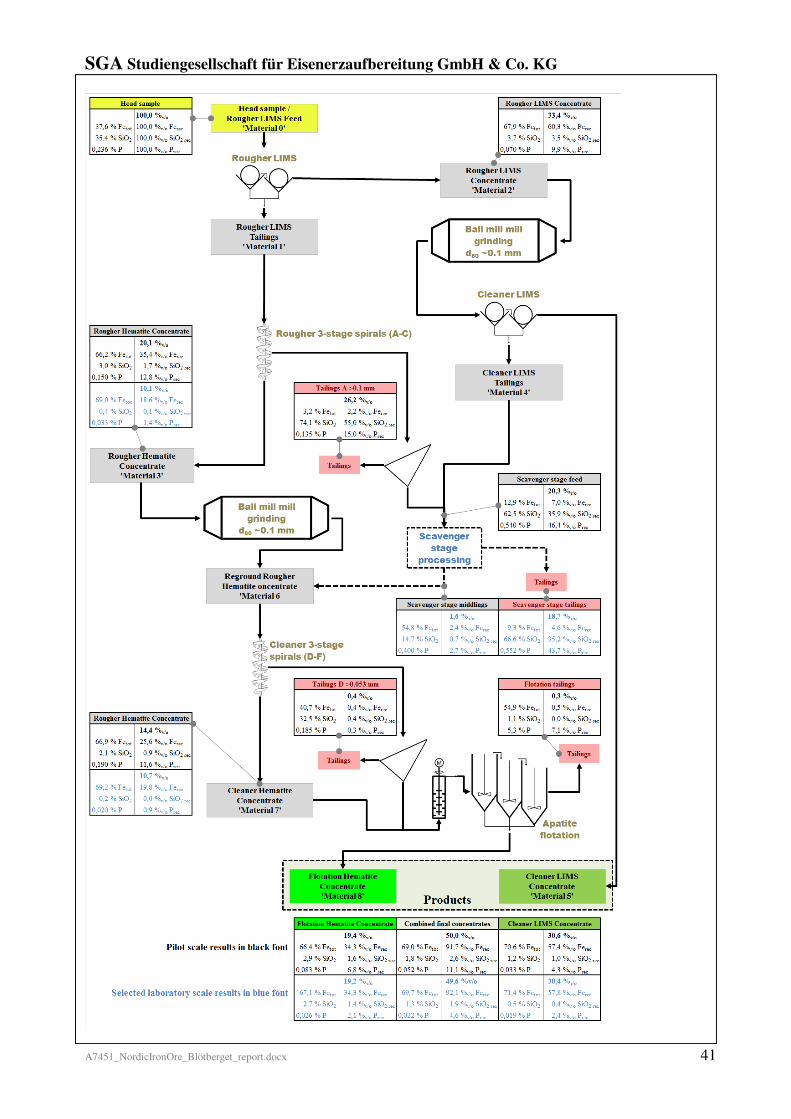
SGA Studiengesellschaft für Eisenerzaufbereitung GmbH & Co. KG
A7451_NordicIronOre_Blötberget_report.docx 41

SGA Studiengesellschaft für Eisenerzaufbereitung GmbH & Co. KG
A7451_NordicIronOre_Blötberget_report.docx 42
A more detailed balance for this flowsheet was assembled by Tata Steel Consulting which is
displayed in Appendix 10-1.
Both rougher stage concentrates, magnetite concentrate from rougher stage LIMS and hematite
concentrate from rougher stage spiral separation, have shown a reasonably high Fe grade, fully
or partly suitable for processing in blast furnace route. For the scenario of a combined rougher
stage product, both concentrates were virtually mixed according to their respective weight
recoveries. The iron content is calculated to 67.3 % and silica content to ~3.4 % SiO2, that is well
on par or better than many other sinter concentrates on the market. But the combined P-content
of 0.10 % P exceeds the phosphorus levels desired by most European still mills. These typically
prefer concentrates with 0.05 % P or lower to avoid additional downstream processing costs for
P-removal in the steel shop.
For the tests on scavenger processing, Tailings A <0.1 mm from rougher stage spiral separation
and Cleaner LIMS Tailings were combined. From all tests on scavenger processing, it can be
concluded that producing a scavenger concentrate with iron content on the level of 50-55 % Fetot
is possible, up to 2.5 %v/o Ferec could be recycled. The option to charge such scavenger
concentrate directly to apatite flotation or to mix it to the final product was also discussed with
client’s experts. This might be possible as weight recovery is comparably low, hence
deterioration of product grade. For the successive testwork was decided that no products from
scavenger testwork were to be recycled.
Shaking table tests anticipating both, rougher and cleaner spiral separation, produced very high
grade hematite concentrate at a weight recovery of 10.1-10.7 %v/o based on crude ore. The
concentrates were composed of 69.0-69.2 % Fetot (18.6-19.8 %v/o Ferec) and only 0.37-
0.16 % SiO2. Also the phosphorus content was advantageously low at 0.033-0.020 % P. Such
concentrate would be near to perfect chemical quality.
Cleaner LIMS concentrate (‘Material 5’) is the final magnetite product from the process and it
was recovered in pilot scale testing at 30.6 %v/o of crude ore feed. The iron content was analysed
to 70.6 % Fetot, which means an iron recovery of 57.4%v/o Ferec. Satmagan determined 93.9 %
magnetite; hence a magnetite recovery of 94.8 %v/o Mag.rec is calculated. This overall magnetite
recovery at ~95 %v/o Mag.rec is at a typical level, especially if the high grade is taken into
consideration.
The silica content was analysed to 1.15 % SiO2. Phosphorus content was favorably low at
0.033 % P. The produced pile Cleaner LIMS concentrate (‘Material 5’) was analysed to

SGA Studiengesellschaft für Eisenerzaufbereitung GmbH & Co. KG
A7451_NordicIronOre_Blötberget_report.docx 43
0.24 % Al2O3, 0.21 % CaO and 0.21 % MgO. All other impurities including 0.002 % S and
0.036 % Na2O+K2O were preferably low. The d80-value of the product pile was at 0.141 mm, the
specific surface was determined to 965 Blaine.
This magnetite concentrate is of such high grade that it is even eligible for iron making in direct
reduction route. Hence it will be attractive to steel producers as well who are looking to increase
the iron content of the ferrous burden thereby reducing slag volume, reductant rate and
increasing the productivity of the blast furnace. As for every other concentrate, the portion in
sinter mixture will be limited due to sizing in order to avoid detrimental impacts on the sinter
operation such as sinter strength, permeability and production rate.
The apatite accumulated on the hematite upgrading part of the flowsheet and was removed by
flotation using AkzoNobel’s collector Atrac 1563. Despite favorable results in laboratory scale,
where P-content could be lowered easily below 0.040 % P, it came to difficulties during pilot
scale tests in removing coarser apatite particles. As a result, the P-content of the concentrate
sample was with 0.083 % P not as low as required. Nevertheless, Flotation Hematite
Concentrate (‘Material 8’) was recovered at 19.4 %v/o weight recovery and it showed an iron
content of 66.4 % Fetot, hence 34.3 %v/o Ferec of the crude ore’s iron were recovered. Silica
content was at 2.92 % SiO2.
The chemical analysis of the product pile of that final concentrate resulted in a gangue
composition of 3.0 % SiO2, 0.6 % Al2O3, 0.4 % CaO and 0.2 % MgO. Beside 0.091 % Na2O, all
other analysed impurities were on a preferably low level, including 0.008 % S, 0.020 % K2O and
0.015 % Mn. The d80-value was at 0.116 mm, specific surface at 760 Blaine.
This hematite concentrate is well on par or better than many other sinter concentrates on the
market, only the phosphorus content must be considered as higher than desired. On the other
hand, a number of Australian or Brazilian ores show P-contents as high or sometimes even
higher than that. It is assumed that such concentrate will be gladly accepted as sinterfeed as long
as the portion in the ore mix is not too high.
If both pilot scale concentrates, Cleaner LIMS concentrate (‘Material 5’) and Flotation Hematite
Concentrate (‘Material 8’), were mixed on paper according to their respective weight recoveries
for a Combined final concentrate, the iron content would be calculated to 69.0 % Fetot and silica
content to 1.84 % SiO2, well on par or better than most other sinter concentrates on the market.
Although the combined P-content of 0.052 % P is slightly higher than desired for iron making, it

SGA Studiengesellschaft für Eisenerzaufbereitung GmbH & Co. KG
A7451_NordicIronOre_Blötberget_report.docx 44
is not assumed to be critical. The higher magnetite content of 58.1 % results typically in a
reduced productivity, but also in a reduced coke breeze consumption in the sinter plant.
In the result overview few pages above, two final concentrates from laboratory scale tests are
displayed as well: on the one hand a LIMS concentrate produced at a finer grinding and on the
other hand a flotation hematite concentrate where apatite removal worked sufficiently. If such
concentrates were combined, 69.0 % Fetot, 1.3 % SiO2 and 0.022 % P could be anticipated. Such
sinter concentrate would fully match, if not exceed the requirements for high efficient iron
making.
The weight recovery combined for magnetite concentrate and flotation hematite concentrate was
at 50.0 %v/o, accordingly one half of crude ore feed was recovered. The iron recovery combines
for 91.7 %v/o Ferec, exceeding somewhat the initial expectation of 90 %v/o Ferec. Additionally
~2.5 %v/o Ferec are anticipated to be recycled to processing from scavenging; it can be expected
that at least a part of that will last to the final concentrate and improve iron recovery slightly.
TiO2 and V were monitored throughout the project, a significant accumulation could not be
noticed.
With the exception of few phosphorus contents which shall be controllable by blending, it can be
stated, that all intermediate and final iron ore concentrates recovered in this project with this
Blötberget ore sample are fully suitable for sintering process and high efficient iron making in
blast furnace route, hence will be gladly accepted on the market. The portion in sinter mixture
will be limited as for every other concentrate, due to its sizing and the inherent effect on sinter
productivity.

Studiengesellschaft für Eisenerzaufbereitung SGA
Nordic Iron Ore AB
Blötberget - 3 ROM sub-samples (18 t total, 2015)
Sample preparation
Chemical analysis of
three delivered sub-samples
Guldkannan Hugget Footwall
Designation (Magnetite) (Hematite) (Waste)
SGA-No. 7450/1 <40 7450/2 <40 7450/3 <40
Weight [kg] 5955 7948 1706
Fetot [%] 33,85 55,15 7,55
FeO [%] - - -
SiO2 [%] 32,00 18,05 69,40
Al2O3 [%] - - -
CaO [%] - - -
MgO [%] - - -
P [%] 0,960 0,100 0,027
S [%] - - -
Na2O [%] - - -
K2O [%] - - -
Mn [%] - - -
TiO2 [%] 0,41 0,105 0,2
V [%] 0,085 0,0065 0,001
L.O.I. [%] - - -
Magnetite by Satmagan [%] 40,8 40,6 4,7
Febound to. Magn. / Fetot [%] 87,1 53,2 45,0
SGA-sample no.: 7450/1..3 Appendix 2-1
A7451_Blötberget-2015.xlsm/3ROM CA

Studiengesellschaft für Eisenerzaufbereitung SGA
Nordic Iron Ore AB
Blötberget - 3 ROM sub-samples (18 t total, 2015)
Sample preparation
Mixing of
delivered sub-samples
Guldkannan Hugget Footwall
Designation (Magnetite) (Hematite) (Waste)
SGA-No. 7450/1 <1 7450/2 <1 7450/3&4 <1 7451
Target [%] 17,5 52,5 30,0 100,0
Weight [kg] 1383 4148 2370 7900
Calc. Analysis
Fetot [%] 33,85 55,15 7,55 37,14
SiO2 [%] 32,00 18,05 69,40 35,90
P [%] 0,960 0,100 0,027 0,229
TiO2 [%] 0,410 0,105 0,200 0,187
V [%] 0,085 0,007 0,001 0,019
Magn. by Satm. [%] 40,8 40,6 4,7 29,9
Febound to. Magn. / Fetot [%] 87,1 53,2 45,0 56,7
SGA-sample no.: 7450/1..3 Appendix 2-2
Total
A7451_Blötberget-2015.xlsm/Mixing for head sample

Studiengesellschaft für Eisenerzaufbereitung SGA
Nordic Iron Ore AB
Blötberget - 8 t Pilot sample (2015/16)
Rougher LIMS Feed - 'Material 0'
Chemical analysis of
Rougher LIMS Feed - 'Material 0'
Fetot [%] 37,6
FeO [%] 9,99
SiO2 [%] 35,35
Al2O3 [%] 5,0 Cr [%] 0,0084
CaO [%] 1,25 Co [%] <0,0005
MgO [%] 1,77 Ni [%] <0,0005
P [%] 0,236 Cu [%] <0,0005
S [%] 0,004 Zn [%] 0,0013
Na2O [%] 1,72 Pb [%] 0,004
K2O [%] 0,69 As [%] <0,0005
Mn [%] 0,035 Cd [%] <0,0005
TiO2 [%] 0,185 Tl [%] <0,001
V [%] 0,022 SrO [%] 0,003
L.O.I. [%] - 0,38 BaO [%] 0,015
Magnetite by Satmagan [%] 30,3
Febound to. Magn. / Fetot [%] 58,3
SGA-sample no.: 7451/1 Appendix 3.1-1A7451_Blötberget-2015.xlsm/MAT0_CA

Studiengesellschaft für Eisenerzaufbereitung SGA
Nordic Iron Ore AB
Blötberget - 8 t Pilot sample (2015/16)
Rougher LIMS Feed - 'Material 0'
Screen analysis of
Rougher LIMS Feed - 'Material 0'
Size Weight Passing
mm % / cum. %
+ 1,0 0,2 / 99,8
1,0 - 0,63 5,8 / 94,0
0,63 - 0,5 4,5 / 89,5
0,5 - 0,315 13,5 / 76,0
0,315 - 0,2 14,3 / 61,7
0,2 - 0,1 24,5 / 37,2
0,1 - 0,063 11,2 / 26,0
0,063 - 0,04 7,6 / 18,4
0,04 - 0,025 4,0 / 14,5
0,025 - 0 14,5 / 0,0
Calculated total 100,0
d80 [mm] 0,37
d50 [mm] 0,15
SGA-sample no.: 7451/1 Appendix 3.1-2
0
10
20
30
40
50
60
70
80
90
100
0,010 0,100 1,000
cum
. w
eigh
t p
ass
ing (
%)
grain size (mm)
A7451_Blötberget-2015.xlsm/MAT0_SA

Studiengesellschaft für Eisenerzaufbereitung SGA
Nordic Iron Ore AB
Blötberget - 8 t Pilot sample (2015/16)
Rougher LIMS Feed - 'Material 0'
Davis Tube Test
with Rougher LIMS Feed - 'Material 0'
Top size <1.0 mm * <0.63 mm
Feed Concentrate Concentrate
Weight [%] 100 31,7 31,1
Fetot [%] 37,60 68,00 68,65
Ferec [%] 100 57,3 56,8
Magnetite by Satmagan [%] 30,3 92,9 93,3
Febound to. Magn. / Fetot [%] 58,3 98,8 98,3
Magn.rec [%] 100 97,2 95,8
SiO2 [%] 35,35 3,50 3,13
SiO2 rec [%] 100 3,1 2,8
P [%] 0,236 0,061 0,060
TiO2 [%] 0,185 0,102 0,097
V [%] 0,022 0,053 0,053
* - Top size <1.0 mm is the LIMS-Feed 'Material 0' without any regrinding.
SGA-sample no.: 7451/1/701702 Appendix 3.1-3
A7451_Blötberget-2015.xlsm/MAT0_DTT

Studiengesellschaft für Eisenerzaufbereitung SGA
Nordic Iron Ore AB
Blötberget - 8 t Pilot sample (2015/16)
Rougher LIMS - Pilot scale test
Process overview
0 Weight Fetot Magn. SiO2 10 Weight Fetot Magn. SiO2 9 Weight Fetot Magn. SiO2
abs. - 37,6 30,3 35,4 0,24 % P abs. - 62,7 80,2 9,2 0,12 % P abs. - 67,2 88,6 4,5 0,09 % P
recovery 100,0 100,0 100,0 100,0 0,19 % TiO2 recovery 37,6 62,6 99,5 9,8 0,12 % TiO2 recovery 33,9 60,6 99,0 4,3 0,11 % TiO2
recovery v/o 100,0 100,0 100,0 100,0 0,022 % V recovery v/o 37,6 62,6 99,5 9,8 0,046 % V recovery v/o 33,9 60,6 99,0 4,3 0,050 % V
5 Weight Fetot Magn. SiO2 4 Weight Fetot Magn. SiO2 3 Weight Fetot Magn. SiO2 2 Weight Fetot Magn. SiO2
abs. - 22,5 0,9 51,8 0,27 % P abs. - 19,8 2,1 53,8 0,46 % P abs. - 31,5 18,6 37,6 0,74 % P abs. - 67,9 90,5 3,7 0,07 % P
recovery 62,4 37,4 1,9 91,5 0,21 % TiO2 recovery 3,7 2,0 0,3 5,7 0,28 % TiO2 recovery 0,5 0,4 0,3 0,5 0,39 % TiO2 recovery 33,4 60,3 99,7 3,5 0,10 % TiO2
recovery v/o 62,4 37,4 1,9 91,5 0,006 % V recovery v/o 3,7 2,0 0,3 5,7 0,007 % V recovery v/o 0,5 0,4 0,3 0,5 0,019 % V recovery v/o 33,4 60,3 99,7 3,5 0,050 % V
SGA-sample no.: 7451/1-1/1ff Appendix 3.2-1
MIMS tailings RougherLIMS 1 tailings Rougher LIMS 2+3 tailings Rougher LIMS concentrate 'Material 2'
Rougher LIMS Feed 'Material 0' MIMS concentrate Rougher LIMS concentrate
Rougher LIMS Feed 'Material 0'1800 kg/h
Rougher LIMS concentrate 'Material
2'Rougher LIMS 2+3 tailingsRougher LIMS 1 tailings
Rougher LIMS 2+3600 Gauss
Rougher LIMS 11000 Gauss
MIMS tailings
MIMS3500 Gauss
A7451_Blötberget-2015.xlsm/PPT-1-1_Ov

Studiengesellschaft für Eisenerzaufbereitung SGA
Nordic Iron Ore AB
Blötberget - 8 t Pilot sample (2015/16)
Rougher LIMS - Pilot scale test
Chemical analysis of samples taken during test
(Feed rate @ 1800 kg/h, MIMS @ 3500 Gauss, Rougher LIMS 1 @ 1000 Gauss, Rougher LIMS 2+3 @ 600 Gauss)
Feed Products Calc. balance Intermediate products
Rougher
LIMS Feed
'Material 0'
Rougher LIMS
concentrate
'Material 2'
Rougher
LIMS 2+3
tailings
Rougher
LIMS 1
tailings
MIMS
tailings
Rougher
LIMS 1
concentrate
MIMS
concentrate
Weight [%] 100,0 33,4 0,5 3,7 62,4 100,0 33,9 37,6
Weight [%v/o] 100,0 33,4 0,5 3,7 62,4 100,0 33,9 37,6
Fetot [%] 37,60 67,90 31,45 19,80 22,50 37,60 67,23 62,65
Ferec [%] 100,0 60,3 0,4 2,0 37,3 100,0 60,6 62,6
Ferec [%] 100,0 60,3 0,4 2,0 37,4 100,0 60,6 62,6
Ferec [%v/o] 100,0 60,3 0,4 2,0 37,4 100,0 60,6 62,6
Magn. by Satm. [%] 30,3 90,5 18,6 2,1 0,9 30,9 88,6 80,2
Febound to. Magn. / Fetot [%] 58,3 96,4 42,8 7,7 2,9 59,5 95,3 92,6
Magn.rec [%] 97,9 97,6 0,3 0,3 1,8 100,0 97,0 97,4
Magn.rec [%] 100,0 99,7 0,3 0,3 1,9 102,1 99,0 99,5
Magn.rec [%v/o] 100,0 99,7 0,3 0,3 1,9 102,1 99,0 99,5
SiO2 [%] 35,35 3,67 37,60 53,80 51,80 35,73 4,47 9,24
SiO2 rec [%] 98,9 3,4 0,5 5,6 90,5 100,0 4,2 9,7
SiO2 rec [%] 100,0 3,5 0,5 5,7 91,5 101,1 4,3 9,8
SiO2 rec [%v/o] 100,0 3,5 0,5 5,7 91,5 101,1 4,3 9,8
P [%] 0,24 0,070 0,74 0,46 0,27 0,21 0,09 0,12
Prec [%] 112,8 11,2 1,7 8,1 79,1 100,0 14,1 21,0
Prec [%] 100,0 9,9 1,5 7,2 70,1 88,6 12,5 18,6
Prec [%v/o] 100,0 9,9 1,5 7,2 70,1 88,6 12,5 18,6
TiO2 [%] 0,19 0,10 0,39 0,28 0,21 0,17 0,11 0,12
V [%] 0,022 0,050 0,019 0,007 0,006 0,020 0,050 0,046
d80 [mm] 0,369 0,455 0,306 0,297 0,337 0,375 - -
d50 [mm] 0,152 0,192 0,099 0,094 0,155 0,165 - -
Spec. Surface [Blaine] - 295 1035 1205 605 526 - -
Spec. Weight [g/cm³] - 4,93 3,43 3,08 3,14 3,74 - -
SGA-sample no.: 7451/1-1/1ff Appendix 3.2-2
A7451_Blötberget-2015.xlsm/PPT-1-1_CA

Studiengesellschaft für Eisenerzaufbereitung SGA
Nordic Iron Ore AB
Blötberget - 8 t Pilot sample (2015/16)
Rougher LIMS - Pilot scale test
Size distribution of samples taken during test
Feed
Rougher LIMS
concentrate
'Material 2'
Rougher
LIMS 2+3
tailings
Rougher
LIMS 1
tailings
MIMS
tailings
Rougher
LIMS 1
concentrate
MIMS
concentrate
Size Weight / Passing Weight / Passing Weight / Passing Weight / Passing Weight / Passing Weight / Passing Weight / Passing
mm [%] / [cum. %] [%] / [cum. %] [%] / [cum. %] [%] / [cum. %] [%] / [cum. %] [%] / [cum. %] [%] / [cum. %]
+ 1,0 0,2 / 99,8 0,2 / 99,8 0,3 / 99,7 0,7 / 99,3 0,3 / 99,7 - -
1,0 - 0,63 5,8 / 94,0 8,0 / 91,8 3,7 / 96,0 5,8 / 93,5 5,0 / 94,7 - -
0,63 - 0,5 4,5 / 89,5 7,7 / 84,1 4,5 / 91,6 4,4 / 89,1 4,6 / 90,1 - -
0,5 - 0,315 13,5 / 76,0 16,8 / 67,3 10,8 / 80,7 7,9 / 81,2 11,5 / 78,6 - -
0,315 - 0,2 14,3 / 61,7 15,5 / 51,7 9,2 / 71,5 7,9 / 73,3 17,1 / 61,6 - -
0,2 - 0,1 24,5 / 37,2 22,3 / 29,4 21,3 / 50,2 21,1 / 52,2 25,8 / 35,8 - -
0,1 - 0,063 11,2 / 26,0 9,7 / 19,7 9,1 / 41,1 14,3 / 37,9 12,6 / 23,2 - -
0,063 - 0,04 7,6 / 18,4 6,8 / 12,9 6,9 / 34,2 10,8 / 27,1 8,3 / 14,9 - -
0,04 - 0,025 4,0 / 14,5 4,4 / 8,5 5,6 / 28,6 6,9 / 20,3 3,5 / 11,4 - -
0,025 - 0 14,5 / 0,0 8,5 / 0,0 28,6 / 0,0 20,3 / 0,0 11,4 / 0,0 - -
100,0 / - 100,0 / - 100,0 / - 100,0 / - 100,0 / - - -
d80 [mm] 0,369 0,455 0,306 0,297 0,337 - -
d50 [mm] 0,152 0,192 0,099 0,094 0,155 - -
Spec. Surface [Blaine] - 295 1035 1205 605 - -
Spec. Weight [g/cm³] - 4,93 3,43 3,08 3,14 - -
SGA-sample no.: 7451/1-1/1ff Appendix 3.2-3
A7451_Blötberget-2015.xlsm/PPT-1-1_SA

Studiengesellschaft für Eisenerzaufbereitung SGA
Nordic Iron Ore AB
Blötberget - 8 t Pilot sample (2015/16)
Lab scale tests with Rougher LIMS Tailings - 'Material 1'
Chemical analysis of
Rougher LIMS Tailings - 'Material 1'
Fetot [%] 24,6
FeO [%] -
SiO2 [%] 49,7
Al2O3 [%] -
CaO [%] -
MgO [%] -
P [%] 0,240
S [%] -
Na2O [%] -
K2O [%] -
Mn [%] -
TiO2 [%] 0,2
V [%] 0,006
L.O.I. [%] -
Magnetite by Satmagan [%] 1,1
Febound to. Magn. / Fetot [%] 3,2
SGA-sample no.: 7451/1 Appendix 4.1-2A7451_Blötberget-2015.xlsm/MAT1_CA

Studiengesellschaft für Eisenerzaufbereitung SGA
Nordic Iron Ore AB
Blötberget - 8 t Pilot sample (2015/16)
Lab scale tests with Rougher LIMS Tailings - 'Material 1'
Screen metal analysis of
Rougher LIMS Tailings - 'Material 1'
Size Weight Passing Fetot SiO2 P TiO2 V
mm % / cum. % [%] [%] [%] [%] [%]
+ 1,0 0,4 / 99,6
1,0 - 0,63 5,4 / 94,2
0,63 - 0,5 4,9 / 89,4
0,5 - 0,315 12,2 / 77,2 35,7 39,2 0,045 0,180 0,0071
0,315 - 0,2 17,6 / 59,6 34,0 41,2 0,069 0,185 0,0070
0,2 - 0,1 27,1 / 32,5 21,0 54,6 0,185 0,175 0,0058
0,1 - 0,063 12,7 / 19,8 18,0 57,8 0,440 0,200 0,0056
0,063 - 0,04 8,2 / 11,6 16,9 57,1 0,610 0,235 0,0057
0,04 - 0,025 4,0 / 7,6
0,025 - 0 7,6 / 0,0
Calculated total 100,0 24,3 50,2 0,254 0,201 0,0062
d80 [mm] 0,357 Blaine [cm²/g] 405
d50 [mm] 0,165 Specific density [g/cm³] 3,20
SGA-sample no.: 7451/1 Appendix 4.1-2
0,170
0,310
0,0049
0,0072
22,7
19,4
50,9
51,6
0,042
0,650
0
10
20
30
40
50
60
70
80
90
100
0,010 0,100 1,000
cum
. w
eigh
t p
ass
ing (
%)
grain size (mm)
A7451_Blötberget-2015.xlsm/MAT1_SMA

Studiengesellschaft für Eisenerzaufbereitung SGA
Nordic Iron Ore AB
Blötberget - 8 t Pilot sample (2015/16)
Lab scale tests with Rougher LIMS Tailings - 'Material 1'
Shaking table test
with Rougher LIMS Tailings - 'Material 1'
Feed Products Calc. balance
Rougher
LIMS Tailings
'Material 1'
Concentrate Middlings Tailings 1 Tailings 2
Weight [%] 100,0 15,2 25,0 47,0 12,8 100,0
Weight [%v/o] 66,6 10,1 16,6 31,3 8,6 66,6
Fetot [%] 24,60 68,95 42,80 4,10 9,85 24,36
Ferec [%] 101,0 43,0 43,9 7,9 5,2 100,0
Ferec [%] 100,0 42,6 43,4 7,8 5,1 99,0
Ferec [%v/o] 43,6 18,6 18,9 3,4 2,2 43,2
Magn. by Satm. [%] 1,1 1,3 1,4 0,9 1,8 1,2
Febound to. Magn. / Fetot [%] 3,2 1,4 2,3 16,1 13,2 3,6
Magn.rec [%] 91,4 16,8 28,6 35,5 19,1 100,0
Magn.rec [%] 100,0 18,3 31,3 38,9 20,9 109,4
Magn.rec [%v/o] 2,4 0,4 0,8 0,9 0,5 2,6
SiO2 [%] 49,70 0,37 29,10 74,10 60,60 49,92
SiO2 rec [%] 99,6 0,1 14,6 69,7 15,6 100,0
SiO2 rec [%] 100,0 0,1 14,6 70,0 15,7 100,4
SiO2 rec [%v/o] 93,6 0,1 13,7 65,6 14,7 94,0
P [%] 0,240 0,033 0,405 0,140 0,440 0,228
Prec [%] 105,1 2,2 44,3 28,8 24,7 100,0
Prec [%] 100,0 2,1 42,1 27,4 23,5 95,2
Prec [%v/o] 67,7 1,4 28,5 18,6 15,9 64,5
TiO2 [%] 0,200 0,310 0,230 0,130 0,260 0,199
V [%] 0,006 0,011 0,008 0,002 0,006 0,005
d80 [mm] 0,357 0,238 0,459 0,422 0,041 0,354
d50 [mm] 0,165 0,159 0,263 0,174 0,019 0,174
Spec. Surface [Blaine] - - - - - -
Spec. Weight [g/cm³] - - - - - -
SGA-sample no.: 7451/1-1/1ff Appendix 4.1-3.1A7451_Blötberget-2015.xlsm/RTable_CA

Studiengesellschaft für Eisenerzaufbereitung SGA
Nordic Iron Ore AB
Blötberget - 8 t Pilot sample (2015/16)
Lab scale tests with Rougher LIMS Tailings - 'Material 1'
Size distribution of products from shaking table test with 'Material 1'
Feed Concentrate Middlings Tailings 1 Tailings 2
Size Weight / Passing Weight / Passing Weight / Passing Weight / Passing Weight / Passing
mm [%] / [cum. %] [%] / [cum. %] [%] / [cum. %] [%] / [cum. %] [%] / [cum. %]
+ 1,0 0,4 / 99,6 0,0 / 100,0 0,4 / 99,6 0,5 / 99,5 0,0 / 100,0
1,0 - 0,63 5,4 / 94,2 0,2 / 99,8 6,0 / 93,6 8,1 / 91,3 0,0 / 100,0
0,63 - 0,5 4,9 / 89,4 0,4 / 99,4 7,5 / 86,1 6,2 / 85,2 0,1 / 99,9
0,5 - 0,315 12,2 / 77,2 2,2 / 97,2 27,4 / 58,7 12,2 / 73,0 0,3 / 99,5
0,315 - 0,2 17,6 / 59,6 25,7 / 71,5 19,1 / 39,6 15,3 / 57,7 0,7 / 98,8
0,2 - 0,1 27,1 / 32,5 52,0 / 19,5 19,5 / 20,1 29,7 / 27,9 4,2 / 94,6
0,1 - 0,063 12,7 / 19,8 17,0 / 2,6 11,2 / 8,8 15,8 / 12,2 8,6 / 85,9
0,063 - 0,04 8,2 / 11,6 2,5 / 0,1 5,4 / 3,4 7,1 / 5,1 6,2 / 79,8
0,04 - 0,025 4,0 / 7,6 0,1 / 0,1 1,0 / 2,5 1,3 / 3,8 15,1 / 64,7
0,025 - 0 7,6 / 0,0 0,1 / 0,0 2,5 / 0,0 3,8 / 0,0 64,7 / 0,0
100,0 / - 100,0 / - 100,0 / - 100,0 / - 100,0 / -
d80 [mm] 0,357 0,238 0,459 0,422 0,041
d50 [mm] 0,165 0,159 0,263 0,174 0,019
Spec. Surface [Blaine] - - - - -
Spec. Weight [g/cm³] - - - - -
SGA-sample no.: 7451/1-1/1ff Appendix 4.1-3.2
A7451_Blötberget-2015.xlsm/RTable_SA

Studiengesellschaft für Eisenerzaufbereitung SGA
Nordic Iron Ore AB
Blötberget - 8 t Pilot sample (2015/16)
Lab scale tests with Rougher LIMS Tailings - 'Material 1'
Sink float analysis
with Rougher LIMS Tailings - 'Material 1'
Screen metal Analysis
Weight / Passing Fe Ferec. Ferec./feed SiO2 P TiO2 V
[%] [cum. %] [%] [%] [%] [%] [%] [%] [%]
+ 1,0 0,4 / 99,6 22,7 0,4 50,9 0,042 0,170 0,0049
1,0 - 0,1 67,1 / 32,5 27,3 75,3 47,7 0,107 0,178 0,0062
0,1 - 0,063 12,7 / 19,8 18,0 9,4 57,8 0,440 0,200 0,0056
0,063 - 0,04 8,2 / 11,6 16,9 5,7 57,1 0,610 0,235 0,0057
0,04 - 0,0 11,6 / 0,0 19,4 9,2 51,6 0,650 0,310 0,0072
100,0 24,3 100,0 50,2 0,254 0,201 0,0062
d80 [µm] = 357 Analysis of basis 24,6 49,7 0,240 0,200 0,0060
Sink float analyses
Fraction > 0,1 mm
weight v/o Fe Ferec. Ferec./feed SiO2 P TiO2 V
[%] [%] [%] [%] [%] [%] [%] [%] [%]
> 3,3 36,1 24,4 68,0 91,6 69,3 1,6 0,033 0,285 0,0120
3,3 - 2,7 9,7 6,5 16,6 6,0 4,5 42,6 0,980 0,380 0,0100
< 2,7 54,2 36,6 1,2 2,4 1,8 78,8 0,180 0,084 0,0030
100,0 67,5 26,8 100,0 75,7 47,4 0,204 0,185 0,0069
Fraction 0,1 - 0,063 mm
weight v/o Fe Ferec. Ferec./feed SiO2 P TiO2 V
[%] [%] [%] [%] [%] [%] [%] [%] [%]
> 3,3 24,0 3,1 67,1 89,1 8,4 1,4 0,174 0,530 0,0070
3,3 - 2,7 11,9 1,5 10,2 6,7 0,6 54,0 2,320 0,280 0,0080
< 2,7 64,1 8,2 1,2 4,2 0,4 79,5 0,015 0,060 0,0020
100,0 12,7 18,1 100,0 9,4 57,7 0,327 0,199 0,0039
Fraction 0,063 - 0,04 mm
weight v/o Fe Ferec. Ferec./feed SiO2 P TiO2 V
[%] [%] [%] [%] [%] [%] [%] [%] [%]
> 3,3 19,1 1,6 68,6 78,4 4,4 0,6 0,069 0,480 0,0130
3,3 - 2,7 4,3 0,4 28,5 7,4 0,4 24,5 2,780 0,460 0,0110
< 2,7 76,6 6,3 3,1 14,2 0,8 71,3 0,850 0,145 0,0050
100,0 8,2 16,7 100,0 5,7 55,8 0,784 0,222 0,0068
Summary of Fractions >0,04 mm
v/o Fe Ferec./feed SiO2 P TiO2 V
[%] [%] [%] [%] [%] [%] [%]
> 3,3 29,0 67,9 82,1 1,5 0,050 0,321 0,0115
3,3 - 2,7 8,4 15,9 5,6 43,9 1,297 0,365 0,0097
< 2,7 51,0 1,4 3,0 78,0 0,236 0,088 0,0031
88,4 24,6 90,8 49,7 0,276 0,191 0,0065
SGA-sample no.: 7451/100/3/600..609 Appendix 4.1-4
kg/l
mm
kg/l
kg/l
kg/l
A7451_Blötberget-2015.xlsm/RSinkFloat

Studiengesellschaft für Eisenerzaufbereitung SGA
Nordic Iron Ore AB
Blötberget - 8 t Pilot sample (2015/16)
Lab scale tests with Rougher LIMS Tailings - 'Material 1'
Lab scale tests - Wet high intensity magnetic separation (WHIMS)
with Rougher LIMS Tailings - 'Material 1'
Feed Products Calc. balance
Rougher
LIMS Tailings
'Material 1'
Concentrate Middlings Tailings
Weight [%] 100,0 39,5 5,7 54,7 100,0
Weight [%v/o] 66,6 26,3 3,8 36,4 66,6
Fetot [%] 24,60 55,70 14,75 3,90 25,00
Ferec [%] 98,4 88,1 3,4 8,5 100,0
Ferec [%] 100,0 89,5 3,4 8,7 101,6
Ferec [%v/o] 43,6 39,0 1,5 3,8 44,3
Magn. by Satm. [%] 1,1 2,0 1,2 <0,9 -
Febound to. Magn. / Fetot [%] 3,2 2,6 5,9 - -
Magn.rec [%] - - - - -
Magn.rec [%] - - - - -
Magn.rec [%v/o] 2,4 1,7 0,2 - -
SiO2 [%] 49,70 14,70 61,60 74,10 49,90
SiO2 rec [%] 99,6 11,6 7,1 81,3 100,0
SiO2 rec [%] 100,0 11,7 7,1 81,6 100,4
SiO2 rec [%v/o] 93,6 10,9 6,7 76,4 94,0
P [%] 0,240 0,150 0,210 0,265 0,216
Prec [%] 110,9 27,4 5,6 67,0 100,0
Prec [%] 100,0 24,7 5,0 60,4 90,2
Prec [%v/o] 67,7 16,7 3,4 40,9 61,1
TiO2 [%] 0,200 0,305 0,190 0,130 0,203
V [%] 0,006 0,011 0,006 0,004 0,007
d80 [mm] 0,357 - - - -
d50 [mm] 0,165 - - - -
Spec. Surface [Blaine] - - - - -
Spec. Weight [g/cm³] - - - - -
SGA-sample no.: 7451/1-1/1ff Appendix 4.1-5A7451_Blötberget-2015.xlsm/RWHIMS

Studiengesellschaft für Eisenerzaufbereitung SGA
Nordic Iron Ore AB
Blötberget - 8 t Pilot sample (2015/16)
Rougher stage spiral separation - Pilot scale test
Process overview - Phase 1, open spiral circuit(Reduced sampling)
0 Weight Fetot Magn. SiO2
abs. - 24,6 1,1 49,7 0,24 % P
recovery 100,0 100,0 100,0 100,0 0,20 % TiO2
recovery v/o 66,6 43,6 2,4 93,6 0,006 % V
6 Weight Fetot Magn. SiO2
abs. - 11,5 2,8 57,6 0,48 % P
recovery 4,2 1,9 10,6 4,8 0,31 % TiO2
recovery v/o 2,8 0,8 0,3 4,5 0,007 % V
3 Weight Fetot Magn. SiO2
abs. - 4,4 1,1 72,6 0,22 % P
recovery 55,2 9,9 55,2 80,7 0,14 % TiO2
recovery v/o 36,8 4,3 1,3 75,5 0,003 % V
4 Weight Fetot Magn. SiO2
abs. - 13,0 1,2 63,2 0,62 % P
recovery 7,3 3,9 8,0 9,3 0,18 % TiO2
recovery v/o 4,9 1,7 0,2 8,7 0,004 % V
2 Weight Fetot Magn. SiO2 5 Weight Fetot Magn. SiO2
abs. - 65,9 1,3 3,5 0,13 % P abs. - 20,7 1,4 53,9 0,64 % P
recovery 30,5 81,7 36,1 2,1 0,30 % TiO2 recovery 2,8 2,3 3,5 3,0 0,22 % TiO2
recovery v/o 20,3 35,6 0,9 2,0 0,011 % V recovery v/o 1,8 1,0 0,1 2,8 0,005 % V
SGA-sample no.: 7451/1-1/1ff Appendix 4.2-1.1
Rougher Hematite concentrate 'Material 3'
Rougher LIMS Tailings 'Material 1'
Cyclone overflow
Tailings A
Tailings B
Tailings C
Rougher LIMS Tailings 'Material 1'1500 kg/h
Rougher Hematite concentrate 'Material 3'
Tailings A
Cyclone overflow
Spiral ARougher
Spiral BCleaner
Spiral CRe-cleaner
Dewatering
cyclone
Tailings C
Tailings B
3000 l/h washing water
1300 l/h washing water
1300 l/h washing water
A7451_Blötberget-2015.xlsm/PPT-2-2_Ov

Studiengesellschaft für Eisenerzaufbereitung SGA
Nordic Iron Ore AB
Blötberget - 8 t Pilot sample (2015/16)
Rougher stage spiral separation - Pilot scale test
Chemical analysis of samples taken for open circuit operation
Phase 1, open spiral circuit (Feed rate @ 1500 kg/h; reduced sampling)
Feed Products Calc. balance
Rougher
LIMS Tailings
'Material 1'
R. Hematite
concentrate
'Material 3'
Tailings A Tailings B Tailings CCyclone
overflow *
Weight [%] 100,0 30,5 55,2 7,3 2,8 4,2 100,0
Weight [%v/o] 66,6 20,3 36,8 4,9 1,8 2,8 66,6
Fetot [%] 24,60 65,90 4,40 12,95 20,70 11,45 24,54
Ferec [%] 100,3 81,9 9,9 3,9 2,3 1,9 100,0
Ferec [%] 100,0 81,7 9,9 3,9 2,3 1,9 99,7
Ferec [%v/o] 43,6 35,6 4,3 1,7 1,0 0,8 43,5
Magn. by Satm. [%] 1,1 1,3 1,1 1,2 1,4 2,8 1,2
Febound to. Magn. / Fetot [%] 3,2 1,4 18,1 6,7 4,9 17,7 3,7
Magn.rec [%] 100,0 36,1 55,2 8,0 3,5 10,6 113,4
Magn.rec [%] 100,0 36,1 55,2 8,0 3,5 10,6 113,4
Magn.rec [%v/o] 2,4 0,9 1,3 0,2 0,1 0,3 2,7
SiO2 [%] 49,70 3,49 72,60 63,20 53,90 57,60 49,68
SiO2 rec [%] 100,0 2,1 80,7 9,3 3,0 4,8 100,0
SiO2 rec [%] 100,0 2,1 80,7 9,3 3,0 4,8 100,0
SiO2 rec [%v/o] 93,6 2,0 75,5 8,7 2,8 4,5 93,6
P [%] 0,24 0,13 0,22 0,62 0,64 0,48 0,24
Prec [%] 98,9 15,7 50,0 18,7 7,3 8,3 100,0
Prec [%] 100,0 15,9 50,6 18,9 7,4 8,3 101,2
Prec [%v/o] 67,7 10,8 34,3 12,8 5,0 5,7 68,5
TiO2 [%] 0,20 0,30 0,14 0,18 0,22 0,31 0,20
V [%] 0,006 0,011 0,003 0,004 0,005 0,007 0,005
d80 [mm] 0,357 0,397 0,375 0,188 0,364 - -
d50 [mm] 0,165 0,235 0,155 0,106 0,125 - -
Spec. Surface [Blaine] 405 110 - - - - -
Spec. Weight [g/cm³] 3,20 5,04 - - - - -
SGA-sample no.: 7451/1-1/1ff Appendix 4.2-1.2
* -
sam
ple
wei
ght
and p
roper
ties
tak
en o
ver
fro
m
close
d c
ircu
it e
val
uat
ion (
Appen
dix
4.2
-2.2
)
A7451_Blötberget-2015.xlsm/PPT-2-2_CA

Studiengesellschaft für Eisenerzaufbereitung SGA
Nordic Iron Ore AB
Blötberget - 8 t Pilot sample (2015/16)
Rougher stage spiral separation - Pilot scale test
Size distribution of samples taken during test (Phase 1, open spiral circuit)
Feed
R. Hematite
concentrate
'Material 3'
Tailings A Tailings B Tailings C
Size Weight / Passing Weight / Passing Weight / Passing Weight / Passing Weight / Passing
mm [%] / [cum. %] [%] / [cum. %] [%] / [cum. %] [%] / [cum. %] [%] / [cum. %]
+ 1,0 0,4 / 99,6 0,1 / 100,0 0,7 / 99,3 0,5 / 99,5 0,5 / 99,6
1,0 - 0,63 5,4 / 94,2 2,7 / 97,3 6,7 / 92,6 3,2 / 96,3 6,8 / 92,8
0,63 - 0,5 4,9 / 89,4 4,2 / 93,2 5,1 / 87,5 2,3 / 94,1 5,8 / 87,1
0,5 - 0,315 12,2 / 77,2 23,7 / 69,5 11,1 / 76,4 3,6 / 90,5 9,6 / 77,5
0,315 - 0,2 17,6 / 59,6 28,1 / 41,4 12,8 / 63,6 6,2 / 84,2 4,9 / 72,6
0,2 - 0,1 27,1 / 32,5 29,4 / 12,0 30,0 / 33,6 36,3 / 48,0 29,9 / 42,7
0,1 - 0,063 12,7 / 19,8 9,5 / 2,5 14,8 / 18,8 23,9 / 24,0 23,1 / 19,6
0,063 - 0,04 8,2 / 11,6 1,8 / 0,8 9,5 / 9,3 13,5 / 10,5 12,0 / 7,7
0,04 - 0,025 4,0 / 7,6 0,4 / 0,4 4,4 / 4,9 4,6 / 6,0 4,3 / 3,4
0,025 - 0 7,6 / 0,0 0,4 / 0,0 4,9 / 0,0 6,0 / 0,0 3,4 / 0,0
100,0 / - 100,0 / - 100,0 / - 100,0 / - 100,0 / -
d80 [mm] 0,357 0,397 0,375 0,188 0,364
d50 [mm] 0,165 0,235 0,155 0,106 0,125
Spec. Surface [Blaine] 405 110 - - -
Spec. Weight [g/cm³] 3,20 5,04 - - -
SGA-sample no.: 7451/1-1/1ff Appendix 4.2-1.3
A7451_Blötberget-2015.xlsm/PPT-2-2_SA

Studiengesellschaft für Eisenerzaufbereitung SGA
Nordic Iron Ore AB
Blötberget - 8 t Pilot sample (2015/16)
Rougher stage spiral separation - Pilot scale test
Process overview - Phase 2, closed spiral circuit
0 Weight Fetot Magn. SiO2 5 Weight Fetot Magn. SiO2
abs. - 24,6 1,1 49,7 0,24 % P abs. - 11,5 2,8 57,6 0,48 % P
recovery 100,0 100,0 100,0 100,0 0,20 % TiO2 recovery 4,2 1,9 10,6 4,8 0,31 % TiO2
recovery v/o 66,6 43,6 2,4 93,6 0,006 % V recovery v/o 2,8 0,8 0,3 4,5 0,007 % V
9 Weight Fetot Magn. SiO2
abs. - 5,4 1,0 70,7 0,28 % P
recovery 65,4 14,3 59,4 93,0 0,15 % TiO2
recovery v/o 43,5 6,3 1,4 87,1 0,003 % V
4 Weight Fetot Magn. SiO2
abs. - 3,2 0,9 74,1 0,14 % P
recovery 39,4 5,0 32,2 58,7 0,13 % TiO2
recovery v/o 26,2 2,2 0,8 55,0 0,002 % V
3 Weight Fetot Magn. SiO2
abs. - 9,4 1,1 66,4 0,54 % P
recovery 26,2 10,0 26,2 35,0 0,18 % TiO2
recovery v/o 17,5 4,3 0,6 32,8 0,004 % V
10 Weight Fetot Magn. SiO2 11 Weight Fetot Magn. SiO2 2 Weight Fetot Magn. SiO2
abs. - 16,9 1,4 58,2 0,60 % P abs. - 24,6 1,7 59,4 0,73 % P abs. - 66,2 1,2 3,0 0,15 % P
recovery 7,4 5,1 9,4 8,6 0,20 % TiO2 recovery 4,3 4,3 6,7 5,2 0,24 % TiO2 recovery 30,2 81,3 32,9 1,8 0,30 % TiO2
recovery v/o 4,9 2,2 0,2 8,1 0,004 % V recovery v/o 2,9 1,9 0,2 4,8 0,006 % V recovery v/o 20,1 35,4 0,8 1,7 0,010 % V
SGA-sample no.: 7451/2-1/1ff Appendix 4.2-2.1
Rougher Hematite concentrate 'Material 3'
Rougher LIMS Tailings 'Material 1'
Tailings CTailings B
Cyclone overflow
Tailings A <0.1 mm
Tailings A >0.1 mm
Tailings A
Rougher LIMS Tailings 'Material 1'1500 kg/h
Rougher Hematite concentrate 'Material 3'
Tailings A >0.1 mm
Tailings A <0.1 mm
Cyclone overflow
Spiral ARougher
Spiral BCleaner
Spiral CRe-cleaner
ScreenDF120 / 0.1 mm
Dewatering
cyclone
1300 l/h washing water
3000 l/h washing water
1300 l/h washing water
A7451_Blötberget-2015.xlsm/PPT-2-1_Ov

Studiengesellschaft für Eisenerzaufbereitung SGA
Nordic Iron Ore AB
Blötberget - 8 t Pilot sample (2015/16)
Rougher stage spiral separation - Pilot scale test
Chemical analysis of samples taken during test
Phase 2, closed spiral circuit (Feed rate @ 1500 kg/h, Derrick screen DF 120 (~0.1 mm))
Feed Products Calc. balance Intermediate products
Rougher
LIMS Tailings
'Material 1'
R. Hematite
concentrate
'Material 3'
Tailings A <0.1
mm
Tailings A >0.1
mmCyclone overflow Tailings A Tailings B Tailings C
Weight [%] 100,0 30,2 26,2 39,4 4,2 100,0 65,4 7,4 4,3
Weight [%v/o] 66,6 20,1 17,5 26,2 2,8 66,6 43,5 4,9 2,9
Fetot [%] 24,60 66,20 9,35 3,15 11,45 24,16 5,40 16,85 24,60
Ferec [%] 101,8 82,7 10,1 5,1 2,0 100,0 14,6 5,1 4,4
Ferec [%] 100,0 81,3 10,0 5,0 1,9 98,2 14,3 5,1 4,3
Ferec [%v/o] 43,6 35,4 4,3 2,2 0,8 42,8 6,3 2,2 1,9
Magn. by Satm. [%] 1,1 1,2 1,1 0,9 2,8 1,1 1,0 1,4 1,7
Febound to. Magn. / Fetot [%] 3,2 1,3 8,5 20,7 17,7 3,4 13,4 6,0 5,0
Magn.rec [%] 98,0 32,3 25,7 31,6 10,4 100,0 58,2 9,2 6,5
Magn.rec [%] 100,0 32,9 26,2 32,2 10,6 102,0 59,4 9,4 6,7
Magn.rec [%v/o] 2,4 0,8 0,6 0,8 0,3 2,5 1,4 0,2 0,2
SiO2 [%] 49,70 2,98 66,40 74,10 57,60 49,90 70,70 58,20 59,40
SiO2 rec [%] 99,6 1,8 34,9 58,5 4,8 100,0 92,6 8,6 5,1
SiO2 rec [%] 100,0 1,8 35,0 58,7 4,8 100,4 93,0 8,6 5,2
SiO2 rec [%v/o] 93,6 1,7 32,8 55,0 4,5 94,0 87,1 8,1 4,8
P [%] 0,24 0,15 0,54 0,14 0,48 0,26 0,28 0,60 0,73
Prec [%] 92,3 17,4 54,4 20,5 7,7 100,0 69,1 17,0 12,1
Prec [%] 100,0 18,9 59,0 22,2 8,3 108,3 74,9 18,5 13,1
Prec [%v/o] 67,7 12,8 39,9 15,0 5,7 73,4 50,7 12,5 8,9
TiO2 [%] 0,20 0,30 0,18 0,13 0,31 0,20 0,15 0,20 0,24
V [%] 0,006 0,010 0,004 0,002 0,007 0,005 0,003 0,004 0,006
d80 [mm] 0,357 0,380 0,106 0,519 - - 0,390 - -
d50 [mm] 0,165 0,204 0,066 0,238 - - 0,151 - -
Spec. Surface [Blaine] 405 115 610 205 - - 347 - -
Spec. Weight [g/cm³] 3,20 5,05 2,87 2,72 - - 2,77 - -
SGA-sample no.: 7451/2-1/1ff Appendix 4.2-2.2
A7451_Blötberget-2015.xlsm/PPT-2-1_CA

Studiengesellschaft für Eisenerzaufbereitung SGA
Nordic Iron Ore AB
Blötberget - 8 t Pilot sample (2015/16)
Rougher stage spiral separation - Pilot scale test
Size distribution of samples taken during test (Phase 2, closed spiral circuit)
Feed
R. Hematite
concentrate
'Material 3'
Tailings A <0.1
mm
Tailings A >0.1
mm
Cyclone
overflowTailings A Tailings B Tailings C
Size Weight / Passing Weight / Passing Weight / Passing Weight / Passing Weight / Passing Weight / Passing Weight / Passing Weight / Passing
mm [%] / [cum. %] [%] / [cum. %] [%] / [cum. %] [%] / [cum. %] [%] / [cum. %] [%] / [cum. %] [%] / [cum. %] [%] / [cum. %]
+ 1,0 0,4 / 99,6 0,0 / 100,0 0,0 / 100,0 0,7 / 99,3 - 0,5 / 99,5 0,2 / 99,8 0,3 / 99,7
1,0 - 0,63 5,4 / 94,2 2,0 / 98,0 0,0 / 100,0 12,1 / 87,2 - 7,9 / 91,7 7,1 / 92,7 14,8 / 84,9
0,63 - 0,5 4,9 / 89,4 3,9 / 94,1 0,0 / 100,0 8,5 / 78,8 - 4,6 / 87,0 5,3 / 87,4 9,2 / 75,7
0,5 - 0,315 12,2 / 77,2 21,7 / 72,4 0,0 / 100,0 16,0 / 62,8 - 11,8 / 75,2 3,7 / 83,7 10,0 / 65,7
0,315 - 0,2 17,6 / 59,6 23,2 / 49,2 0,1 / 99,9 19,0 / 43,7 - 12,0 / 63,2 4,9 / 78,8 5,0 / 60,7
0,2 - 0,1 27,1 / 32,5 32,7 / 16,5 21,1 / 78,8 31,9 / 11,8 - 27,0 / 36,2 31,7 / 47,1 24,3 / 36,4
0,1 - 0,063 12,7 / 19,8 12,7 / 3,9 31,4 / 47,4 5,8 / 6,0 - 17,1 / 19,1 21,4 / 25,7 18,7 / 17,7
0,063 - 0,04 8,2 / 11,6 2,8 / 1,1 23,4 / 24,0 2,7 / 3,3 - 9,4 / 9,7 15,2 / 10,5 11,5 / 6,2
0,04 - 0,025 4,0 / 7,6 0,6 / 0,5 5,5 / 18,5 0,9 / 2,4 - 3,1 / 6,6 4,4 / 6,1 3,1 / 3,1
0,025 - 0 7,6 / 0,0 0,5 / 0,0 18,5 / 0,0 2,4 / 0,0 - 6,6 / 0,0 6,1 / 0,0 3,1 / 0,0
100,0 / - 100,0 / - 100,0 / - 100,0 / - - 100,0 / - 100,0 / - 100,0 / -
d80 [mm] 0,357 0,380 0,106 0,519 - 0,390 0,228 0,560
d50 [mm] 0,165 0,204 0,066 0,238 - 0,151 0,109 0,156
Spec. Surface [Blaine] 405 115 610 205 - 347 - -
Spec. Weight [g/cm³] 3,20 5,05 2,87 2,72 - 2,77 - -
SGA-sample no.: 7451/2-1/1ff Appendix 4.2-2.3
A7451_Blötberget-2015.xlsm/PPT-2-1_SA

Studiengesellschaft für Eisenerzaufbereitung SGA
Nordic Iron Ore AB
Blötberget - 8 t Pilot sample (2015/16)
Rougher stage spiral separation - Pilot scale test
Combined Rougher concentrates
Feed Products Calc. balance
ROM sample
Rougher LIMS
Concentrate
'Material 2'
Rougher
Spiral
Concentrate
'Material 3'
Weight [%] - 62,4 37,6 100,0
Weight [%v/o] 100,0 33,4 20,1 53,5
Fetot [%] 37,60 67,90 66,20 67,26
Ferec [%] - 63,0 37,0 100,0
Ferec [%] - - - -
Ferec [%v/o] 100,0 60,3 35,4 95,7
Magn. by Satm. [%] 30,3 90,5 1,2 56,9
Febound to. Magn. / Fetot [%] - 96,4 1,3 61,2
Magn.rec [%] - 99,2 0,8 100,0
Magn.rec [%] - - - -
Magn.rec [%v/o] 100,0 99,7 0,8 100,5
SiO2 [%] 35,35 3,67 2,98 3,41
SiO2 rec [%] - 67,2 32,8 100,0
SiO2 rec [%] - - - -
SiO2 rec [%v/o] 100,0 3,5 1,7 5,2
P [%] 0,236 0,070 0,150 0,100
Prec [%] - 43,7 56,3 100,0
Prec [%] - - - -
Prec [%v/o] 100,0 9,9 12,8 22,7
TiO2 [%] 0,185 0,098 0,300 0,174
V [%] 0,022 0,050 0,010 0,035
d80 [mm] - 0,455 0,380 0,427
d50 [mm] - 0,192 0,204 0,197
Spec. Surface [Blaine] - 295 115 227
Spec. Weight [g/cm³] - 4,93 5,05 4,98
SGA-sample no.: 7451/1-1/1ff Appendix 4.2-3
A7451_Blötberget-2015.xlsm/Mat2+3

Studiengesellschaft für Eisenerzaufbereitung SGA
Nordic Iron Ore AB
Blötberget - 8 t Pilot sample (2015/16)
Lab scale tests with Rougher LIMS Concentrate - 'Material 2'
Chemical analysis of
Rougher LIMS Conentrate - 'Material 2'
Fetot [%] 67,05
FeO [%] -
SiO2 [%] 4,82
Al2O3 [%] -
CaO [%] -
MgO [%] -
P [%] 0,076
S [%] -
Na2O [%] -
K2O [%] -
Mn [%] -
TiO2 [%] 0,097
V [%] 0,048
L.O.I. [%] -
Magnetite by Satmagan [%] 89,6
Febound to. Magn. / Fetot [%] 96,6
SGA-sample no.: 7451/200 Appendix 5.1-1A7451_Blötberget-2015.xlsm/MAT2_CA

Studiengesellschaft für Eisenerzaufbereitung SGA
Nordic Iron Ore AB
Blötberget - 8 t Pilot sample (2015/16)
Lab scale tests with Rougher LIMS Concentrate - 'Material 2'
Screen metal analysis of
Rougher LIMS Conentrate - 'Material 2'
Size Weight Passing
mm % / cum. %
+ 1,0 0,1 / 99,9
1,0 - 0,63 5,9 / 94,0
0,63 - 0,5 6,3 / 87,7
0,5 - 0,315 14,4 / 73,3
0,315 - 0,2 15,9 / 57,4
0,2 - 0,1 24,3 / 33,1
0,1 - 0,08 5,3 / 27,8
0,08 - 0,063 5,1 / 22,7
0,063 - 0,04 7,5 / 15,2
0,04 - 0,025 4,8 / 10,4
0,025 - 0 10,4 / 0,0
Calculated total 100,0
d80 [mm] 0,401 Blaine [cm²/g] 300,00
d50 [mm] 0,170 Specific density [g/cm³] 4,95
SGA-sample no.: 7451/200 Appendix 5.1-2
0
10
20
30
40
50
60
70
80
90
100
0,010 0,100 1,000
cum
. w
eigh
t p
ass
ing (
%)
grain size (mm)
A7451_Blötberget-2015.xlsm/MAT2_SA

Studiengesellschaft für Eisenerzaufbereitung SGA
Nordic Iron Ore AB
Blötberget - 8 t Pilot sample (2015/16)
Lab scale tests with Rougher LIMS Concentrate - 'Material 2'
Bond Ball Mill Grindability Test with Rougher LIMS Conentrate - 'Material 2'
Cut size 100 µm - 250 % circulation load
Size Feed Mill discharge Product <100 µm
mm % / % passing % / % passing % / % passing
+ 3,15 0,0 / 100,0 0,0 / 100,0
3,15 - 1,6 0,0 / 100,0 0,0 / 100,0
1,6 - 0,63 6,0 / 94,0 0,0 / 100,0
0,63 - 0,315 20,7 / 73,3 0,0 / 100,0
0,315 - 0,16 24,2 / 49,1 17,0 / 83,0
0,16 - 0,1 16,0 / 33,1 49,3 / 33,8 1,1 / 98,9
0,1 - 0,08 5,3 / 27,8 7,3 / 26,4 13,5 / 85,5
0,08 - 0,063 5,1 / 22,7 6,9 / 19,5 22,6 / 62,9
0,063 - 0,04 7,5 / 15,2 7,2 / 12,3 23,1 / 39,8
0,04 - 0,025 4,8 / 10,4 4,1 / 8,2 11,5 / 28,3
0,025 - 0 10,4 / 0,0 8,2 / 0,0 28,3 / 0,0
Weight of the mill feed (700 cm³): 1511,1 g Pi - Grinding fineness of the test: 100 µm
Material
<100 µm
charged
Net
product
<100 µm
(g) (g)
755 35
262 519
258 412
222 435
218 432
215 446
P - d80 of Product = 76 µm
F - d80 of Feed = 401 µm
G - Production rate = 1,38 g/rev
= 20,14 kWh/t(metric system)
SGA-sample no.: 7451/200 Appendix 5.1-3
6 661 320 1,39
7
4 657 316 1,38
5 649 316 1,37
2 781 400 1,30
3 671 303 1,36
(g) (rev) (g/rev)
1 791 100 0,35
Cycle
Material
<100 µm
discharged
Mill
revolutionsProduction rate
��� =�. �
��.� ·
.�· (���.�−�
�.�)
A7451_Blötberget-2015.xlsm/Mat2_Bond

Studiengesellschaft für Eisenerzaufbereitung SGA
Nordic Iron Ore AB
Blötberget - 8 t Pilot sample (2015/16)
Lab scale tests with Rougher LIMS Concentrate - 'Material 2'
Lab scale low intensity magnetic separation
with Rougher LIMS Conentrate - 'Material 2'
3-stage @ 1200 Gauss; after lab rod mill grinding to d80 of ~0.1 mm
Feed Products Calc. balance
Rougher
LIMS Concentrate
'Material 2'
Concentrate Tailings 1
Weight [%] 100,0 91,1 8,9 100,0
Weight [%v/o] 33,4 30,4 3,0 33,4
Fetot [%] 67,05 71,39 23,20 67,10
Ferec [%] 99,9 96,9 3,1 100,0
Ferec [%] 100,0 97,0 3,1 100,1
Ferec [%v/o] 59,5 57,8 1,8 59,6
Magn. by Satm. [%] 89,6 98,5 2,8 90,0
Febound to. Magn. / Fetot [%] 96,6 99,8 8,7 97,0
Magn.rec [%] 99,6 99,7 0,3 100,0
Magn.rec [%] 100,0 100,1 0,3 100,4
Magn.rec [%v/o] 98,7 98,9 0,3 99,2
SiO2 [%] 4,82 0,52 48,20 4,76
SiO2 rec [%] 101,2 9,9 90,1 100,0
SiO2 rec [%] 100,0 9,8 89,0 98,8
SiO2 rec [%v/o] 4,6 0,4 4,1 4,5
P [%] 0,076 0,019 0,805 0,089
Prec [%] 85,4 19,5 80,5 100,0
Prec [%] 100,0 22,8 94,3 117,0
Prec [%v/o] 10,8 2,4 10,1 12,6
TiO2 [%] 0,097 0,085 0,430 0,116
V [%] 0,048 0,055 0,011 0,051
d80 [mm] 0,101 0,097 - -
d50 [mm] 0,062 0,064 - -
Spec. Surface [Blaine] - - - -
Spec. Weight [g/cm³] - - - -
SGA-sample no.: 7451/1-1/1ff Appendix 5.1-4A7451_Blötberget-2015.xlsm/Mat2_BlRibb

Studiengesellschaft für Eisenerzaufbereitung SGA
Nordic Iron Ore AB
Blötberget - 8 t Pilot sample (2015/16)
Cleaner LIMS - Pilot scale test
Process overview
0 Weight Fetot Magn. SiO2 10 Weight Fetot Magn. SiO2 11 Weight Fetot Magn. SiO2 8 Weight Fetot Magn. SiO2
abs. - 67,1 89,6 4,8 0,076 % P abs. - 65,1 84,8 7,0 0,075 % P abs. - 65,8 84,8 6,1 0,067 % P abs. - 70,4 94,0 1,3 0,042 % P
recovery 100,0 100,0 100,0 100,0 0,097 % TiO2 recovery 69,6 67,6 65,9 101,6 0,083 % TiO2 recovery 69,0 67,7 65,3 87,5 0,081 % TiO2 recovery 92,2 96,8 96,7 25,2 0,092 % TiO2
recovery v/o 33,4 59,5 98,7 4,6 0,048 % V recovery v/o 23,3 40,3 65,1 4,6 0,028 % V recovery v/o 23,0 40,3 64,5 4,0 0,029 % V recovery v/o 30,8 57,6 95,5 1,1 0,056 % V
9 Weight Fetot Magn. SiO2 4 Weight Fetot Magn. SiO2 3 Weight Fetot Magn. SiO2 2 Weight Fetot Magn. SiO2
abs. - 67,1 86,2 4,8 0,078 % P abs. - 27,5 11,9 44,8 0,525 % P abs. - 51,5 52,7 16,6 0,480 % P abs. - 70,6 93,9 1,2 0,033 % P
recovery 100,0 100,1 96,2 98,5 0,105 % TiO2 recovery 8,1 3,3 1,1 75,3 0,360 % TiO2 recovery 0,3 0,2 0,2 1,0 0,420 % TiO2 recovery 91,6 96,4 96,0 21,9 0,084 % TiO2
recovery v/o 33,4 59,6 95,0 4,5 0,055 % V recovery v/o 2,7 2,0 1,1 3,4 0,012 % V recovery v/o 0,1 0,1 0,2 0,0 0,038 % V recovery v/o 30,6 57,4 94,8 1,0 0,057 % V
SGA-sample no.: 7451/3-1/1ff Appendix 5.2-1
Cleaner LIMS concentrate 'Material 5'
Rougher LIMS Concentrate 'Material 2' Screen overflow >0.150 mm Ball mill discharge
Screen underflow <0.150 mm Cleaner LIMS 1+2 tailings Cleaner LIMS 3+4 tailings
Cleaner 2 LIMS concentrate
Rougher LIMS Concentrate
'Material 2'542 kg/h
Cleaner LIMS concentrate 'Material
5'Cleaner LIMS 3+4 tailings
Cleaner LIMS 1+2
tailings
Cleaner LIMS 3+4500 Gauss
Cleaner LIMS 1+2600 Gauss
Screen DF74 / 0.15 mm
Ball mill10.1 kWh/t
A7451_Blötberget-2015.xlsm/PPT-3-1_Ov

Studiengesellschaft für Eisenerzaufbereitung SGA
Nordic Iron Ore AB
Blötberget - 8 t Pilot sample (2015/16)
Cleaner LIMS - Pilot scale test
Chemical analysis of samples taken during test
(Feed rate @ 542 kg/h, Derrick screen DF74, Cleaner LIMS 1+2 @ 600 Gauss, Cleaner LIMS 3+4 @ 500 Gauss)
Feed Products Calc. balance Intermediate products
Rougher
LIMS
Concentrate
'Material 2'
Cleaner LIMS
concentrate
'Material 5'
Cleaner LIMS
3+4 tailings
Cleaner LIMS
1+2 tailings
Cleaner
LIMS 2
concentrate
Screen underflow
<0.150 mm
Screen overflow
>0.150 mm
Ball mill
discharge
Weight [%] 100,0 91,6 0,3 8,1 100,0 92,2 100,0 69,6 69,0
Weight [%v/o] 33,4 30,6 0,1 2,7 33,4 30,8 33,4 23,3 23,0
Fetot [%] 67,05 70,55 51,45 27,50 67,00 70,40 67,10 65,11 65,83
Ferec [%] 100,1 96,4 0,2 3,3 100,0 96,9 100,1 67,7 67,8
Ferec [%] 100,0 96,4 0,2 3,3 99,9 96,8 100,1 67,6 67,7
Ferec [%v/o] 59,5 57,4 0,1 2,0 59,5 57,6 59,6 40,3 40,3
Magn. by Satm. [%] 89,6 93,9 52,7 11,9 87,1 94,0 86,2 84,8 84,8
Febound to. Magn. / Fetot [%] 96,6 96,2 74,1 31,3 94,0 96,5 92,9 94,2 93,2
Magn.rec [%] 102,8 98,7 0,2 1,1 100,0 99,5 98,9 67,8 67,2
Magn.rec [%] 100,0 96,0 0,2 1,1 97,2 96,7 96,2 65,9 65,3
Magn.rec [%v/o] 98,7 94,8 0,2 1,1 96,0 95,5 95,0 65,1 64,5
SiO2 [%] 4,82 1,15 16,60 44,80 4,73 1,32 4,75 7,03 6,11
SiO2 rec [%] 101,9 22,3 1,0 76,7 100,0 25,7 100,4 103,5 89,1
SiO2 rec [%] 100,0 21,9 1,0 75,3 98,2 25,2 98,5 101,6 87,5
SiO2 rec [%v/o] 4,6 1,0 0,0 3,4 4,5 1,1 4,5 4,6 4,0
P [%] 0,076 0,033 0,48 0,53 0,074 0,042 0,078 0,075 0,067
Prec [%] 102,5 40,8 1,9 57,3 100,0 52,2 105,2 70,4 62,3
Prec [%] 100,0 39,8 1,9 56,0 97,6 51,0 102,6 68,7 60,8
Prec [%v/o] 10,8 4,3 0,2 6,0 10,5 5,5 11,0 7,4 6,5
TiO2 [%] 0,097 0,084 0,42 0,36 0,107 0,092 0,105 0,083 0,081
V [%] 0,048 0,057 0,038 0,012 0,053 0,056 0,055 0,028 0,029
d80 [mm] 0,401 0,131 - 0,114 - 0,139 0,141 0,653 0,066
d50 [mm] 0,170 0,052 - 0,055 - 0,055 0,059 0,435 0,027
Spec. Surface [Blaine] 300 830 - - - - - - -
Spec. Weight [g/cm³] 4,95 5,09 - - - - - - -
SGA-sample no.: 7451/3-1/1ff Appendix 5.2-2
A7451_Blötberget-2015.xlsm/PPT-3-1_CA

Studiengesellschaft für Eisenerzaufbereitung SGA
Nordic Iron Ore AB
Blötberget - 8 t Pilot sample (2015/16)
Cleaner LIMS - Pilot scale test
Size distribution of samples taken during test
Feed
Cleaner LIMS
concentrate
'Material 5'
Cleaner LIMS
3+4 tailings
Cleaner LIMS
1+2 tailings
Cleaner
LIMS 2
concentrate
Screen
underflow
<0.150 mm
Screen overflow
>0.150 mm
Ball mill
discharge
Size Weight / Passing Weight / Passing Weight / Passing Weight / Passing Weight / Passing Weight / Passing Weight / Passing Weight / Passing
mm [%] / [cum. %] [%] / [cum. %] [%] / [cum. %] [%] / [cum. %] [%] / [cum. %] [%] / [cum. %] [%] / [cum. %] [%] / [cum. %]
+ 1,0 0,1 / 99,9 0,0 / 100,0 0,0 / 100,0 0,0 / 100,0 0,0 / 100,0 0,5 / 99,5 0,0 / 100,0
1,0 - 0,63 5,9 / 94,0 0,0 / 100,0 0,3 / 99,7 0,0 / 100,0 0,0 / 100,0 20,8 / 78,7 0,0 / 100,0
0,63 - 0,5 6,3 / 87,7 0,0 / 100,0 0,2 / 99,5 0,0 / 100,0 0,0 / 100,0 16,4 / 62,3 0,1 / 99,9
0,5 - 0,315 14,4 / 73,3 0,1 / 99,9 0,6 / 98,8 0,1 / 99,9 0,1 / 99,9 34,7 / 27,6 0,3 / 99,6
0,315 - 0,2 15,9 / 57,4 3,3 / 96,6 1,7 / 97,1 3,1 / 96,7 3,9 / 96,0 25,8 / 1,8 1,2 / 98,5
0,2 - 0,1 24,3 / 33,1 24,2 / 72,5 19,8 / 77,3 27,3 / 69,4 27,1 / 68,8 0,8 / 1,0 7,3 / 91,2
0,1 - 0,063 10,4 / 22,7 15,4 / 57,1 19,8 / 57,5 15,0 / 54,4 16,0 / 52,8 0,0 / 0,9 12,1 / 79,1
0,063 - 0,04 7,5 / 15,2 14,4 / 42,7 22,1 / 35,4 13,4 / 41,0 15,8 / 37,0 0,0 / 0,9 16,3 / 62,8
0,04 - 0,025 4,8 / 10,4 11,4 / 31,3 9,9 / 25,5 11,0 / 30,0 9,4 / 27,6 0,0 / 0,8 15,0 / 47,8
0,025 - 0 10,4 / 0,0 31,3 / 0,0 25,5 / 0,0 30,0 / 0,0 27,6 / 0,0 0,8 / 0,0 47,8 / 0,0
100,0 / - 100,0 / - 100,0 / - 100,0 / - 100,0 / - 100,0 / - 100,0 / -
d80 [mm] 0,401 0,131 - 0,114 0,139 0,141 0,653 0,066
d50 [mm] 0,170 0,052 - 0,055 0,055 0,059 0,435 0,027
Spec. Surface [Blaine] 300 830 - - - - - -
Spec. Weight [g/cm³] 4,95 5,09 - - - - - -
SGA-sample no.: 7451/3-1/1ff Appendix 5.2-3
Sam
ple
too f
ew f
or
sctr
een a
nal
ysi
s
A7451_Blötberget-2015.xlsm/PPT-3-1_SA

Studiengesellschaft für Eisenerzaufbereitung SGA
Nordic Iron Ore AB
Blötberget - 8 t Pilot sample (2015/16)
Cleaner LIMS - Pilot scale test
Chemical analysis of
Product pile - Cleaner LIMS concentrate - 'Material 5'
Fetot [%] 70,45
FeO [%] 29,18
SiO2 [%] 1,31
Al2O3 [%] 0,24 Cr [%] 0,003
CaO [%] 0,21 Co [%] 0,0018
MgO [%] 0,21 Ni [%] 0,004
P [%] 0,039 Cu [%] 0,0006
S [%] 0,002 Zn [%] 0,006
Na2O [%] 0,016 Pb [%] <0,0005
K2O [%] 0,02 As [%] <0,0005
Mn [%] 0,058 Cd [%] <0,0005
TiO2 [%] 0,083 Tl [%] <0,001
V [%] 0,054 SrO [%] 0,003
L.O.I. [%] - 3,08 BaO [%] 0,015
Magnetite by Satmagan [%] 93,6
Febound to. Magn. / Fetot [%] 96,1
SGA-sample no.: 7451/500 Appendix 5.2-4A7451_Blötberget-2015.xlsm/MAT5_CA

Studiengesellschaft für Eisenerzaufbereitung SGA
Nordic Iron Ore AB
Blötberget - 8 t Pilot sample (2015/16)
Cleaner LIMS - Pilot scale test
Screen analysis of
Product pile - Cleaner LIMS concentrate - 'Material 5'
Size Weight Passing
mm % / cum. %
+ 1,0 0,0 / 100,0
1,0 - 0,63 0,0 / 100,0
0,63 - 0,5 0,1 / 99,8
0,5 - 0,315 0,2 / 99,6
0,315 - 0,2 5,6 / 94,0
0,2 - 0,1 23,6 / 70,3
0,1 - 0,063 17,1 / 53,2
0,063 - 0,04 12,8 / 40,4
0,04 - 0,025 4,2 / 36,2
0,025 - 0 36,2 / 0,0
Calculated total 100,0
d80 [mm] 0,141 Blaine [cm²/g] 965
d50 [mm] 0,057 Specific density [g/cm³] 5,10
SGA-sample no.: 7451/500 Appendix 5.2-5
0
10
20
30
40
50
60
70
80
90
100
0,010 0,100 1,000
cum
. w
eigh
t p
ass
ing (
%)
grain size (mm)
A7451_Blötberget-2015.xlsm/MAT5_SA

Studiengesellschaft für Eisenerzaufbereitung SGA
Nordic Iron Ore AB
Blötberget - 8 t Pilot sample (2015/16)
Cleaner LIMS - Pilot scale test
Screen metal analysis of
Product pile - Cleaner LIMS concentrate - 'Material 5'
Size Weight Passing Fetot SiO2 P TiO2 V
mm % / cum. % [%] [%] [%] [%] [%]
+ 0,2 4,7 / 95,3
0,2 - 0,1 25,3 / 70,0
0,1 - 0,063 15,8 / 54,2
0,063 - 0,04 12,2 / 42,0 71,1 0,7 0,019 0,081 0,051
0,04 - 0 42,0 / 0,0 71,3 0,5 0,009 0,050 0,039
Calculated total 100,0 70,4 1,3 0,037 0,088 0,053
d80 [mm] 0,140 Blaine [cm²/g] -
d50 [mm] 0,055 Specific density [g/cm³] -
SGA-sample no.: 7451/500B/501ff Appendix 5.2-6
69,4 2,2 0,067 0,124 0,067
0
10
20
30
40
50
60
70
80
90
100
0,010 0,100 1,000
cum
. w
eigh
t p
ass
ing (
%)
grain size (mm)
A7451_Blötberget-2015.xlsm/MAT5_SMA

Studiengesellschaft für Eisenerzaufbereitung SGA
Nordic Iron Ore AB
Blötberget - 8 t Pilot sample (2015/16)
Regrinding of rougher stage spiral concentrates
Process overview
0 Weight Fetot Magn. SiO2 5 Weight Fetot Magn. SiO2
abs. - (66,2) ( 1,2) ( 3,0) (0,15 % P) abs. - - - - -
recovery 100,0 - - - (0,30 % TiO2) recovery 68,4 - - - -
recovery v/o 20,1 (35,4) ( 0,8) ( 1,7) (0,010 % V) recovery v/o 13,8 - - - -
2 Weight Fetot Magn. SiO2 4 Weight Fetot Magn. SiO2
abs. - (66,2) ( 1,2) ( 3,0) (0,15 % P) abs. - - - - -
recovery 100,0 - - - (0,30 % TiO2) recovery 68,4 - - - -
recovery v/o 20,1 (35,4) ( 0,8) ( 1,7) (0,010 % V) recovery v/o 13,8 - - - -
SGA-sample no.: 7451/3-1/1ff Appendix 6-1
Rougher Hematite concentrate 'Material 3'
Screen overflow >0.150 mm
Ball mill discharge
Screen underflow <0.150 mm
Rougher Hematite concentrate 'Material 3'200 kg/h
Screen underflow
<0.150 mm
Screen DF74 / 0.15 mm
Ball mill10.0 kWh/t
A7451_Blötberget-2015.xlsm/PPT-4-1_Ov

Studiengesellschaft für Eisenerzaufbereitung SGA
Nordic Iron Ore AB
Blötberget - 8 t Pilot sample (2015/16)
Regrinding of rougher stage spiral concentrates
Size distribution of samples taken during test
Feed Product Intermediate products
FeedScreen underflow
<0.150 mm
Screen overflow
>0.150 mm
Ball mill
discharge
Weight [%] 100,0 100,0 68,4 68,4
Weight [%v/o] 20,1 20,1 13,8 13,8
Size Weight / Passing Weight / Passing Weight / Passing Weight / Passing
mm [%] / [cum. %] [%] / [cum. %] [%] / [cum. %] [%] / [cum. %]
+ 1,0 0,0 / 100,0 0,0 / 100,0 0,0 / 100,0 0,0 / 100,0
1,0 - 0,63 2,0 / 98,0 0,0 / 100,0 3,9 / 96,1 0,0 / 100,0
0,63 - 0,5 3,9 / 94,1 0,0 / 100,0 6,7 / 89,4 0,1 / 99,9
0,5 - 0,315 21,7 / 72,4 0,0 / 100,0 22,0 / 67,3 0,2 / 99,8
0,315 - 0,2 23,2 / 49,2 4,2 / 95,8 36,7 / 30,7 0,9 / 98,9
0,2 - 0,1 32,7 / 16,5 32,0 / 63,8 10,8 / 19,8 9,0 / 89,9
0,1 - 0,063 12,7 / 3,9 17,6 / 46,2 2,5 / 17,3 16,9 / 72,9
0,063 - 0,04 2,8 / 1,1 13,5 / 32,7 1,1 / 16,3 19,8 / 53,1
0,04 - 0,025 0,6 / 0,5 8,4 / 24,3 0,7 / 15,5 13,8 / 39,4
0,025 - 0 0,5 / 0,0 24,3 / 0,0 15,5 / 0,0 39,4 / 0,0
100,0 / - 100,0 / - 100,0 / - 100,0 / -
d80 [mm] 0,380 0,151 0,421 0,078
d50 [mm] 0,204 0,071 0,261 0,037
Spec. Surface [Blaine] 120 715 - -
Spec. Weight [g/cm³] 5,09 5,09 - -
SGA-sample no.: 7451/3-1/1ff Appendix 6-2A7451_Blötberget-2015.xlsm/PPT-4-1_SA

Studiengesellschaft für Eisenerzaufbereitung SGA
Nordic Iron Ore AB
Blötberget - 8 t Pilot sample (2015/16)
Regrinding of rougher stage spiral concentrates
Bond Ball Mill Grindability Test with Rougher LIMS Conentrate - 'Material 2'
Cut size 100 µm - 250 % circulation load
Size Feed Mill discharge Product <100 µm
mm % / % passing % / % passing % / % passing
+ 3,15 0,0 / 100,0 0,0 / 100,0
3,15 - 1,0 0,0 / 100,0 0,0 / 100,0
1,0 - 0,63 2,3 / 97,6 0,1 / 99,9
0,63 - 0,315 23,6 / 74,0 1,2 / 98,8
0,315 - 0,16 43,4 / 30,6 17,0 / 81,8
0,16 - 0,1 16,4 / 14,2 44,7 / 37,1 1,6 / 98,4
0,1 - 0,08 4,1 / 10,2 8,7 / 28,4 18,4 / 80,0
0,08 - 0,063 5,4 / 4,8 7,7 / 20,7 25,7 / 54,3
0,063 - 0,04 3,3 / 1,5 6,6 / 14,2 22,0 / 32,3
0,04 - 0,025 0,3 / 1,2 3,2 / 11,0 9,3 / 23,1
0,025 - 0 1,2 / 0,0 11,0 / 0,0 23,1 / 0,0
Weight of the mill feed (700 cm³): 1511,1 g Pi - Grinding fineness of the test: 100 µm
Material
<100 µm
charged
Net
product
<100 µm
(g) (g)
70 500
81 525
86 544
90 484
81 532
87 510
85 515
P - d80 of Product = 80 µm
F - d80 of Feed = 395 µm
G - Production rate = 1,12 g/rev
= 25,24 kWh/t(metric system)
SGA-sample no.: 7451/300 or /2-1/100 Appendix 6-3
Cycle
Material
<100 µm
discharged
Mill
revolutionsProduction rate
(g) (rev) (g/rev)
3 570 460 1,09
4 606 478 1,10
5 631 469 1,16
6 573 441 1,10
7 613 473 1,12
8 597 458 1,12
9 599 463 1,11
��� =�. �
��.� ·
.�· (���.�−�
�.�)
A7451_Blötberget-2015.xlsm/Mat3_Bond

Studiengesellschaft für Eisenerzaufbereitung SGA
Nordic Iron Ore AB
Blötberget - 8 t Pilot sample (2015/16)
Lab scale tests with rougher stage spiral tailings
Lab scale tests - Wet high intensity magnetic separation (WHIMS)
with Rougher Spiral Tailings A <0.1 mm
Feed Products Calc. balance
Tailings A
<0.1 mmConcentrate Middlings Tailings
Weight [%] 100,0 10,3 5,0 84,7 100,0
Weight [%v/o] 17,5 1,8 0,9 14,8 17,5
Fetot [%] 10,10 51,70 18,30 4,50 10,05
Ferec [%] 100,5 52,9 9,2 37,9 100,0
Ferec [%] 100,0 52,6 9,1 37,7 99,5
Ferec [%v/o] 4,7 2,5 0,4 1,8 4,7
Magn. by Satm. [%] 1,2 - - - -
Febound to. Magn. / Fetot [%] 8,6 - - - -
Magn.rec [%] - - - - -
Magn.rec [%] - - - - -
Magn.rec [%v/o] 0,7 - - - -
SiO2 [%] 66,00 15,30 55,00 72,10 65,40
SiO2 rec [%] 100,9 2,4 4,2 93,4 100,0
SiO2 rec [%] 100,0 2,4 4,2 92,5 99,1
SiO2 rec [%v/o] 32,6 0,8 1,4 30,1 32,3
P [%] 0,53 0,84 0,57 0,47 0,51
Prec [%] 103,3 16,8 5,6 77,6 100,0
Prec [%] 100,0 16,3 5,4 75,1 96,8
Prec [%v/o] 39,2 6,4 2,1 29,4 37,9
TiO2 [%] 0,180 0,500 0,270 0,140 0,184
V [%] 0,004 0,012 0,006 0,003 0,004
d80 [mm] 0,106 - - - -
d50 [mm] 0,066 - - - -
Spec. Surface [Blaine] - - - - -
Spec. Weight [g/cm³] - - - - -
SGA-sample no.: 7451/2-1/200/700..702 Appendix 7.1-1A7451_Blötberget-2015.xlsm/Scav-WHIMS

Studiengesellschaft für Eisenerzaufbereitung SGA
Nordic Iron Ore AB
Blötberget - 8 t Pilot sample (2015/16)
Lab scale tests with rougher stage spiral tailings
Lab scale tests - Upstream separation (Hindered settling)
with Rougher Spiral Tailings A <0.1 mm
The Test was aported because of obvious failure.
Weight recovery until abortion:
Feed Products Calc. balance
Tailings A
<0.1 mm
Overflow
Stage 1
Overflow
Stage 2Sediment
Weight [%] 100,0 32,8 7,2 60,0 100,0
Weight [%v/o] 17,5 5,7 1,2 10,5 17,5
SGA-sample no.: 7451/2-1/200/ Appendix 7.1-2
A7451_Blötberget-2015.xlsm/Scav-UpSTR

Studiengesellschaft für Eisenerzaufbereitung SGA
Nordic Iron Ore AB
Blötberget - 8 t Pilot sample (2015/16)
Lab scale tests with rougher stage spiral tailings
Shaking table test
with Rougher Spiral Tailings A <0.1 mm
Feed Products Calc. balance
Rougher
LIMS Tailings
'Material 1'
Concentrate Middlings Tailings
Weight [%] 100,0 6,3 78,2 15,5 100,0
Weight [%v/o] 17,5 1,1 13,7 2,7 17,5
Fetot [%] 10,10 62,20 6,05 8,00 9,86
Ferec [%] 102,4 39,4 48,0 12,6 100,0
Ferec [%] 100,0 38,5 46,9 12,3 97,7
Ferec [%v/o] 4,7 1,8 2,2 0,6 4,6
Magn. by Satm. [%] 1,2 3,0 0,9 1,3 1,1
Febound to. Magn. / Fetot [%] 8,6 3,5 10,8 11,7 8,0
Magn.rec [%] 109,8 17,2 64,4 18,4 100,0
Magn.rec [%] 100,0 15,6 58,7 16,8 91,1
Magn.rec [%v/o] 0,7 0,1 0,4 0,1 0,6
SiO2 [%] 66,00 5,27 71,30 63,00 65,88
SiO2 rec [%] 100,2 0,5 84,7 14,8 100,0
SiO2 rec [%] 100,0 0,5 84,5 14,8 99,8
SiO2 rec [%v/o] 32,6 0,2 27,5 4,8 32,5
P [%] 0,530 0,580 0,560 0,350 0,529
Prec [%] 100,2 6,9 82,9 10,3 100,0
Prec [%] 100,0 6,8 82,7 10,2 99,8
Prec [%v/o] 39,2 2,7 32,4 4,0 39,1
TiO2 [%] 0,180 0,510 0,145 0,240 0,183
V [%] 0,004 0,012 0,003 0,005 0,004
d80 [mm] 0,106 0,074 0,099 0,069 -
d50 [mm] 0,066 0,050 0,073 0,038 -
Spec. Surface [Blaine] - - - - -
Spec. Weight [g/cm³] - - - - -
SGA-sample no.: 7451/1-1/1ff Appendix 7.1-3.1A7451_Blötberget-2015.xlsm/ScavTable_CA

Studiengesellschaft für Eisenerzaufbereitung SGA
Nordic Iron Ore AB
Blötberget - 8 t Pilot sample (2015/16)
Lab scale tests with rougher stage spiral tailings
Size distribution of products from shaking table test with Rougher Spiral Tailings A <0.1 mm
Feed Concentrate Middlings Tailings
Size Weight / Passing Weight / Passing Weight / Passing Weight / Passing
mm [%] / [cum. %] [%] / [cum. %] [%] / [cum. %] [%] / [cum. %]
+ 1,0 0,0 / 100,0 0,1 / 99,9 0,0 / 100,0 0,0 / 100,0
1,0 - 0,63 0,0 / 100,0 0,2 / 99,7 0,0 / 100,0 0,0 / 100,0
0,63 - 0,5 0,0 / 100,0 0,2 / 99,5 0,0 / 99,9 0,0 / 100,0
0,5 - 0,315 0,0 / 100,0 0,8 / 98,8 0,0 / 99,9 0,0 / 100,0
0,315 - 0,2 0,1 / 99,9 0,9 / 97,9 0,2 / 99,7 0,1 / 99,9
0,2 - 0,1 21,1 / 78,8 5,8 / 92,1 18,2 / 81,4 3,2 / 96,8
0,1 - 0,063 31,4 / 47,4 17,2 / 74,8 43,6 / 37,8 20,1 / 76,7
0,063 - 0,04 23,4 / 24,0 43,5 / 31,4 3,2 / 34,5 25,2 / 51,4
0,04 - 0,025 5,5 / 18,5 14,7 / 16,7 12,7 / 21,8 11,0 / 40,5
0,025 - 0 18,5 / 0,0 16,7 / 0,0 21,8 / 0,0 40,5 / 0,0
100,0 / - 100,0 / - 100,0 / - 100,0 / -
d80 [mm] 0,106 0,074 0,099 0,069
d50 [mm] 0,066 0,050 0,073 0,038
Spec. Surface [Blaine] - - - -
Spec. Weight [g/cm³] - - - -
SGA-sample no.: 7451/1-1/1ff Appendix 7.1-3.2A7451_Blötberget-2015.xlsm/ScavTable_SA

Studiengesellschaft für Eisenerzaufbereitung SGA
Nordic Iron Ore AB
Blötberget - 8 t Pilot sample (2015/16)
Iron recovery in Scavenger stage
Composition and chemical analysis of
Scavenger stage feed
% Tailings A
<0.1 mm
Cleaner LIMS
tailings
Scavenger stage
spirals feed
Calculated Analysed
Weight [%v/o] 17,5 2,8 20,3
[%] 86,2 13,8 100,0
Fetot [%] 10,1 31,90 13,11 12,90
FeO [%] - - - -
SiO2 [%] 66,0 40,10 62,43 62,50
Al2O3 [%] - - - -
CaO [%] - - - -
MgO [%] - - - -
P [%] 0,530 0,550 0,533 0,540
S [%] - - - -
Na2O [%] - - - -
K2O [%] - - - -
Mn [%] - - - -
TiO2 [%] 0,18 0,500 0,224 0,230
V [%] 0,0035 0,019 0,006 0,002
L.O.I. [%] - - - -
Magnetite by Satmagan [%] 1,2 14,4 3,0 3,1
Febound to. Magn. / Fetot [%] 8,6 32,6 16,7 17,4
SGA-sample no.: 7451/650 Appendix 7.2-1
A7451_Blötberget-2015.xlsm/MAT65_CA
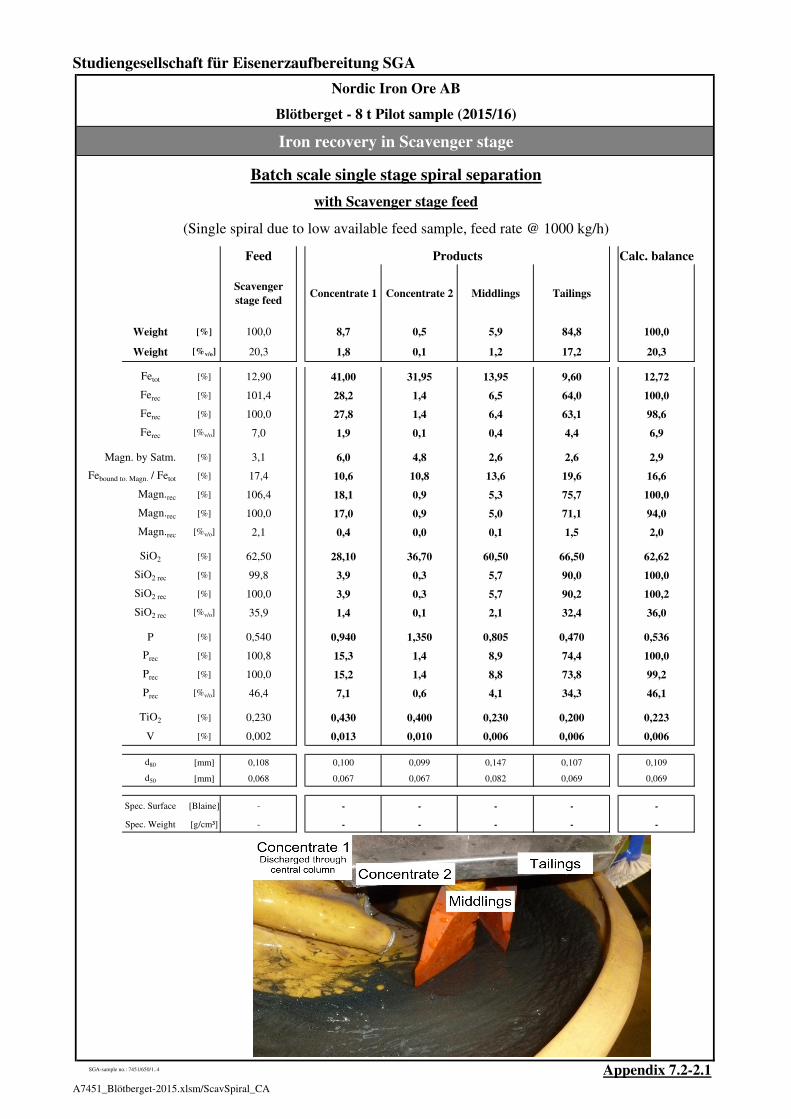
Studiengesellschaft für Eisenerzaufbereitung SGA
Nordic Iron Ore AB
Blötberget - 8 t Pilot sample (2015/16)
Iron recovery in Scavenger stage
Batch scale single stage spiral separation
with Scavenger stage feed
(Single spiral due to low available feed sample, feed rate @ 1000 kg/h)
Feed Products Calc. balance
Scavenger
stage feedConcentrate 1 Concentrate 2 Middlings Tailings
Weight [%] 100,0 8,7 0,5 5,9 84,8 100,0
Weight [%v/o] 20,3 1,8 0,1 1,2 17,2 20,3
Fetot [%] 12,90 41,00 31,95 13,95 9,60 12,72
Ferec [%] 101,4 28,2 1,4 6,5 64,0 100,0
Ferec [%] 100,0 27,8 1,4 6,4 63,1 98,6
Ferec [%v/o] 7,0 1,9 0,1 0,4 4,4 6,9
Magn. by Satm. [%] 3,1 6,0 4,8 2,6 2,6 2,9
Febound to. Magn. / Fetot [%] 17,4 10,6 10,8 13,6 19,6 16,6
Magn.rec [%] 106,4 18,1 0,9 5,3 75,7 100,0
Magn.rec [%] 100,0 17,0 0,9 5,0 71,1 94,0
Magn.rec [%v/o] 2,1 0,4 0,0 0,1 1,5 2,0
SiO2 [%] 62,50 28,10 36,70 60,50 66,50 62,62
SiO2 rec [%] 99,8 3,9 0,3 5,7 90,0 100,0
SiO2 rec [%] 100,0 3,9 0,3 5,7 90,2 100,2
SiO2 rec [%v/o] 35,9 1,4 0,1 2,1 32,4 36,0
P [%] 0,540 0,940 1,350 0,805 0,470 0,536
Prec [%] 100,8 15,3 1,4 8,9 74,4 100,0
Prec [%] 100,0 15,2 1,4 8,8 73,8 99,2
Prec [%v/o] 46,4 7,1 0,6 4,1 34,3 46,1
TiO2 [%] 0,230 0,430 0,400 0,230 0,200 0,223
V [%] 0,002 0,013 0,010 0,006 0,006 0,006
d80 [mm] 0,108 0,100 0,099 0,147 0,107 0,109
d50 [mm] 0,068 0,067 0,067 0,082 0,069 0,069
Spec. Surface [Blaine] - - - - - -
Spec. Weight [g/cm³] - - - - - -
SGA-sample no.: 7451/650/1..4 Appendix 7.2-2.1
A7451_Blötberget-2015.xlsm/ScavSpiral_CA

Studiengesellschaft für Eisenerzaufbereitung SGA
Nordic Iron Ore AB
Blötberget - 8 t Pilot sample (2015/16)
Iron recovery in Scavenger stage
Size distribution of products from Scavenger stage spiral separation test
Feed Concentrate 1 Concentrate 2 Middlings Tailings
Size Weight / Passing Weight / Passing Weight / Passing Weight / Passing Weight / Passing
mm [%] / [cum. %] [%] / [cum. %] [%] / [cum. %] [%] / [cum. %] [%] / [cum. %]
+ 1,0 0,0 / 100,0 0,0 / 100,0 0,0 / 100,0 0,0 / 100,0 0,0 / 100,0
1,0 - 0,63 0,2 / 99,8 0,4 / 99,6 0,3 / 99,7 0,6 / 99,4 0,0 / 100,0
0,63 - 0,5 0,2 / 99,7 0,5 / 99,1 0,2 / 99,5 0,5 / 98,9 0,1 / 99,9
0,5 - 0,315 0,2 / 99,5 1,5 / 97,6 0,4 / 99,1 1,0 / 97,9 0,1 / 99,9
0,315 - 0,2 0,6 / 98,9 2,7 / 94,9 0,8 / 98,3 1,6 / 96,2 0,3 / 99,6
0,2 - 0,1 20,5 / 78,4 14,5 / 80,4 17,7 / 80,6 30,5 / 65,8 21,1 / 78,6
0,1 - 0,063 32,7 / 45,7 33,8 / 46,6 34,2 / 46,5 31,7 / 34,1 33,7 / 44,9
0,063 - 0,04 23,1 / 22,5 3,1 / 43,5 29,8 / 16,7 19,9 / 14,2 23,8 / 21,1
0,04 - 0,025 9,2 / 13,4 24,2 / 19,4 5,4 / 11,3 9,4 / 4,8 12,2 / 8,9
0,025 - 0 13,4 / 0,0 19,4 / 0,0 11,3 / 0,0 4,8 / 0,0 8,9 / 0,0
100,0 / - 100,0 / - 100,0 / - 100,0 / - 100,0 / -
d80 [mm] 0,108 0,100 0,099 0,147 0,107
d50 [mm] 0,068 0,067 0,067 0,082 0,069
Spec. Surface [Blaine] - - - - -
Spec. Weight [g/cm³] - - - - -
SGA-sample no.: 7451/650/1..4 Appendix 7.2-2.2A7451_Blötberget-2015.xlsm/ScavSpiral_SA

Studiengesellschaft für Eisenerzaufbereitung SGA
Nordic Iron Ore AB
Blötberget - 8 t Pilot sample (2015/16)
Iron recovery in Scavenger stage
Screen metal analysis of
Scavenger stage feed
Size Weight Passing Fetot SiO2 P TiO2 V
mm % / cum. % [%] [%] [%] [%] [%]
+ 1,0 0,0 / 100,0
1,0 - 0,63 0,2 / 99,8
0,63 - 0,5 0,2 / 99,7
0,5 - 0,315 0,2 / 99,5
0,315 - 0,2 0,6 / 98,9
0,2 - 0,1 20,5 / 78,4
0,1 - 0,063 32,7 / 45,7 6,9 69,3 0,540 0,155 0,0035
0,063 - 0,04 23,1 / 22,5 14,0 60,0 0,700 0,250 0,0055
0,04 - 0,025 9,2 / 13,4 24,1 47,9 0,760 0,340 0,0078
0,025 - 0 13,4 / 0,0 34,9 35,7 0,610 0,495 0,0160
Calculated total 100,0 13,5 61,2 0,556 0,234 0,0059
d80 [mm] 0,108 Blaine [cm²/g] -
d50 [mm] 0,068 Specific density [g/cm³] -
SGA-sample no.: 7451/650 Appendix 7.2-3
5,3 71,5 0,305 0,130 0,0030
0
10
20
30
40
50
60
70
80
90
100
0,010 0,100 1,000
cum
. w
eigh
t p
ass
ing (
%)
grain size (mm)
A7451_Blötberget-2015.xlsm/MAT65_SMA

Studiengesellschaft für Eisenerzaufbereitung SGA
Nordic Iron Ore AB
Blötberget - 8 t Pilot sample (2015/16)
Iron recovery in Scavenger stage
Sink float analysis
with Scavenger stage feed
Screen metal Analysis
Weight / Passing Fe Ferec. Ferec./feed SiO2 P TiO2 V
[%] [cum. %] [%] [%] [%] [%] [%] [%] [%]
+ 1,0 0,0 / 100,0
1,0 - 0,1 21,6 / 78,4 5,3 8,5 71,5 0,305 0,130 0,0030
0,1 - 0,063 32,7 / 45,7 6,9 16,7 69,3 0,540 0,155 0,0035
0,063 - 0,04 23,1 / 22,5 14,0 24,0 60,0 0,700 0,250 0,0055
0,04 - 0,0 22,5 / 0,0 30,5 50,9 40,7 0,671 0,432 0,0127
100,0 13,5 100,0 61,2 0,556 0,234 0,0059
d80 [µm] = 108 Analysis of basis 12,9 62,5 0,540 0,230 0,0020
Sink float analysis
Fraction > 0,1 mm
weight rec. Fe Ferec. Ferec./feed SiO2 P TiO2 V
[%] [%] [%] [%] [%] [%] [%] [%] [%]
> 3,3 3,4 0,7 67,7 42,1 3,6 1,7 0,088 0,450 0,0190
3,3 - 2,7 17,7 3,8 15,8 50,8 4,3 40,4 1,510 0,430 0,0120
< 2,7 78,9 17,0 0,5 7,2 0,6 81,3 0,007 0,035 <0.005
100,0 21,6 5,5 100,0 8,5 71,3 0,276 0,119
Fraction 0,1 - 0,063 mm
weight rec. Fe Ferec. Ferec./feed SiO2 P TiO2 V
[%] [%] [%] [%] [%] [%] [%] [%] [%]
> 3,3 5,0 1,6 67,5 49,1 8,2 1,8 0,096 0,680 0,0170
3,3 - 2,7 10,6 3,5 22,1 34,2 5,7 27,4 4,210 0,460 0,0120
< 2,7 84,4 27,6 1,4 16,7 2,8 79,0 0,072 0,082 <0.005
100,0 32,7 6,8 100,0 16,7 69,7 0,512 0,152
Fraction 0,063 - 0,04 mm
weight rec. Fe Ferec. Ferec./feed SiO2 P TiO2 V
[%] [%] [%] [%] [%] [%] [%] [%] [%]
> 3,3 14,1 3,3 68,1 68,5 16,4 0,9 0,145 0,720 0,0170
3,3 - 2,7 6,9 1,6 39,2 19,4 4,6 15,4 3,330 0,720 0,0130
< 2,7 78,9 18,3 2,2 12,1 2,9 75,0 0,540 0,115 <0.005
100,0 23,1 14,0 100,0 24,0 60,4 0,678 0,242
Summary of Fractions 1,0 - 0,1 mm
weight rec. Fe Ferec./feed SiO2 P TiO2 V
[%] [%] [%] [%] [%] [%] [%]
> 3,3 5,6 67,9 28,2 1,3 0,123 0,673 0,0173
3,3 - 2,7 8,9 22,5 14,7 30,8 2,892 0,494 0,0122
< 2,7 62,9 1,4 6,3 78,5 0,190 0,079 <0.005
77,5 8,6 49,1 67,4 0,496 0,170
SGA-sample no.: 7451/650/50x/601…609 Appendix 7.2-4
kg/l
mm
kg/l
kg/l
kg/l
A7451_Blötberget-2015.xlsm/Mat65SinkFloat

Studiengesellschaft für Eisenerzaufbereitung SGA
Nordic Iron Ore AB
Blötberget - 8 t Pilot sample (2015/16)
Iron recovery in Scavenger stage
Lab scale flotation test #S1
Silica flotation with Scavenger stage feed
Flotation procedure
Condition.FlotationCumulated
Dosage time time flot. time pH
[g/t] [min] [min] [min]
Stage 1 Flotigam EDA 80 2,0 2,0 2,0 8,4
Stage 2 Flotigam EDA 50 2,0 1,5 3,5 8,4
Stage 3 Flotigam EDA 50 2,0 1,0 4,5 8,4
Stage 4 Flotigam EDA 50 2,0 1,0 5,5 8,3
weight v/o Fe Ferec. Ferec. SiO2 SiO2 rec SiO2 rec P TiO2 V
[%] [%v/o] [%] [%] [%v/o] [%] [%] [%v/o] [%] [%] [%]
Test sample: Scavenger stage feed
Feed 100,0 20,3 12,9 100,0 7,0 62,50 100,0 35,9 0,54 0,23 0,002
Weight recovery and composition of products
Froth 1 32,0 6,5 13,3 33,3 2,3 61,00 31,5 11,2 0,47 0,26 0,006
Froth 2 33,9 6,9 11,4 30,2 2,1 65,40 35,8 12,7 0,52 0,18 0,004
Froth 3 20,5 4,2 10,8 17,4 1,2 64,50 21,3 7,6 0,62 0,17 0,004
Froth 4 8,2 1,7 12,9 8,3 0,6 58,20 7,7 2,8 0,68 0,24 0,006
Concentrate 5,3 1,1 25,8 10,8 0,7 42,90 3,7 1,3 0,54 0,46 0,018
Calc. balance 100,0 20,3 12,7 100,0 6,9 62,02 100,0 35,6 0,54 0,22 0,006
Calculation of remaining concentrate after respective flotation stage
weight v/o Fe Ferec. Ferec. SiO2 SiO2 rec SiO2 rec P TiO2 V
[%] [%v/o] [%] [%] [%v/o] [%] [%] [%v/o] [%] [%] [%]
Calc. balance 100,0 20,3 12,7 100,0 6,9 62,02 100,0 35,6 0,54 0,22 0,006
after Stage 1 68,0 13,8 12,49 66,7 4,6 62,50 68,5 24,4 0,57 0,21 0,005
after Stage 2 34,1 6,9 13,63 36,5 2,5 59,61 32,7 11,7 0,62 0,23 0,007
after Stage 3 13,6 2,8 17,92 19,1 1,3 52,21 11,4 4,1 0,63 0,32 0,011
after Stage 4 5,3 1,1 25,80 10,8 0,7 42,90 3,7 1,3 0,54 0,46 0,018
Feed 100,0 20,3 12,9 100,0 7,0 62,50 100,0 35,9 0,54 0,23 0,002
after Stage 1 68,0 13,8 12,7 67,1 4,7 63,21 68,8 24,7 0,57 0,22 0,000
after Stage 2 34,1 6,9 13,4 35,4 2,5 62,11 33,8 12,1 0,60 0,23 -0,002
after Stage 3 13,6 2,8 15,0 15,8 1,1 60,67 13,2 4,7 0,59 0,27 -0,005
after Stage 4 5,3 1,1 16,3 6,7 0,5 62,18 5,3 1,9 0,53 0,29 -0,012
7451/650/802/1..5 Appendix 7.2-5
Reagent
A7451_Blötberget-2015.xlsm/Flot2
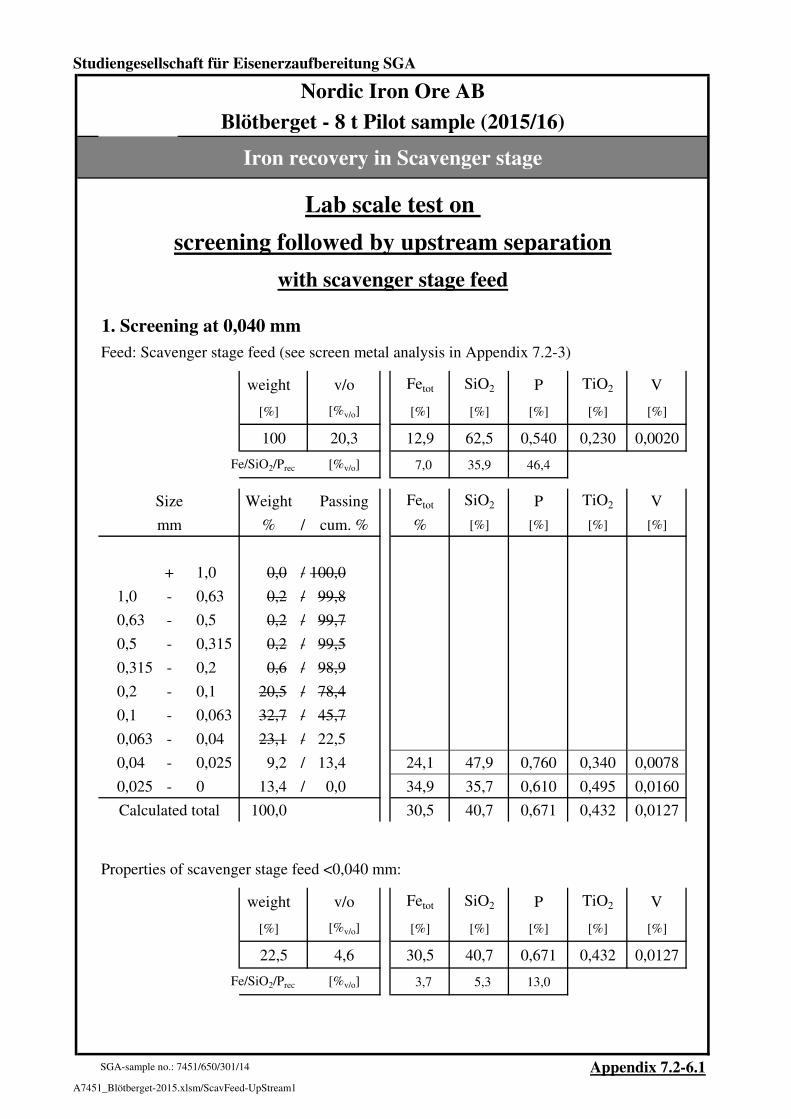
Studiengesellschaft für Eisenerzaufbereitung SGA
Nordic Iron Ore AB
Blötberget - 8 t Pilot sample (2015/16)
Iron recovery in Scavenger stage
Lab scale test on
screening followed by upstream separation
with scavenger stage feed
1. Screening at 0,040 mm
Feed: Scavenger stage feed (see screen metal analysis in Appendix 7.2-3)
weight v/o Fetot SiO2 P TiO2 V
[%] [%v/o] [%] [%] [%] [%] [%]
100 20,3 12,9 62,5 0,540 0,230 0,0020
Fe/SiO2/Prec [%v/o] 7,0 35,9 46,4
Size Weight Passing Fetot SiO2 P TiO2 V
mm % / cum. % % [%] [%] [%] [%]
+ 1,0 0,0 / 100,0
1,0 - 0,63 0,2 / 99,8
0,63 - 0,5 0,2 / 99,7
0,5 - 0,315 0,2 / 99,5
0,315 - 0,2 0,6 / 98,9
0,2 - 0,1 20,5 / 78,4
0,1 - 0,063 32,7 / 45,7
0,063 - 0,04 23,1 / 22,5
0,04 - 0,025 9,2 / 13,4 24,1 47,9 0,760 0,340 0,0078
0,025 - 0 13,4 / 0,0 34,9 35,7 0,610 0,495 0,0160
Calculated total 100,0 30,5 40,7 0,671 0,432 0,0127
Properties of scavenger stage feed <0,040 mm:
weight v/o Fetot SiO2 P TiO2 V
[%] [%v/o] [%] [%] [%] [%] [%]
22,5 4,6 30,5 40,7 0,671 0,432 0,0127
Fe/SiO2/Prec [%v/o] 3,7 5,3 13,0
SGA-sample no.: 7451/650/301/14 Appendix 7.2-6.1
A7451_Blötberget-2015.xlsm/ScavFeed-UpStream1

Studiengesellschaft für Eisenerzaufbereitung SGA
Nordic Iron Ore AB
Blötberget - 8 t Pilot sample (2015/16)
Iron recovery in Scavenger stage
Lab scale test on
screening followed by upstream separation
with scavenger stage feed
2. Upstream separation with Scavenger stage feed <0,040 mm
Test sample: Scavenger stage feed <0,040 mm
weight v/o Fe Ferec. Ferec. SiO2 SiO2 rec SiO2 rec P TiO2 V
[%] [%v/o] [%] [%] [%v/o] [%] [%] [%v/o] [%] [%] [%]
Feed 100,0 4,6 30,5 100,0 3,7 40,67 100,0 5,3 0,67 0,43 0,013
Upstream separation procedure
Upstream Duration Cumulated
velocity of stage time
[mm/s] [min] [min]
Stage 1 1,53 5,0 5,0
Stage 2 2,32 5,0 10,0
Stage 3 4,71 5,0 15,0
Weight recovery and composition of products
weight v/o Fe Ferec. Ferec. SiO2 SiO2 rec SiO2 rec P TiO2 V
[%] [%v/o] [%] [%] [%v/o] [%] [%] [%v/o] [%] [%] [%]
Overflow 1 5,5 0,3 8,9 1,6 0,1 63,90 8,7 0,5 0,61 0,29 0,005
Overflow 2 20,1 0,9 9,5 6,2 0,2 64,70 31,9 1,7 0,70 0,24 0,004
Overflow 3 39,0 1,8 22,7 28,9 1,1 48,90 46,7 2,5 0,87 0,35 0,007
Concentrate 35,4 1,6 54,8 63,3 2,4 14,70 12,7 0,7 0,40 0,67 0,028
Calc. balance 100,0 4,6 30,6 100,0 3,7 40,82 100,0 5,3 0,65 0,44 0,014
Calculation of remaining concentrate after respective flotation stage
weight v/o Fe Ferec. Ferec. SiO2 SiO2 rec SiO2 rec P TiO2 V
[%] [%v/o] [%] [%] [%v/o] [%] [%] [%v/o] [%] [%] [%]
Calc. balance 100,0 4,6 30,6 100,0 3,7 40,82 100,0 5,3 0,65 0,44 0,014
after Stage 1 94,5 4,3 31,89 98,4 3,7 39,46 91,3 4,8 0,66 0,45 0,014
after Stage 2 74,3 3,4 37,98 92,2 3,4 32,62 59,4 3,1 0,64 0,50 0,017
after Stage 3 35,4 1,6 54,80 63,3 2,4 14,70 12,7 0,7 0,40 0,67 0,028
Feed 100,0 4,6 30,5 100,0 3,7 40,67 100,0 5,3 0,67 0,43 0,013
after Stage 1 94,5 4,3 31,8 98,4 3,7 39,31 91,3 4,8 0,67 0,44 0,013
after Stage 2 74,3 3,4 36,5 89,0 3,3 33,90 61,9 3,3 0,67 0,48 0,015
after Stage 3 35,4 1,6 43,8 50,8 1,9 26,04 22,6 1,2 0,57 0,55 0,019
7451/650/301/14 Appendix 7.2-6.2
A7451_Blötberget-2015.xlsm/ScavFeed-UpStream2

Studiengesellschaft für Eisenerzaufbereitung SGA
Nordic Iron Ore AB
Blötberget - 8 t Pilot sample (2015/16)
Lab scale tests with Cleaner stage spiral feed - 'Material 6'
Chemical analysis of
Reground rougher spiral concentrate - 'Material 6'
Fetot [%] 66,15
FeO [%] 0,96
SiO2 [%] 3,04 Cr [%] 0,012
Al2O3 [%] 0,61 Co [%] 0,0005
CaO [%] 0,55 Ni [%] 0,0012
MgO [%] 0,20 Cu [%] 0,0005
P [%] 0,149 Zn [%] 0,0013
S [%] 0,005 Pb [%] <0,0005
Na2O [%] 0,097 As [%] 0,0008
K2O [%] 0,03 Cd [%] <0,0005
Mn [%] 0,0155 Tl [%] <0,001
TiO2 [%] 0,30 SrO [%] 0,0006
V [%] 0,01 BaO [%] 0,0009
L.O.I. [%] 0,05
Magnetite by Satmagan [%] 1,6
Febound to. Magn. / Fetot [%] 1,7
SGA-sample no.: 7451/4-1/100 Appendix 8.1-1A7451_Blötberget-2015.xlsm/MAT6_CA

Studiengesellschaft für Eisenerzaufbereitung SGA
Nordic Iron Ore AB
Blötberget - 8 t Pilot sample (2015/16)
Lab scale tests with Cleaner stage spiral feed - 'Material 6'
Screen metal analysis of
Reground rougher spiral concentrate - 'Material 6'
Size Weight Passing Fetot SiO2 P TiO2 V
mm % / cum. % [%] [%] [%] [%] [%]
+ 1,0
1,0 - 0,63
0,63 - 0,5
0,5 - 0,315 0,0 / 100,0
0,315 - 0,2 3,4 / 96,5
0,2 - 0,1 32,1 / 64,5 64,4 5,00 0,205 0,295 0,0105
0,1 - 0,063 18,8 / 45,7 65,2 3,90 0,230 0,350 0,0109
0,063 - 0,04 13,4 / 32,3 67,7 1,67 0,088 0,310 0,0108
0,04 - 0,025 5,7 / 26,6 68,3 1,18 0,047 0,265 0,0109
0,025 - 0 26,6 / 0,0 67,9 1,47 0,053 0,250 0,0105
Calculated total 100,0 66,2 3,09 0,141 0,293 0,0107
d80 [mm] 0,148 Blaine [cm²/g] 780
d50 [mm] 0,072 Specific density [g/cm³] 5,07
SGA-sample no.: 7451/4-1/100 Appendix 8.1-2
0,280 0,011067,3 2,05 0,102
0
10
20
30
40
50
60
70
80
90
100
0,010 0,100 1,000
cum
. w
eigh
t p
ass
ing (
%)
grain size (mm)
A7451_Blötberget-2015.xlsm/MAT6_SMA

Studiengesellschaft für Eisenerzaufbereitung SGA
Nordic Iron Ore AB
Blötberget - 8 t Pilot sample (2015/16)
Lab scale tests with Cleaner stage spiral feed - 'Material 6'
Shaking table test
with Reground rougher spiral concentrate - 'Material 6'
Feed Products Calc. balance
Reground
rougher spiral
concentrate -
'Material 6'
Concentrate 1 Concentrate 2 Middlings Tailings
Weight [%] 100,0 53,4 9,9 16,7 20,0 100,0
Weight [%v/o] 20,1 10,7 2,0 3,3 4,0 20,1
Fetot [%] 66,15 69,20 66,15 55,10 66,35 65,98
Ferec [%] 100,3 56,0 9,9 13,9 20,1 100,0
Ferec [%] 100,0 55,9 9,9 13,9 20,1 99,7
Ferec [%v/o] 35,4 19,8 3,5 4,9 7,1 35,3
Magn. by Satm. [%] 1,6 1,2 1,3 1,4 2,9 1,6
Febound to. Magn. / Fetot [%] 1,7 1,2 1,4 1,8 3,1 1,7
Magn.rec [%] 102,4 40,0 8,4 14,7 36,9 100,0
Magn.rec [%] 100,0 39,0 8,2 14,3 36,1 97,6
Magn.rec [%v/o] 1,1 0,4 0,1 0,2 0,4 1,0
SiO2 [%] 3,04 0,16 2,46 14,15 3,13 3,31
SiO2 rec [%] 91,8 2,6 7,4 71,1 18,9 100,0
SiO2 rec [%] 100,0 2,8 8,0 77,5 20,6 109,0
SiO2 rec [%v/o] 1,7 0,0 0,1 1,3 0,4 1,9
P [%] 0,149 0,020 0,260 0,580 0,080 0,149
Prec [%] 100,0 7,2 17,3 64,8 10,8 100,0
Prec [%] 100,0 7,2 17,3 64,8 10,8 100,0
Prec [%v/o] 12,7 0,9 2,2 8,2 1,4 12,7
TiO2 [%] 0,300 0,315 0,350 0,250 0,245 0,294
V [%] 0,010 0,011 0,011 0,009 0,011 0,011
d80 [mm] 0,148 - - 0,088 - -
d50 [mm] 0,072 - - 0,039 - -
Spec. Surface [Blaine] - - - - - -
Spec. Weight [g/cm³] - - - - - -
SGA-sample no.: 7451/4-1/100/1..4 Appendix 8.1-3.1
A7451_Blötberget-2015.xlsm/CTable_CA

Studiengesellschaft für Eisenerzaufbereitung SGA
Nordic Iron Ore AB
Blötberget - 8 t Pilot sample (2015/16)
Lab scale tests with Cleaner stage spiral feed - 'Material 6'
Size distribution of products from shaking table test with 'Material 6'
Feed Concentrate 1 Concentrate 2 Middlings Tailings
Size Weight / Passing Weight / Passing Weight / Passing Weight / Passing Weight / Passing
mm [%] / [cum. %] [%] / [cum. %] [%] / [cum. %] [%] / [cum. %] [%] / [cum. %]
+ 1,0 0,0 / 100,0 - - 0,0 / 100,0 -
1,0 - 0,63 0,0 / 100,0 - - 0,0 / 100,0 -
0,63 - 0,5 0,0 / 100,0 - - 0,0 / 100,0 -
0,5 - 0,315 0,0 / 100,0 - - 0,1 / 99,9 -
0,315 - 0,2 3,4 / 96,5 - - 0,7 / 99,1 -
0,2 - 0,1 32,1 / 64,5 - - 15,2 / 83,9 -
0,1 - 0,063 18,8 / 45,7 - - 12,1 / 71,8 -
0,063 - 0,04 13,4 / 32,3 - - 19,6 / 52,2 -
0,04 - 0,025 5,7 / 26,6 - - 23,2 / 29,0 -
0,025 - 0 26,6 / 0,0 - - 29,0 / 0,0 -
100,0 / - - - 100,0 / - -
d80 [mm] 0,148 - - 0,088 -
d50 [mm] 0,072 - - 0,039 -
Spec. Surface [Blaine] - - - - -
Spec. Weight [g/cm³] - - - - -
SGA-sample no.: 7451/4-1/100/1..4 Appendix 8.1-3.2A7451_Blötberget-2015.xlsm/CTable_SA

Studiengesellschaft für Eisenerzaufbereitung SGA
Nordic Iron Ore AB
Blötberget - 8 t Pilot sample (2015/16)
Lab scale tests with Cleaner stage spiral feed - 'Material 6'
Sink float analysis
with Reground rougher spiral concentrate - 'Material 6'
Screen metal Analysis
Weight / Passing Fe Ferec. Ferec./feed SiO2 P TiO2 V
[%] [cum. %] [%] [%] [%] [%] [%] [%] [%]
0,0 / 100,0
+ 0,1 35,5 / 64,5 64,6 34,7 4,7 0,195 0,294 0,0105
0,1 - 0,063 18,8 / 45,7 65,2 18,5 3,9 0,230 0,350 0,0109
0,063 - 0,04 13,4 / 32,3 67,7 13,7 1,7 0,088 0,310 0,0108
0,04 - 0,0 32,3 / 0,0 68,0 33,1 1,4 0,052 0,253 0,0106
100,0 66,2 100,0 3,1 0,141 0,293 0,0107
d80 [µm] = 148 Analysis of basis 66,2 3,0 0,149 0,300 0,0100
Sink float analysis
Fraction 0,1 - 0,063 mm
weight v/o Fe Ferec. Ferec./feed SiO2 P TiO2 V
[%] [%] [%] [%] [%] [%] [%] [%] [%]
> 3,3 74,6 14,0 69,1 79,3 12,8 0,3 0,023 0,335 0,0110
3,3 - 2,7 21,5 4,0 62,3 20,6 11,5 3,8 0,870 0,290 0,0110
< 2,7 4,0 0,7 1,2 0,1 0,2 80,5 0,370 0,040 0,0040
100,0 18,8 65,0 100,0 18,5 4,2 0,219 0,314 0,0107
Fraction 0,063 - 0,04 mm
weight v/o Fe Ferec. Ferec./feed SiO2 P TiO2 V
[%] [%] [%] [%] [%] [%] [%] [%] [%]
> 3,3 86,7 11,6 69,1 89,0 9,4 0,3 0,036 0,320 0,0120
3,3 - 2,7 13,3 1,8 55,4 11,0 7,6 13,3 0,570 0,275 0,0110
< 2,7 0,0 0,0 - - - - - - -
100,0 13,4 67,2 100,0 13,7 2,0 0,107 0,314 0,0119
Summary of Fractions 0,1 - 0,04 mm
v/o Fe Ferec./feed SiO2 P TiO2 V
[%] [%] [%] [%] [%] [%] [%]
> 3,3 25,6 69,1 22,2 0,3 0,029 0,328 0,0115
3,3 - 2,7 5,8 60,2 19,1 6,7 0,778 0,285 0,0110
< 2,7 0,7 1,2 0,2 80,5 0,370 0,040 0,0040
32,2 65,9 41,6 3,3 0,172 0,314 0,0112
SGA-sample no.: 7451/4-1/100/601..606 Appendix 8.1-4
kg/l
mm
kg/l
kg/l
A7451_Blötberget-2015.xlsm/CSinkFloat

Studiengesellschaft für Eisenerzaufbereitung SGA
Nordic Iron Ore AB
Blötberget - 8 t Pilot sample (2015/16)
Cleaner stage spiral separation - Pilot scale test
Process overview
0 Weight Fetot Magn. SiO2
abs. - 66,2 1,6 3,0 0,15 % P
recovery 100,0 100,0 100,0 100,0 0,30 % TiO2
recovery v/o 20,1 35,4 1,1 1,7 0,010 % V
4 Weight Fetot Magn. SiO2
abs. - 66,6 4,0 2,5 0,08 % P
recovery 7,2 7,2 18,0 5,9 0,25 % TiO2
recovery v/o 1,4 2,6 0,2 0,1 0,010 % V
3 Weight Fetot Magn. SiO2
abs. - 63,7 1,6 6,2 0,11 % P
recovery 21,2 20,4 21,2 43,6 0,25 % TiO2
recovery v/o 4,3 7,2 0,2 0,8 0,010 % V
8 Weight Fetot Magn. SiO2 9 Weight Fetot Magn. SiO2 2 Weight Fetot Magn. SiO2
abs. - 38,1 1,2 34,5 0,47 % P abs. - 44,1 1,2 28,0 0,54 % P abs. - 66,9 1,2 2,1 0,19 % P
recovery 7,7 4,4 5,7 86,8 0,19 % TiO2 recovery 2,7 1,8 2,0 25,0 0,22 % TiO2 recovery 71,6 72,3 53,7 50,4 0,33 % TiO2
recovery v/o 1,5 1,6 0,1 1,5 0,007 % V recovery v/o 0,5 0,6 0,0 0,4 0,008 % V recovery v/o 14,4 25,6 0,6 0,9 0,011 % V
SGA-sample no.: 7451/5-1/1ff Appendix 8.2-1
Reground rougher spiral concentrate - 'Material 6'
Cyclone overflow
Tailings D
Tailings E Tailings F Cleaner Hematite concentrate 'Material 7'
Reground rougher spiral concentrate -
'Material 6'1500 kg/h
Cleaner Hematite concentrate 'Material 7'
Tailings D
Cyclone overflow
Spiral DRougher
Spiral ECleaner
Spiral FRe-cleaner
Dewatering
cyclone
1300 l/h washing water
1300 l/h washing water
2500 l/h washing water
A7451_Blötberget-2015.xlsm/PPT-5-1_Ov

Studiengesellschaft für Eisenerzaufbereitung SGA
Nordic Iron Ore AB
Blötberget - 8 t Pilot sample (2015/16)
Cleaner stage spiral separation - Pilot scale test
Chemical analysis of samples taken during test
(Feed rate @ 1500 kg/h)
Feed Products Calc. balance Intermediate products
Reground rougher
spiral concentrate -
'Material 6'
Cleaner Hematite
concentrate
'Material 7'
Tailings D Cyclone overflow Tailings E Tailings F
Weight [%] 100,0 71,6 21,2 7,2 100,0 7,7 2,7
Weight [%v/o] 20,1 14,4 4,3 1,4 20,1 1,5 0,5
Fetot [%] 66,15 66,85 63,67 66,62 66,16 38,10 44,10
Ferec [%] 100,0 72,3 20,4 7,2 100,0 4,4 1,8
Ferec [%] 100,0 72,3 20,4 7,2 100,0 4,4 1,8
Ferec [%v/o] 35,4 25,6 7,2 2,6 35,4 1,6 0,6
Magn. by Satm. [%] 1,6 1,2 1,6 4,0 1,5 1,2 1,2
Febound to. Magn. / Fetot [%] 1,7 1,3 1,8 4,3 1,6 2,3 2,0
Magn.rec [%] 107,7 57,8 22,8 19,4 100,0 6,2 2,2
Magn.rec [%] 100,0 53,7 21,2 18,0 92,9 5,7 2,0
Magn.rec [%v/o] 1,1 0,6 0,2 0,2 1,0 0,1 0,0
SiO2 [%] 3,04 2,14 6,24 2,48 3,03 34,50 28,00
SiO2 rec [%] 100,2 50,5 43,6 5,9 100,0 87,0 25,0
SiO2 rec [%] 100,0 50,4 43,6 5,9 99,8 86,8 25,0
SiO2 rec [%v/o] 1,7 0,9 0,8 0,1 1,7 1,5 0,4
P [%] 0,149 0,190 0,110 0,077 0,165 0,47 0,54
Prec [%] 90,4 82,5 14,2 3,4 100,0 21,6 8,9
Prec [%] 100,0 91,3 15,7 3,7 110,7 23,9 9,8
Prec [%v/o] 12,7 11,6 2,0 0,5 14,1 3,0 1,2
TiO2 [%] 0,30 0,33 0,25 0,25 0,31 0,19 0,22
V [%] 0,010 0,011 0,010 0,010 0,011 0,007 0,008
d80 [mm] 0,148 0,170 0,036 0,021 0,131 0,131 0,000
d50 [mm] 0,072 0,108 0,022 0,013 0,083 0,037 0,000
Spec. Surface [Blaine] 780 690 1110 5095 - - 0
Spec. Weight [g/cm³] 780,00 5,09 4,87 5,01 - - 0,00
SGA-sample no.: 7451/5-1/1ff Appendix 8.2-2
A7451_Blötberget-2015.xlsm/PPT-5-1_CA

Studiengesellschaft für Eisenerzaufbereitung SGA
Nordic Iron Ore AB
Blötberget - 8 t Pilot sample (2015/16)
Cleaner stage spiral separation - Pilot scale test
Size distribution of samples taken during test
Feed
Cleaner Hematite
concentrate
'Material 7'
Tailings D Cyclone overflow Tailings E Tailings F
Size Weight / Passing Weight / Passing Weight / Passing Weight / Passing Weight / Passing Weight / Passing
mm [%] / [cum. %] [%] / [cum. %] [%] / [cum. %] [%] / [cum. %] [%] / [cum. %] [%] / [cum. %]
+ 1,0 0,0 / 100,0 0,0 / 100,0 0,0 / 100,0 0,0 / 100,0 0,0 / 100,0 0,0 / 100,0
1,0 - 0,63 0,0 / 100,0 0,0 / 100,0 0,0 / 100,0 0,0 / 100,0 0,0 / 100,0 0,0 / 100,0
0,63 - 0,5 0,0 / 100,0 0,0 / 100,0 0,0 / 100,0 0,0 / 100,0 0,0 / 100,0 0,0 / 100,0
0,5 - 0,315 0,0 / 100,0 0,1 / 99,9 0,1 / 99,9 0,0 / 100,0 0,8 / 99,2 0,1 / 99,9
0,315 - 0,2 3,4 / 96,5 5,1 / 94,8 0,1 / 99,9 0,0 / 100,0 2,6 / 96,6 1,2 / 98,7
0,2 - 0,1 32,1 / 64,5 48,8 / 46,0 1,4 / 98,5 0,4 / 99,6 37,1 / 59,5 26,9 / 71,8
0,1 - 0,063 18,8 / 45,7 25,6 / 20,4 4,6 / 93,9 1,1 / 98,5 8,1 / 51,4 11,5 / 60,2
0,063 - 0,04 13,4 / 32,3 15,5 / 4,9 4,7 / 89,2 0,7 / 97,8 13,7 / 37,7 2,6 / 57,6
0,04 - 0,025 5,7 / 26,6 3,8 / 1,2 32,5 / 56,7 2,4 / 95,4 18,3 / 19,4 42,3 / 15,3
0,025 - 0 26,6 / 0,0 1,2 / 0,0 56,7 / 0,0 95,4 / 0,0 19,4 / 0,0 15,3 / 0,0
100,0 / - 100,0 / - 100,0 / - 100,0 / - 100,0 / - 100,0 / -
d80 [mm] 0,148 0,170 0,036 0,021 0,155 0,131
d50 [mm] 0,072 0,108 0,022 0,013 0,061 0,037
Spec. Surface [Blaine] 780 690 1110 5095 - -
Spec. Weight [g/cm³] 780,00 5,09 4,87 5,01 - -
SGA-sample no.: 7451/5-1/1ff Appendix 8.2-3A7451_Blötberget-2015.xlsm/PPT-5-1_SA

Studiengesellschaft für Eisenerzaufbereitung SGA
Nordic Iron Ore AB
Blötberget - 8 t Pilot sample (2015/16)
Cleaner stage spiral separation - Pilot scale test
Screen metal analysis of
Tailings from Spiral D
Size Weight Passing Fetot SiO2 P TiO2 V
mm % / cum. % [%] [%] [%] [%] [%]
+ 1,0
1,0 - 0,63
0,63 - 0,5
0,5 - 0,315 0,1 / 99,9
0,315 - 0,2 0,1 / 99,9
0,2 - 0,1 1,4 / 98,5
0,1 - 0,063 4,6 / 93,9 17,3 60,40 0,550 0,137 0,0040
0,063 - 0,04 4,7 / 89,2 60,8 9,50 0,256 0,270 0,0100
0,04 - 0,025 32,5 / 56,7 65,3 4,15 0,123 0,260 0,0106
0,025 - 0 56,7 / 0,0 67,8 1,27 0,048 0,250 0,0105
Calculated total 100,0 63,4 6,38 0,106 0,247 0,0101
d80 [mm] 0,036 Blaine [cm²/g] 1110
d50 [mm] 0,022 Specific density [g/cm³] 4,87
SGA-sample no.: 7451/5-1/2 Appendix 8.2-4
5,8 71,40 0,107 0,106 0,0020
0
10
20
30
40
50
60
70
80
90
100
0,010 0,100 1,000
cum
. w
eigh
t p
ass
ing (
%)
grain size (mm)
A7451_Blötberget-2015.xlsm/PPT-5-1_SMA_TailD

Studiengesellschaft für Eisenerzaufbereitung SGA
Nordic Iron Ore AB
Blötberget - 8 t Pilot sample (2015/16)
Cleaner stage spiral separation - Pilot scale test
Screen metal analysis of
Cyclone overflow
Size Weight Passing Fetot SiO2 P TiO2 V
mm % / cum. % [%] [%] [%] [%] [%]
+ 1,0
1,0 - 0,63
0,63 - 0,5
0,5 - 0,315 0,0 / 100,0
0,315 - 0,2 0,0 / 100,0
0,2 - 0,1 0,4 / 99,6
0,1 - 0,063 1,1 / 98,5
0,063 - 0,04 0,7 / 97,8
0,04 - 0,025 2,4 / 95,4
0,025 - 0 95,4 / 0,0 66,7 2,17 0,072 0,245 0,0110
Calculated total 100,0 66,2 2,78 0,079 0,245 0,0109
d80 [mm] <0,020 Blaine [cm²/g] 5095
d50 [mm] <0,020 Specific density [g/cm³] 5,01
SGA-sample no.: 7451/5-1/2 Appendix 8.2-5
54,8 15,55 0,220 0,245 0,0090
0
10
20
30
40
50
60
70
80
90
100
0,010 0,100 1,000
cum
. w
eigh
t p
ass
ing (
%)
grain size (mm)
A7451_Blötberget-2015.xlsm/PPT-5-1_SMA_CyclO

Studiengesellschaft für Eisenerzaufbereitung SGA
Nordic Iron Ore AB
Blötberget - 8 t Pilot sample (2015/16)
Cleaner stage spiral separation - Pilot scale test
Screen metal analysis of
Tailings from Spiral E
Size Weight Passing Fetot SiO2 P TiO2 V
mm % / cum. % [%] [%] [%] [%] [%]
+ 1,0
1,0 - 0,63
0,63 - 0,5
0,5 - 0,315 0,8 / 99,2
0,315 - 0,2 2,6 / 96,6
0,2 - 0,1 37,1 / 59,5
0,1 - 0,063 8,1 / 51,4
0,063 - 0,04 13,7 / 37,7 62,9 6,10 0,252 0,280 0,0100
0,04 - 0,025 18,3 / 19,4 68,3 1,12 0,049 0,265 0,0107
0,025 - 0 19,4 / 0,0 68,2 0,93 0,039 0,250 0,0105
Calculated total 100,0 37,6 33,70 0,450 0,189 0,0068
d80 [mm] 0,155 Blaine [cm²/g] -
d50 [mm] 0,061 Specific density [g/cm³] -
SGA-sample no.: 7451/5-1/4 Appendix 8.2-6
6,8 66,80 0,820 0,110 0,0030
0
10
20
30
40
50
60
70
80
90
100
0,010 0,100 1,000
cum
. w
eigh
t p
ass
ing (
%)
grain size (mm)
A7451_Blötberget-2015.xlsm/PPT-5-1_SMA_TailE
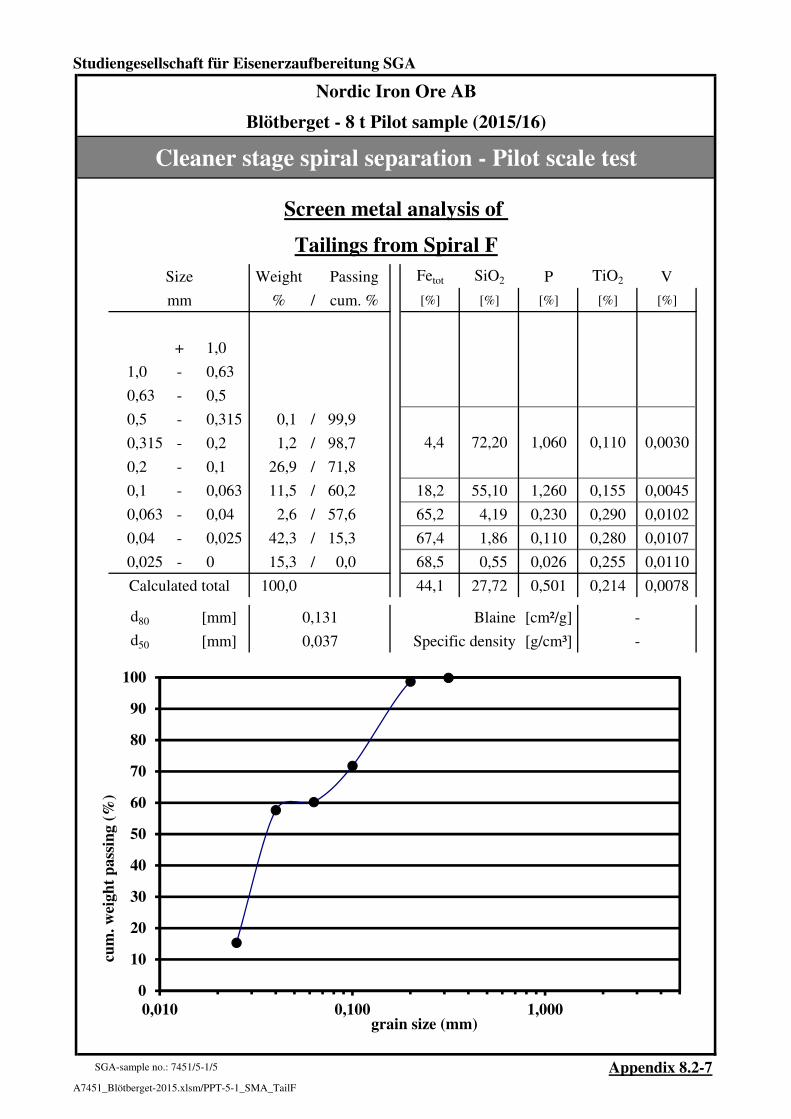
Studiengesellschaft für Eisenerzaufbereitung SGA
Nordic Iron Ore AB
Blötberget - 8 t Pilot sample (2015/16)
Cleaner stage spiral separation - Pilot scale test
Screen metal analysis of
Tailings from Spiral F
Size Weight Passing Fetot SiO2 P TiO2 V
mm % / cum. % [%] [%] [%] [%] [%]
+ 1,0
1,0 - 0,63
0,63 - 0,5
0,5 - 0,315 0,1 / 99,9
0,315 - 0,2 1,2 / 98,7
0,2 - 0,1 26,9 / 71,8
0,1 - 0,063 11,5 / 60,2 18,2 55,10 1,260 0,155 0,0045
0,063 - 0,04 2,6 / 57,6 65,2 4,19 0,230 0,290 0,0102
0,04 - 0,025 42,3 / 15,3 67,4 1,86 0,110 0,280 0,0107
0,025 - 0 15,3 / 0,0 68,5 0,55 0,026 0,255 0,0110
Calculated total 100,0 44,1 27,72 0,501 0,214 0,0078
d80 [mm] 0,131 Blaine [cm²/g] -
d50 [mm] 0,037 Specific density [g/cm³] -
SGA-sample no.: 7451/5-1/5 Appendix 8.2-7
4,4 72,20 1,060 0,110 0,0030
0
10
20
30
40
50
60
70
80
90
100
0,010 0,100 1,000
cum
. w
eigh
t p
ass
ing (
%)
grain size (mm)
A7451_Blötberget-2015.xlsm/PPT-5-1_SMA_TailF

Studiengesellschaft für Eisenerzaufbereitung SGA
Nordic Iron Ore AB
Blötberget - 8 t Pilot sample (2015/16)
Iron recovery from Cleaner spirals tailings
Scenario of screening
Reground rougher spiral concentrate - 'Material 6'
at 0.063 mm
Feed: Reground rougher spiral concentrate - 'Material 6'
(see screen metal analysis in Appendix 8.1-2)
weight v/o Fetot SiO2 P TiO2 V
[%] [%v/o] [%] [%] [%] [%] [%]
100 20,1 66,2 3,0 0,149 0,300 0,0100
Fe/SiO2/Prec [%v/o] 35,4 1,7 12,7
Size Weight Passing Fetot SiO2 P TiO2 V
mm % / cum. % % [%] [%] [%] [%]
+ 1,0
1,0 - 0,63
0,63 - 0,5
0,5 - 0,315 0,0 / 100,0
0,315 - 0,2 3,4 / 96,5
0,2 - 0,1 32,1 / 64,5
0,1 - 0,063 18,8 / 45,7
0,063 - 0,04 13,4 / 32,3 67,7 1,67 0,088 0,310 0,0108
0,04 - 0,025 5,7 / 26,6 68,3 1,18 0,047 0,265 0,0109
0,025 - 0 26,6 / 0,0 67,9 1,47 0,053 0,250 0,0105
Calculated total 100,0 67,9 1,49 0,063 0,269 0,0106
Properties of 'Material 6' <0,063 mm:
weight v/o Fetot SiO2 P TiO2 V
[%] [%v/o] [%] [%] [%] [%] [%]
45,7 9,2 67,9 1,5 0,063 0,269 0,0106
Fe/SiO2/Prec [%v/o] 16,6 0,4 2,4
SGA-sample no.: 7451/4-1/100 Appendix 8.3-1
A7451_Blötberget-2015.xlsm/MAT6 <0,063

Studiengesellschaft für Eisenerzaufbereitung SGA
Nordic Iron Ore AB
Blötberget - 8 t Pilot sample (2015/16)
Iron recovery from Cleaner spirals tailings
Scenario of screening
Tailings from Spiral D
at 0.063 mm
Feed: Tailings from Spiral D
(see screen metal analysis in Appendix 8.2-4)
weight v/o Fetot SiO2 P TiO2 V
[%] [%v/o] [%] [%] [%] [%] [%]
100 4,3 63,7 6,2 0,110 0,250 0,0100
Fe/SiO2/Prec [%v/o] 7,2 0,8 2,0
Size Weight Passing Fetot SiO2 P TiO2 V
mm % / cum. % % [%] [%] [%] [%]
+ 1,0
1,0 - 0,63
0,63 - 0,5
0,5 - 0,315 0,1 / 99,9
0,315 - 0,2 0,1 / 99,9
0,2 - 0,1 1,4 / 98,5
0,1 - 0,063 4,6 / 93,9
0,063 - 0,04 4,7 / 89,2 60,8 9,50 0,256 0,270 0,0100
0,04 - 0,025 32,5 / 56,7 65,3 4,15 0,123 0,260 0,0106
0,025 - 0 56,7 / 0,0 67,8 1,27 0,048 0,250 0,0105
Calculated total 100,0 66,6 2,68 0,084 0,254 0,0105
Properties of 'Material 6' <0,063 mm:
weight v/o Fetot SiO2 P TiO2 V
[%] [%v/o] [%] [%] [%] [%] [%]
93,9 4,0 66,6 2,7 0,084 0,254 0,0105
Fe/SiO2/Prec [%v/o] 7,1 0,3 1,4
SGA-sample no.: 7451/5-1/2 Appendix 8.3-2
A7451_Blötberget-2015.xlsm/TailD <0,063

Studiengesellschaft für Eisenerzaufbereitung SGA
Nordic Iron Ore AB
Blötberget - 8 t Pilot sample (2015/16)
Iron recovery from Cleaner spirals tailings
Lab scale test on
screening followed by upstream separation
with Tailings from Spiral D
1. Screening at 0,040 mm
Feed: Tailings from Spiral D (see screen metal analysis in Appendix 8.2-4)
weight v/o Fetot SiO2 P TiO2 V
[%] [%v/o] [%] [%] [%] [%] [%]
100 4,3 63,7 6,0 0,105 0,250 0,0100
Fe/SiO2/Prec [%v/o] 7,2 0,7 1,9
Size Weight Passing Fetot SiO2 P TiO2 V
mm % / cum. % % [%] [%] [%] [%]
+ 1,0 0,0 / 100,0
1,0 - 0,63 0,0 / 100,0
0,63 - 0,5 0,0 / 100,0
0,5 - 0,315 0,1 / 99,9
0,315 - 0,2 0,1 / 99,9
0,2 - 0,1 1,4 / 98,5
0,1 - 0,063 4,6 / 93,9
0,063 - 0,04 4,7 / 89,2
0,04 - 0,025 32,5 / 56,7 65,3 4,2 0,123 0,260 0,0106
0,025 - 0 56,7 / 0,0 67,8 1,3 0,048 0,250 0,0105
Calculated total 100,0 66,9 2,3 0,075 0,254 0,0105
Properties of scavenger stage feed <0,040 mm:
weight v/o Fetot SiO2 P TiO2 V
[%] [%v/o] [%] [%] [%] [%] [%]
89,2 3,8 66,9 2,3 0,075 0,254 0,0105
Fe/SiO2/Prec [%v/o] 6,8 0,2 1,2
SGA-sample no.: 7451/5-1/200/302/1…4 Appendix 8.3-3.1
A7451_Blötberget-2015.xlsm/CleanerTails-UpStream1

Studiengesellschaft für Eisenerzaufbereitung SGA
Nordic Iron Ore AB
Blötberget - 8 t Pilot sample (2015/16)
Iron recovery from Cleaner spirals tailings
Lab scale test on
screening followed by upstream separation
with Tailings from Spiral D
2. Upstream separation with Tailings from Spiral D <0,040 mm
Test sample: Tailings from Spiral D <0,040 mm
weight v/o Fe Ferec. Ferec. SiO2 SiO2 rec SiO2 rec P TiO2 V
[%] [%v/o] [%] [%] [%v/o] [%] [%] [%v/o] [%] [%] [%]
Feed 100,0 3,8 66,9 100,0 6,8 2,32 100,0 0,2 0,075 0,25 0,011
Upstream separation procedure
Upstream Duration Cumulated
velocity of stage time
[mm/s] [min] [min]
Stage 1 0,40 5,0 5,0
Stage 2 0,62 5,0 10,0
Stage 3 2,64 5,0 15,0
Weight recovery and composition of products
weight v/o Fe Ferec. Ferec. SiO2 SiO2 rec SiO2 rec P TiO2 V
[%] [%v/o] [%] [%] [%v/o] [%] [%] [%v/o] [%] [%] [%]
Overflow 1 2,9 0,1 52,6 2,3 0,2 15,80 18,4 0,0 0,35 0,22 0,009
Overflow 2 5,3 0,2 61,4 4,9 0,3 8,42 18,2 0,0 0,21 0,24 0,010
Overflow 3 50,7 1,9 67,4 51,0 3,5 2,24 46,1 0,1 0,073 0,26 0,011
Concentrate 41,1 1,6 68,4 41,9 2,8 1,04 17,3 0,0 0,046 0,27 0,011
Calc. balance 100,0 3,8 67,1 100,0 6,8 2,47 100,0 0,3 0,077 0,26 0,011
Calculation of remaining concentrate after respective flotation stage
weight v/o Fe Ferec. Ferec. SiO2 SiO2 rec SiO2 rec P TiO2 V
[%] [%v/o] [%] [%] [%v/o] [%] [%] [%v/o] [%] [%] [%]
Calc. balance 100,0 3,8 67,1 100,0 6,8 2,47 100,0 0,3 0,077 0,26 0,011
after Stage 1 97,1 3,7 67,49 97,7 6,6 2,07 81,6 0,2 0,069 0,26 0,011
after Stage 2 91,8 3,5 67,85 92,9 6,3 1,70 63,4 0,2 0,061 0,26 0,011
after Stage 3 41,1 1,6 68,40 41,9 2,8 1,04 17,3 0,0 0,046 0,27 0,011
Feed 100,0 3,8 66,9 100,0 6,8 2,32 100,0 0,2 0,075 0,25 0,011
after Stage 1 97,1 3,7 67,3 97,7 6,6 1,92 80,4 0,2 0,067 0,25 0,011
after Stage 2 91,8 3,5 67,6 92,8 6,3 1,56 61,9 0,2 0,059 0,26 0,011
after Stage 3 41,1 1,6 67,8 41,6 2,8 1,19 21,1 0,1 0,052 0,26 0,011
7451/5-1/200/302/1…4 Appendix 8.3-3.2
A7451_Blötberget-2015.xlsm/CleanerTails-UpStream2
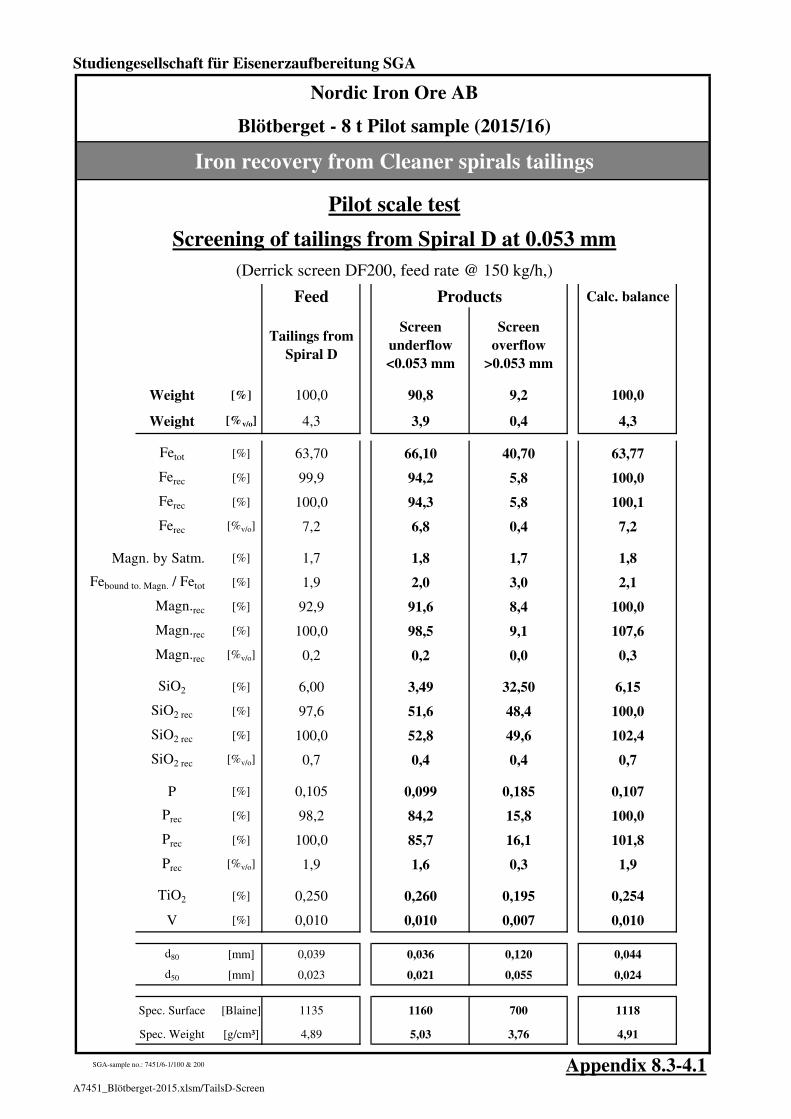
Studiengesellschaft für Eisenerzaufbereitung SGA
Nordic Iron Ore AB
Blötberget - 8 t Pilot sample (2015/16)
Iron recovery from Cleaner spirals tailings
Pilot scale test
Screening of tailings from Spiral D at 0.053 mm
(Derrick screen DF200, feed rate @ 150 kg/h,)
Feed Products Calc. balance
Tailings from
Spiral D
Screen
underflow
<0.053 mm
Screen
overflow
>0.053 mm
Weight [%] 100,0 90,8 9,2 100,0
Weight [%v/o] 4,3 3,9 0,4 4,3
Fetot [%] 63,70 66,10 40,70 63,77
Ferec [%] 99,9 94,2 5,8 100,0
Ferec [%] 100,0 94,3 5,8 100,1
Ferec [%v/o] 7,2 6,8 0,4 7,2
Magn. by Satm. [%] 1,7 1,8 1,7 1,8
Febound to. Magn. / Fetot [%] 1,9 2,0 3,0 2,1
Magn.rec [%] 92,9 91,6 8,4 100,0
Magn.rec [%] 100,0 98,5 9,1 107,6
Magn.rec [%v/o] 0,2 0,2 0,0 0,3
SiO2 [%] 6,00 3,49 32,50 6,15
SiO2 rec [%] 97,6 51,6 48,4 100,0
SiO2 rec [%] 100,0 52,8 49,6 102,4
SiO2 rec [%v/o] 0,7 0,4 0,4 0,7
P [%] 0,105 0,099 0,185 0,107
Prec [%] 98,2 84,2 15,8 100,0
Prec [%] 100,0 85,7 16,1 101,8
Prec [%v/o] 1,9 1,6 0,3 1,9
TiO2 [%] 0,250 0,260 0,195 0,254
V [%] 0,010 0,010 0,007 0,010
d80 [mm] 0,039 0,036 0,120 0,044
d50 [mm] 0,023 0,021 0,055 0,024
Spec. Surface [Blaine] 1135 1160 700 1118
Spec. Weight [g/cm³] 4,89 5,03 3,76 4,91
SGA-sample no.: 7451/6-1/100 & 200 Appendix 8.3-4.1A7451_Blötberget-2015.xlsm/TailsD-Screen

Studiengesellschaft für Eisenerzaufbereitung SGA
Nordic Iron Ore AB
Blötberget - 8 t Pilot sample (2015/16)
Iron recovery from Cleaner spirals tailings
Size distribution of products from
screening of Tailings from Spiral D at 0.053 mm
FeedScreen underflow
<0.053 mm
Screen overflow
>0.053 mm
Size Weight / Passing Weight / Passing Weight / Passing
mm [%] / [cum. %] [%] / [cum. %] [%] / [cum. %]
+ 1,0 0,0 / 100,0 0,0 / 100,0 0,0 / 100,0
1,0 - 0,63 0,0 / 100,0 0,0 / 100,0 0,0 / 100,0
0,63 - 0,5 0,0 / 100,0 0,0 / 100,0 0,0 / 100,0
0,5 - 0,315 0,1 / 99,9 0,0 / 100,0 0,0 / 100,0
0,315 - 0,2 0,0 / 99,9 0,0 / 100,0 1,3 / 98,7
0,2 - 0,1 2,2 / 97,7 0,0 / 100,0 23,3 / 75,3
0,1 - 0,063 4,7 / 93,0 1,8 / 98,2 20,7 / 54,6
0,063 - 0,04 11,9 / 81,0 11,5 / 86,7 13,8 / 40,8
0,04 - 0,025 26,4 / 54,6 27,9 / 58,9 12,6 / 28,2
0,025 - 0 54,6 / 0,0 58,9 / 0,0 28,2 / 0,0
100,0 / - 100,0 / - 100,0 / -
d80 [mm] 0,039 0,036 0,120
d50 [mm] 0,023 0,021 0,055
Spec. Surface [Blaine] 1135 1160 700
Spec. Weight [g/cm³] 4,89 5,03 3,76
SGA-sample no.: 7451/6-1/100 & 200 Appendix 8.3-4.2A7451_Blötberget-2015.xlsm/TailsD-Screen_SA

Studiengesellschaft für Eisenerzaufbereitung SGA
Nordic Iron Ore AB
Blötberget - 8 t Pilot sample (2015/16)
Lab scale flotation tests for apatite removal
Chemical analysis of
Cleaner spiral concentrate (bulk sample) - 'Material 7'
Fetot [%] 66,7
FeO [%] 0,62
SiO2 [%] 2,45 Cr [%] 0,0056
Al2O3 [%] 0,54 Co [%] 0,0005
CaO [%] 0,6 Ni [%] <0,0005
MgO [%] 0,19 Cu [%] <0,0005
P [%] 0,175 Zn [%] 0,001
S [%] 0,004 Pb [%] 0,0011
Na2O [%] 0,076 As [%] 0,0005
K2O [%] 0,02 Cd [%] <0,0005
Mn [%] 0,007 Tl [%] <0,001
TiO2 [%] 0,33 SrO [%] 0,0005
V [%] 0,011 BaO [%] 0,0006
L.O.I. [%] 0,01
Magnetite by Satmagan [%] 1,2
Febound to. Magn. / Fetot [%] 1,3
SGA-sample no.: 7451/5-1/100 Appendix 9.1-1A7451_Blötberget-2015.xlsm/MAT7_CA

Studiengesellschaft für Eisenerzaufbereitung SGA
Nordic Iron Ore AB
Blötberget - 8 t Pilot sample (2015/16)
Lab scale flotation tests for apatite removal
Screen metal analysis of
Cleaner spiral concentrate (bulk sample) - 'Material 7'
Size Weight Passing Fetot SiO2 P TiO2 V
mm % / cum. % [%] [%] [%] [%] [%]
+ 1,0
1,0 - 0,63
0,63 - 0,5
0,5 - 0,315 0,1 / 99,9
0,315 - 0,2 5,1 / 94,8
0,2 - 0,1 44,1 / 50,7 65,8 3,31 0,235 0,310 0,0110
0,1 - 0,063 28,5 / 22,2 66,6 2,65 0,225 0,360 0,0110
0,063 - 0,04 16,6 / 5,6 68,4 0,90 0,062 0,325 0,0110
0,04 - 0,025 3,3 / 2,3 68,7 0,69 0,030 0,275 0,0110
0,025 - 0 2,3 / 0,0 65,3 2,26 0,065 0,260 0,0108
Calculated total 100,0 66,6 2,50 0,186 0,323 0,0110
d80 [mm] 0,166 Blaine [cm²/g] 780
d50 [mm] 0,099 Specific density [g/cm³] 5,07
SGA-sample no.: 7451/5-1/100 Appendix 9.1-2
1,25 0,102 0,280 0,011068,0
0
10
20
30
40
50
60
70
80
90
100
0,010 0,100 1,000
cum
. w
eigh
t p
ass
ing (
%)
grain size (mm)
A7451_Blötberget-2015.xlsm/MAT7_SMA

Studiengesellschaft für Eisenerzaufbereitung SGA
Nordic Iron Ore AB
Blötberget - 8 t Pilot sample (2015/16)
Lab scale flotation tests for apatite removal
Lab scale flotation test #A1
With Reground rougher spiral concentrate - 'Material 6'
Flotation procedure Condition.FlotationCumulated
Dosage time time flot. time pH
[g/t] [min] [min] [min]
Conditioning Sodium silicate 500 10,0 0,0 0,0 9,3
Conditioning Atrac 1563 30 5,0 0,0 0,0 8,5
Stage 1 Frother (MIBC) 30 0,5 1,5 1,5 8,4
Stage 2 Atrac 1563 30 2,0 1,0 2,5 8,2
Conditioning Atrac 1563 30 0,0 0,0 2,5 8,1
Stage 3 Frother (MIBC) 30 2,0 1,0 3,5 8,1
Stage 4 ·/· 0 4,0 1,0 4,5 8,1
Stage 5 Atrac 1563 60 2,0 1,0 5,5 8,2
weight v/o Fe Ferec. Ferec. P Prec Prec SiO2 TiO2 V
[%] [%v/o] [%] [%] [%v/o] [%] [%] [%v/o] [%] [%] [%]
Test sample: Reground rougher spiral concentrate - 'Material 6'
Feed 100,0 14,4 66,2 100,0 25,3 0,149 100,0 9,1 3,04 0,30 0,010
Weight recovery and composition of products
Froth 1 0,6 0,1 8,0 0,1 0,0 16,0 55,3 5,5 0,97 0,05 0,003
Froth 2 0,3 0,0 42,3 0,2 0,1 6,13 12,9 1,3 1,78 0,18 0,007
Froth 3 0,6 0,1 57,2 0,6 0,1 2,33 9,2 0,9 1,75 0,25 0,010
Froth 4 1,1 0,2 60,6 1,0 0,3 1,14 7,9 0,8 3,28 0,28 0,011
Froth 5 1,1 0,2 67,6 1,1 0,3 0,086 0,6 0,1 1,45 0,27 0,011
Concentrate 96,2 13,9 66,5 97,0 24,5 0,024 14,2 1,4 3,35 0,30 0,011
Calc. balance 100,0 14,4 65,9 100,0 25,2 0,162 100,0 9,9 3,30 0,30 0,010
Calculation of remaining concentrate after respective flotation stage
weight v/o Fe Ferec. Ferec. P Prec Prec SiO2 TiO2 V
[%] [%v/o] [%] [%] [%v/o] [%] [%] [%v/o] [%] [%] [%]
Calc. balance 100,0 14,4 65,9 100,0 25,2 0,162 100,0 9,9 3,30 0,30 0,010
after Stage 1 99,4 14,3 66,25 99,9 25,2 0,073 44,7 4,4 3,31 0,30 0,010
after Stage 2 99,1 14,3 66,34 99,7 25,2 0,052 31,9 3,2 3,32 0,30 0,010
after Stage 3 98,5 14,2 66,40 99,2 25,0 0,037 22,7 2,2 3,33 0,30 0,011
after Stage 4 97,3 14,0 66,46 98,1 24,8 0,025 14,8 1,5 3,33 0,30 0,011
after Stage 5 96,2 13,9 66,45 97,0 - 0,024 14,2 - 3,35 0,30 0,011
Feed 100,0 14,4 66,2 100,0 25,3 0,149 100,0 9,1 3,04 0,30 0,010
after Stage 1 99,4 14,3 66,5 99,9 25,3 0,060 39,8 3,6 3,05 0,30 0,010
after Stage 2 99,1 14,3 66,6 99,7 25,3 0,039 25,9 2,4 3,06 0,30 0,010
after Stage 3 98,5 14,2 66,6 99,2 25,1 0,024 15,9 1,4 3,06 0,30 0,010
after Stage 4 97,3 14,0 66,7 98,1 24,9 0,011 7,5 0,7 3,06 0,30 0,010
after Stage 5 96,2 13,9 66,7 97,0 24,6 0,011 6,8 0,6 3,08 0,30 0,010
7451/4-1/100/801/1..6 Appendix 9.1-3
Reagent
A7451_Blötberget-2015.xlsm/Flot1

Studiengesellschaft für Eisenerzaufbereitung SGA
Nordic Iron Ore AB
Blötberget - 8 t Pilot sample (2015/16)
Lab scale flotation tests for apatite removal
Lab scale flotation test #A2
With Cleaner spiral concentrate - 'Material 7'
Flotation procedure Condition.FlotationCumulated
Dosage time time flot. time pH
[g/t] [min] [min] [min]
Conditioning Sodium silicate 500 10,0 0,0 0,0 9,6 Conditioning at 35,7 % solids
Conditioning Atrac 1563 90 5,0 0,0 0,0 9,0 Flotation at 35,7 % solids
Stage 1 Frother (MIBC) 30 1,0 1,5 1,5 9,0
Stage 2 Atrac 1563 75 2,0 1,0 2,5 8,8
Stage 2 2,5 0,0
Stage 3 2,5 0,0
Stage 4 2,5 0,0
Stage 5 2,5 0,0
weight v/o Fe Ferec. Ferec. P Prec Prec SiO2 TiO2 V
[%] [%v/o] [%] [%] [%v/o] [%] [%] [%v/o] [%] [%] [%]
Test sample: Cleaner spiral concentrate - 'Material 7'
Feed 100,0 14,4 66,9 100,0 25,6 0,190 100,0 11,6 2,14 0,33 0,011
Weight recovery and composition of products
Froth 1 1,4 0,2 38,6 0,8 0,2 7,8 63,2 6,7 0,46 0,19 0,007
Froth 2 3,3 0,5 63,6 3,2 0,8 1,43 27,5 2,9 0,55 0,32 0,011
Froth 3 0,0 0,0 0,0 0,0 0,0 0,00 0,0 0,0 0,00 0,00 0,000
Froth 4 0,0 0,0 0,0 0,0 0,0 0,00 0,0 0,0 0,00 0,00 0,000
Froth 5 0,0 0,0 0,0 0,0 0,0 0,000 0,0 0,0 0,00 0,00 0,000
Concentrate 95,3 13,7 67,5 96,0 24,6 0,017 9,3 1,0 2,30 0,32 0,011
Calc. balance 100,0 14,4 67,0 100,0 25,6 0,174 100,0 10,6 2,22 0,32 0,011
Calculation of remaining concentrate after respective flotation stage
weight v/o Fe Ferec. Ferec. P Prec Prec SiO2 TiO2 V
[%] [%v/o] [%] [%] [%v/o] [%] [%] [%v/o] [%] [%] [%]
Calc. balance 100,0 14,4 67,0 100,0 25,6 0,174 100,0 10,6 2,22 0,32 0,011
after Stage 1 98,6 14,2 67,37 99,2 25,4 0,065 36,8 3,9 2,24 0,32 0,011
after Stage 2 95,3 13,7 67,50 96,0 24,6 0,017 9,3 1,0 2,30 0,32 0,011
after Stage 3 95,3 13,7 67,50 96,0 24,6 0,017 9,3 1,0 2,30 0,32 0,011
after Stage 4 95,3 13,7 67,50 96,0 24,6 0,017 9,3 1,0 2,30 0,32 0,011
after Stage 5 95,3 13,7 67,50 96,0 - 0,017 9,3 - 2,30 0,32 0,011
Feed 100,0 14,4 66,9 100,0 25,6 0,190 100,0 11,6 2,14 0,33 0,011
after Stage 1 98,6 14,2 67,3 99,2 25,4 0,081 42,2 4,9 2,16 0,33 0,011
after Stage 2 95,3 13,7 67,4 96,0 24,6 0,036 17,9 2,1 2,22 0,33 0,011
after Stage 3 95,3 13,7 67,4 96,0 24,6 0,036 17,9 2,1 2,22 0,33 0,011
after Stage 4 95,3 13,7 67,4 96,0 24,6 0,036 17,9 2,1 2,22 0,33 0,011
after Stage 5 95,3 13,7 67,4 96,0 24,6 0,036 17,9 2,1 2,22 0,33 0,011
7451/5-1/100/803/1..3 Appendix 9.1-4
Reagent
A7451_Blötberget-2015.xlsm/Flot3

Studiengesellschaft für Eisenerzaufbereitung SGA
Nordic Iron Ore AB
Blötberget - 8 t Pilot sample (2015/16)
Lab scale flotation tests for apatite removal
Lab scale flotation test #A3
With Cleaner spiral concentrate - 'Material 7'
Flotation procedure Condition.FlotationCumulated
Dosage time time flot. time pH
[g/t] [min] [min] [min]
Conditioning Sodium silicate 500 10,0 0,0 0,0 9,1 Conditioning at 58,8 % solids
Conditioning Atrac 1563 60 2,0 0,0 0,0 8,9 Flotation at 35,7 % solids
Stage 1 Frother (MIBC) 20 0,0 1,5 1,5 8,9
Stage 2 Atrac 1563 20 1,0 1,0 2,5 8,9
Conditioning Atrac 1563 20 1,0 0,0 2,5 8,9
Stage 3 Frother (MIBC) 20 0,0 1,0 3,5 8,9
Stage 4 Atrac 1563 20 1,0 1,0 4,5 8,8
Stage 5 4,5 0,0
weight v/o Fe Ferec. Ferec. P Prec Prec SiO2 TiO2 V
[%] [%v/o] [%] [%] [%v/o] [%] [%] [%v/o] [%] [%] [%]
Test sample: Cleaner spiral concentrate - 'Material 7'
Feed 100,0 14,4 66,9 100,0 25,6 0,190 100,0 11,6 2,14 0,33 0,011
Weight recovery and composition of products
Froth 1 0,4 0,1 36,2 0,2 0,1 8,5 20,1 2,2 0,52 0,18 0,006
Froth 2 0,4 0,1 25,4 0,2 0,0 11,45 28,3 3,1 0,63 0,15 0,005
Froth 3 0,4 0,1 28,9 0,2 0,0 10,35 23,3 2,5 0,84 0,17 0,006
Froth 4 0,2 0,0 40,2 0,1 0,0 6,93 7,8 0,8 1,44 0,23 0,007
Froth 5 0,0 0,0 0,0 0,0 0,0 0,000 0,0 0,0 0,00 0,00 0,000
Concentrate 98,5 14,2 67,0 99,3 25,3 0,037 20,5 2,2 2,38 0,33 0,011
Calc. balance 100,0 14,4 66,4 100,0 25,4 0,178 100,0 10,8 2,36 0,33 0,011
Calculation of remaining concentrate after respective flotation stage
weight v/o Fe Ferec. Ferec. P Prec Prec SiO2 TiO2 V
[%] [%v/o] [%] [%] [%v/o] [%] [%] [%v/o] [%] [%] [%]
Calc. balance 100,0 14,4 66,4 100,0 25,4 0,178 100,0 10,8 2,36 0,33 0,011
after Stage 1 99,6 14,3 66,56 99,8 25,4 0,143 79,9 8,7 2,36 0,33 0,011
after Stage 2 99,1 14,3 66,74 99,6 25,3 0,092 51,6 5,6 2,37 0,33 0,011
after Stage 3 98,7 14,2 66,90 99,4 25,3 0,051 28,3 3,1 2,38 0,33 0,011
after Stage 4 98,5 14,2 66,95 99,3 25,3 0,037 20,5 2,2 2,38 0,33 0,011
after Stage 5 98,5 14,2 66,95 99,3 - 0,037 20,5 - 2,38 0,33 0,011
Feed 100,0 14,4 66,9 100,0 25,6 0,190 100,0 11,6 2,14 0,33 0,011
after Stage 1 99,6 14,3 67,0 99,8 25,5 0,155 81,3 9,4 2,15 0,33 0,011
after Stage 2 99,1 14,3 67,2 99,6 25,5 0,105 54,9 6,4 2,15 0,33 0,011
after Stage 3 98,7 14,2 67,3 99,4 25,5 0,064 33,2 3,9 2,16 0,33 0,011
after Stage 4 98,5 14,2 67,4 99,3 25,4 0,050 25,9 3,0 2,16 0,33 0,011
after Stage 5 98,5 14,2 67,4 99,3 25,4 0,050 25,9 3,0 2,16 0,33 0,011
7451/5-1/100/804/1..5 Appendix 9.1-5
Reagent
A7451_Blötberget-2015.xlsm/Flot4

Studiengesellschaft für Eisenerzaufbereitung SGA
Nordic Iron Ore AB
Blötberget - 8 t Pilot sample (2015/16)
Lab scale flotation tests for apatite removal
Lab scale flotation test #A4
With Cleaner spiral concentrate - 'Material 7'
Flotation procedure Condition.FlotationCumulated
Dosage time time flot. time pH
[g/t] [min] [min] [min]
Conditioning Sodium silicate 500 10,0 0,0 0,0 9,5 Conditioning at 35,7 % solids
Conditioning Atrac 1563 50 3,0 0,0 0,0 8,9 Flotation at 35,7 % solids
Stage 1 Frother (MIBC) 40 0,0 1,5 1,5 8,8
Conditioning Atrac 1563 50 2,0 0,0 1,5 8,7
Stage 2 Frother (MIBC) 20 0,0 1,5 3,0 8,7
0 0,0 0,0 3,0 0,0
3,0 0,0
Stage 5 3,0 0,0
weight v/o Fe Ferec. Ferec. P Prec Prec SiO2 TiO2 V
[%] [%v/o] [%] [%] [%v/o] [%] [%] [%v/o] [%] [%] [%]
Test sample: Cleaner spiral concentrate - 'Material 7'
Feed 100,0 14,4 66,9 100,0 25,6 0,190 100,0 11,6 2,14 0,33 0,011
Weight recovery and composition of products
Froth 1 0,2 0,0 26,0 0,1 0,0 10,8 10,3 1,2 0,99 0,14 0,003
Froth 2 0,9 0,1 29,3 0,4 0,1 10,25 47,5 5,5 0,83 0,16 0,004
Froth 3 0,0 0,0 0,0 0,0 0,0 0,00 0,0 0,0 0,00 0,00 0,000
Froth 4 0,0 0,0 0,0 0,0 0,0 0,00 0,0 0,0 0,00 0,00 0,000
Froth 5 0,0 0,0 0,0 0,0 0,0 0,000 0,0 0,0 0,00 0,00 0,000
Concentrate 98,9 14,2 66,8 99,5 25,3 0,081 42,2 4,9 2,31 0,33 0,010
Calc. balance 100,0 14,4 66,3 100,0 25,4 0,190 100,0 11,6 2,29 0,32 0,010
Calculation of remaining concentrate after respective flotation stage
weight v/o Fe Ferec. Ferec. P Prec Prec SiO2 TiO2 V
[%] [%v/o] [%] [%] [%v/o] [%] [%] [%v/o] [%] [%] [%]
Calc. balance 100,0 14,4 66,3 100,0 25,4 0,190 100,0 11,6 2,29 0,32 0,010
after Stage 1 99,8 14,4 66,42 99,9 25,4 0,171 89,7 10,4 2,30 0,32 0,010
after Stage 2 98,9 14,2 66,75 99,5 25,3 0,081 42,2 4,9 2,31 0,33 0,010
after Stage 3 98,9 14,2 66,75 99,5 25,3 0,081 42,2 4,9 2,31 0,33 0,010
after Stage 4 98,9 14,2 66,75 99,5 25,3 0,081 42,2 4,9 2,31 0,33 0,010
after Stage 5 98,9 14,2 66,75 99,5 - 0,081 42,2 - 2,31 0,33 0,010
Feed 100,0 14,4 66,9 100,0 25,6 0,190 100,0 11,6 2,14 0,33 0,011
after Stage 1 99,8 14,4 66,9 99,9 25,6 0,171 89,7 10,4 2,14 0,33 0,011
after Stage 2 98,9 14,2 67,3 99,5 25,5 0,082 42,6 4,9 2,15 0,33 0,011
after Stage 3 98,9 14,2 67,3 99,5 25,5 0,082 42,6 4,9 2,15 0,33 0,011
after Stage 4 98,9 14,2 67,3 99,5 25,5 0,082 42,6 4,9 2,15 0,33 0,011
after Stage 5 98,9 14,2 67,3 99,5 25,5 0,082 42,6 4,9 2,15 0,33 0,011
7451/5-1/100/805/1..3 Appendix 9.1-5
Reagent
A7451_Blötberget-2015.xlsm/Flot5

Studiengesellschaft für Eisenerzaufbereitung SGA
Nordic Iron Ore AB
Blötberget - 8 t Pilot sample (2015/16)
Lab scale flotation tests for apatite removal
Lab scale flotation test #A5
With Cleaner spiral concentrate - 'Material 7'
Flotation procedure Condition.FlotationCumulated
Dosage time time flot. time pH
[g/t] [min] [min] [min]
Conditioning Sodium silicate 500 10,0 0,0 0,0 9,3 Conditioning at 55,6 % solids
Conditioning Atrac 1563 100 2,5 0,0 0,0 8,9 Flotation at 35,7 % solids
Stage 1 Frother (MIBC) 30 0,0 2,0 2,0 8,8
Stage 2 2,0 0,0
Stage 2 2,0 0,0
Stage 3 2,0 0,0
Stage 4 2,0 0,0
Stage 5 2,0 0,0
weight v/o Fe Ferec. Ferec. P Prec Prec SiO2 TiO2 V
[%] [%v/o] [%] [%] [%v/o] [%] [%] [%v/o] [%] [%] [%]
Test sample: Cleaner spiral concentrate - 'Material 7'
Feed 100,0 14,4 66,9 100,0 25,6 0,190 100,0 11,6 2,14 0,33 0,011
Weight recovery and composition of products
Froth 1 1,1 0,2 26,0 0,4 0,1 10,8 60,7 7,3 0,99 0,14 0,003
Froth 2 0,0 0,0 0,0 0,0 0,0 0,00 0,0 0,0 0,00 0,00 0,000
Froth 3 0,0 0,0 0,0 0,0 0,0 0,00 0,0 0,0 0,00 0,00 0,000
Froth 4 0,0 0,0 0,0 0,0 0,0 0,00 0,0 0,0 0,00 0,00 0,000
Froth 5 0,0 0,0 0,0 0,0 0,0 0,000 0,0 0,0 0,00 0,00 0,000
Concentrate 98,9 14,2 67,0 99,6 25,4 0,078 39,3 4,7 2,34 0,14 0,010
Calc. balance 100,0 14,4 66,5 100,0 25,5 0,196 100,0 12,0 2,33 0,14 0,010
Calculation of remaining concentrate after respective flotation stage
weight v/o Fe Ferec. Ferec. P Prec Prec SiO2 TiO2 V
[%] [%v/o] [%] [%] [%v/o] [%] [%] [%v/o] [%] [%] [%]
Calc. balance 100,0 14,4 66,5 100,0 25,5 0,196 100,0 12,0 2,33 0,14 0,010
after Stage 1 98,9 14,2 66,95 99,6 25,4 0,078 39,3 4,7 2,34 0,14 0,010
after Stage 2 98,9 14,2 66,95 99,6 25,4 0,078 39,3 4,7 2,34 0,14 0,010
after Stage 3 98,9 14,2 66,95 99,6 25,4 0,078 39,3 4,7 2,34 0,14 0,010
after Stage 4 98,9 14,2 66,95 99,6 25,4 0,078 39,3 4,7 2,34 0,14 0,010
after Stage 5 98,9 14,2 66,95 99,6 - 0,078 39,3 - 2,34 0,14 0,010
Feed 100,0 14,4 66,9 100,0 25,6 0,190 100,0 11,6 2,14 0,33 0,011
after Stage 1 98,9 14,2 67,3 99,6 25,5 0,072 37,3 4,3 2,15 0,33 0,011
after Stage 2 98,9 14,2 67,3 99,6 25,5 0,072 37,3 4,3 2,15 0,33 0,011
after Stage 3 98,9 14,2 67,3 99,6 25,5 0,072 37,3 4,3 2,15 0,33 0,011
after Stage 4 98,9 14,2 67,3 99,6 25,5 0,072 37,3 4,3 2,15 0,33 0,011
after Stage 5 98,9 14,2 67,3 99,6 25,5 0,072 37,3 4,3 2,15 0,33 0,011
7451/5-1/100/806/1..2 Appendix 9.1-4
Reagent
A7451_Blötberget-2015.xlsm/Flot6

Studiengesellschaft für Eisenerzaufbereitung SGA
Nordic Iron Ore AB
Blötberget - 8 t Pilot sample (2015/16)
First pilot scale flotation test for apatite removal
Composition and chemical analysis of
Flotation feed
Cleaner
spiral
concentrate
'Material 7'
Cyclone
overflow
from cleaner
spirals
Tailings D
<0.053 mmFlotation feed
Calculated Analysed
Weight [%v/o] 14,4 1,4 3,9 19,7
[%] 73,0 7,3 19,7 100,0
Weight [kg] 540 49 133 722
[%] 74,8 6,8 18,4 100,0
Fetot [%] 66,7 66,10 66,10 66,55 66,45
FeO [%] - - - - -
SiO2 [%] 2,45 3,11 3,49 2,69 2,72
Al2O3 [%] - - - - -
CaO [%] - - - - -
MgO [%] - - - - -
P [%] 0,175 0,078 0,099 0,154 0,157
S [%] - - - - -
Na2O [%] - - - - -
K2O [%] - - - - -
Mn [%] - - - - -
TiO2 [%] 0,33 0,245 0,260 0,311 0,310
V [%] 0,011 0,011 0,010 0,011 0,010
L.O.I. [%] - - - - -
Magnetite by Satmagan [%] 1,2 4,0 1,8 1,5 1,6
Febound to. Magn. / Fetot [%] 1,3 4,4 2,0 1,6 1,7
SGA-sample no.: 7451/710 Appendix 9.2-1
Theoretical
proprotion
Mixture (optimized for
maximum weight)
A7451_Blötberget-2015.xlsm/CA_FlotFeed

Studiengesellschaft für Eisenerzaufbereitung SGA
Nordic Iron Ore AB
Blötberget - 8 t Pilot sample (2015/16)
First pilot scale flotation test for apatite removal
Process overview
0 Weight Fetot Magn. SiO2
abs. - 66,5 1,6 2,7 0,16 % P
recovery 100,0 100,0 100,0 100,0 0,31 % TiO2
recovery v/o 19,7 34,9 1,0 1,5 0,010 % V
3 Weight Fetot Magn. SiO2
abs. - 53,4 2,3 1,9 2,79 % P
recovery 0,4 0,3 0,6 0,3 0,22 % TiO2
recovery v/o 0,1 0,1 0,0 0,0 0,009 % V
4 Weight Fetot Magn. SiO2
abs. - 55,9 2,8 2,2 1,49 % P
recovery 0,5 0,4 0,9 0,4 0,23 % TiO2
recovery v/o 0,1 0,2 0,0 0,0 0,009 % V
2 Weight Fetot Magn. SiO2
abs. - 66,4 1,5 2,6 0,14 % P
recovery 99,1 98,9 92,9 95,8 0,31 % TiO2
recovery v/o 19,5 34,5 1,0 1,5 0,010 % V
SGA-sample no.: 7451/7-2/1ff Appendix 9.2-2
Flotation feed
Froth 2
Flotation hematite concentrate
Froth 1
Flotation feed300 kg/h
Flotation hematite concentrate
Froth 1
Flotation
Conditioning stage with 3 min1st flotation stage with 3 min
2nd flotation stage with 3.6 min
Froth 2
A7451_Blötberget-2015.xlsm/PPT-7-1_Ov

Studiengesellschaft für Eisenerzaufbereitung SGA
Nordic Iron Ore AB
Blötberget - 8 t Pilot sample (2015/16)
First pilot scale flotation test for apatite removal
Pilot scale test
Flotation details
Flotation procedure Condition.FlotationCumulated
Dosage time time flot. time pH
[g/t] [min] [min] [min]
Conditioning Sodium silicate 500 9,6 0,0 0,0 8,6 Conditioning at 24,2 % solids
Conditioning Atrac 1563 100 6,0 0,0 0,0 8,4 Flotation at 24,2 % solids
Stage 1 Frother (MIBC) 30 0,0 3,0 3,0 8,3
Conditioning Atrac 1563 50 0,0 0,0 3,0 8,2
Stage 2 Frother (MIBC) 30 0,0 3,6 6,6 8,2
0 0,0 0,0 6,6 0,0
6,6 0,0
Stage 5 6,6 0,0
weight v/o Fe Ferec. Ferec. P Prec Prec SiO2 TiO2 V
[%] [%v/o] [%] [%] [%v/o] [%] [%] [%v/o] [%] [%] [%]
Test sample: Flotation feed
Feed 100,0 19,7 66,5 100,0 34,9 0,157 100,0 0,09 2,72 0,31 0,010
Weight recovery and composition of products
Froth 1 0,4 0,1 53,4 0,3 0,1 2,8 7,2 0,01 1,91 0,22 0,009
Froth 2 0,5 0,1 55,9 0,4 0,2 1,49 5,0 0,00 2,18 0,23 0,009
Froth 3 0,0 0,0 0,0 0,0 0,0 0,00 0,0 0,00 0,00 0,00 0,000
Froth 4 0,0 0,0 0,0 0,0 0,0 0,00 0,0 0,00 0,00 0,00 0,000
Froth 5 0,0 0,0 0,0 0,0 0,0 0,000 0,0 0,00 0,00 0,00 0,000
Concentrate 99,1 19,5 66,4 99,2 34,5 0,139 87,7 0,08 2,63 0,31 0,010
Calc. balance 100,0 19,7 66,2 100,0 34,7 0,157 100,0 0,09 2,62 0,30 0,010
Calculation of remaining concentrate after respective flotation stage
weight v/o Fe Ferec. Ferec. P Prec Prec SiO2 TiO2 V
[%] [%v/o] [%] [%] [%v/o] [%] [%] [%v/o] [%] [%] [%]
Calc. balance 100,0 19,7 66,2 100,0 34,7 0,157 100,0 0,09 2,62 0,30 0,010
after Stage 1 99,6 19,6 66,29 99,7 34,6 0,146 92,8 0,08 2,63 0,30 0,010
after Stage 2 99,1 19,5 66,35 99,2 34,5 0,139 87,7 0,08 2,63 0,31 0,010
after Stage 3 99,1 19,5 66,35 99,2 34,5 0,139 87,7 0,08 2,63 0,31 0,010
after Stage 4 99,1 19,5 66,35 99,2 34,5 0,139 87,7 0,08 2,63 0,31 0,010
after Stage 5 99,1 19,5 66,35 99,2 - 0,139 87,7 - 2,63 0,31 0,010
Feed 100,0 19,7 66,5 100,0 34,9 0,157 100,0 0,09 2,72 0,31 0,010
after Stage 1 99,6 19,6 66,5 99,7 34,7 0,146 92,8 0,08 2,72 0,31 0,010
after Stage 2 99,1 19,5 66,6 99,2 34,6 0,139 87,8 0,08 2,73 0,31 0,010
after Stage 3 99,1 19,5 66,6 99,2 34,6 0,139 87,8 0,08 2,73 0,31 0,010
after Stage 4 99,1 19,5 66,6 99,2 34,6 0,139 87,8 0,08 2,73 0,31 0,010
after Stage 5 99,1 19,5 66,6 99,2 34,6 0,139 87,8 0,08 2,73 0,31 0,010
7451/7-2/1ff Appendix 9.2-3
Reagent
A7451_Blötberget-2015.xlsm/PPT-7-1_Pr

Studiengesellschaft für Eisenerzaufbereitung SGA
Nordic Iron Ore AB
Blötberget - 8 t Pilot sample (2015/16)
First pilot scale flotation test for apatite removal
Chemical analysis of samples taken during test
(Feed rate @ 300 kg/h)
Feed Products Calc. balance
Flotation
feed
Flotation
hematite
concentrate
Froth 1 Froth 2
Weight [%] 100,0 99,1 0,4 0,5 100,0
Weight [%v/o] 19,7 19,5 0,1 0,1 19,7
Fetot [%] 66,45 66,35 53,35 55,85 66,24
Ferec [%] 100,3 99,2 0,3 0,4 100,0
Ferec [%] 100,0 98,9 0,3 0,4 99,7
Ferec [%v/o] 34,9 34,5 0,1 0,2 34,7
Magn. by Satm. [%] 1,6 1,5 2,3 2,8 1,5
Febound to. Magn. / Fetot [%] 1,7 1,6 3,1 3,6 1,6
Magn.rec [%] 105,9 98,4 0,6 1,0 100,0
Magn.rec [%] 100,0 92,9 0,6 0,9 94,4
Magn.rec [%v/o] 1,0 1,0 0,0 0,0 1,0
SiO2 [%] 2,72 2,63 1,91 2,18 2,62
SiO2 rec [%] 103,6 99,3 0,3 0,4 100,0
SiO2 rec [%] 100,0 95,8 0,3 0,4 96,5
SiO2 rec [%v/o] 1,5 1,5 0,0 0,0 1,5
P [%] 0,157 0,139 2,790 1,490 0,157
Prec [%] 100,0 87,7 7,2 5,0 100,0
Prec [%] 100,0 87,7 7,2 5,0 100,0
Prec [%v/o] 13,1 11,5 0,9 0,7 13,1
TiO2 [%] 0,31 0,31 0,22 0,23 0,30
V [%] 0,010 0,010 0,009 0,009 0,010
d80 [mm] 0,155 0,152 - - -
d50 [mm] 0,080 0,084 - - -
Spec. Surface [Blaine] - - - - -
Spec. Weight [g/cm³] - 5,08 4,41 4,42 -
SGA-sample no.: 7451/7-2/1ff Appendix 9.2-4
A7451_Blötberget-2015.xlsm/PPT-7-1_CA

Studiengesellschaft für Eisenerzaufbereitung SGA
Nordic Iron Ore AB
Blötberget - 8 t Pilot sample (2015/16)
First pilot scale flotation test for apatite removal
Size distribution of samples taken during test
Feed
Flotation
hematite
concentrate
Froth 1 Froth 2
Size Weight / Passing Weight / Passing Weight / Passing Weight / Passing
mm [%] / [cum. %] [%] / [cum. %] [%] / [cum. %] [%] / [cum. %]
+ 1,0
1,0 - 0,63
0,63 - 0,5
0,5 - 0,315
0,315 - 0,2 4,5 / 95,5 0,0 / 100,0
0,2 - 0,1 34,7 / 60,8 41,5 / 58,5
0,1 - 0,063 20,2 / 40,5 20,0 / 38,5
0,063 - 0,04 14,6 / 25,9 14,2 / 24,3
0,04 - 0,025 8,5 / 17,4 7,8 / 16,5
0,025 - 0 17,4 / 0,0 16,5 / 0,0
100,0 / - 100,0 / - - -
d80 [mm] 0,155 0,152 - -
d50 [mm] 0,080 0,084 - -
Spec. Surface [Blaine] - - - -
Spec. Weight [g/cm³] - 5,08 4,41 4,42
SGA-sample no.: 7451/7-2/1ff Appendix 9.2-5
Sam
ple
to
o f
ew f
or
sctr
een
an
aly
sis
Sam
ple
to
o f
ew f
or
sctr
een
an
aly
sis
A7451_Blötberget-2015.xlsm/PPT-7-1_SA

Studiengesellschaft für Eisenerzaufbereitung SGA
Nordic Iron Ore AB
Blötberget - 8 t Pilot sample (2015/16)
First pilot scale flotation test for apatite removal
Screen metal analysis of
Flotation concentrate (1st pilot test)
Size Weight Passing Fetot SiO2 P TiO2 V
mm % / cum. % [%] [%] [%] [%] [%]
+ 1,0
1,0 - 0,63
0,63 - 0,5
0,5 - 0,315
0,315 - 0,2
0,2 - 0,1 41,5 / 58,5 66,1 2,98 0,187 0,310 0,0110
0,1 - 0,063 20,0 / 38,5 66,7 2,33 0,203 0,370 0,0112
0,063 - 0,04 14,2 / 24,3 67,8 1,68 0,043 0,325 0,0111
0,04 - 0,025 7,8 / 16,5 67,9 1,64 0,027 0,275 0,0110
0,025 - 0 16,5 / 0,0 67,4 1,83 0,034 0,260 0,0110
Calculated total 100,0 66,8 2,37 0,132 0,313 0,0111
d80 [mm] 0,152 Blaine [cm²/g] -
d50 [mm] 0,084 Specific density [g/cm³] 5,08
SGA-sample no.: 7451/5-1/100 Appendix 9.2-6
0
10
20
30
40
50
60
70
80
90
100
0,010 0,100 1,000
cum
. w
eigh
t p
ass
ing (
%)
grain size (mm)
A7451_Blötberget-2015.xlsm/PPT-7-1-SMA-Conc

Studiengesellschaft für Eisenerzaufbereitung SGA
Nordic Iron Ore AB
Blötberget - 8 t Pilot sample (2015/16)
Lab scale flotation tests for apatite removal
Lab scale flotation test #A6
With Flotation concentrate (1st pilot test)
Flotation procedure Condition.FlotationCumulated
Dosage time time flot. time pH
[g/t] [min] [min] [min]
Conditioning Sodium silicate 500 10,0 0,0 0,0 8,9 Conditioning at 35,7 % solids
Conditioning Atrac 1563 100 3,0 0,0 0,0 8,5 Flotation at 35,7 % solids
Stage 1 Frother (MIBC) 30 0,0 1,5 1,5 8,4
Conditioning Atrac 1563 50 2,0 0,0 1,5 8,4
Stage 2 Frother (MIBC) 30 0,0 1,5 3,0 8,4
0 0,0 0,0 3,0 0,0
3,0 0,0
Stage 5 3,0 0,0
weight v/o Fe Ferec. Ferec. P Prec Prec SiO2 TiO2 V
[%] [%v/o] [%] [%] [%v/o] [%] [%] [%v/o] [%] [%] [%]
Test sample: Flotation concentrate (1st pilot test)
Feed 100,0 19,5 66,6 100,0 34,6 0,130 100,0 10,8 2,63 0,31 0,012
Weight recovery and composition of products
Froth 1 0,8 0,2 32,9 0,4 0,1 8,9 56,9 6,2 1,25 0,15 0,006
Froth 2 0,7 0,1 51,5 0,5 0,2 3,63 18,4 2,0 1,82 0,23 0,009
Froth 3 0,0 0,0 0,0 0,0 0,0 0,00 0,0 0,0 0,00 0,00 0,000
Froth 4 0,0 0,0 0,0 0,0 0,0 0,00 0,0 0,0 0,00 0,00 0,000
Froth 5 0,0 0,0 0,0 0,0 0,0 0,000 0,0 0,0 0,00 0,00 0,000
Concentrate 98,5 19,2 67,0 99,1 34,3 0,033 24,7 2,7 2,66 0,31 0,011
Calc. balance 100,0 19,5 66,6 100,0 34,6 0,131 100,0 10,9 2,64 0,31 0,011
Calculation of remaining concentrate after respective flotation stage
weight v/o Fe Ferec. Ferec. P Prec Prec SiO2 TiO2 V
[%] [%v/o] [%] [%] [%v/o] [%] [%] [%v/o] [%] [%] [%]
Calc. balance 100,0 19,5 66,6 100,0 34,6 0,131 100,0 10,9 2,64 0,31 0,011
after Stage 1 99,2 19,4 66,90 99,6 34,5 0,057 43,1 4,7 2,65 0,31 0,011
after Stage 2 98,5 19,2 67,00 99,1 34,3 0,033 24,7 2,7 2,66 0,31 0,011
after Stage 3 98,5 19,2 67,00 99,1 34,3 0,033 24,7 2,7 2,66 0,31 0,011
after Stage 4 98,5 19,2 67,00 99,1 34,3 0,033 24,7 2,7 2,66 0,31 0,011
after Stage 5 98,5 19,2 67,00 99,1 - 0,033 24,7 - 2,66 0,31 0,011
Feed 100,0 19,5 66,6 100,0 34,6 0,130 100,0 10,8 2,63 0,31 0,012
after Stage 1 99,2 19,4 66,9 99,6 34,5 0,056 42,5 4,6 2,64 0,31 0,012
after Stage 2 98,5 19,2 67,0 99,1 34,3 0,032 24,0 2,6 2,65 0,31 0,012
after Stage 3 98,5 19,2 67,0 99,1 34,3 0,032 24,0 2,6 2,65 0,31 0,012
after Stage 4 98,5 19,2 67,0 99,1 34,3 0,032 24,0 2,6 2,65 0,31 0,012
after Stage 5 98,5 19,2 67,0 99,1 34,3 0,032 24,0 2,6 2,65 0,31 0,012
7451/7-2/100/809/1..3 Appendix 9.3-1
Reagent
A7451_Blötberget-2015.xlsm/Flot7
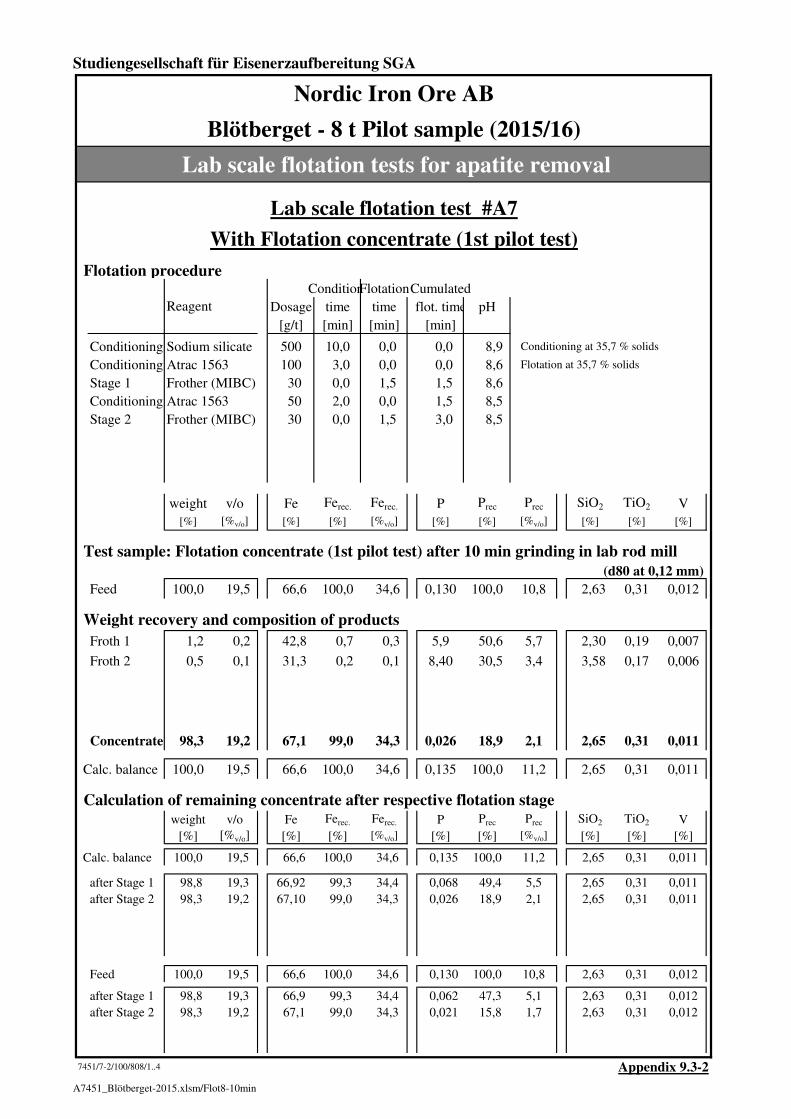
Studiengesellschaft für Eisenerzaufbereitung SGA
Nordic Iron Ore AB
Blötberget - 8 t Pilot sample (2015/16)
Lab scale flotation tests for apatite removal
Lab scale flotation test #A7
With Flotation concentrate (1st pilot test)
Flotation procedure Condition.FlotationCumulated
Dosage time time flot. time pH
[g/t] [min] [min] [min]
Conditioning Sodium silicate 500 10,0 0,0 0,0 8,9 Conditioning at 35,7 % solids
Conditioning Atrac 1563 100 3,0 0,0 0,0 8,6 Flotation at 35,7 % solids
Stage 1 Frother (MIBC) 30 0,0 1,5 1,5 8,6
Conditioning Atrac 1563 50 2,0 0,0 1,5 8,5
Stage 2 Frother (MIBC) 30 0,0 1,5 3,0 8,5
0 0,0 0,0 3,0 0,0
3,0 0,0
Stage 5 3,0 0,0
weight v/o Fe Ferec. Ferec. P Prec Prec SiO2 TiO2 V
[%] [%v/o] [%] [%] [%v/o] [%] [%] [%v/o] [%] [%] [%]
Test sample: Flotation concentrate (1st pilot test) after 10 min grinding in lab rod mill
(d80 at 0,12 mm)
Feed 100,0 19,5 66,6 100,0 34,6 0,130 100,0 10,8 2,63 0,31 0,012
Weight recovery and composition of products
Froth 1 1,2 0,2 42,8 0,7 0,3 5,9 50,6 5,7 2,30 0,19 0,007
Froth 2 0,5 0,1 31,3 0,2 0,1 8,40 30,5 3,4 3,58 0,17 0,006
Froth 3 0,0 0,0 0,0 0,0 0,0 0,00 0,0 0,0 0,00 0,00 0,000
Froth 4 0,0 0,0 0,0 0,0 0,0 0,00 0,0 0,0 0,00 0,00 0,000
Froth 5 0,0 0,0 0,0 0,0 0,0 0,000 0,0 0,0 0,00 0,00 0,000
Concentrate 98,3 19,2 67,1 99,0 34,3 0,026 18,9 2,1 2,65 0,31 0,011
Calc. balance 100,0 19,5 66,6 100,0 34,6 0,135 100,0 11,2 2,65 0,31 0,011
Calculation of remaining concentrate after respective flotation stage
weight v/o Fe Ferec. Ferec. P Prec Prec SiO2 TiO2 V
[%] [%v/o] [%] [%] [%v/o] [%] [%] [%v/o] [%] [%] [%]
Calc. balance 100,0 19,5 66,6 100,0 34,6 0,135 100,0 11,2 2,65 0,31 0,011
after Stage 1 98,8 19,3 66,92 99,3 34,4 0,068 49,4 5,5 2,65 0,31 0,011
after Stage 2 98,3 19,2 67,10 99,0 34,3 0,026 18,9 2,1 2,65 0,31 0,011
after Stage 3 98,3 19,2 67,10 99,0 34,3 0,026 18,9 2,1 2,65 0,31 0,011
after Stage 4 98,3 19,2 67,10 99,0 34,3 0,026 18,9 2,1 2,65 0,31 0,011
after Stage 5 98,3 19,2 67,10 99,0 - 0,026 18,9 - 2,65 0,31 0,011
Feed 100,0 19,5 66,6 100,0 34,6 0,130 100,0 10,8 2,63 0,31 0,012
after Stage 1 98,8 19,3 66,9 99,3 34,4 0,062 47,3 5,1 2,63 0,31 0,012
after Stage 2 98,3 19,2 67,1 99,0 34,3 0,021 15,8 1,7 2,63 0,31 0,012
after Stage 3 98,3 19,2 67,1 99,0 34,3 0,021 15,8 1,7 2,63 0,31 0,012
after Stage 4 98,3 19,2 67,1 99,0 34,3 0,021 15,8 1,7 2,63 0,31 0,012
7451/7-2/100/808/1..4 Appendix 9.3-2
Reagent
A7451_Blötberget-2015.xlsm/Flot8-10min

Studiengesellschaft für Eisenerzaufbereitung SGA
Nordic Iron Ore AB
Blötberget - 8 t Pilot sample (2015/16)
Lab scale flotation tests for apatite removal
Lab scale flotation test #A8
With Flotation concentrate (1st pilot test)
Flotation procedure Condition.FlotationCumulated
Dosage time time flot. time pH
[g/t] [min] [min] [min]
Conditioning Sodium silicate 500 10,0 0,0 0,0 8,6 Conditioning at 35,7 % solids
Conditioning Atrac 1563 100 3,0 0,0 0,0 8,2 Flotation at 35,7 % solids
Stage 1 Frother (MIBC) 30 0,0 1,5 1,5 8,1
Conditioning Atrac 1563 50 2,0 0,0 1,5 8,1
Stage 2 Frother (MIBC) 30 0,0 1,5 3,0 8,1
0 0,0 0,0 3,0 0,0
3,0 0,0
Stage 5 3,0 0,0
weight v/o Fe Ferec. Ferec. P Prec Prec SiO2 TiO2 V
[%] [%v/o] [%] [%] [%v/o] [%] [%] [%v/o] [%] [%] [%]
Test sample: Flotation concentrate (1st pilot test) after 25 min grinding in lab rod mill
(d80 at 0,083 mm)
Feed 100,0 19,5 66,6 100,0 34,6 0,130 100,0 10,8 2,63 0,31 0,012
Weight recovery and composition of products
Froth 1 1,8 0,3 40,9 1,1 0,4 6,5 88,9 9,5 1,99 0,19 0,007
Froth 2 1,0 0,2 63,2 1,0 0,3 0,35 2,8 0,3 3,61 0,28 0,011
Froth 3 0,0 0,0 0,0 0,0 0,0 0,00 0,0 0,0 0,00 0,00 0,000
Froth 4 0,0 0,0 0,0 0,0 0,0 0,00 0,0 0,0 0,00 0,00 0,000
Froth 5 0,0 0,0 0,0 0,0 0,0 0,000 0,0 0,0 0,00 0,00 0,000
Concentrate 97,2 19,0 66,9 97,9 33,8 0,011 8,3 0,9 2,68 0,31 0,011
Calc. balance 100,0 19,5 66,4 100,0 34,5 0,129 100,0 10,7 2,68 0,31 0,011
Calculation of remaining concentrate after respective flotation stage
weight v/o Fe Ferec. Ferec. P Prec Prec SiO2 TiO2 V
[%] [%v/o] [%] [%] [%v/o] [%] [%] [%v/o] [%] [%] [%]
Calc. balance 100,0 19,5 66,4 100,0 34,5 0,129 100,0 10,7 2,68 0,31 0,011
after Stage 1 98,2 19,2 66,86 98,9 34,1 0,015 11,1 1,2 2,69 0,31 0,011
after Stage 2 97,2 19,0 66,90 97,9 33,8 0,011 8,3 0,9 2,68 0,31 0,011
after Stage 3 97,2 19,0 66,90 97,9 33,8 0,011 8,3 0,9 2,68 0,31 0,011
after Stage 4 97,2 19,0 66,90 97,9 33,8 0,011 8,3 0,9 2,68 0,31 0,011
after Stage 5 97,2 19,0 66,90 97,9 - 0,011 8,3 - 2,68 0,31 0,011
Feed 100,0 19,5 66,6 100,0 34,6 0,130 100,0 10,8 2,63 0,31 0,012
after Stage 1 98,2 19,2 67,1 98,9 34,2 0,015 11,6 1,3 2,64 0,31 0,012
after Stage 2 97,2 19,0 67,1 97,9 33,9 0,012 8,8 1,0 2,63 0,31 0,012
after Stage 3 97,2 19,0 67,1 97,9 33,9 0,012 8,8 1,0 2,63 0,31 0,012
after Stage 4 97,2 19,0 67,1 97,9 33,9 0,012 8,8 1,0 2,63 0,31 0,012
7451/7-2/100/810/1..3 Appendix 9.3-3
Reagent
A7451_Blötberget-2015.xlsm/Flot9-25min

Studiengesellschaft für Eisenerzaufbereitung SGA
Nordic Iron Ore AB
Blötberget - 8 t Pilot sample (2015/16)
Second pilot scale flotation test for apatite removal
Composition and chemical analysis of
Flotation feed
Residuals
from Cells
(1st test)
Froth
(1st test)
Flotation
concentrate
(1st test) Recombined Flotation feed
Calculated analysed 1st feed
Weight [kg] 40,0 60,0 353,0 453,0
[%] 8,8 13,2 77,9 100,0
Weight [kg] 40,6 40 363 443,6
[%] 9,2 9,0 81,8 100,0
Fetot [%] 65,6 64,50 66,63 66,34 66,40 66,45
FeO [%] - - - - - -
SiO2 [%] 4,26 3,12 2,63 2,82 2,77 2,72
Al2O3 [%] - - - - - -
CaO [%] - - - - - -
MgO [%] - - - - - -
P [%] 0,035 0,540 0,130 0,158 0,157 0,157
S [%] - - - - - -
Na2O [%] - - - - - -
K2O [%] - - - - - -
Mn [%] - - - - - -
TiO2 [%] 0,29 0,280 0,310 0,305 0,310 0,310
V [%] 0,0108 0,010 0,012 0,011 0,012 0,010
L.O.I. [%] - - - - - -
Magnetite by Satmagan [%] 1,2 4,0 1,8 2,0 1,6 1,6
Febound to. Magn. / Fetot [%] 1,3 4,5 2,0 2,2 1,7 1,7
SGA-sample no.: 7451/710 Appendix 9.4-1
Theoretical
proprotion
Mixture (optimized for
similar chem.
composition)
A7451_Blötberget-2015.xlsm/CA_FlotFeed-8-1
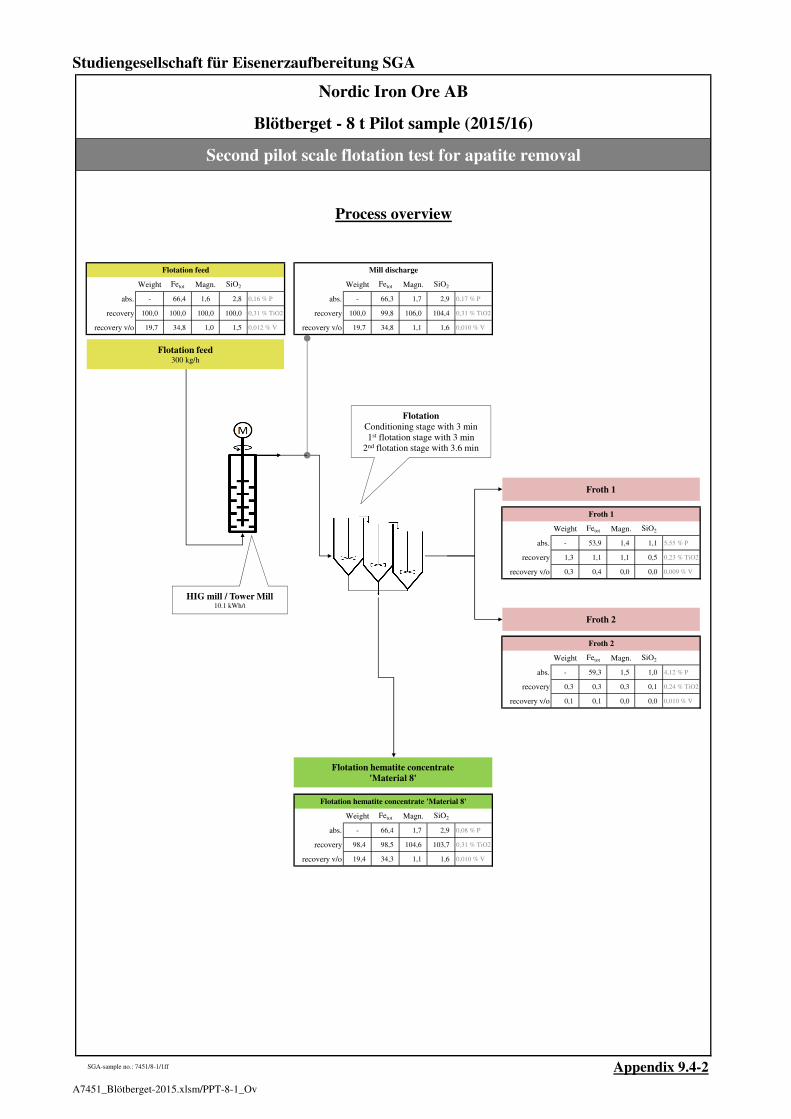
Studiengesellschaft für Eisenerzaufbereitung SGA
Nordic Iron Ore AB
Blötberget - 8 t Pilot sample (2015/16)
Second pilot scale flotation test for apatite removal
Process overview
0 Weight Fetot Magn. SiO2 6 Weight Fetot Magn. SiO2
abs. - 66,4 1,6 2,8 0,16 % P abs. - 66,3 1,7 2,9 0,17 % P
recovery 100,0 100,0 100,0 100,0 0,31 % TiO2 recovery 100,0 99,8 106,0 104,4 0,31 % TiO2
recovery v/o 19,7 34,8 1,0 1,5 0,012 % V recovery v/o 19,7 34,8 1,1 1,6 0,010 % V
3 Weight Fetot Magn. SiO2
abs. - 53,9 1,4 1,1 5,55 % P
recovery 1,3 1,1 1,1 0,5 0,23 % TiO2
recovery v/o 0,3 0,4 0,0 0,0 0,009 % V
4 Weight Fetot Magn. SiO2
abs. - 59,3 1,5 1,0 4,12 % P
recovery 0,3 0,3 0,3 0,1 0,24 % TiO2
recovery v/o 0,1 0,1 0,0 0,0 0,010 % V
2 Weight Fetot Magn. SiO2
abs. - 66,4 1,7 2,9 0,08 % P
recovery 98,4 98,5 104,6 103,7 0,31 % TiO2
recovery v/o 19,4 34,3 1,1 1,6 0,010 % V
SGA-sample no.: 7451/8-1/1ff Appendix 9.4-2
Flotation feed
Froth 1
Froth 2
Flotation hematite concentrate 'Material 8'
Mill discharge
Flotation feed300 kg/h
Flotation hematite concentrate
'Material 8'
Froth 1
Flotation
Conditioning stage with 3 min1st flotation stage with 3 min
2nd flotation stage with 3.6 min
Froth 2
HIG mill / Tower Mill10.1 kWh/t
A7451_Blötberget-2015.xlsm/PPT-8-1_Ov

Studiengesellschaft für Eisenerzaufbereitung SGA
Nordic Iron Ore AB
Blötberget - 8 t Pilot sample (2015/16)
Second pilot scale flotation test for apatite removal
Pilot scale test
Flotation details
Flotation procedure Condition.FlotationCumulated
Dosage time time flot. time pH
[g/t] [min] [min] [min]
Conditioning Sodium silicate 500 9,6 0,0 0,0 Conditioning at 27,2 % solids
Conditioning Atrac 1563 100 6,0 0,0 0,0 Flotation at 27,2 % solids
Stage 1 Frother (MIBC) 30 0,0 3,0 3,0
Conditioning Atrac 1563 50 0,0 0,0 3,0
Stage 2 Frother (MIBC) 30 0,0 3,6 6,6
0 0,0 0,0 6,6 0,0
6,6 0,0
Stage 5 6,6 0,0
weight v/o Fe Ferec. Ferec. P Prec Prec SiO2 TiO2 V
[%] [%v/o] [%] [%] [%v/o] [%] [%] [%v/o] [%] [%] [%]
Test sample: Flotation feed
Feed 100,0 19,7 66,4 100,0 34,8 0,157 100,0 0,09 2,77 0,31 0,012
Weight recovery and composition of products
Froth 1 1,3 0,3 53,9 1,1 0,4 5,6 43,3 0,04 1,13 0,23 0,009
Froth 2 0,3 0,1 59,3 0,3 0,1 4,12 7,6 0,01 0,99 0,24 0,010
Froth 3 0,0 0,0 0,0 0,0 0,0 0,00 0,0 0,00 0,00 0,00 0,000
Froth 4 0,0 0,0 0,0 0,0 0,0 0,00 0,0 0,00 0,00 0,00 0,000
Froth 5 0,0 0,0 0,0 0,0 0,0 0,000 0,0 0,00 0,00 0,00 0,000
Concentrate 98,4 19,4 66,4 98,7 34,3 0,083 49,1 0,05 2,92 0,31 0,010
Calc. balance 100,0 19,7 66,3 100,0 34,8 0,166 100,0 0,09 2,89 0,31 0,010
Calculation of remaining concentrate after respective flotation stage
weight v/o Fe Ferec. Ferec. P Prec Prec SiO2 TiO2 V
[%] [%v/o] [%] [%] [%v/o] [%] [%] [%v/o] [%] [%] [%]
Calc. balance 100,0 19,7 66,3 100,0 34,8 0,166 100,0 0,09 2,89 0,31 0,010
after Stage 1 98,7 19,5 66,42 98,9 34,4 0,096 56,7 0,05 2,91 0,31 0,010
after Stage 2 98,4 19,4 66,44 98,7 34,3 0,083 49,1 0,05 2,92 0,31 0,010
after Stage 3 98,4 19,4 66,44 98,7 34,3 0,083 49,1 0,05 2,92 0,31 0,010
after Stage 4 98,4 19,4 66,44 98,7 34,3 0,083 49,1 0,05 2,92 0,31 0,010
after Stage 5 98,4 19,4 66,44 98,7 - 0,083 49,1 - 2,92 0,31 0,010
Feed 100,0 19,7 66,4 100,0 34,8 0,157 100,0 0,09 2,77 0,31 0,012
after Stage 1 98,7 19,5 66,6 98,9 34,5 0,086 54,1 0,05 2,79 0,31 0,012
after Stage 2 98,4 19,4 66,6 98,7 34,4 0,073 46,0 0,04 2,80 0,31 0,012
after Stage 3 98,4 19,4 66,6 98,7 34,4 0,073 46,0 0,04 2,80 0,31 0,012
after Stage 4 98,4 19,4 66,6 98,7 34,4 0,073 46,0 0,04 2,80 0,31 0,012
after Stage 5 98,4 19,4 66,6 98,7 34,4 0,073 46,0 0,04 2,80 0,31 0,012
7451/8-1/1ff Appendix 9.4-3
Reagent
A7451_Blötberget-2015.xlsm/PPT-8-1_Pr

Studiengesellschaft für Eisenerzaufbereitung SGA
Nordic Iron Ore AB
Blötberget - 8 t Pilot sample (2015/16)
Second pilot scale flotation test for apatite removal
Chemical analysis of samples taken during test
(Feed rate @ 300 kg/h)
Feed Products Calc.
Flotation
feed
(recombined)
Flotation
hematite
concentrate
Froth 1 Froth 2
balanceMill
discahrge
Weight [%] 100,0 98,4 1,3 0,3 100,0 100,0
Weight [%v/o] 19,7 19,4 0,3 0,1 19,7 19,7
Fetot [%] 66,40 66,44 53,90 59,30 66,26 66,50
Ferec [%] 100,2 98,7 1,1 0,3 100,0 100,4
Ferec [%] 100,0 98,5 1,1 0,3 99,8 100,2
Ferec [%v/o] 34,8 34,3 0,4 0,1 34,8 34,9
Magn. by Satm. [%] 1,6 1,7 1,4 1,5 1,7 1,7
Febound to. Magn. / Fetot [%] 1,7 1,8 1,9 1,8 1,9 1,8
Magn.rec [%] 94,4 98,7 1,1 0,3 100,0 100,3
Magn.rec [%] 100,0 104,6 1,1 0,3 106,0 106,3
Magn.rec [%v/o] 1,0 1,1 0,0 0,0 1,1 1,1
SiO2 [%] 2,77 2,92 1,13 0,99 2,89 2,87
SiO2 rec [%] 95,8 99,4 0,5 0,1 100,0 99,3
SiO2 rec [%] 100,0 103,7 0,5 0,1 104,4 103,6
SiO2 rec [%v/o] 1,5 1,6 0,0 0,0 1,6 1,6
P [%] 0,157 0,083 5,550 4,120 0,166 0,165
Prec [%] 94,3 49,1 43,3 7,6 100,0 99,1
Prec [%] 100,0 52,0 45,9 8,1 106,0 105,1
Prec [%v/o] 13,1 6,8 6,0 1,1 13,9 13,8
TiO2 [%] 0,31 0,31 0,23 0,24 0,31 0,31
V [%] 0,012 0,010 0,009 0,010 0,010 0,011
d80 [mm] 0,137 0,110 - 0,106
d50 [mm] 0,066 0,058 - 0,057
Spec. Surface [Blaine] 720 845 - - - 845
Spec. Weight [g/cm³] 5,08 5,05 4,55 4,76 - 5,04
SGA-sample no.: 7451/8-1/1ff Appendix 9.4-4
0,089
0,045
A7451_Blötberget-2015.xlsm/PPT-8-1_CA

Studiengesellschaft für Eisenerzaufbereitung SGA
Nordic Iron Ore AB
Blötberget - 8 t Pilot sample (2015/16)
Second pilot scale flotation test for apatite removal
Size distribution of samples taken during test
Feed
Flotation
hematite
concentrate
Froth 1 Froth 2Mill
discahrge
Size Weight / Passing Weight / Passing Weight / Passing
mm [%] / [cum. %] [%] / [cum. %] [%] / [cum. %]
+ 1,0
1,0 - 0,63
0,63 - 0,5
0,5 - 0,315
0,315 - 0,16 11,9 / 88,1 2,8 / 97,2 4,4 / 95,6
0,16 - 0,1 20,7 / 67,4 20,8 / 76,4 17,4 / 78,1
0,1 - 0,063 19,0 / 48,4 22,4 / 54,0 24,9 / 53,2
0,063 - 0,04 14,7 / 33,7 17,5 / 36,4 13,1 / 40,2
0,04 - 0,025 10,0 / 23,7 9,9 / 26,6 14,6 / 25,5
0,025 - 0 23,7 / 0,0 26,6 / 0,0 25,5 / 0,0
100,0 / - 100,0 / - 100,0 / -
d80 [mm] 0,137 0,110 0,106
d50 [mm] 0,066 0,058 0,057
Spec. Surface [Blaine] 720 845 - - 845
Spec. Weight [g/cm³] 5,08 5,05 4,55 4,76 5,04
SGA-sample no.: 7451/8-1/1ff Appendix 9.4-5
Weight / Passing
[%] / [cum. %]
100,0 / -
0,089
0,045
Screen analysis
from combined
product pile
0,8 / 99,2
12,2 / 87,0
23,7 / 63,3
17,5 / 45,8
11,7 / 34,1
34,1 / 0,0
A7451_Blötberget-2015.xlsm/PPT-8-1_SA

Studiengesellschaft für Eisenerzaufbereitung SGA
Nordic Iron Ore AB
Blötberget - 8 t Pilot sample (2015/16)
Second pilot scale flotation test for apatite removal
Screen metal analysis of
Mill discharge (2nd pilot test)
Size Weight Passing Fetot SiO2 P TiO2 V
mm % / cum. % [%] [%] [%] [%] [%]
+ 1,0
1,0 - 0,63
0,63 - 0,5
0,5 - 0,315
0,315 - 0,16 4,4 / 95,6 65,2 4,15 0,175 0,280 0,0120
0,16 - 0,1 17,4 / 78,1 64,7 4,60 0,220 0,300 0,0110
0,1 - 0,063 24,9 / 53,2 65,6 3,35 0,260 0,355 0,0110
0,063 - 0,04 13,1 / 40,2 67,5 1,77 0,112 0,325 0,0120
0,04 - 0,025 14,6 / 25,5 67,3 2,15 0,090 0,290 0,0120
0,025 - 0 25,5 / 0,0 67,3 1,93 0,076 0,260 0,0110
Calculated total 100,0 66,4 2,86 0,158 0,304 0,0113
d80 [mm] 0,106 Blaine [cm²/g] 845
d50 [mm] 0,057 Specific density [g/cm³] 5,04
SGA-sample no.: 7451/5-1/100 Appendix 9.4-6
0
10
20
30
40
50
60
70
80
90
100
0,010 0,100 1,000
cum
. w
eigh
t p
ass
ing (
%)
grain size (mm)
A7451_Blötberget-2015.xlsm/PPT-8-1-SMA-MillD
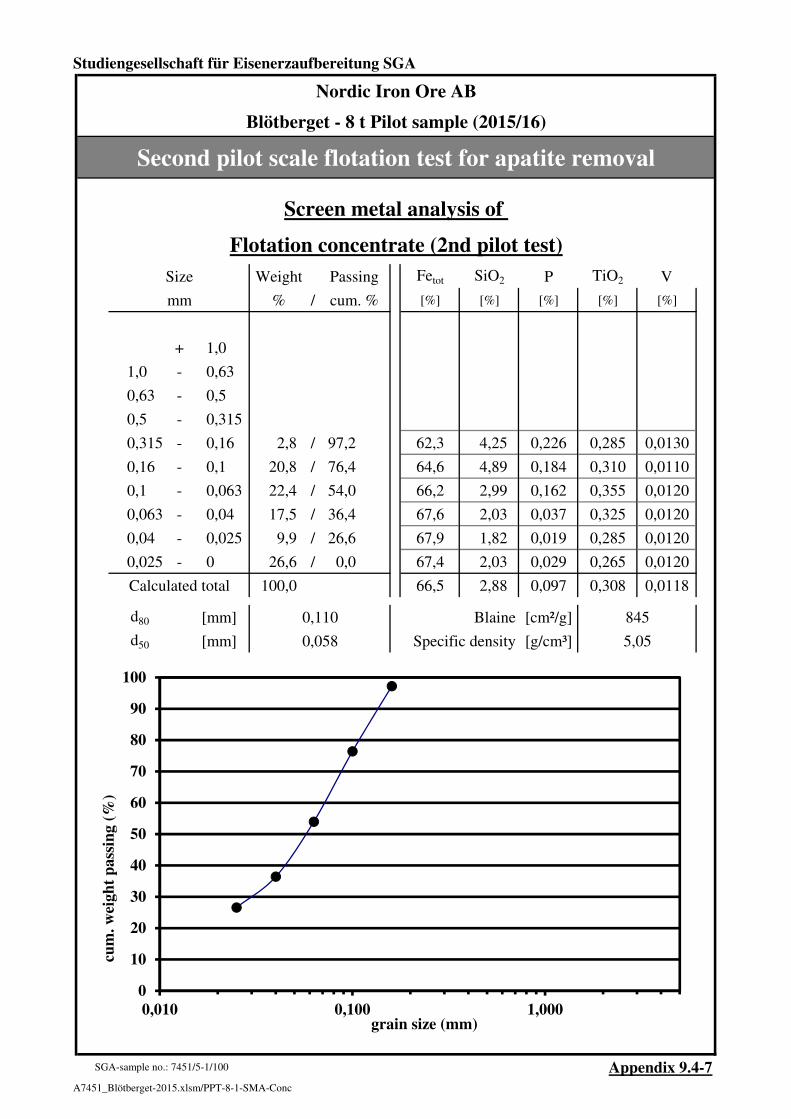
Studiengesellschaft für Eisenerzaufbereitung SGA
Nordic Iron Ore AB
Blötberget - 8 t Pilot sample (2015/16)
Second pilot scale flotation test for apatite removal
Screen metal analysis of
Flotation concentrate (2nd pilot test)
Size Weight Passing Fetot SiO2 P TiO2 V
mm % / cum. % [%] [%] [%] [%] [%]
+ 1,0
1,0 - 0,63
0,63 - 0,5
0,5 - 0,315
0,315 - 0,16 2,8 / 97,2 62,3 4,25 0,226 0,285 0,0130
0,16 - 0,1 20,8 / 76,4 64,6 4,89 0,184 0,310 0,0110
0,1 - 0,063 22,4 / 54,0 66,2 2,99 0,162 0,355 0,0120
0,063 - 0,04 17,5 / 36,4 67,6 2,03 0,037 0,325 0,0120
0,04 - 0,025 9,9 / 26,6 67,9 1,82 0,019 0,285 0,0120
0,025 - 0 26,6 / 0,0 67,4 2,03 0,029 0,265 0,0120
Calculated total 100,0 66,5 2,88 0,097 0,308 0,0118
d80 [mm] 0,110 Blaine [cm²/g] 845
d50 [mm] 0,058 Specific density [g/cm³] 5,05
SGA-sample no.: 7451/5-1/100 Appendix 9.4-7
0
10
20
30
40
50
60
70
80
90
100
0,010 0,100 1,000
cum
. w
eigh
t p
ass
ing (
%)
grain size (mm)
A7451_Blötberget-2015.xlsm/PPT-8-1-SMA-Conc

Studiengesellschaft für Eisenerzaufbereitung SGA
Nordic Iron Ore AB
Blötberget - 8 t Pilot sample (2015/16)
Second pilot scale flotation test for apatite removal
Lab scale flotation test #A9
With Mill discharge (2nd pilot test)
Flotation procedure Condition.FlotationCumulated
Dosage time time flot. time pH
[g/t] [min] [min] [min]
Conditioning Sodium silicate 500 10,0 0,0 0,0 9,3 Conditioning at 27,1 % solids
Conditioning Atrac 1563 100 3,0 0,0 0,0 9,0 Flotation at 27,1 % solids
Stage 1 Frother (MIBC) 30 0,0 1,5 1,5 9,0
Conditioning Atrac 1563 50 0,0 0,0 1,5 8,9
Stage 2 Frother (MIBC) 30 0,0 1,5 3,0 8,9
0 0,0 0,0 3,0 0,0
3,0 0,0
Stage 5 3,0 0,0
weight v/o Fe Ferec. Ferec. P Prec Prec SiO2 TiO2 V
[%] [%v/o] [%] [%] [%v/o] [%] [%] [%v/o] [%] [%] [%]
Test sample: Mill discharge (2nd pilot test)
(d80 at 0,106 mm)
Feed 100,0 19,7 66,5 100,0 34,9 0,165 100,0 13,8 2,87 0,31 0,011
Weight recovery and composition of products
Froth 1 8,7 1,7 62,2 8,2 2,9 1,7 85,0 12,1 0,72 0,26 0,011
Froth 2 4,7 0,9 67,7 4,9 1,7 0,14 3,9 0,6 1,13 0,29 0,012
Froth 3 0,0 0,0 0,0 0,0 0,0 0,00 0,0 0,0 0,00 0,00 0,000
Froth 4 0,0 0,0 0,0 0,0 0,0 0,00 0,0 0,0 0,00 0,00 0,000
Froth 5 0,0 0,0 0,0 0,0 0,0 0,000 0,0 0,0 0,00 0,00 0,000
Concentrate 86,5 17,1 66,6 86,9 30,2 0,022 11,1 1,6 3,25 0,32 0,012
Calc. balance 100,0 19,7 66,2 100,0 34,7 0,171 100,0 14,3 2,93 0,31 0,012
Calculation of remaining concentrate after respective flotation stage
weight v/o Fe Ferec. Ferec. P Prec Prec SiO2 TiO2 V
[%] [%v/o] [%] [%] [%v/o] [%] [%] [%v/o] [%] [%] [%]
Calc. balance 100,0 19,7 66,2 100,0 34,7 0,171 100,0 14,3 2,93 0,31 0,012
after Stage 1 91,3 18,0 66,61 91,8 31,9 0,028 15,0 2,1 3,14 0,32 0,012
after Stage 2 86,5 17,1 66,55 86,9 30,2 0,022 11,1 1,6 3,25 0,32 0,012
after Stage 3 86,5 17,1 66,55 86,9 30,2 0,022 11,1 1,6 3,25 0,32 0,012
after Stage 4 86,5 17,1 66,55 86,9 30,2 0,022 11,1 1,6 3,25 0,32 0,012
after Stage 5 86,5 17,1 66,55 86,9 - 0,022 11,1 - 3,25 0,32 0,012
Feed 100,0 19,7 66,5 100,0 34,9 0,165 100,0 13,8 2,87 0,31 0,011
after Stage 1 91,3 18,0 66,9 91,8 32,0 0,022 12,1 1,7 3,08 0,31 0,011
after Stage 2 86,5 17,1 66,9 87,0 30,3 0,016 8,2 1,1 3,18 0,32 0,011
after Stage 3 86,5 17,1 66,9 87,0 30,3 0,016 8,2 1,14 3,18 0,32 0,011
after Stage 4 86,5 17,1 66,9 87,0 30,3 0,016 8,2 1,14 3,18 0,32 0,011
7451/812/1..3 Appendix 9.4-8
Reagent
A7451_Blötberget-2015.xlsm/Flot10

Studiengesellschaft für Eisenerzaufbereitung SGA
Nordic Iron Ore AB
Blötberget - 8 t Pilot sample (2015/16)
Second pilot scale flotation test for apatite removal
Chemical analysis of
Flotation Hematite Concentrate (product pile) - 'Material 8'
Fetot [%] 66,45
FeO [%] 1,11
SiO2 [%] 3,0 Cr [%] 0,0137
Al2O3 [%] 0,6 Co [%] <0,0005
CaO [%] 0,395 Ni [%] 0,0024
MgO [%] 0,2 Cu [%] 0,0008
P [%] 0,096 Zn [%] 0,0019
S [%] 0,008 Pb [%] 0,0018
Na2O [%] 0,091 As [%] 0,0017
K2O [%] 0,02 Cd [%] <0,0005
Mn [%] 0,015 Tl [%] <0,001
TiO2 [%] 0,31 SrO [%] 0,0007
V [%] 0,0105 BaO [%] 0,0008
L.O.I. [%] 0,05
Magnetite by Satmagan [%] 1,7
Febound to. Magn. / Fetot [%] 1,8
SGA-sample no.: 7451/8-1/100 Appendix 9.4-9A7451_Blötberget-2015.xlsm/MAT8_CA

Studiengesellschaft für Eisenerzaufbereitung SGA
Nordic Iron Ore AB
Blötberget - 8 t Pilot sample (2015/16)
Second pilot scale flotation test for apatite removal
Screen analysis of
Flotation Hematite Concentrate (product pile) - 'Material 8'
Size Weight Passing
mm % / cum. %
+ 1,0
1,0 - 0,63
0,63 - 0,5
0,5 - 0,315
0,315 - 0,16 3,9 / 96,1
0,16 - 0,1 22,0 / 74,1
0,1 - 0,063 22,0 / 52,1
0,063 - 0,04 17,0 / 35,1
0,04 - 0,025 9,1 / 25,9
0,025 - 0 25,9 / 0,0
Calculated total 100,0
d80 [mm] 0,116 Blaine [cm²/g] 760
d50 [mm] 0,060 Specific density [g/cm³] 5,06
SGA-sample no.: 7451/8-1/100 Appendix 9.4-10
0
10
20
30
40
50
60
70
80
90
100
0,010 0,100 1,000
cum
. w
eigh
t p
ass
ing (
%)
grain size (mm)
A7451_Blötberget-2015.xlsm/MAT8_SA

Studiengesellschaft für Eisenerzaufbereitung SGA
Nordic Iron Ore AB
Blötberget - 8 t Pilot sample (2015/16)
Second pilot scale flotation test for apatite removal
Combined final concentrates
Feed Products Calc. balance
ROM sample
Cleaner LIMS
Concentrate
'Material 5'
Flotation
Hematite
Concentrate
'Material 8'
Weight [%] - 61,2 38,8 100,0
Weight [%v/o] 100,0 30,6 19,4 50,0
Fetot [%] 37,60 70,55 66,44 68,96
Ferec [%] - 62,6 37,4 100,0
Ferec [%] - - - -
Ferec [%v/o] 100,0 57,4 34,3 91,7
Magn. by Satm. [%] 30,3 93,9 1,7 58,1
Febound to. Magn. / Fetot [%] - 96,2 1,8 60,9
Magn.rec [%] - 98,9 1,1 100,0
Magn.rec [%] - - - -
Magn.rec [%v/o] 100,0 94,8 1,1 95,9
SiO2 [%] 35,35 1,15 2,92 1,84
SiO2 rec [%] - 38,3 61,7 100,0
SiO2 rec [%] - - - -
SiO2 rec [%v/o] 100,0 1,0 1,6 2,6
P [%] 0,236 0,033 0,083 0,052
Prec [%] - 38,5 61,5 100,0
Prec [%] - - - -
Prec [%v/o] 100,0 4,3 6,8 11,1
TiO2 [%] 0,185 0,084 0,310 0,172
V [%] 0,022 0,057 0,010 0,039
d80 [mm] - 0,131 0,110 0,123
d50 [mm] - 0,052 0,058 0,054
Spec. Surface [Blaine] - 830 845 836
Spec. Weight [g/cm³] - 5,09 5,05 5,07
SGA-sample no.: 7451/1-1/1ff Appendix 9.4-11
A7451_Blötberget-2015.xlsm/Mat5+8

Studiengesellschaft für Eisenerzaufbereitung SGA
Nordic Iron Ore AB
Blötberget - 8 t Pilot sample (2015/16)
Summary
Processing balance of Blötberget project
based on testwork results from this project, provided by Tata Steel ConsultingLegend:
Assay 100 %wt Conc = Concentrate Assay = Process Assay wt% Fe% Fe Rec% P% SiO2% SAT SAT Rec%
37,6 38,4 %Fe Tails = Tailings Pile = Product Pile Assay Combined Concentrate 50,2 69,0 90 0,05 1,83 57,9 96
35,4 34,9 %SiO2 U/F = Underflow Check = Balance Check Coarse Tailings 43,7 5,6 6,4 0,30 71,0 ---
0,24 0,20 %P O/F = Overflow Fine Tailings 6,1 21,5 3,4 0,75 48,69 ---
0,19 0,17 %TiO2 Rg = Rougher Feed 100,0 38,4 100,0 0,20 34,9 30,3
0,022 0,02 %V Cln = Cleaner Feed (assayed) 37,6 0,24 35,4 30,3
30,3 30,3 SAT Fe as Magnetite 58%
Conc
Pile 33,4 %wt
Tails 67,1 67,1 %Fe
4,8 4,8 %SiO2
0,08 0,08 %P
0,10 0,11 %TiO2 Pile 30,6 %wt
0,048 0,05 %V 70,45 70,5 %Fe
89,6 89,0 SAT 1,3 1,3 %SiO2
0,039 0,04 %P
66,6 %wt 2,8 %wt 0,08 0,08 %TiO2
24,1 %Fe 28,4 %Fe 0,054 0,05 %V
50,0 %SiO2 43,8 %SiO2 93,6 93,7 SAT
0,27 %P 0,53 %P
0,20 %TiO2 0,36 %TiO2
0,01 %V 0,01 %V
0,9 SAT --- SAT
Tails
2,8 %wt 43,7 %wt
11,5 %Fe Conc 5,6 %Fe
57,6 %SiO2 71,0 %SiO2
0,48 %P 0,30 %P
0,31 %TiO2 0,15 %TiO2
0,01 %V 0,003 %V
--- SAT --- SAT
Assay 20,1 %wt 1,4 %wt
66,2 65,9 %Fe 66,2 %Fe
3,0 3,3 %SiO2 2,48 %SiO2
0,15 0,16 %P 0,08 %P
0,30 0,31 %TiO2 0,25 %TiO2
0,01 0,01 %V 0,01 %V
--- --- SAT --- SAT
O/F
Tails Assay 4,3 %wt 0,3 %wt
Conc 63,7 63,5 %Fe U/F 14,3 %Fe
6,2 6,5 %SiO2 63,2 %SiO2
0,11 0,10 %P 0,44 %P
Tails 0,25 0,25 %TiO2 0,25 %TiO2
0,01 0,01 %V 4,0 %wt 0,003 %V
Conc --- --- SAT 66,6 %Fe --- SAT
3,0 %SiO2
0,08 %P
Tails 0,25 %TiO2
0,01 %V
Conc --- SAT
Bulk Assay 14,4 %wt Check 19,8 %wt Conc Pile Assay 19,5 %wt
66,7 66,9 66,6 %Fe 66,5 66,5 %Fe Tails 66,45 66,44 66,6 %Fe
2,45 2,14 2,5 %SiO2 2,6 2,6 %SiO2 3,00 2,92 2,7 %SiO2
0,18 0,19 0,18 %P 0,16 0,16 %P 0,096 0,083 0,08 %P
0,33 0,33 0,33 %TiO2 0,31 0,31 %TiO2 0,31 0,31 0,31 %TiO2
0,01 0,01 0,01 %V 0,01 0,01 %V 0,3 %wt 0,011 0,01 0,01 %V
--- --- SAT --- SAT 55 %Fe 1,7 1,7 1,7 SAT
Mass & Metallurgical Balance 1,1 %SiO2
Blötberget Project 5,3 %P
SGA Testwork, January - April 2016 0,23 %TiO2
Revision 1.2 0,01 %V
Date --- SAT
Appendix 10-1
Product Balance
Rougher LIMS Rg LIMS Conc Regrinding
<1mm to <0.1mm
Cyclone O/F Rg Spirals A-C Rg Spiral Tails Wet Screen
<1mm Feed
Rg Spiral Conc
Cleaner LIMS Magn Concentrate
<0.1mm
Rg LIMS Tails Cln LIMS Tails
3-stage 0.1mm / 0.04mm
Scavenger Stage
Processing
Optional
Regrinding Cyclone O/F
to <0.1mm
Cleaner Spiral D Tailings D
Hem Concentrate
Tailings
Stage 1 0.063mm
Cleaner Spiral E Underflow
Stage 2
Derrick Screen
<0.1mm
Flotation Tails
26. Apr 16
Cleaner Spiral F
Stage 3
Cln Spiral Conc Flotation Feed Apatite Flotation
A7451_Blötberget-2015.xlsm/Tata-balance

SGA Studienges. für Eisenerzaufbereitung GmbH & Co KG
Nordic Iron Ore AB
Blötberget - 3 ROM sub-samples (18 t total, 2015)
Jaw Crusher
Ratzinger Type Inlet port 400 x 250 mm
B 1415/25 Instal. electrical power 15 kW
Jaw setting
Appendix E-1
SGA-Equipmentlist_A7451.xlsx

SGA Studienges. für Eisenerzaufbereitung GmbH & Co KG
Nordic Iron Ore AB
Blötberget - 8 t Pilot sample (2015/16)
High Pressure Grinding Rolls (HPGR)
Manufactorer Köppern Roller diameter 650 mm
Type 2 / 6,5 - 230 Working width 230 mm
Roller speed 15 - 30 min-1
Circumferential speed 0,5 - 1,0 m/s
Roll surface Stud lining
Specific pressing force up to 8000 kN/m²
Total pressing force up to 1196 kN
Power of main drive 90 kW
Feeding device Filling funnel
Throughput for Iron Ore up to 25 t/h
Appendix E-2
SGA-Equipmentlist_A7451.xlsx

SGA Studienges. für Eisenerzaufbereitung GmbH & Co KG
Nordic Iron Ore AB
Blötberget - 8 t Pilot sample (2015/16)
Dry screen
Främbs & Freudenberg Length 1200 mm
(1954) Width 600 mm
Screen single screen
Cut size between 0,315 and 10 mm
Oscillation 1420 min-1
Feeding by shaking trough
Appendix E-3
SGA-Equipmentlist_A7451.xlsx

SGA Studienges. für Eisenerzaufbereitung GmbH & Co KG
Nordic Iron Ore AB
Blötberget - 8 t Pilot sample (2015/16)
Davis Tube
Eriez Model EDT Tube diameter 38 mm
Inclination of the tube 50°
Frequency of strokes 120 /min
Field strenght 3500 Gauss
Feed weight 10 g
Waterflow 1,5 l/min
Test time 10 min
Appendix E-4
SGA-Equipmentlist_A7451.xlsx

SGA Studienges. für Eisenerzaufbereitung GmbH & Co KG
Nordic Iron Ore AB
Blötberget - 8 t Pilot sample (2015/16)
Pilot Plant Wet Medium Intensity Magnetic Separator
FST Type FPMWS 1203-Separator (wet)
(1-stage separator, Diameter 1200 mm
especially for Cobber stage) Width 300 mm
Field strenght 3500 Gauss
Speed of rotation 28 rpm
Tank Concurrent
Appendix E-5
SGA-Equipmentlist_A7451.xlsx

SGA Studienges. für Eisenerzaufbereitung GmbH & Co KG
Nordic Iron Ore AB
Blötberget - 8 t Pilot sample (2015/16)
Pilot Plant Low Intensity Magnetic Separator
Eriez Type Diameter 1200 mm
(1-stage separator, Width 450 mm
especially for Rougher stage) Field strenght 1000
Pulpflow 10 - 15 m³/h for each stage
Tank Countercurrent
Appendix E-6
Gauss in 30 mm distance
SGA-Equipmentlist_A7451.xlsx

SGA Studienges. für Eisenerzaufbereitung GmbH & Co KG
Nordic Iron Ore AB
Blötberget - 8 t Pilot sample (2015/16)
Pilot Plant Low Intensity Magnetic Separator
Sala Type Diameter 916 mm
(2-stage separator, Width 300 mm
especially for Cleaner stage) Field strenght 600
Pulpflow 10 - 15 m³/h for each stage
Tank Countercurrent
Appendix E-7
Gauss in 30 mm distance
SGA-Equipmentlist_A7451.xlsx

SGA Studienges. für Eisenerzaufbereitung GmbH & Co KG
Nordic Iron Ore AB
Blötberget - 8 t Pilot sample (2015/16)
Shaking table
Humboldt Wedag Length 3.2 m
Width 1.3 m
Capacity 100-200 kg/h
Oscillation 330 min-1
Appendix E-8
SGA-Equipmentlist_A7451.xlsx

SGA Studienges. für Eisenerzaufbereitung GmbH & Co KG
Nordic Iron Ore AB
Blötberget - 8 t Pilot sample (2015/16)
Sink-float laboratory equipment
Standard reagents
Bromoform Dijodmethan Clericis liquid
1.0 - 2.89 kg/l 2.9 - 3.3 kg/l 3.4 - 3.9 kg/l
Xylol for dilution Xylol for dilution Water for dilution
Glass-cyclinders used for sink-float analysis
Float-Product
135 ml
Sink-Product
120 ml
Appendix E-9
SGA-Equipmentlist_A7451.xlsx

SGA Studienges. für Eisenerzaufbereitung GmbH & Co KG
Nordic Iron Ore AB
Blötberget - 8 t Pilot sample (2015/16)
Laboratory High Intensity Magnetic Separator
Appendix E-10
SGA-Equipmentlist_A7451.xlsx

SGA Studienges. für Eisenerzaufbereitung GmbH & Co KG
Nordic Iron Ore AB
Blötberget - 8 t Pilot sample (2015/16)
Pilot Plant Spiral Separation
3 stage spiral concentrator
consisting of: Manufacturer
3 rougher units Brand name
2 x 3 cleaner units Spiral outer diameter 600 mm
1 cyclone for dewatering of the cleaner 1 Spiral inner diameter 110 mm
and cleaner 2 tailings Spiral gradient ca. 20 degree
Appendix E-11
CPG Resources Mineral
Technologies PTY (ltd)
WW6PLUS
Rougher stage, consisting of 3 units spiral
conc. type WW6PLUS, 7 turns.
Cleaner stage 1, consisting of 3 units spiral
conc. type WW6PLUS, 5 turns.
Cleaner stage 2, consisting of 3 unis spiral
conc. type WW6PLUS, 5 turns.
Cyclone, Krebs type D4BB-12-972, diameter
100 mm.
SGA-Equipmentlist_A7451.xlsx

SGA Studienges. für Eisenerzaufbereitung GmbH & Co KG
Nordic Iron Ore AB
Blötberget - 8 t Pilot sample (2015/16)
Wet screen
Vibration Screen Length 1830 mm
Derrick Width 520 mm
Model K 24 - 72W - 3S Screens several steel and polyurethane panels
Cut size ~44 to 500 µm
Oscillation 3000 min-1
Appendix E-12
SGA-Equipmentlist_A7451.xlsx
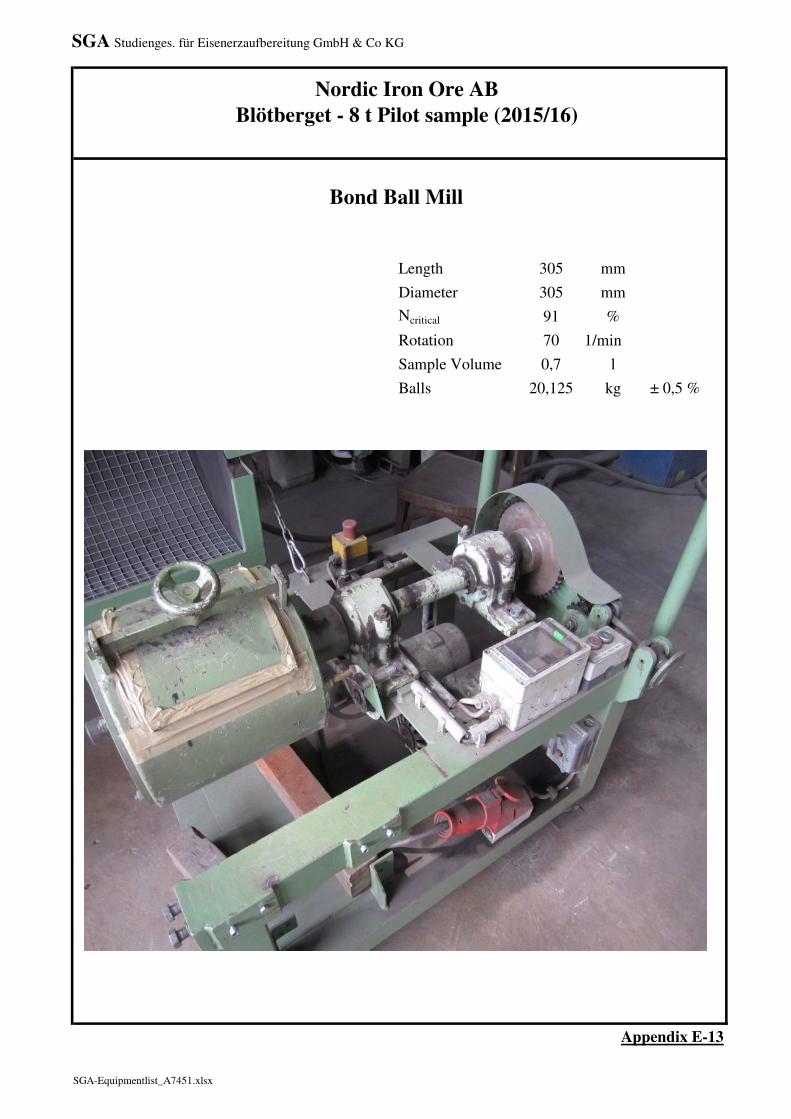
SGA Studienges. für Eisenerzaufbereitung GmbH & Co KG
Nordic Iron Ore AB
Blötberget - 8 t Pilot sample (2015/16)
Bond Ball Mill
Length 305 mm
Diameter 305 mm
Ncritical 91 %
Rotation 70 1/min
Sample Volume 0,7 l
Balls 20,125 kg ± 0,5 %
Appendix E-13
SGA-Equipmentlist_A7451.xlsx

SGA Studienges. für Eisenerzaufbereitung GmbH & Co KG
Nordic Iron Ore AB
Blötberget - 8 t Pilot sample (2015/16)
Laboratory rod mill / Laboratory ball mill
Volume 5,7 l (315 mm x Ø 152 mm)
Rod charge Stainless steel rods, Ø 1.8 mm, 5 kg
Ball charge Ceramic balls, Ø 10-20 mm, 3 kg
Appendix E-14
SGA-Equipmentlist_A7451.xlsx

SGA Studienges. für Eisenerzaufbereitung GmbH & Co KG
Nordic Iron Ore AB
Blötberget - 8 t Pilot sample (2015/16)
Laboratory Low Intensity Magnetic Separator
Sala Blue Ribbon Diameter 200 mm
(1-stage separator, Width 100 mm
especially for Rougher stage) Field strenght 1200
Tank Countercurrent
Appendix E-15
Gauss on drum surface
SGA-Equipmentlist_A7451.xlsx

SGA Studienges. für Eisenerzaufbereitung GmbH & Co KG
Nordic Iron Ore AB
Blötberget - 8 t Pilot sample (2015/16)
Ball mill
Length 1800 mm
Diameter 1100 mm
Ncritical 72 %
Balls 35 - 25 mm
Energy consumption 2-14,4 kWnet depending on grinding ball charge
Appendix E-16
SGA-Equipmentlist_A7451.xlsx

SGA Studienges. für Eisenerzaufbereitung GmbH & Co KG
Nordic Iron Ore AB
Blötberget - 8 t Pilot sample (2015/16)
Pilot Plant low Intensity Magnetic Separator
Thune Type Diameter 600 mm
(2-stage separator, Width 300 mm
especially for Cleaner stages) Field strenght 500
Pulpflow 6-8 m³/h for each stage
Tank Countercurrent
Appendix E-17
Gauss in 30 mm distance
SGA-Equipmentlist_A7451.xlsx

SGA Studienges. für Eisenerzaufbereitung GmbH & Co KG
Nordic Iron Ore AB
Blötberget - 8 t Pilot sample (2015/16)
Wet screen
Vibration Screen Length 620 mm
Derrick Width 520 mm
Model K 48 - 96 MS-J Screens several steel and polyurethane panels
Cut size ~33 to 350 µm
Oscillation 3000 min-1
Appendix E-18
SGA-Equipmentlist_A7451.xlsx

SGA Studienges. für Eisenerzaufbereitung GmbH & Co KG
Nordic Iron Ore AB
Blötberget - 8 t Pilot sample (2015/16)
Ball mill
Length 735 mm
Diameter 725 mm
Ncritical 74,3 %
Balls 34 - 12 mm
Energy consumption max. 2 kWnet depending on grinding ball charge
Appendix E-19
SGA-Equipmentlist_A7451.xlsx

SGA Studienges. für Eisenerzaufbereitung GmbH & Co KG
Nordic Iron Ore AB
Blötberget - 8 t Pilot sample (2015/16)
Dynamic up-stream hydrosizer (laboratory scale)
tube diameter 30-90 mm
tube height 200-300 mm
reagent for silicate dispersion Na-Silicate
reagent for hematite/ magnetite flocculation Starch
Appendix E-20
SGA-Equipmentlist_A7451.xlsx

SGA Studienges. für Eisenerzaufbereitung GmbH & Co KG
Nordic Iron Ore AB
Blötberget - 8 t Pilot sample (2015/16)
Pilot Plant Spiral Separation
1 stage spiral concentrator
WW6PLUS Manufacturer
Brand name
Spiral outer diameter 600 mm
Spiral inner diameter 110 mm
Spiral gradient ca. 20 degree
Appendix E-21
CPG Resources Mineral
Technologies PTY (ltd)
WW6PLUS
Single stage, consisting of 1 unit spiral unit type WW6PLUS, 7 turns.
SGA-Equipmentlist_A7451.xlsx

SGA Studienges. für Eisenerzaufbereitung GmbH & Co KG
Nordic Iron Ore AB
Blötberget - 8 t Pilot sample (2015/16)
Laboratory flotation cell
Fahrenwald Denver Cells ½, 1, 2 ltr.
Airflow up to 80 l/h
Agitator up to 3000 min-1
Appendix E-22
SGA-Equipmentlist_A7451.xlsx

SGA Studienges. für Eisenerzaufbereitung GmbH & Co KG
Nordic Iron Ore AB
Blötberget - 8 t Pilot sample (2015/16)
Mixing vessel
Appendix E-23
SGA-Equipmentlist_A7451.xlsx
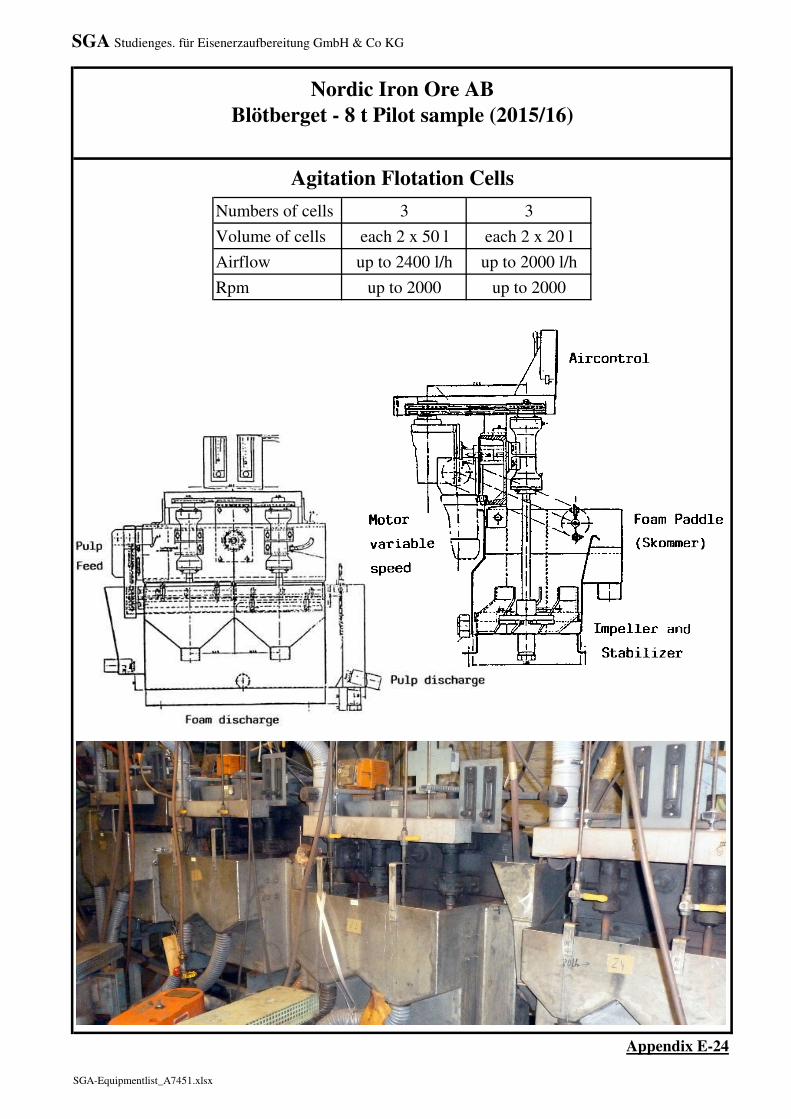
SGA Studienges. für Eisenerzaufbereitung GmbH & Co KG
Nordic Iron Ore AB
Blötberget - 8 t Pilot sample (2015/16)
Agitation Flotation Cells
Numbers of cells 3 3
Volume of cells each 2 x 50 l each 2 x 20 l
Airflow up to 2400 l/h up to 2000 l/h
Rpm up to 2000 up to 2000
Appendix E-24
SGA-Equipmentlist_A7451.xlsx

SGA Studienges. für Eisenerzaufbereitung GmbH & Co KG
Nordic Iron Ore AB
Blötberget - 8 t Pilot sample (2015/16)
HIG-Mill
High Intensity Grinding Tower Mill
Outotec / STM Minerals
HIG 25
Gross volume 25 l
Nominal power / speed 13 kW / 510 rpm
Max. power / speed 30 kW / 800 rpm
Operating mill speed range 0..700 rpm
Typical flow rate range 150..500 liter/hour
Slurry density 40..60 w%
Grinding media filling level 40..80 %
Grinding media 2..6 mm, ceramics or steel
Appendix E-25
High intensity
grinding zone
Lower intensity
grinding zone
Rotating discs
Stationary
stator rings
Mill drive shaft
SGA-Equipmentlist_A7451.xlsx