laboratory and field investigation of bituminous …
TRANSCRIPT
LABORATORY AND FIELD INVESTIGATION OF BITUMINOUS PAVEMENT AND AGGREGATE POLISHING S. H. Dahir, Department of Civil Engineering, Pennsylvania State University,
Middletown; W. E. Meyer, Department of Mechanical Engineering, Pennsylvania State University,
University Park; and R. R. Hegmon, Office of Research, Federal Highway Administration
To investigate the field performance of aggregates, 11 test strips containing replicate sections of bituminous pavements used in Pennsylvania were designed and constructed by a joint industry-Pennsylvania Department of Transportation task force. In the investigation, 52 aggregate samples and 223 pavement cores of the test sections were polished in the laboratory by usingvariouspolishingmethods and friction measurement techniques. Correlations between field and laboratory data were sought, and factors associated with skid-resistance variations were observed and investigated. Laboratory-field data correlations indicated that the general level of skidresistance characteristics of surface aggregates may be determined in the laboratory and that the aggregates may be ranked similarly by both approaches. However, the correlations failed to produce regression equations that could, with confidence, define specific mathematical relationships for predicting specific field skid numbers. A minimum field skid number occurred in the late summer and fall and correlated better with laboratory results than a mean skid number. The minimum number appears to stabilize after 2 years of pavement exposure to traffic, irrespective of the level of traffic. Higher average daily traffic produced a lower skid-resistance level, and one truck was equivalent to about 18 passenger cars in polishing effects. Cumulative traffic also caused reduction in the skid number until the surface stabilized; then the number leveled off. Temperature correction of the minimum skid number appears to have little or no effect on skid data analysis. Increase in the percentage of insoluble residue of carbonate aggregates indicated only possible increases in skid resistance, but no dependable quantitative correlation could be obtained from available tests.
•RECENTLY, there has been a continuing effort in Pennsylvania to arrive at satisfactory, updated solutions to the problem of how best to use available materials and methods for providing long-lasting pavement surfaces with wet skid-resistance characteristics. As part of this effort, a cooperative laboratory-field skid-resistance testing program has been conducted in Pennsylvania since 1968, primarily to evaluate aggregate skid-resistance performance on bituminous surfaces. Eleven test strips ( 1) planned by Pennsylvania Department of Transportation and industry were constructed in 11 geographic locations of the state and have been monitored for field skid-resistance data. The Pennsylvania State University (Penn State) Automotive Research Program conducted part of the laboratory investigations on bituminous pavement polishing (8). Laboratory and field data were pooled and analyzed so that laboratory polishing performance of aggregates could be obtained for establishing correlations with field skid data from Pennsylvania DOT test strips and for determining the effects of aggregate type and other related factors on surface skid resistance.
Labotatory data were obtained by using three polishing methods, three friction measuring techniques, and four sample forms. Field data were obtained on the test strips periodically by Pennsylvania DOT by using skid trailers conforming to ASTM E 274 at
1
2
40 mph (64 km/h). Other pertinent data were also obtained and used in the analysis and discussion. All tests were performed on aggregates and sections used in the test strip program.
Results of laboratory tests using various procedures were correlated with one another and with field skid resistance. Other factors influencing skid resistance, such as time, traffic, and insoluble residue of carbonate aggregates, were also investigated when they were relevant to the research.
AGGREGATE POLISHING
Fifty-two samples from 10 aggregate types representing those used in the test strip program wer e supplied by P ennsylvania DOT. The strips included 156 r eplicate sec tions of 1,000-ft (304.8-m) length or more each, totaling about 44 lane miles (13.4 km). Test strip layouts and pertinent data have been documented in department reports ( 1, 2). A summary of the test strip sections and of the aggregates used in the polishing pro- -gram is given in Table 1.
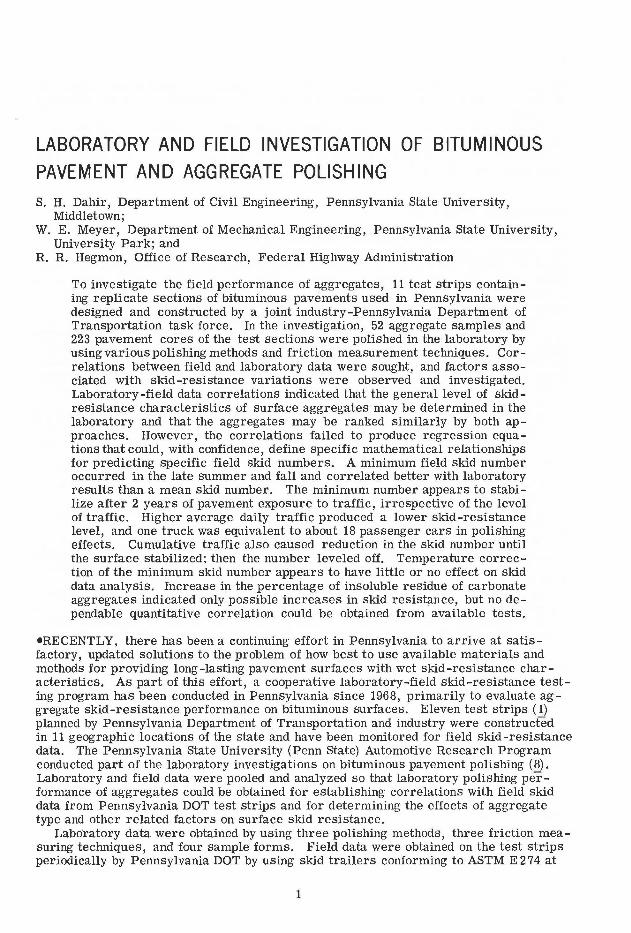
All aggregate samples were polished. From each sample, two 4 by 12-in. (102 by 305-mm) panels were prepared by setting% to % -in. (6.35 to 9.53-mm) aggregate particles in an epoxy matrix. The panels were polished with the Penn State rotary drum polishing machine (RDM) (3). Panel frictional resistance was measured with the Penn State drag tester (3) in drag tester numbers (DTN) and with the British portable tester (BPT) in British portable numbers (BPN), according to ASTM E 303-69. An overall view of the rotary drum machine (RDM) is shown in Figure 1.
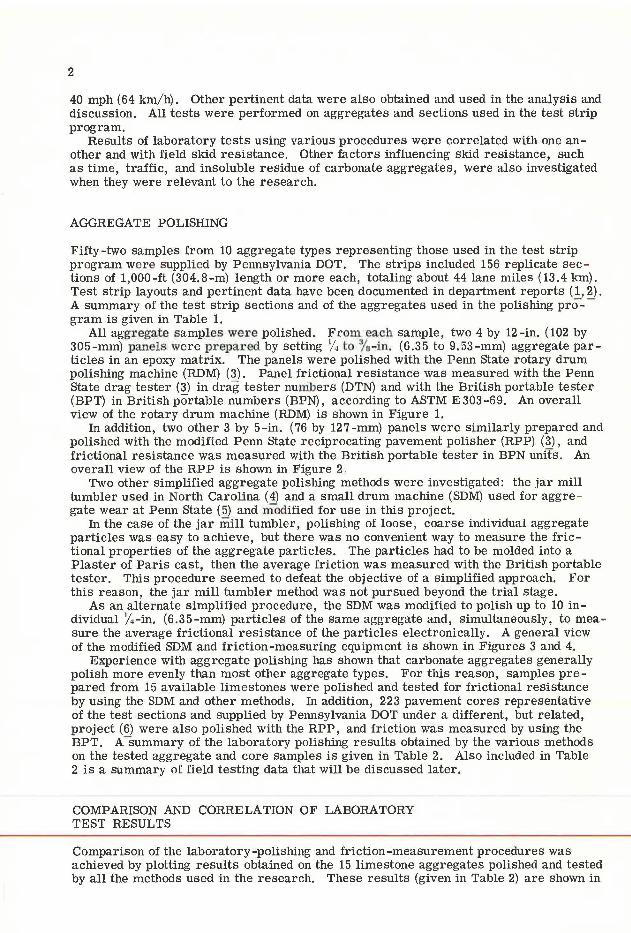
In addition, two other 3 by 5-in. (76 by 127-mm) panels were similarly prepared and polished with the modified P enn State r eciprocating pavement polisher (RPP) (3), and frictional resistance was measured with the British portable tester in BPN units. An overall view of the RPP is shown in Figure 2 ~
Two other simplified aggregate polishing methods were investigated: the jar mill tumbler used in North Carolina (4) and a small drum machine (SDM) used for aggre gate wear at Penn State (5) and modified for use in this project.
In the case of the jar mill tumbler, polishing of loose, coarse individual aggregate particles was easy to achieve, but there was no convenient way to measure the frictional properties of the aggregate particles. The particles had to be molded into a Plaster of Paris cast, then the average friction was measured with the British portable tester. This procedure seemed to defeat the objective of a simplified approach. For this reason, the jar mill tumbler method was not pursued beyond the trial stage.
As an alternate simplified procedure, the SDM was modified to polish up to 10 individual %-in. (6.35-mm) particles of the same aggregate and, simultaneously, to mea sure the average frictional resistance of the particles electronically. A general view of the modified SDM and friction-measuring equipment is shown in Figures 3 and 4.
Experience with aggregate polishing has shown that carbonate aggregates generally polish more evenly than most other aggregate types. For this reason, samples pre -pared from 15 available limestones were polished and tested for frictional resistance by using the SDM and other methods. In addition, 223 pavement cores representative of the test sections and supplied by Pennsylvania DOT under a different, but related, project (6) were also polished with the RPP, and friction was measured by using the BPT. A summary of the laboratory polishing results obtained by the various methods on the tested aggregate and core samples is given in Table 2. Also included in Table 2 is a summary of field testing data that will be discussed later.
COMPARISON AND CORRELATION OF LABORATORY TEST RESULTS
Comparison of the laboratory-polishing and friction-measurement procedures was achieved by plotting results obtained on the 15 limestone aggregates polished and tested by all the methods used in the research. These results (given in Table 2) are shown in
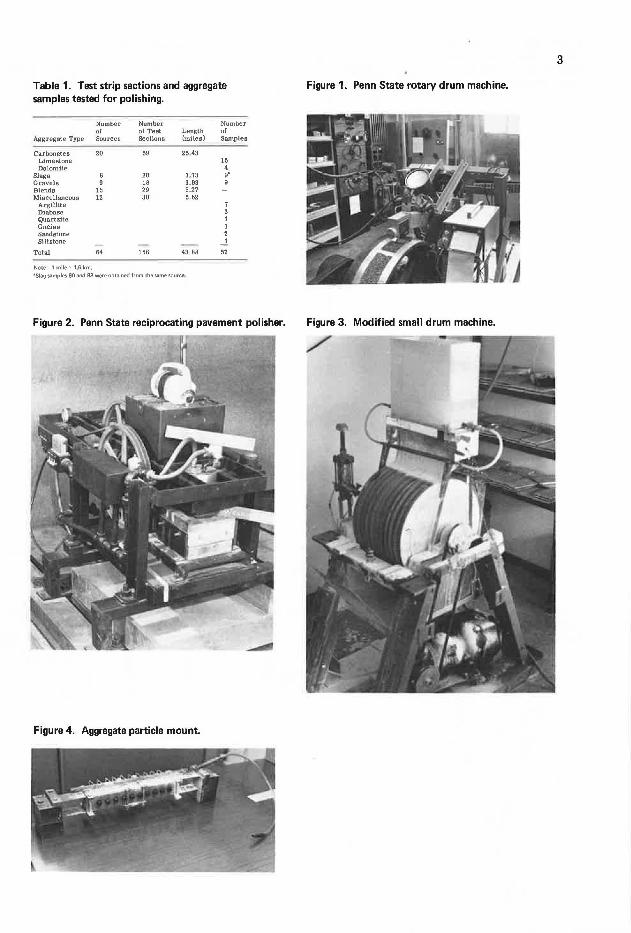
Table 1. Test strip sections and aggregate samples tested for polishing.
Number Number Number ol of Test Length of
Aggregate Type Sourcee Sections (miles) Samples
Carbonates 20 59 25.43 Limestone 15 Dolomite 4
Slags 8 20 3. 73 9• Gravels 9 18 3.83 9 BJ ends 15 29 5.27 Miscellaneous 12 30 5.62
Argillite 7 Diabase 3 Quartzite 1 Gneiss 1 Sandstone 2 Siltstone ....!
Total 64 156 43.88 52
Nole: 1 mile=-1 ~6 km..
•slag samples BO and 88 were obtained from lhe same source.
Figure 2. Penn State reciprocating pavement polisher.
Figure 4. Aggregate particle mount.
3
Figure 1. Penn State rotary drum machine.
Figure 3. Modified small drum machine.
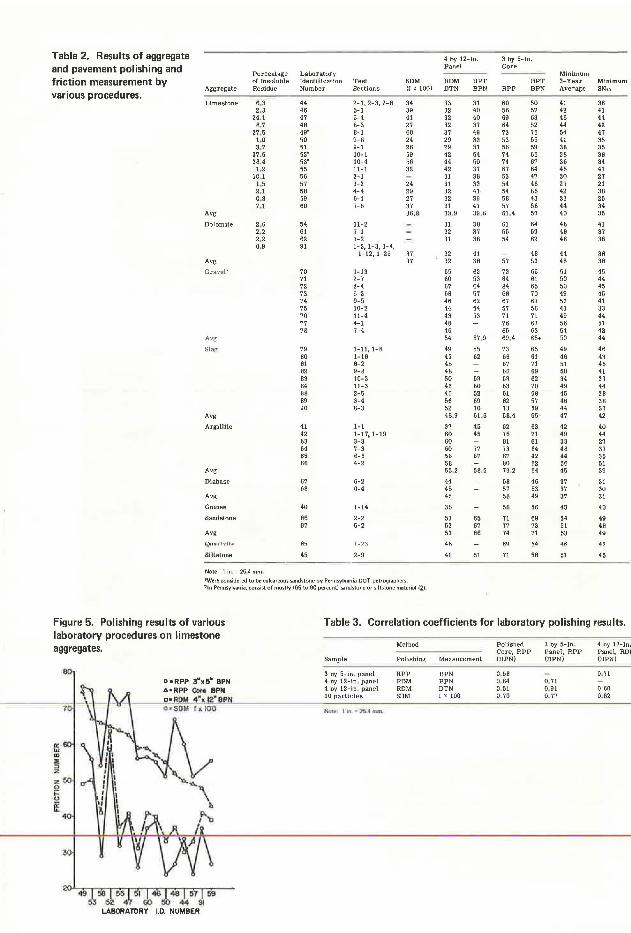
Table 2. Results of aggregate 4 by 12-In. 3 by 5-In.
and pavement polishing and Panel Core Percentage Laboratory Minimum
friction measurement by o( Insoluble Identification Test SDM RDM BPT BPT 3-Year Minimum
various procedures. Aggregate Residue Number Sections (f' 100) DTN BPN RPP BPN Average SN40
Limestone 6. 3 44 2-1, 2-3, 2-8 34 33 31 60 50 41 36 2. 8 46 5-1 39 32 40 56 57 42 41
24.1 47 5-4 41 32 40 69 63 46 44 8,7 48 8-3 27 32 37 64 52 44 42
37. 5 49• 8-1 60 37 49 73 75 54 47 LO 50 9-6 24 29 33 53 55 41 35 3. 7 51 9-1 26 29 31 56 59 38 35
37 . 5 52' 10-1 59 42 54 74 65 38 38 30.4 53' 10-4 56 44 50 74 67 36 34 1.2 55 11-1 32 42 37 67 64 46 41
10 .1 56 3-1 31 38 53 47 30 27 1, 5 57 3-2 24 31 33 54 48 27 21 2.1 58 4-4 29 32 41 54 66 42 38 0,8 59 6-1 27 32 39 58 43 33 25 7 ,1 60 7-5 37 31 41 57 58 44 34
Avg 3U 33 ,9 39 ,6 61.4 57 40 35
Dolomite 2. 6 54 11-2 31 38 61 64 46 41 2.2 61 7-1 32 37 55 59 48 37 2. 2 62 7-2 31 36 54 62 48 36 0. 9 91 1-2, 1-3, 1-4,
1-12,1-25 37 32 41 48 44 38 Avg 37 32 38 57 53 45 38
Gravelb 70 1-13 65 62 73 65 51 45 71 2-7 60 53 64 61 50 44 72 2-4 67 64 84 65 50 45 73 5-3 68 57 68 70 49 45 74 9-5 46 62 67 67 53 41 75 10-2 44 54 57 56 41 33 76 11-4 43 53 71 71 49 44 77 4-1 48 76 62 56 51 78 7-4 46 65 63 54 42
A•g 54 57 ,9 69.4 65• 50 44
Slag 79 1-11, 1-8 49 55 73 65 49 46 80 1-18 45 62 68 61 46 43 81 8-2 48 67 71 51 46 82 9-8 48 66 69 50 41 83 10-3 50 63 63 62 34 33 84 11-3 46 60 63 70 49 44 88 2-5 46 52 61 58 45 38 89 3-4 56 69 82 57 46 38 90 6-3 52 70 73 59 44 37
Avg 48.9 6L6 68.4 65- 47 42
Argilute 41 1-1 37 45 62 63 42 40 42 1-17, 1-19 60 45 76 71 49 44 63 3-3 60 Bl 61 33 27 64 7-3 60 77 73 64 48 37 65 6-5 56 67 67 42 44 35 66 4-2 58 80 62 56 51
Avg 55 ,2 58, 5 73 ,2 64 45 39
Diabase 67 6-2 44 58 46 37 31 68 6-4 45 57 53 37 30
Avg 45 58 49 37 31
Gneiss 40 1·14 36 56 56 43 40
Sandstone 86 2-2 53 65 71 69 54 49 87 5-2 53 67 77 73 51 48
Avg 53 66 74 71 53 49
Qirn rt1dh> " 1-?.~ 46 13~ 54 46 42
Siltstone 45 2-9 41 51 71 58 51 45
Note: 1 in .. 254 mm
'Were considered lo be calcareous s.andslone by Pennsylvania DOT petrographers bin Pennsylvania, consist of mostly (65 to 90 percent) sands1one or siltstone material f2J
Figure 5. Polishing results of various Table3. Correlation coefficients for laboratory polishing results. laboratory procedures on limestone aggregates. Method Polished 3 by 5-In. 4 by 12-In.
Core, RPP Panel, RPP Panel, Rm Sample Polishing Measurement (BPN) (BPN) (BPN)
3 by 5-in , panel RPP BPN 0. 58 0,71 4 by 12-in . panel RDM BPN 0. 64 0.71 4 by 12-in . panel RDM DTN 0. 51 0.91 0.60 10 particles SDM f x 100 0.70 0.77 0. 82
NGtL I in. • l !l.4 rrJm,
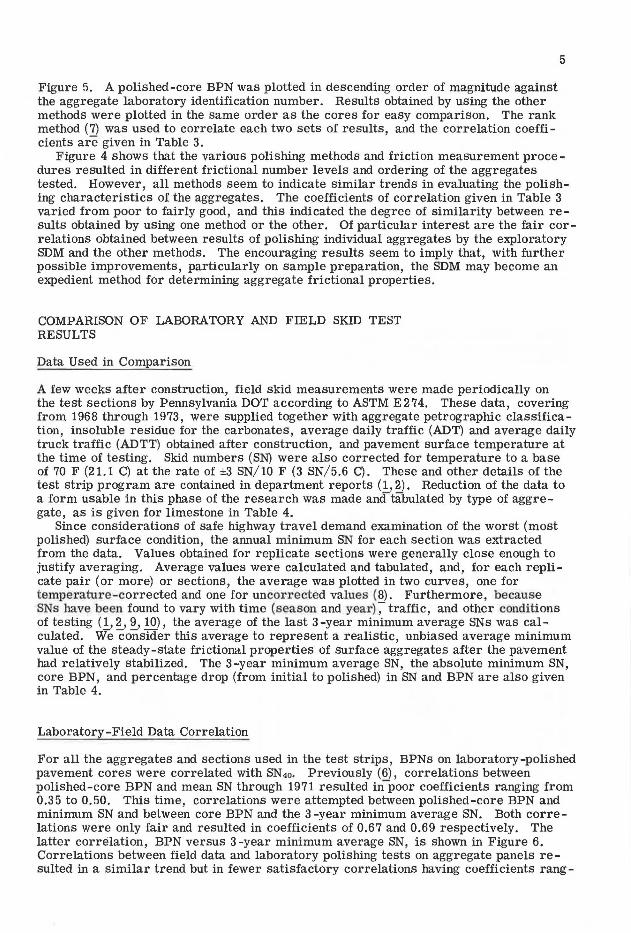
Figure 5. A polished-core BPN was plotted in descending order of magnitude against the aggregate laboratory identification number. Results obtained by using the other methods were plotted in the same order as the cores for easy comparison. The rank method (7) was used to correlate each two sets of results, and the correlation coefficients are given in Table 3.
5
Figure 4 shows that the various polishing methods and friction measurement proce -dures resulted in different frictional number levels and ordering of the aggregates tested. However, all methods seem to indicate similar trends in evaluating the polishing characteristics of the aggregates. The coefficients of correlation given in Table 3 varied from poor to fairly good, and this indicated the degree of similarity between results obtained by using one method or the other. Of particular interest are the fair cor -relations obtained between results of polishing individual aggregates by the exploratory SDM and the other methods. The encouraging results seem to imply that, with further possible improvements, particularly on sample preparation, the SDM may become an expedient method for determining aggregate frictional properties.
COMPARISON OF LABORATORY AND FIELD SKID TEST RESULTS
Data Used in Comparison
A few weeks after construction, field skid measurements were made periodically on the test sections by Pennsylvania DOT according to ASTM E 2 74. These data, covering from 1968 through 1973, were supplied together with aggregate petrographic classification, insoluble residue for the carbonates, average daily traffic (ADT) and average daily truck traffic (ADTT) obtained after construction, and pavement surface temperature at the time of testing. Skid numbers (SN) were also corrected for temperature to a base of 70 F (21.l C) at the rate of ±3 SN/10 F (3 SN/5.6 C). These and other details of the test strip program are contained in department reports ( 1, 2). Reduction of the data to a form usable in this phase of the research was made and tabulated by type of aggre -gate, as is given for limestone in Table 4.
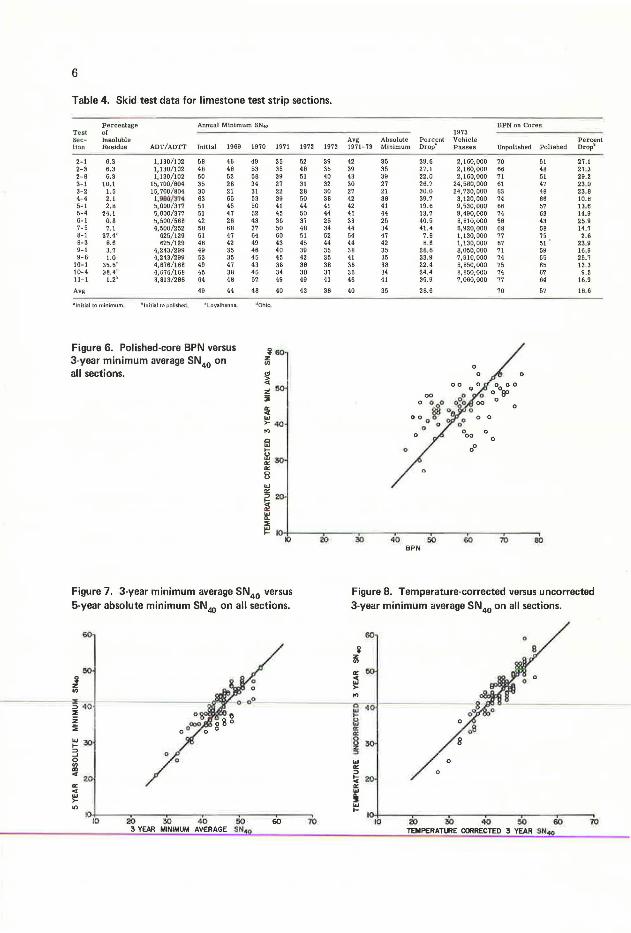
Since considerations of safe highway travel demand examination of the worst (most polished) surface condition, the annual minimum SN for each section was extracted from the data. Values obtained for replicate sections were generally close enough to justify averaging. Average values were calculated and tabulated, and, for each replicate pair (or more) or sections, the average was plotted in two curves, one for temperature-corrected and one for uncorrected values (8). Furthermore, because SNs have been found to vary with time (season and year)-; traffic, and other conditions of testing ( 1, 2, 9, 10), the average of the last 3 -year minimum average SN s was calculated. We consider this average to represent a realistic, unbiased average minimum value of the steady-state frictional properties of surface aggregates after the pavement had relatively stabilized. The 3-year minimum average SN, the absolute minimum SN, core BPN, and percentage drop (from initial to polished) in SN and BPN are also given in Table 4.
Laboratory-Field Data Correlation
For all the aggregates and sections used in the test strips, BPNs on laboratory-polished pavement cores were correlated with SN40. Previously (6), correlations between polished-core BPN and mean SN through 1971 resulted inpoor coefficients ranging from 0.35 to 0.50. This time, correlations were attempted between polished-core BPN and minimum SN and between core BPN and the 3-year minimum average SN. Both correlations were only fair and resulted in coefficients of 0.67 and 0.69 respectively. The latter correlation, BPN versus 3-year minimum average SN, is shown in Figure 6. Correlations between field data and laboratory polishing tests on aggregate panels resulted in a similar trend but in fewer satisfactory correlations having coefficients rang-
6
Table4. Skid test data for limestone test strip sections.
Percentage Annual Minimum SN40 Test o(
Sec- Insoluble tlon Residue ADT/ADTT Initial 1969 1970 1971
2-1 6,3 1,130/102 58 46 2-3 6.3 1, 130/102 48 48 2-8 6.3 1,130/102 50 52 3-1 10.I 15, 700/ 604 35 28 3-2 1.5 15, 700/804 30 21 4-4 2.1 l, ~00/314 63 65 5-1 2.8 5,000/377 51 45 5-4 24.1 5,000/377 51 47 6-1 0.8 5,500/568 42 28 7-5 7.1 4,500/252 58 68 8-1 37.4" 625/ 129 51 47 8-3 8.6 625/ 129 46 42 9-1 3.7 4,243 / 299 49 35 9-6 1.0 4,243/299 53 35
10-1 35.5° 4,676/168 49 47 10-4 38.4e 4,676/168 45 38 11-1 1.26 3,813/288 64 48
Avg 49 44
'Initial co minimum blnitial to polished •Loyalhanna
Figure 6. Polished-core BPN versus 3-year minimum average SN40 on all sections.
49 35 53 35 58 39 34 27 31 22 53 39 50 41 52 45 43 36 37 50 64 60 49 43 46 40 45 45 43 38 46 34 57 49
48 40
"Ohio.
i 60 z "' ~ z :i
~ ... >- 40
"' @ ~ 30
"" 8 ... a: ::> 20 ~ "" ~ :I! ~ 10
IO
Figure 7. 3-year minimum average SN40 versus 5-year absolute minimum SN40 on all sections.
60
50
l "'
~~~~·~ 40 1-~~~~~~~~~
:I! z ii ... t-::> ..J 0 Cl) ., er
"' er ... >-"'
30
2
IO 10 20 30 40
3 YEAR MINIMUM AVERAGE 50 60 SN10
1972 1973
52 39 48 35 51 40 31 32 28 30 50 38 44 41 50 44 37 25 48 34 51 52 45 44 39 35 42 35 38 38 38 37 49 41
43 38
20
70
BPN on Cores 1973
Avg Absolute Perc~nt Vehicle Percent 1971-73 Minimum Drop Passes Unpolished Polished Drop'
42 35 39.6 2,160,000 70 51 27.1 39 35 27.1 2,160,000 66 48 27_3 43 39 22.0 2,160,000 71 51 29.2 30 27 26.7 24,580,000 61 47 23.0 27 21 30.0 24, 130,000 63 48 23.8 42 38 39.7 3,120,000 74 66 10.B 42 41 19.6 9, 530,000 66 57 13.6 46 44 13.7 9,490,000 74 63 14.9 33 25 40.5 8, 810,000 58 43 25.9 44 34 41.4 6,920,000 68 58 14.7 54 47 7.8 1,130,000 77 75 2.6 44 42 8.6 1,130,000 67 51 23-9 38 35 28.6 8,050,000 71 59 16.9 41 35 33.9 ·7,910,000 74 55 25.7 38 38 22.4 8,850,000 75 65 13.3 38 34 24.4 8,850,000 74 67 9.5 46 41 35.9 7,060,000 77 64 16.9
40 35 28.6 70 57 18,6
0
"
30 40 50 60 70 60 f:IPN
Figure 8. Temperature-corrected versus uncorrected 3-year minimum average SN40 on all sections.
60
10 20 30 40 ~ 60 70 nMPERATlJIE ca!RECTED 3 YEAR SN40

7
ing from 0.55 to 0.65. Similar correlations obtained from using minimum SN and 3-year minimum average
SN encouraged us to find whether correlations existed between these two parameters, when used in either the temperature -corrected or the uncorrected form. Figure 7 shows the correlation between the temperature -corrected 3 -year average SN and the absolute minimum SN for all test sections, and Figure 8 shows corrected versus uncorrected 3-year minimum average SN for the same sections. It is apparent from the figures that, in both cases, good correlations (r > 0.90) and close relationships existed between the parameters. Generally, the 3-year minimum average SN is about five skid numbers higher than the absolute SN, but temperature -corrected and uncorrected SN have approximately a 1: 1 relationship. Accordingly, only one set of data representing any of these parameters needs to be used in subsequent correlations.
Other attempts included a correlation between polished-core BPN and minimum SN for the carbonate sections only. The scatter of data points and the coefficient for this correlation were even worse than for the similar correlation of data for all sections; this probably indicated the large variability between aggregates within the carbonate group and pointed to the need for investigating individual carbonate aggregates on their individual merit, although as a group they seem to fall into the poor to marginal performance category.
Several factors could have contributed to the generally unsatisfactory correlation results obtained between laboratory and field frictional numbers. These factors include, but are not limited to, basic differences in measurement method and testing speed ( 10) and probable variations between core and field surface texture due to local variations and field surface changes caused by climatic changes and increased use of studded tires. Therefore, in the future, BPN s should also be measured in the field simultaneously with SN measurements, if some good correlations are to be achieved.
In the past decade or so, several attempts have been made to correlate portable testers and skid trailers ( 11, 12, 13). Correlation results have ranged from poor to fair or good, but there seemsto be no general agreement among researchers on a resulting regression equation or set of equations that can be used with confidence.
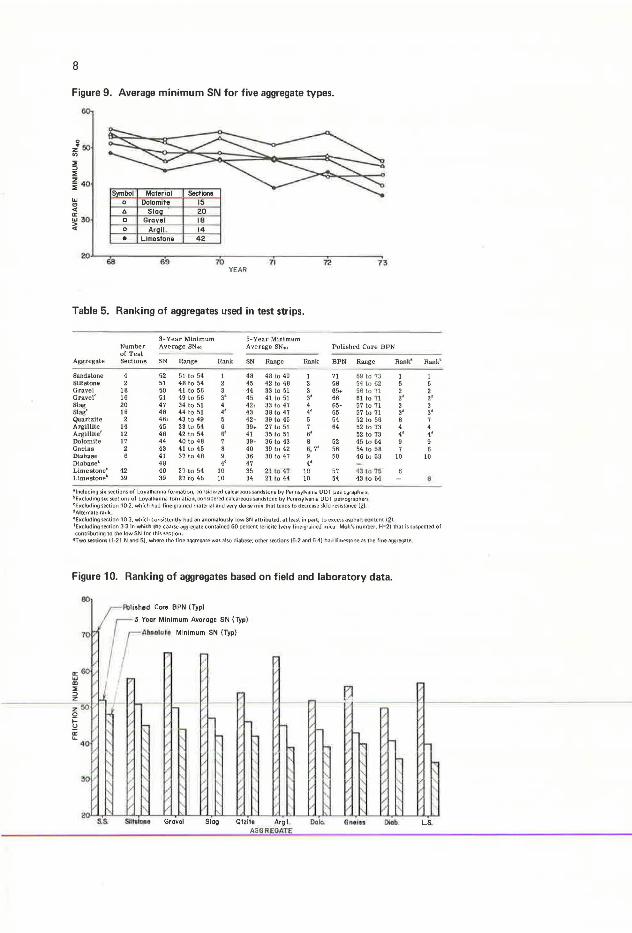
Comparison and Ranking of Aggregates
All aggregates used in this research were grouped into 10 general types (Table 1). For a comparison of aggregates by type, the annual minimum SN for all sections in each group were averaged (Table 4). For each type, an average curve representing the group by type was plotted, as shown in Figure 9. These curves show the performance of each aggregate type. However, variations within each type due to the spread of data around the average ranged from fairly small (about ±3 SN) for dolomites, to very large (about ±12 SN) for limestones. Furthermore, the zigzag pattern of some curves makes definitive ranking of the aggregates by this procedure very difficult. Accordingly, another approach had to be followed.
For a ranking of the aggregates by each type, the 3 -year minimum average SN, the absolute minimum SN, and the polished-core BPN values were pooled and averaged, and this resulted in one grand average of each friction number per aggregate type. These average values are given by aggregate type in Table 5. To indicate the extent of variation from the average value, the range around each average was also recorded in Table 5. One parameter had to be used as reference for the ranking. The 3-year average was chosen for reasons that have been discussed. Ranking of the aggregates was now attainable by the three parameters, and ranking results appear in both Table 5 and Figure 10. The obvious anomalies or suspicious deviations were given in the notes to Table 5.
Correlation of Ranking Data
From Figure 10 and Table 5, one can see that the 3 -year minimum average and the
8
Figure 9. Average minimum SN for five aggregate types.
Symbol Material Secttone 0 Dolomite 15 6 Slaa 20 D Gravel 18 0 Ara ii. 14
• Umestorte 42
20 68 69 70 71 72 73
YEAR
Table 5. Ranking of aggregates used in test strips.
3-Year Minimum 5-Year Minimum Number Average SN40 Average SN~o Polished Core BPN of Test
Aggregate Sections SN Range Rank SN Range Rank BPN Range
Sandstone 52 51 to 54 1 40 48 to 49 I 71 69 to 73 Slltstone 2 51 48 to 54 2 45 42 to 48 2 50 54 to 62 Gravel 10 50 41 to 56 3 44 33 to 51 3 65+ 56 to 71 Craver 16 51 49 to 56 3' 45 41 to 51 3• 66 61 to 71 Slag 20 47 34 to 51 4 42+ 33 to 47 4 65- 57 to 71 Slag' 10 46 44 to 51 4' 43 38 to 47 4• 65 57 to 71 Quartzite 2 46+ 43 to 49 5 42- 39 to 45 5 54 52 to 56 Argilllle 14 45 33 to 54 6 39+ 27 to 51 7 64 52 to 73 Arglllltet 12 46 42 to 54 6' 41 35 to 51 6' 52 to 73 Dolomite 17 44 40 to 48 7 39- 36 to 43 B 52 45 to 64 Cneies 2 43 41 to 45 B 40 39 to 42 6, .,~ 56 54 to 58 Diabase 41 37 to 48 9 36 30 to 47 9 50 46 to 53 Diabase' 46 4' 47 4' Lime.stone" 42 40 27 ta 54 10 35 21 to 41 10 57 -13 to "JS Limestone~ 39 39 27 to 46 10 34 21 lo 44 10 54 43 to 64
' Including $ix sections of Loyalhanna formation, considered calcareous sandstone b11 Penns11lvania DOT µei1 0<Jt.iµl11:1~ ,
bE.11clud1n9 six sections ot Loyalhanna formation, considered calcareous sandslone b11 Penns11lvania DOT pe1rographers ce .11c ludlngsection 10.2, which had fine grained rnaLerlal and very densemiic that lends todecreasesk1cl resistance (l.) dAlternaterank. ' E1Ccluding section 10.3, which consistently had an anomalously low SN attributed, at least in part, ta eiccess asphalt con lent t2J
Rank" Ran kb
1 1 5 5 2 2 2' 2' 3 3 3' 3' 6 7 4 4 4' 4' 9 9 7 6
10 10
1E1Ccluding seclian 3 3 in vktich the coarse aggregate contained 60 percent serlci te (very line grained mica-Moh's number, H•2) that is suspected of contributing ta the low SN far Lhis section
'Two sections 11 21 N and SJ. where the line aggregate was also di<ibase; other sections (6 2 and 6 4) had limestone as the fine aggregate
Figure 10. Ranking of aggregates based on field and laboratory data.
80
Qtzite Argil Dolo. Diab. LS. AGGREGATE
9
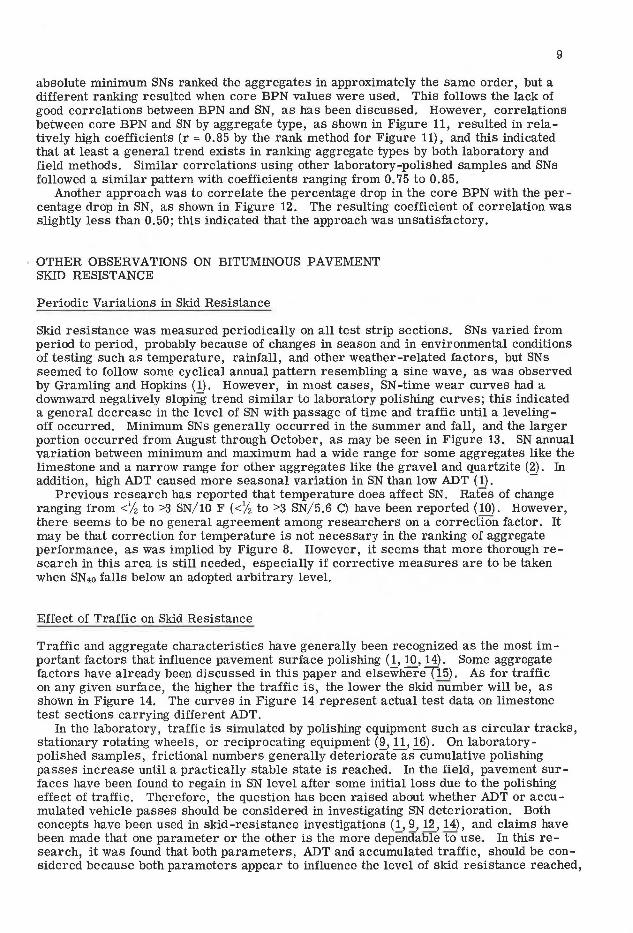
absolute minimum SNs ranked the aggregates in approximately the same order, but a different ranking resulted when core BPN values were used. This follows the lack of good correlations between BPN and SN, as has been discussed. However, correlations between core BPN and SN by aggregate type, as shown in Figure 11, resulted in relatively high coefficients (r = 0.85 by the rank method for Figure 11), and this indicated that at least a general trend exists in ranking aggregate types by both laboratory and field methods. Similar correlations using other laboratory-polished samples and SNs followed a similar pattern with coefficients ranging from 0. 75 to 0.85.
Another approach was to correlate the percentage drop in the core BPN with the per -centage drop in SN, as shown in Figure 12. The resulting coefficient of correlation was slightly less than 0.50; this indicated that the approach was unsatisfactory.
OTHER OBSERVATIONS ON BITUMINOUS PAVEMENT SKID RESISTANCE
Periodic Variations in Skid Resistance
Skid resistance was measured periodically on all test strip sections. SNs varied from period to period, probably because of changes in season and in environmental conditions of testing such as temperature, rainfall, and other weather-related factors, but SNs seemed to follow some cyclical annual pattern resembling a sine wave, as was observed by Gramling and Hopkins (1). However, in most cases, SN-time wear curves had a downward negatively sloping trend similar to laboratory polishing curves; this indicated a general decrease in the level of SN with passage of time and traffic until a levelingoff occurred. Minimum SNs generally occurred in the summer and fall, and the larger portion occurred from August through October, as may be seen in Figure 13. SN annual variation between minimum and maximum had a wide range for some aggregates like the limestone and a narrow range for other aggregates like the gravel and quartzite (2). In addition, high ADT caused more seasonal variation in SN than low ADT ( 1). -
Previous research has reported that temperature does affect SN. Rates of change ranging from<% to >3 SN/10 F (<%to >3 SN/5.6 C) have been reported (10). However, there seems to be no general agreement among researchers on a correction factor. It may be that correction for temperature is not necessary in the ranking of aggregate performance, as was implied by Figure 8. However, it seems that more thorough research in this area is still needed, especially if corrective measures are to be taken when SN40 falls below an adopted arbitrary level.
Effect of Traffic on Skid Resistance
Traffic and aggregate characteristics have generally been recognized as the most important factors that influence pavement surface polishing (1, 10, 14). Some aggregate factors have already been discussed in this paper and elsewhere\15). As for traffic on any given surface, the higher the traffic is, the lower the skid number will be, as shown in Figure 14. The curves in Figure 14 represent actual test data on limestone test sections carrying different ADT.
In the laboratory, traffic is simulated by polishing equipment such as circular tracks, stationary rotating wheels, or reciprocating equipment (9, 11, 16). On laboratorypolished samples, frictional numbers generally deteriorateascumulative polishing passes increase until a practically stable state is reached. In the field, pavement surfaces have been found to regain in SN level after some initial loss due to the polishing effect of traffic. Therefore, the question has been raised about whether ADT or accumulated vehicle passes should be considered in investigating SN deterioration. Both concepts have been used in skid-resistance investigations (1, 9, 12, 14), and claims have been made that one parameter or the other is the more dependable to use. In this research, it was found that both parameters, ADT and accumulated traffic, should be considered because both parameters appear to influence the level of skid resistance reached,

10
Figure 11. Polished-core BPN versus minimum SN40 •
60
i z "' 40 ::E => ::E z :i 30
20
20 ~o so 60 70 BPN
80
Figure 13. Frequency of occurrence of minimum SN40
versus time of year for 1969·73.
27'.47%
116
"' 80 c.> z "' a: a: => 13.27% 8 56
~ 9.0% 8.77% >- &I 32 !;! Lil => 20 iii M!I% e:
0 APR. MAY JUNE JJlY AUG. S6''J; OCl: NOV. DEC..
TIME OF YEAR (MONTH)
Figure 14. Effect of ADT on minimum SN over limestone surfaces.
70
60
i z "' 50 ::E => ::E
~ ::E 40
...J .. => z z 3
20
YEAR
Figure 12. Percentage drop in core BPN versus percentage drop in SN40•
60
coSll!atone
I() 20 30 40 "lo DROP IN CORE BPN
11
as may be seen from Figures 15 and 16 for ADT and cumulative traffic respectively. Figure 15 shows that similar correlations are obtained between 3 -year SN and ADT,
and between 3-year SN and ADT (truck). Furthermore, at 3-year SN= 40, the effect of an average truck on pavement polishing is equivalent to about 18 passenger cars. This equivalency varies depending on at what SN level it is estimated, but the ratio of 1: 18 taken at SN = 40 represents an average value. Similar correlations using all the test sections resulted in similar equivalencies. Furthermore, slopes of curves using data from all sections resulted in about a 1 :20 ratio.
From Figure 16, one can see that the 3-year average SN generally deteriorates as the number of vehicle passes increases, despite intermediate recoveries due to surface rejuvination. From charts like Figure 16, drawn for a particular type of surface and aggregate, one can estimate the number of vehicle passes that a pavement will be expected to endure before a predetermined minimum SN is reached. The rate of SN deterioration with accumulated traffic can also be estimated for a given surface and aggregate.
fusoluble Residue and Skid Resistance
Earlier research has indicated that skid resistance of the carbonate aggregates increases as the portion of insoluble residue in the aggregate increases. Quantitative relationships have been sought between the two parameters, and several have been reported (2, 17, 18). But there seems to be neither general agreement on the percentage of residue tiiat will produce a predetermined minimum SN nor on the rate of increase of SN as the percentage of residue increases.
In this research, an attempt was made to correlate both laboratory BPN on cores and field 3 -year minimum average SN with the percentage of insoluble residue. The correlations are shown in Figure 17. The wide scatter of data in the figure indicates unsatisfactory quantitative relationships between the residue and the frictional number. However, there appears to be a trend of increase in both the laboratory and the field frictional numbers as the percentage of residue is increased. It appears that the influence of residue may be more pronounced in laboratory polishing than it is in the field. Figure 17 shows that carbonate samples having residue distributed at 2 to 5 percent intervals in the range of 10 to 35 percent are needed to produce sufficient data points. The implication is that a more thorough investigation covering these intermediate levels of insoluble residue will be needed before definitive quantitative relationships between insoluble residue and SN can be established. If carbonates having residues in the 20 to 35 percent range can be shown to provide a significantly higher level of skid resistance than those with less residue, selective quarrying may enable some producers to meet higher levels of skid-resistance requirements.
SUMMARY AND CONCLUSIONS
The research discussed was part of a cooperative effort to evaluate bituminous pavement and aggregate polishing, both in the laboratory and in the field, and to investigate whether correlations of practical application existed between the two approaches. Influences of other factors encountered in the research process, such as environmental, traffic, and petrographic characteristics of surface aggregates, were also observed and reported on.
A test strip program containing 156 pavement sections in 11 different locations in Pennsylvania and incorporating various aggregates was initiated and monitored periodically for field skid resistance. Fifty-two aggregate samples and 223 pavement cores representative of the test sections were polished and tested for friction in the laboratory. Correlations were made between laboratory and field results. The following conclusions are supported by the findings from this research:
1. Different methods of laboratory polishing and friction measurement produce

12
Figure 15. ADT and ADTT versus 3-year minimum average SN40
grouped by ADT.
"' "' "' II:
"' ~ ::E
30 ::> ::E z :ii II:
"' "' ,_ "'
10 2 s e 10 12
ADT x 1000 or ADTT x 100
Figure 16. 3-year minimum average SN40
versus cumulative traffic on carbonate sections.
~ o Corbonat11 z 0 ,,, a Biondo
"' !!() D
~ II:
~ ::E ::> ::E z :ii II: 30
~ "'
200 6 a 10 12 14 16 18 20 22 24 26 28 VEHICLE PASSES, mllllono
16
Figure 17. Percentage of sand-size insoluble residue versus friction number.
70
z so ... m
0
0 0
0
0 0
0
0
g°"' 0 D 0
OD
D
0
Q
0
D
0
----------------- -0
0
~Yeo. Minlm&uflo Avero.~e SN
"tl
" Cl
2 q 6 8 © ~ M IB ~ 20 22 ~ ~ ~ 30 ~ ~ ~ ~ PERCENT INSOLUBLE RESIDUE (+ 200 SIEVE)
13
different friction number levels and do not always rank the tested aggregates in the same order; however, they do indicate similar general trends and predict similar general levels of aggregate resistance to polishing.
2. The exploratory SDM seems to be useful for expedient laboratory evaluation of aggregate polishing characteristics.
3. Correlations between laboratory and field data indicate similar trends in polishing characteristics, but they do not produce, through regression equations, satisfactory mathematical relationships that can be applied with confidence for the prediction of spe -cific numerical values of field SN based on laboratory-measured SN.
4. Field and laboratory methods rank aggregates in a closely similar order, but not always in the same order; therefore, a specific correlation should always be established between the particular method to be used for laboratory and field SNs.
5. Minimum SNs correlate significantly better than mean SNs with laboratorypolishing results. No significant difference in analysis seems to result whether an absolute minimum or 3-year minimum average SN is used. Both rank aggregates in practically the same order.
6. Temperature-corrected and uncorrected minimum SNs rank aggregate performance similarly, when used in skid-resistance analysis.
7. Minimum SNs generally occur in the late summer and fall of the year and predominate in August through October.
8. Percentage drop in frictional number between the initial and the polished condition is not a good indicator of pavement or aggregate skid-resistance performance.
9. On any given surface, the higher the ADT is, the lower the skid-resistance levels will be. For any ADT and surface, the skid-resistance level fluctuates widely at first but stabilizes and levels off after about 2 years of service; and for a given ADT, the skid-resistance level is lower on some aggregates like limestones than on others like gravels.
10. There seems to be an equivalency in polishing effects between trucks and passenger cars. One truck appears to be equivalent to about 18 cars.
11. Until a pavement surface stabilizes, skid-resistance level decreases with passage of time and traffic, mainly because of accumulated traffic action.
12. In this research, increase in portions of insoluble residue gave only general trends of increase in skid resistance. Further tests are needed on samples that will cover narrow intervals in the range of 10 to 3 5 percent insoluble residue content.
13. Where the more polish-susceptible aggregates interact with high traffic volumes to produce a pronounced seasonal cyclic pattern of skid resistance, a procedure should be developed for predicting minimum SN from field tests taken at any time during the cycle.
ACKNOWLEDGMENTS
This research was sponsored by the Pennsylvania Department of Transportation in cooperation with the Federal Highway Administration. The work was performed at the Pennsylvania Transportation Institute, Pennsylvania State University. Progress of the research was aided by many of the personnel of Pennsylvania DOT and FHWA, as well as by several Pennsylvania State University faculty, staff, and students.
The contents of this paper reflect the views of the authors, who are responsible for the facts and the accuracy of the data presented. The contents do not necessarily reflect the official views or policies of the Pennsylvania DOT or FHWA. This paper does not constitute a standard, specification, or regulation.
REFERENCES
1. W. L. Gramling and J. G. Hopkins. Skid Resistance Studies-Aggregate-Skid Resistance Relationship as Applied to Pennsylvania Aggregates. Pennsylvania Department of Transportation, final rept., May 1974.

14
2. M. A. Furbush and K. E. Styers. The Relationship of Skid Resistance to Petrography of Aggregates. Pennsylvania Department of Transportation, final rept., July 1972.
3. H. W. Kummer. Research Equipment for the Study of Rubber Friction and Skid Resistance. Pennsylvania State Univ., Rept. Jll, 1966.
4. W. G. Mullen, S. H. Dahir, and B. D. Barnes. Two Laboratory Methods for Evaluating Skid Resistance Properties of Aggregates. Highway Research Record 376, 1971, pp. 123-135.
5. A. K. Stiffler. Relationship Between Wear and Physical Properties of Roadstones. HRB Special Rept. 101, 1969, pp. 56-69.
6. R. R. Hegmon and W. E. Meyer. Laboratory Polishing of Pavement Cores and Comparison With Field Performance. Automotive Research Program, Pennsylvania State Univ., Rept. S52, 1972.
7. Chemical Rubber Company. Standard Mathematical Tables, 1965. 8. S. H. Dahir and W. E. Meyer. Bituminous Pavement Polishing. Pennsylvania
State Univ., final rept. 9. Automotive Research Program Publications. Pennsylvania State Univ., Rept. S25,
1974. 10. H. W. Kummer and W. E. Meyer. Tentative Skid Resistance Requirements for
Main Rural Highways. NCHRP Rept. 37, 1967. 1 L Proc., 1st International Skid Prevention Conference, Charlottesville, Va., 1969. 12. Synthesis of Highway Practice-Skid Resistance. NCHRP Rept. 14, 1972. 13. W. G. Mullen. Prediction of Pavement Skid Resistance From Laboratory Tests.
Transportation Research Record 523 , 1974, pp. 40-55. 14. W. S. Szatkowski and J. R. Hosking. The Effect of Traffic and Aggregate on the
Skidding Resistance of Bituminous Surfacings. U.K. Transport and Road Research Laboratory, TRRL Rept. LR 504, 1972.
15. S. H. Dahir and W. G. Mullen. Factors Influencing Aggregate Skid-Resistance Properties. Highway Research Record 376, 1971, pp. 136-148.
16. W. A. Goodwin. Pre-Evaluation of Pavement Materials for Skid Resistance-A Review of U.S. Techniques. HRB Special Rept. 101, 1969, pp. 69-80.
17. J. E. Gray and F. A. Renninger. Limestones With Excellent Non-Skid Properties. Crushed Stone Journal, Vol. 35, No. 4, 1960 , pp. 6-11.
18. W. C. Sherwood and D. C. Mahone. Predetermining the Polish Resistance of Limestone Aggregates. Highway Research Record 341, 1970, pp. 1- 10.