laboratory and field hydrologic … · subsurface at an idaho national engineering and...
TRANSCRIPT

DOE/I D-22163
LABORATORY AND FIELD HYDROLOGIC CHARACTERIZATION OF THE SHALLOW SUBSURFACE AT AN IDAHO NATIONAL ENGINEERING AND ENVIRONMENTAL LABORATORY WASTE-DISPOSAL SITE
U.S. GEOLOGICAL SURVEYWATER-RESOURCES INVESTIGATIONS REPORT 99-4263
Prepared in cooperation with the U.S. DEPARTMENT OF ENERGY


LABORATORY AND FIELD HYDROLOGIC CHARACTERIZATION OF THE SHALLOW SUBSURFACE AT AN IDAHO NATIONAL ENGINEERING AND ENVIRONMENTAL LABORATORY WASTE-DISPOSAL SITE
By John R. Nimmo, Stephanie M. Shakofsky, Jon F. Kaminsky, and Gary S. Lords
U.S. GEOLOGICAL SURVEY
Water-Resources Investigations Report 99-4263
Prepared in cooperation with the
U.S. DEPARTMENT OF ENERGY
Idaho Falls, Idaho
November 1999

U.S. DEPARTMENT OF THE INTERIOR GALE A. NORTON, Secretary
U.S. GEOLOGICAL SURVEY
Charles G. Groat, Director
Any use of trade, product, or firm names in this publication is for descriptive purposes only and does not constitute endorsement by the U.S. Government.
For additional information write to:
U.S. Geological Survey DSfEEL,MS1160 P.O. Box 2230 Idaho Falls, ID 83403
Copies of this report can be purchased from:
U.S. Geological Survey Information Services Box 25286, Federal Center Denver, CO 80225
11

CONTENTSAbstract............................................................Introduction.............................................................................................................................................1
Background................................................................................................................................^Methods............................................................................................................................................
Bulk soil and profile methods......................................................................................................6Core sample methods..................................................................................................................6Field methods and instrumentation............................................................................................^
Results......................................................................................................................................................9Basic properties ..........................................................................................................................9Laboratory-measured water retention curves ...........................................................................10Laboratory-measured unsaturated hydraulic conductivity and diffusivity...............................!5Field-measured water content, potential, and retention............................................................ 18Field-measured unsaturated hydraulic conductivity.................................................................23
Discussion..............................................................................................................................................23Characterization of unsaturated flow....................................................................................... 23Hydrology of waste-disposal sites........................................................................................... 26
Conclusions............................................................................................................................................2Acknowledgements............................................................................................................................... 28References cited.................................................................................................................................... 28
FIGURESFigure 1. Map and section showing location of the USGS test trench area at the Idaho National
Engineering and Environmental Laboratory Radioactive Waste Management Complex and cross-section of the simulated waste trench within the USGS test trench area, showing the simulated waste trench and the location of neutron-probe access holes............ 3
2. Plot showing selected soil properties with depth in the undisturbed and simulatedwaste trench (disturbed) areas................................................................................................ 7
3. Graph showing high-resolution particle-size distributions for typical samples, measured by optical scattering............................................................................................................. 12
4. Graph showing saturated hydraulic conductivity, measured on core samples by thefalling-head method, as a function of porosity .....................................................................13
5. Graph showing soil-moisture retention (a) drying and (b) wetting curves for sediment samples in the undisturbed area and simulated waste trench................................................ 14
6. Graph showing unsaturated hydraulic conductivity determined by (a) the SSCM and Passioura methods, (b) the Kool and others method, and (c) the Mualem model applied with a Ksat matching factor................................................................................................... 16
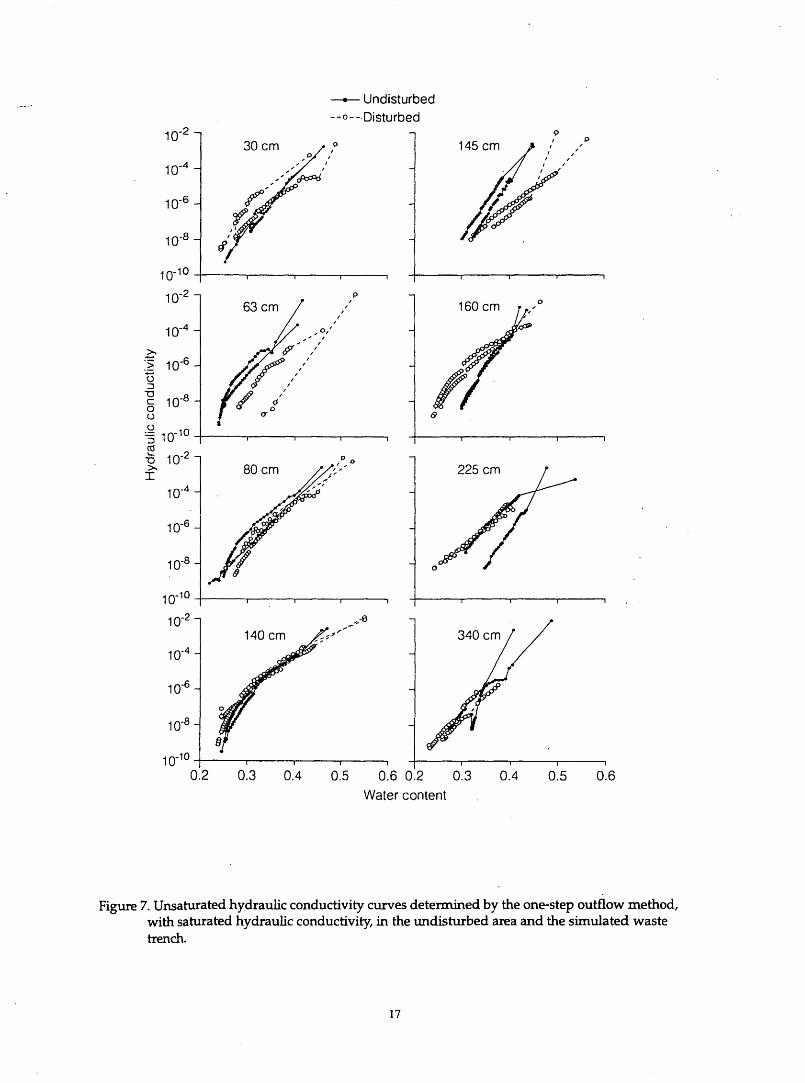
7. Graph showing unsaturated hydraulic conductivity curves determined by the one-step outflow method, with saturated hydraulic conductivity, in the undisturbed area and the simulated waste trench.......................................................................................................... 17
8. Graph showing measured water content as a function of depth during infiltration(the first 24 hours of the flood infiltration experiment)........................................................ 19
9. Graph showing measured water content as a function of depth during redistribution(after the initial 24-hour period of flooding).........................................................................20
10. Graph showing matric potential as a function of depth for two of the four clustersof tensiometers..................................................................................................................... 21
111

11. Graph showing field- and laboratory- determined drying retention curves in the (a)undisturbed and (b) disturbed plots......................................................................................22
12. Graph showing field measurements of unsaturated hydraulic conductivity forundisturbed and disturbed soil............................................................................................. 24
13. Graph showing numerically modeled infiltration and redistribution for layered andunlayered media at selected times given in days................................................................. 25
TABLESTable 1. Carbonate distribution at a location in the undisturbed soil.................................................... 11
CONVERSION FACTORS, VERTICAL DATUM, AND ABBREVIATED UNITS
Multiply By To obtainMillimeter (mm) 0.03937 InchCentimeter (cm) 0.3937 Inch
Meter (m) 3.281 FootSquare kilometer (km2) 0.3861 Square mileCubic centimeter (cm3) 0.06102 Cubic inch
Gram(g) 0.03527 OunceKilogram (kg) 2.205 Pound
Gram per cubic centimeter (g/cm3) 62.4220 Pound per cubic foot
For temperature, degrees Celsius (°C) can be converted to degrees Fahrenheit (°F) by using the equation:°F = (1.8)(°C) + 32.Abbreviated unit used in report:: mol/L (mole per liter)
IV

Laboratory and Field Hydrologic Characterization of the Shallow Subsurface at an Idaho National Engineering and Environmental Laboratory Waste-Disposal Site
by John R. Nimmo, Stephanie M. Shakofsky, Jon F. Kaminsky, and Gary S. Lords
Abstract
The characterization of waste-disposal sites requires knowledge of unsaturated flow, normally obtained using formulations based on Darcy's law or Richards' equation, for which two hydrau lic properties of the porous media, the unsaturated hydraulic conductivity, and the soil-water reten tion relation, must be determined. The extensive modification of the shallow subsurface at a waste-burial site can alter these properties and hence the unsaturated hydrology. These proper ties and their alteration should be accounted for in planning and constructing a waste facility. Our study assesses, through comparison with actual flow behavior, (1) the value of several types of standard unsaturated hydraulic property measure ments for characterizing a waste-disposal site at the Idaho National Engineering and Environmen tal Laboratory and (2) the effect of landfill-con struction disturbance on unsaturated-zone flow at this site. The site has a simulated waste trench constructed by excavating and replacing the soil to a depth of several meters. We measured hydraulic and other properties of the unsaturated medium by various techniques, including labora tory measurements on bulk soil and on minimally disrupted core samples, and field experiments. Among these techniques are higliTresolution water-retention measurements capable of show ing minor structural differences with submersible pressure outflow cells, and a field instantaneous profile experiment involving 24 hours of flood infiltration followed by redistribution. We per formed measurements by identical procedures on the simulated waste trench and on nearby undis turbed soil. The laboratory and field methods have considerable overlap in terms of the proper ties measured, especially the unsaturated hydrau lic properties. The field methods include direct
observation of changing conditions within the unsaturated zone, thus providing information about the behavior of water flow in addition to the property measurements.
The results permit comparisons in at least three ways: measured soil properties of undis turbed versus waste-trench soil, laboratory versus field measurement of properties, and measured properties versus observed flow behavior. The general character of the hydraulic properties is similar between the undisturbed and waste-trench soil. There are tendencies in the slopes of hydrau lic conductivity and water retention curves that are consistent with a reduction in breadth of the pore-size distribution caused by waste-trench construction. Property measurements from the laboratory substantially agree with those from the field. The observed flow behavior in the unsatur ated zone shows marked differences in the undis turbed versus waste-trench soil that are not predicted from the property measurements by means of a one-dimensional Richards' equation model. Richards' equation is a better approxima tion in the disturbed rather than in the undisturbed medium. Layering and preferential flow are both major influences in the undisturbed medium, and are much less significant in the simulated waste trench. In the waste trench as opposed to the undisturbed soil, initial infiltration is slower, but the lack of significant layering permits water to move more freely to depths below the zone of evapotranspiration. Although laboratory and field methods gave consistent hydraulic properties, the hydrologic phenomena of main interest required direct observation of water flow in the field.
INTRODUCTION
The Idaho National Engineering and Environ mental Laboratory (INEEL) comprises approxi-

mately 2,300 km on the Snake River Plain in southeastern Idaho. At the Subsurface Disposal Area (SDA) within the Radioactive Waste Man agement Complex, in the southwest corner of the INEEL, wastes have been buried since 1952. Chemical, low-level radioactive, and transuranic wastes, mostly stored in 55-gallon drums, are buried in trenches and pits in the surficial sedi ments, about 3 to 6 m below the surface. Monitor ing wells in and near the SDA show that water below the water table (about 180-m depth) has been contaminated by organic compounds (Laney and Minkin, 1988). Radionuclides have migrated from burial sites, and have been detected to a depth of about 34 m below the surface (Hum phrey and others, 1982). The geology and hydrol ogy of this site are typical of the eastern Snake River Plain. The subsurface comprises a sequence of basalt flows intercalated with thin sedimentary units (Anderson and Lewis, 1989). The sedimen tary sequences are discontinuous and vary in thickness from 0 to 12m, averaging about 1.5 m. Underlying hummocky basalt flows of low relief control the thickness of the overlying surficial sediment. The surficial sediments consist of about 3 to 6 m of sand, silt, clay, and lesser amounts of gravel. The sediments are predominantly flood- plain and wind-blown deposits. Sediments from ephemeral lacustrine environments are also present (Rightmire and Lewis, 1987). The site is mostly sagebrush-covered. Because the SDA is in a topographic depression, it is vulnerable to flooding. Rapid spring snow melt flooded it in 1962,1969, and 1982. The area receives an aver age annual precipitation of 221 mm, about 30 per cent falling as snow (Clawson and others, 1989). The average daily air temperature for 1987 at the USGS test trench area ranged from 26.7 °C on August 6 to -14.6 °C on December 25 (Davis and Pittman, 1990). Shakofsky (1995) gives addi tional descriptive details of the site.
In 1986 the USGS constructed a simulated waste trench (fig. 1) in a designated USGS test trench area just north of the SDA boundary (Davis and Pittman, 1990). The USGS simulated waste trench was constructed using waste burial methods historically practiced at the INEEL site. This practice involved excavation of the trench to
the top or nearly to the top of the first basalt layer, emplacement of the barrels, and backfilling the trench with excavated soil. Neither compaction of soil nor capping of the trench were regular prac tices. Undisturbed portions of the USGS test trench area had never been used for agricultural purposes or artificially altered.
The main purposes of our study are (1) to assess, through comparison with actual flow behavior, the value of several types of standard unsaturated hydraulic property measurements for characterizing a waste-disposal site and (2) to assess the effect of landfill-construction distur bance on flow in the unsaturated zone. In other words, we want to know whether properties mea sured carefully by standard lab and field tech niques can predict the character of the flow in the unsaturated zone, and how much the mechanical disturbance influences these properties. These objectives could be pursued separately but there is great value in considering them together, as each aspect of the study can amplify the value of the other. The effects of disturbance are important for their own sake and also because they provide a contrasting system for evaluation of character ization techniques. There are three main patterns of comparison in this paper: disturbed versus undisturbed, lab versus field, and properties ver sus behavior. This study was conducted in coop eration with the U.S. Department of Energy.
Background
To minimize the hazards associated with waste burial in the unsaturated zone, it is vital that the waste be as dry as possible and that fluxes to Other portions of the biosphere be minimal (Bedinger, 1989; Winograd, 1981). Of particular importance is deep drainage, which may reach the water table as recharge. Lateral flow, especially in layered systems, is also a concern because it may lead to contaminant migration outside the boundaries of a waste facility (Striegl and others, 1996).
For the assessment and understanding of these conditions and fluxes it is essential to know the hydrologic characteristics of the shallow subsur face, typically to a few meters depth. This part of

UuT 11T3O
Elevation Contour Interval 10 feet Datum is Sea Level
DivtrsraototbelNEEL S|itmling Areas
433ff3tT
Neutron probeaccess holes Backfilled simulated waste trencn
18 16 17 15 /19 21 20
0 8 14246 Distance (m)
Figure 1. Location of the USGS test trench area at the Idaho National Engineering andEnvironmental Laboratory Radioactive Waste Management Complex and cross-section of the simulated waste trench within the USGS test trench area, showing the simulated waste trench and the location of neutron-probe access holes. The number and location of waste barrels is approximate. The shape of the soil-basalt interface is sketched on the basis of observations made during the construction of the simulated waste trench and the neutron access holes.

the unsaturated zone strongly influences the rate of infiltration, the partitioning of runoff and infil tration, and the partitioning of evapotranspiration and deep drainage. This zone is also a dominant influence on the distribution of water near waste buried at shallow depths. Thus it is critical to characterize the shallow unsaturated zone. Where the waste is low-level radioactive waste, the char acterization of unsaturated-zone influences on hydrologic behavior, and also the more basic issue of whether they are characterizable in the first place, is required by the U.S. Nuclear Regu latory Commission (Siefken and others, 1982). At a site that has already been contaminated, restora tion efforts also require extensive knowledge of the unsaturated-zone properties in order to imple ment remedial measures and assess their effec tiveness.
Evaluations for these purposes are commonly based on measured hydraulic properties for use in formulations based on Darcy's law or Richards' equation for the calculation of water contents and fluxes. One of the two main properties required is the hydraulic conductivity (K). Although nor mally considered to be a function of volumetric water content (0) or matric potential (\j/), because of soil-water hysteresis, K is not a single-valued mathematical function. The other property is soil- water retention, the relationship between water content and matric potential, which also is hyster- etic though frequently considered as the function 0(\|f). A major component of an unsaturated-zone waste-site characterization would normally be a set of measurements of these properties. A test of the characterization requires more than a con firming replication of the K(0) and 0(\)/) val ues it is essential to test the predictions based on these determinations against actual hydrologic behavior. Another issue is to evaluate what is the most useful information that can be gained though available unsaturated zone measurement techniques; in other words, what choices of mea sured quantities, techniques, sampling intervals, etc. can characterize a site to the extent that its flow behavior can be predicted.
At a waste-burial site, there is extensive modi fication of the shallow subsurface, with inten tional and accidental hydrologic effects (Fuller
and Warrick, 1985). Typical alterations include excavation and replacement of soil, capping with selected porous or nonporous media, and the use of texturally contrasting layers (Payer and others, 1992; Melchior and Miehlich, 1994). Reestab- lishment of the natural soil and plant cover is often considered desirable for long-term integrity and to take advantage of the efficiency of plants in soil for removal of water (Bedinger, 1989; Schulz and others, 1992). The characterization of a waste site is therefore the characterization of a disturbed system. In the case of a proposed new site for waste, it is essential to consider how the construction of a waste-disposal facility will alter the hydrology. These changes may enhance or diminish the prevailing water contents at the depths of waste burial or the amount and rate of deep drainage. The effectiveness of alternative landfill practices and engineered barriers must also be predicted and evaluated.
An important waste-site study with a concern for effects of disturbance is that of Andraski (1996) at Beatty, Nevada. The site has little pre cipitation (11 cm/yr). Its sediments are stratified alluvial and fluvial deposits, some layers of which contain particles up to cobble size and larger. Andraski measured water retention with a standard pressure plate and with a water-activity apparatus (Gee and others, 1992) on repacked samples with gravel removed, and used a capil lary-bundle model to compute hydraulic conduc tivity over a wide range of water content (Mualem, 1976; Rossi and Nimmo, 1994). The results show the possibility of substantial influ ences of soil disturbance on hydrology. Specific processes include an increased relative impor tance of vapor transport and a reduction in flow- impeding layer boundaries in the disturbed medium. Andraski also identified serious limita tions in the use of pressure-plate apparatus, which produced erroneous data at volumetric water con tents lower than about 0.03 to 0.07.
Many studies have considered the effect of tillage on hydraulic properties, mainly for agri cultural applications (Klute, 1982). Tillage has similarities to the excavation, replacement, and compaction of soil that is of interest in waste dis posal, but usually differs in various mechanical

aspects, as well as being shallower (typically 0.5 m) and repeated annually. The shallowest part of the tilled zone of the soil, however, may be fairly similar to the shallowest replaced soil in a landfill. Four typical studies of this type, Allma- ras and others (1977), Hamblin and Tennant (1981), Allmaras and others (1982), and Azooz and others (1996), found that 0 at given \j/ was less in the upper portion of the tilled soil than in the untilled soil, except in some cases near satura tion, where the reverse was seen. Allmaras and others (1977) measured K(0), finding at the shal lower depths in the tilled soil that K was gener ally greater at given 0, and that the sensitivity of K to 0 was less than in the untilled soil. Ehlers (1976,1977) also measured unsaturated K, but as a function of \|/ only, and found less sensitivity of K to \|/ in tilled than in untilled soil. Without the 0-\j/ relation, though, Ehlers' results cannot be compared on the basis of K at given 0. Three studies observed that porosity at the shallowest depths increased, while Allmaras and others (1982), observed a decrease. These tillage studies suggest that sometimes the loosening aspects of tillage dominate, while sometimes its compactive or pore disrupting aspects dominate.
Strip-mine reclamation studies are also rele vant, possibly more so than tillage. The reclama tion often involves replacement of soil to depths similar to those in waste-disposal applications, though with the goal not of contaminant contain ment but rather of restoration of the site to its original state or original utility (Dunker and oth ers, 1995; Johnson and Skousen, 1995). Compar ing data from various studies, Gee and others (1978) report comparisons of water retention and K, the most pronounced difference being mark edly lower saturated and unsaturated hydraulic conductivity in disturbed than in undisturbed material.
Effects of disturbance have been studied with repacked soil columns, which can involve a more drastic disturbance. For example, Jayawardane and Prathapar (1992) repacked soil samples with the deliberate intention of increasing porosity. In the more disturbed soil they measured an alter ation of properties similar to what is commonly observed in tillage studies, namely decreased 0 at
given \y, and increased K at given 0, but to a very pronounced degree. In studies of core samples compared to sieved and repacked soil, Elrick and Tanner (1955) found a trend for 0 at given \j/ in the wet range to be greater for the disturbed sam ples, with the difference disappearing or revers ing at some \|/ value between -40 and -3000 cm- water, the more extreme values being for finer textures.
Another expected effect of disturbance is a more pronounced air-entry effect in the drying water retention curve. A thorough disturbance is likely to reduce and homogenize the largest pores of the medium. Then as \|/ becomes more nega tive, the transition of 0 away from its saturated value is likely to be sharper and to occur at a lower \j/ value. This is seen to some extent in the results of Hamblin and Tennant (1981); and also quite dramatically, though in different silt loam soils, in the core-sample measurements of Nimmo and Miller (1986) compared to the repacked-sample measurements of Topp (1971).
The hydraulic characterization of disturbed soil needs further study in various ways. Some important quantities, for example, unsaturated K, have been studied too little for effective generali zation. There is also a need to further investigate disturbance, in particular, relation to waste dis posal. Some features of this application, for example, the depths to which the soil is disturbed, the desirability of impeding water flow, and the long period during which waste must remain iso lated, are not adequately addressed in studies aimed at other objectives.
METHODS
It is useful to measure a wide variety of prop erties for study of correlations. Our methods include field observational techniques, bulk-sam ple techniques, laboratory techniques using care fully obtained core samples, and field measure ment techniques. We used minimally disturbed core samples for high-resolution measurements of soil-water retention and other hydraulic prop erties. For field measurement of these properties and also to give direct information on the behav ior of water in the unsaturated zone, we con-

ducted simulated floods and calculated hydraulic properties by the instantaneous profile method. A flood of known duration is good for this purpose because flooding is critical to the long-term downward water flow at many sites, including the one of interest in this study. We also applied a numerical unsaturated flow model to see how well our measured site characteristics can predict water flow. This model is not the main emphasis here, but it provides a link between measured properties and field observations. We used multi ple techniques for some quantities, especially K(0), and compared easy techniques with more accurate and time-consuming ones.
Bulk Soil and Profile Methods
Soil horizons were assessed by examination of a 5.8-m continuous core that was drilled in an undisturbed portion of the USGS test trench area in October 1990. Figure 2 shows the distinguish able horizons. Table 1 of Shakofsky (1995) pro vides a description of the continuous core.
A qualitative index of calcium carbonate con tent was obtained in the field by observing the reaction of the soil with five percent hydrochloric acid solution. For quantitative measurement of calcium carbonate, additional soil samples in an undisturbed location in the test-trench area were obtained by hand-auguring in March 1991. Small samples from 5- to 10-cm intervals were col lected, sub-sampled, dried, weighed to the nearest 0.0001 g, disaggregated, and placed in a hydro chloric acid bath adequate to dissolve the carbon ate and organic matter present. After decanting, the samples were washed with deionized water, then dried and weighed again so that the carbon ate content could be determined by subtraction.
Particle-size analysis, on a large number of soil samples from various depths down to 340 cm, was performed using a Coulter 1 LS100 optical particle-size analyzer. Most of these sam ples were trimmings from the preparation of core samples for other purposes. Each measurement required approximately 0.3 g of material. Sam-
1 Mention of product names does not constitute endorsement by the USGS.
pies larger than this were split using a spinning riffler. In order to adequately disperse the soil, pretreatment of the sample included 10 minutes in an ultrasonic bath. Results were similar to those of an earlier sieve and pipette analysis (Laney and Minkin, 1988). Shakofsky (1993) gives a complete description of the particle-size analysis, and a comparison of optical and sieve and pipette methods. We measured the particle density by the method of Blake and Hartge (1986), finding it to average 2.65 g/cm3 .
During sample collection, a dry sieve analysis to determine aggregate size distribution (Burke and others, 1986, pp. 30-31) was performed. The method is basically a sieving of the soil to sepa rate aggregates of different sizes. Approximately 1 kg of soil was collected and rotated in a series of nested sieves (4, 2, and 1 mm) for three min utes. Each aggregate fraction was then weighed in the field. While this method normally uses air-dry soil, the moisture content at the time of sampling was low enough (ranging from 14 to 30 percent before drying that occurred during handling) that the sieve analysis could be carried out in the field.
Pittman (1989,1995) describes the installation of neutron access holes at the site and presents water content data obtained over time with a neu tron-scattering probe. We have used these recorded data and have continued measuring in the same and additional neutron access holes.
Core Sample Methods
We determined physical properties of mini mally disrupted soil core samples, including at least two each of disturbed and undisturbed from 18-, 30-, 63-, 80-, 140-, 145-, 160-, 225-, and 340-cm depths. Sampling holes were hand- augured to selected depths for core sampling. To minimize sample disruption and possible alter ation of the hydraulic conductivity, water reten tion, or other properties, most core samples for this study were collected with a thin-walled, hydraulically driven sampler (Eijkelkamp 1 model 07.06). Samples from the 18-cm depth were col lected by a traditional hammering technique dur ing an earlier site visit. The sample cores are 5.1 cm high and 5.0 cm in diameter. Samples were

Reaction to 5% HCI
Moisture content
Porosity Clay ' Sand Aggregates content, % content, % >4mm, %
ocL"oCO "5
.£= "5.0>Q
500
Basalt
Figure 2. Selected soil properties with depth in the undisturbed and simulated waste trench (disturbed) areas.

trimmed, weighed, capped, and wrapped in alu minum foil to prevent moisture loss. Soil trim mings were retained for particle size analyses. To minimize disruption of the soil sample in the lab oratory, the hydraulic properties were measured with the sample remaining in its original soil ring, without recoring, repacking, or subsampling.
We determined bulk density from the oven- dry mass and the known volume of each core sample, measured after the hydraulic property measurements. Because most faces of the cylin drical cores were somewhat irregular, we com puted the soil volume by subtracting the volume of gouges, determined by filling with glass beads of known mass and bulk density, from the volume of the cylinder. Porosity was calculated from the bulk density measurement using the measured average value of particle density.
The soil-water retention was determined by means of a modified pressure-cell assembly, the submersible pressure outflow cell (SPOC) (Con- stantz and Herkelrath, 1984). Each sample was sealed in a SPOC and suspended in a bath of 0.005 mol/L of CaSe04 and CaSO4 (to minimize biological growth and simulate a natural electro lyte balance), hanging from an electronic balance that measured sample weight. Pressure incre ments were applied to an initially saturated soil. At each pressure increment, water was driven out until each sample met the equilibration criterion: change of sample weight of 0.02 g or less in a 14- hour period. The applied air pressure was equated to a matric potential, correcting for the sub merged depth of the sample. The sample weights at equilibrium points were converted to moisture contents after samples were dried. Measurements were taken in the 0 to -1000 cm-water range where moisture retention is most strongly influ enced by the soil structure and where the greatest differences were expected between disturbed and undisturbed soil. This range also covers most of the range experienced at the field site over the course of a year. The tight criterion for equilibra tion at each point and the close spacing (typically 5 cm-water) of points provided for high resolu tion of structural effects. Batches of four or eight
samples were measured simultaneously, with equal numbers of undisturbed and disturbed sam ples in each batch.
The K(9) values were generated using the one-step outflow method, a transient flow method originally described by Gardner (1956). The one- step outflow experiments were carried out at the end of the moisture retention experiment while the core samples were still in the SPOC appara tus. After the last equilibrium point was estab lished for the moisture retention curve, the samples were allowed to resaturate. Then a posi tive air pressure of 1000 cm-water was applied to the resaturated sample and the sample weight was recorded as a function of time (t). We converted the sample weight to 6 and then calculated the hydraulic diffusivity (D) from 9(t) by the method of Passioura (1976). The unsaturated hydraulic conductivity was calculated from the relation
= D(e)(dv|//de) (1)
We also calculated K(0) from the outflow data by the inverse method of Kool and others (1985), using the revised algorithm of Kool and Parker (1987, 1988), which directly gives optimized fits to a specified functional form. As a check on the one-step outflow method, we measured K(6) for two samples by the steady-state centrifuge method (SSCM) (Nimmo and others, 1987; Nimmo and others, 1994). Additionally, K(0) was calculated by Mualem's (1976) capillary the ory model.
Saturated hydraulic conductivity (Ksat) was measured by a falling head method (Klute and Dirksen, 1986), immediately after removal of each sample from the SPOC. The apparatus was an open, cylindrical reservoir sealed with an O- ring to the top of the soil core sample. A porous stainless-steel disk on the bottom of the soil ring allowed for the outflow of solution while mini mizing soil loss. A minimum of six runs (each entailing flow of about 220 cm3 of solution, about five pore volumes) was necessary to minimize trapped air and achieve a constant Ksat . Addi tional details on the Ksat experiments are given by Shakofsky (1995).

Field Methods and Instrumentation
For the flood infiltration and redistribution experiment, we established two bermed areas, one in an undisturbed area and the other in the simulated waste trench. Each was a 2- by 4.4-m rectangle enclosing two neutron-access holes. Around each of these neutron-access holes at a distance of 0.5 m we installed four field tensiom- eters (Soilmoisture Equipment Corp. model 2725) at 30-cm depth increments to 120 cm. We equipped each tensiometer with a Honeywell Micros witch 1 243PC15G or 241PC15M pressure transducer and read the pressures sequentially with a data logger. Water content was measured with a neutron-scattering probe at 15- to 30-cm intervals, the shorter intervals at the shallower depths.
Water was applied to the two bermed areas until it was ponded 8 cm deep. Water content and matric potential data were initially collected at 5- minute intervals, later increasing to longer inter vals. After 24 hours the water was shut off, the berm was breached and the plots were covered with a waterproof sheet to effectively eliminate evaporation. For the measurement of redistribu tion, data were collected hourly from the tensiom- eters until they had to be removed before soil freezing in the fall. Water-content measurements were taken daily for four days after the berm was breached, then weekly. Data were collected at the undisturbed plot for 102 days and at the disturbed plot for 74 days.
The instantaneous profile method (Rose and others, 1965; Watson, 1966), as adapted for field use by Stone and others (1973), was used to determine unsaturated hydraulic conductivity. This method is based on Darcian analysis of tran sient soil water content and hydraulic head pro files during vertical drainage following a thorough wetting of the soil profile down to a specified depth. Uniform, one-dimensional, non- hysteretic, and isothermal conditions are assumed, enabling use of the relation
where q is the vertical flux density, H is the hydraulic head (gravitational plus matric poten tial), z is the vertical position, and t is time. From the simultaneous measurements of soil water con tent and matric potential over time, K was deter mined as an average within layers about 30 cm thick (between tensiometer positions) as
' - -MS) (3)
K = -q(z,, r)
dz(2)
Integrated water-content measurements at the start and end of a time period indicated stored water for determining q. Within a layer for a given time interval, q was approximated by add ing two terms: the net change in water stored in all soil above the layer, and half of the change in stored water within the layer itself. The average hydraulic gradient within the layer (A///Az) was computed as the difference between H at the ten- siometers bounding the layer, divided by the layer thickness. For use in equation (3), the values of this gradient at the beginning and end of the time interval were averaged. Kaminsky (1991) gives additional details of our application of the field instantaneous profile method.
We determined field-measured water retention curves by matching neutron 0 measurements with tensiometer \j/ measurements from the same time and depth. We used only data from where the wetting front had already passed, so these are dry ing curves.
RESULTS
Basic Properties
Besides the distinguishable horizons, figure 2 shows properties that give a basic characteriza tion of the soil profile. In this figure are the distri bution with depth of relative carbonate content, moisture content, porosity, clay content, sand content, large (greater than 4 mm) aggregates, and Ksat for both the undisturbed profile and the simulated waste trench. Table 1 gives the quanti tative carbonate measurements for the undis turbed material, which are in general agreement with the relative carbonate indications in figure 2. Shakofsky (1995) gives additional information about the soil horizons and related data, including
the complete aggregate size distributions. Figure 3 gives typical examples of the complete particle- size distributions as measured for each sample. These detailed measurements, obtained from an optical-scattering technique, provide high-resolu tion data for possible use in modeling other prop erties, for example, moisture retention by the method of Arya and Paris (1981). Nimmo (1997) presents a model for using these data, plus the aggregate-size distributions, to give a more accu rate representation of soil-moisture retention.
In figure 2, there is clear evidence of distinct horizon development in the undisturbed profile. In contrast, the simulated waste trench is much more homogeneous, with an absence of natural layers evident from the relatively smooth profiles of the aggregate distribution, clay content, and carbonate content. Probably as a result of this homogeneity, moisture content in the disturbed profile is also more uniform with depth. In the 140- to 220-cm interval of the undisturbed pro file, the greater clay content may cause the greater moisture content as well as increasing interparticle cohesion to cause the greater aggre gate size. Similarly, an inverse relationship appears between K^ and large aggregates. An exception to the trend in degree of homogeneity is the porosity, which varies with depth about equally in the two profiles. A significant differ ence, however, is that it tends to be about 5-per cent greater in the simulated waste trench, a likely result of "loosening" of the soil. Construction of the simulated waste trench has created an essen tially unlayered, homogenized soil of unconsoli- dated sediments with an increased porosity.
The full set of Ksat measurements in figure 4 shows much scatter, but with a general tendency for Ksat to increase with porosity. There is no evi dence of a disturbed-undisturbed distinction inde pendent of porosity variations. Ksat for disturbed samples tends to be greater as the porosity is greater.
Laboratory-Measured Water Retention Curves
Figure 5 shows the drying and wetting reten tion curves. Each graph gives the two undisturbed
and two disturbed curves for each depth, obtained from core samples from different boreholes.
The main shape features of the drying curves the air-entry very-near-zero matric pres sure, the abrupt drop to a bend between -100 and-300 cm-water, and the nearly flat tail beyond the bend differ little between the undisturbed and disturbed media. The shapes are typical of struc tured surface soils, not of repacked samples. Any of the disturbed curves could pass visually as an undisturbed curve. If the disturbance was origi nally similar to a soil-column repacking, then during the six years since the disturbance, soil developmental processes have restored some of its natural character. In contrast, only 13 of the 18 undisturbed curves could pass as disturbed curves. Of the five curves that could not, most differ mainly in having higher 0 in the nearly flat tail. These five curves, and especially U30a, U225a, and U225b, have a lesser overall slope. There is also a visible trend in the \|/ = 0 to -200 cm-water region for the slopes of disturbed curves to be greater than those of the undisturbed curves at the 145-, 160-, and 225-cm depths. Interpreted by capillary theory, these slope differ ences imply a somewhat broader pore-size distri bution in the undisturbed medium, in other words that it has more of both the largest and smallest pores. The outflow-cell measurement technique does not yield good data between 0 and about -10 cm-water, so there may be undetected distur bance-related effects in that range.
The most obvious disturbance-related distinc tion is that there is more spread among the undis turbed curves, indicative of layering like most of the results in figure 2. There also is more lateral heterogeneity in the undisturbed soil, evidenced from the typical greater spread between the two samples from the same depth, which came from boreholes 2 to 3 m apart. At a matric potential of-1000 cm-water, the moisture contents for the undisturbed pairs differ by as much as 0.060 (30-cm depth) and by as little as 0.025 (145-cm depth). At the same potential for the disturbed cores, the pairs differ by as much as 0.028 (30-cm depth), and by as little as 0.003 (225-cm depth).
10
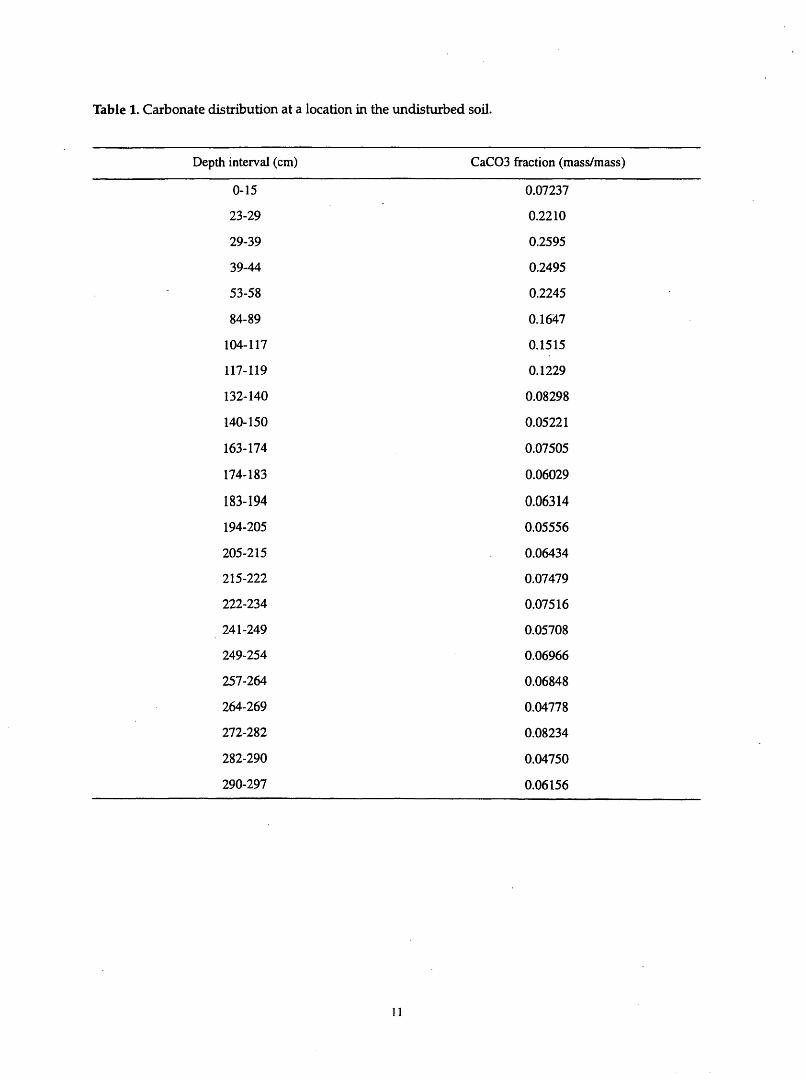
Table 1. Carbonate distribution at a location in the undisturbed soil.
Depth interval (cm)
0-15
23-29
29-39
39-44
53-58
84-89
104-117
117-119
132-140
140-150
163-174
174-183
183-194
194-205
205-215
215-222
222-234
241-249
249-254
257-264
264-269
272-282
282-290
290-297
CaCO3 fraction (mass/mass)
0.07237
0.2210
0.2595
0.2495
0.2245
0.1647
0.1515
0.1229
0.08298
0.05221
0.07505
0.06029
0.06314
0.05556
0.06434
0.07479
0.07516
0.05708
0.06966
0.06848
0.04778
0.08234
0.04750
0.06156
11

o
Cg "o03
LL 1
0
U225a
10°
D225b
i i i i in
102 Particle diameter (|im)
103
Figure 3. High-resolution particle-size distributions for typical samples, measured by optical scattering.
12

10"
CO
1C'2
.> _Qo 10 JID
TJ
8 io-4O~503
"610
o Disturbed
°o
0.40 0.45
Undisturbed
0.50 Porosity
0.55 (.60
Figure 4. Saturated hydraulic conductivity, measured on core samples by the falling-head method, as a function of porosity.
13

-0.5
-0.4
Drying
18cm
30cm
63cm
80cm
140cm
145cm
160cm
225cm
340 cm
-1000 -800 -600 -400 -200 0-1000 -800 -600 -400 -200 0
Matric potential (cm water) Undisturbed -Disturbed
Figure 5. Soil-moisture retention (a) drying and (b) wetting curves for sediment samples in the undisturbed area and simulated waste trench. The drying curves include porosity as the wettest point. The depths indicated are nominal depths of the midpoint of the sample; actual depths may differ from these by as much as 7 cm.
14

The wetting curves (fig. 5) suggest essentially the same disturbance-related generalizations as the drying curves. Data for the wetting curves are more sparse, by deliberate choice because the equilibration times for the wetting points were much longer. There are adequate data, however, to compute complete wetting curves using a model such as that of Nimmo (1992).
Laboratory-Measured Unsaturated Hydraulic Conductivity and Diffusivity
Figure 6 shows unsaturated hydraulic conduc tivity results from four different methods. Even though the methods use different types of data and are based on different assumptions, the K val ues vary little. The most pronounced differences in K(9) for disturbed and undisturbed samples are in the slopes. Results in figure 6a that were com puted using the Passioura (1976) method show distinct disturbed-undisturbed slope differences, and greater curvature than in other methods. This method is based on dynamic unsaturated-flow data and is not constrained to any parameterized functional form, but is subject to error at the wet end where the finite impedance of the outflow plate may be significant. For this reason, com puted values of K greater than the K of the out flow plate were deleted. The results in figure 6b, which were computed from outflow data by the method of Kool and others (1985), show the greatest uniformity in slope and magnitude and have little curvature on the semilog graph. This uniformity may result largely from the forcing of these results to fit a specific functional form (Mualem-van Genuchten). In addition, having each curve tied to the K^ value at the wet end effectively prevents variations in magnitude other than what Ksat would indicate. The results in fig ure 6c, based on retention and K^ data and com puted using the Mualem (1976) model, have slopes similar to those of the Passioura results, and also show a clearly greater slope for undis turbed samples. Their curvature is less than that of the Passioura curves but more than that of the curves computed by the method of Kool and oth ers. The SSCM results in figure 6a cover a limited range, but they verify, with a fundamental Darcy- law-based method, the general magnitude of the
K values from the other methods, and also sug gest that the slopes of the Passioura curves, in the range of overlap, are valid.
Figure 7 shows unsaturated hydraulic conduc tivity measurements by the Passioura method for all core samples. These graphs show some mea surable effect of the disturbance involved in cre ating this landfill. As with the retention results, there is greater spread, indicative of greater heter ogeneity in the undisturbed medium. Apart from this spread, the greatest disturbance-related dif ference is a tendency toward greater slope (for example, greater sensitivity of K to 0) in the undisturbed medium. Like the less strongly sloped retention curves of the undisturbed soil, this implies a broader pore-size distribution. It is likely that the excavation and replacement of soil would both destroy large pores and break up aggregates, reducing the breadth of the pore-size distribution. Thus the interpretation of the K(0) results in terms of both heterogeneity and pore sizes is consistent with the inferences from other measured properties. The hydrologic significance of the disturbance-related differences, especially the degree to which they influence the behavior of water, is not obvious from the graphs them selves but is interpretable through predictive models, discussed later.
Diffusivity as a function of water content, computed using equation (1) but not shown graphically here, is qualitatively much like K(0). The sensitivity of D to 0 is less than that of K to 0. Over the 0 range of 0.2 to 0.5, D spans about 4 orders of magnitude compared to nearly 6 orders of magnitude for K. The spread among samples is also less for D. At 0 of 0.35, the range of D for all core samples spans 2.3 orders of magnitude, com pared to 3.5 orders of magnitude for K. Thus, considering the two factors comprising D in equation (1), some of the variation in the slope of the retention relation (d\j//d0) acts to partly com pensate for variation in K. This is similar to the spread compression observed by Jayawardane and Prathapar (1992), Hamblin and Tennant (1981), and others. This spread compression sug gests that where the properties of a few samples
15

10
10"
10
10
10
10
'2 - A
'6
'8
- 10
' 12
Undisturbed (outflow)
V'
, 0- - - Disturbed p./0"/0 (outflow) i
Disturbed (centrifuge) ^
^Undisturbed (centrifuge)
'21C
10'
£ 10"o
8 io-8
- 12io
10"
io-
10"
10"
Undisturbed
Disturbed
10
10'
' 10
12
i 1 i
1 1 1 1 1 1
r cr~sr ^
-__ Disturbed ~^0 % ?<
I" a*&<t> <£ "
"* oo * m5" O O* CL & ^^
! ** ' ' S" ° OO f>
= ° 0 1° * * *
r »° ° "s = 00 t
SV"; 1W °* "
1 1 L I ' 1
1 1 1 1 |
8 8 ° ^*e "a ° ° -
^* 8 8 * *° 18 f 0 0 \ ~
' ;*:! ]^ =
--s
"^Undisturbed ! s
-j
-^
a
1 i 1 i
0.1 0.2 0.3 0.4 0.5 0.6 Moisture content (vol/vol)
Figure 6. Unsaturated hydraulic conductivity determined by (a) the SSCM and Passiouramethods, (b) the Kool and others method, and (c) the Mualem model applied with a Ksat matching factor.
16
10'6 H
10-8 _
10,-10
10
io-4J
I 10'6 H oZJ "O a§ io-8 -Jo g-^ I L/
o 10I*
10-4J
10"6 -
10'8 -
10-10
10,-2-,
-4 _10
10'6 H
10'a -
10,-10
* Undisturbed--Q-- Disturbed
30cm
63cm
f /
80cm
140cm
145 cm
160cm
225cm
0.2 0.3 0.4
340cm
0.5 0.6 0.2 0.3
Water content
0.4 0.5 0.6
Figure 7. Unsaturated hydraulic conductivity curves determined by the one-step outflow method, with saturated hydraulic conductivity, in the undisturbed area and the simulated waste trench.
17

are used to represent a large amount of heteroge neous soil, there is a possible advantage in flow formulations using D(0) instead of K(0).
Field-Measured Water Content, Potential, and Retention
Figures 8 and 9 illustrate the subsurface effects of 24-hour flooding with water-content profiles measured at two neutron-access holes in undisturbed soil and two in disturbed soil. The maximum measured water contents are less than the porosity of the media, indicating the likeli hood of trapped air. As with most other results for this site, greater homogeneity appears in the dis turbed soil, evidenced here in the greater similar ity between profiles of the two disturbed-soil neutron-access holes (figs. 8c, 8d, 9c, and 9d) than between their two undisturbed-soil counter parts. This homogenity is supported by the steadier progress of the wetting front in the dis turbed soil.
Beyond the matter of heterogeneity, these water-content profiles show the greatest undis turbed-disturbed differences we have found at this site. In the undisturbed soil, the infiltrating wetting front (figs. 8a and 8b) is more diffuse, especially in 8a. The profile behind the wetting front has a slowly increasing water content. In the disturbed soil (fig. 8c and 8d) the wetting fronts are sharp, with high and fairly uniform 0 behind. Another clear distinction is that water initially moves to greater depths faster in the undisturbed soil, for example, reaching about 1.7 m in 6 hours, while in the disturbed soil it reaches only 0.5 m. Redistribution hi the disturbed soil (figs. 9c and 9d) closely follows the constant-area-rect angle model that frequently applies in homoge neous soils when evaporation is negligible. Water appears to move easily and uniformly down wards. It reaches 3-m depth in about 32 days and shows no evidence of having stopped, even after 76 days. In the undisturbed soil (figs. 9a and 9b), on the other hand, redistribution does not follow the rectangle model and appears to encounter an impediment to flow at 2-m depth. In the disturbed but not the undisturbed soil, the infiltrated water appears to remain within the measured profile. The substantial water loss in the undisturbed
medium probably does not result from evapora tion because the soil was covered to prevent it. This loss more likely results from lateral flow that removes water from the range of neutron probe detection, a process that also could be enhanced by an impeding layer at 2 m.
Figure 10 gives \|/ profiles corresponding to the 0 profiles in Fig. 8. As expected, \j/ goes to about 0 on wetting, then declines. At the end of infiltration, \y exceeds 0 in the undisturbed but not the disturbed profile. It may be that the macropore structure of the undisturbed soil allows a positive head to build up quickly at the tensiometers, or that positive air pressure below the infiltrated water causes the positive \j/. As redistribution proceeds, \j/ declines with time at all depths, the disturbed-undisturbed differences being more a matter of degree than of profile shape. The \p values decline faster and have a greater variation with depth in the undisturbed profile. Because the tensiometers go down only to 1.2m, the data exclude the 2-m depth at which the major impediment to flow appears in the neu tron water content results for the undisturbed pro file. During redistribution, the \\f gradients indicate upward driving forces that exceed gravi tational force in the undisturbed but not the dis turbed soil. The gradients stay essentially uniform as the soil loses water, causing the curves to shift to lower y.
Figure 11 shows the field-measured water- retention curves. For the disturbed soil and for the shallow depths of the undisturbed soil, agreement is good between these results and the lab results (shown for comparison in figure 11 as shaded areas). The fact that agreement is better and the spread in measurements is less for the disturbed soil is consistent with the simpler, more homoge neous nature of the disturbed profile: the core samples used in the lab measurements are more representative of the field. The undisturbed soil also shows distinct depth differences, consistent with the more strongly layered character of this profile; the depth dependence is consistent with the combination of a vj/ that increases with depth and a 0 that is essentially uniform with depth. The
18

100
200
300
400
500
500 -
600
aUndisturbed Holes
Undisturbed Hole 2
0.3 0.4 0.1 Water content (vol/vol)
0.2 0.3 0.4
Figure 8. Measured water content as a function of depth during infiltration (the first 24 hours of the flood infiltration experiment). The "initial" profile was measured just before flooding started.
19

100
200
300
400
500
500 -
600
aUndisturbed Holes
0.2 0.3 0.4 0.1Water content (vol/vol)
Undisturbed Hole 2
dDisturbed Hole 15i . i
0.2 0.3 0.4
Figure 9. Measured water content as a function of depth during redistribution (after the initial 24- hour period of flooding). Times are given in terms of days from the start of flooding: "Day 1" means at the end of the flooded period. The truncation of data at the top of the profile in (a) and at the bottom in (d) gives the appearance of a-b and c-d differences that probably do not exist
20

Undisturbed Hole 3
dDisturbed Hole 15
-600 -400 -200 0 -600 -400 Matric pressure (cm of water)
-200
Figure 10. Matric potential as a function of depth for two of the four dusters of tensiometers. Data are selected for times corresponding as closely as possible to those for water content data in Figs. 7 and 8. The data shown are for the tensiometers clustered around neutron access hole 3 in the undisturbed soil, and around hole 15 in the simulated waste trench. The data not shown for the cluster around hole 2 (undisturbed) dosely resemble the data for the cluster around hole 3, except that the apparent wetting front moved about twice as fast during infiltration. Some of the tensiometers around hole 19 (waste trench) behaved erratically, probably because of poor soil contact, but those that appeared to work correctly gave results similar to those shown.
21

0.6
0.5
0.4
? 0.3,>"o
§ °'2 c 0.6 oo
a
Undisturbed
Range of laboratory measurements
0) 03
Disturbed0.5
0.4
0.3
0.2 -1000 -800 -600 -400 -200
Matric potential (cm water)0
Figure 11. Field- and laboratory- determined drying retention curves in the (a) undisturbed and (b) disturbed plots. Connected point symbols show the field-measured data, while the gray shading indicates the range of comparable laboratory measurements from approximately the same depths.
22

field results are near the lower range of the lab results for undisturbed soil and some of them are outside the range. This may be additional evi dence of a greater number of relatively large pores in the field profile than in the core samples.
Field-Measured Unsaturated . Hydraulic Conductivity
Figure 12 shows the instantaneous-profile measurements of K. The lab and field results mostly agree within about one order of magni tude, fairly good agreement for the methods used. The agreement is better for disturbed than for undisturbed soil, possibly because of the lesser heterogeneity. The slopes of log K against 6 agree well. Like the lab results but to a lesser degree, the field results show greater sensitivity to 6 in undisturbed soil.
Beyond the similarities, the field results on average have somewhat greater K. Paige and Hil- lel (1993) obtained similar results and suggested that they result from the larger effective sample size of the field method. A larger sample neces sarily includes more heterogeneity. Given the nonlinearity of flow rates in different portions of the sample, this heterogeneity would be expected to bias the whole-sample average toward higher K. Other studies, for example, those of Anderson and Bouma (1973) and Lauren and others (1988), found consistently greater K in shorter samples. This suggests that the connectedness of pores may be an issue, with longer samples including more regions with poor connections. The study of Baker (1977) directly considered the effect of sample diameter, but did not show a consistent trend. Thus there is not a sound basis to attribute the difference in our study to effective sample size. Another possibility is that plate impedance may have affected the outflow-measured lab results. However, this would change the slope as well as the position of the curves, and, because the slopes agree well, it appears less likely. The field results also may be affected by errors in determining vertical flux density from the changes in water content, especially in the undis turbed medium, because some water is removed by lateral rather than vertical flow. This could
result in an overestimation of the field K as in fig ure 12. The difference between laboratory and field K measurements may result from effects like this or another unexplored bias of the mea surement techniques. Its magnitude may not be great enough to have substantial hydrologic effects.
DISCUSSION
Looking at property measurements alone, the comparison of undisturbed and disturbed media gives a consistent picture: for the most part, slight or modest disturbance-related differences in retention curves and unsaturated K; greater verti cal and horizontal heterogeneity in the undis turbed medium; and reasonable agreement of lab and field techniques. The actual behavior of water in the field differs considerably between the undisturbed and disturbed locations. As measured during and after simulated flooding, the observed infiltration and redistribution profiles show dif ferences much more pronounced than the individ ually measured properties, by whatever technique. These facts have significance both for the practical characterization of unsaturated flow, and for the evaluation of waste-disposal sites.
Characterization of Unsaturated Flow
We have quantitatively related the water flow observed in the field to the laboratory-measured properties, including K(0) from the Kool-and- others method, using the VS2DT model (Healy, 1990) for one-dimensional Richards-formulated flow. We averaged the properties for each observed soil horizon (five layers) in the undis turbed case and for the entire profile in the dis turbed case. The initial condition in each case was a water content of 0.16. The boundary condition at the top of the profile was ponded water at 8 cm depth for the first 24 hours, and zero flux thereaf ter.
Results (Fig. 13) provide a comparison with the water-content-profile measurements in fig ures 8 and 9. In both infiltration and redistribu tion, the model results give essentially rectangular profiles with sharp wetting fronts, resembling measurements for the disturbed but
23

10"
o
o13 ac o o
-§ ID'7CO
10 90.2
.Undisturbed .
V
^ItBpo Disturbed
Range of laboratory data
0.3 Water content
0.4
Figure 12. Field measurements of unsaturated hydraulic conductivity for undisturbed anddisturbed soil. Gray shading indicates the range of comparable laboratory measurements from approximately the same depths.
24

500-
6000.2 0.4 0.6
Water content (vol/vol)
Figure 13. Numerically modeled infiltration and redistribution for layered and unlayered media at selected times given in days (d).
25

not the undisturbed soil. The model gives the rate of downward movement as too fast for nearly all cases (undisturbed and disturbed, infiltration and redistribution). The one exception is undisturbed soil at the end of the infiltration period where, given the absence of a sharp wetting front and the possibility of an impeding layer, it is likely that the agreement is coincidental. The model also dif fers in showing consistently faster movement in the disturbed soil, the opposite of what was observed except during advanced redistribution. Thus the model as applied is inadequate to repre sent the major qualitative and quantitative fea tures of the observations, including the main disturbed-undisturbed distinctions.
Flaws in the soil-property measurements are probably not the major deficiency. They were measured at high resolution, were corroborated in several cases by multiple techniques, and they create a consistent and reasonable picture of the unsaturated medium and its alteration by distur bance. Yet they appear inadequate for predictive modeling.
Important complexities beyond the one- dimensional, simply layered, Richards' equation approach might include (1) two-dimensional flow to account for the effect of lateral spreading and heterogeneity, (2) hysteresis for more realistic modeling of redistribution, (3) a more detailed layering structure, or (4) explicit representation of preferential flow, which dominates during the flood, using information other than the hydraulic property measurements. Of these, the two-dimen sionality and hysteresis would likely affect the rates of infiltration and redistribution, but are unlikely to account for qualitative features such as the nearly instantaneous flow to 2-m depth, and the virtual cessation of flow below this depth, in the undisturbed soil. Details of the layering and preferential flow, however, might account for most of the observed flow behavior. A thin, mini mally permeable layer at 2-m depth might account for the main features of the flow behavior in the undisturbed medium, but the core sampling would have to be essentially continuous to detect such a layer. The carbonate measurements might in principle identify such a layer, if it were associ ated with caliche or other carbonate-rich materi
als, but these also would have to be done at a high spatial resolution. The field measurements of K(0) and 0(vj/) are, in effect, done with coarse spatial resolution and would not be expected to predict a natural barrier at 2-m depth. The results show that even with a detailed characterization of a natural soil profile, undetected features may dominate the hydrologic behavior. In the dis turbed medium there is a better chance of ade quate characterization; Preferential flow, assuming it is associated with macropores rather than instabilities, might be represented by an explicit characterization of macropores. Added to the Darcy-Richards flow as modeled by VS2DT, this might represent the rapid flow down to 2 m. Alternatively, better knowledge of K at high water content may help in the incorporation of macropore influences, and might improve the modeling of our measured unsaturated flow. Leummens and others (1995) and other research ers s have also noted that extrapolation of mea sured properties into the very wet range needs further exploration in structured soils. For a given 6 near saturation, the small amount of air space (about 20 percent of pore volume for our media just after infiltration) may be either unfilled macropores, or trapped air in small pores. Then the water either does or does not fill the largest pores, with drastic implications for K. Even the representation of K(6) as a function is mislead ing, as there can be great hysteresis, depending on wetting history and relevant conditions.
Hydrology of Waste-disposal Sites
These results have several implications for the characterization of waste-disposal sites like the one at the INEEL. Macropores are probably very important, especially during flood infiltration when water can move rapidly to 2-m depth in the undisturbed soil. Layers are an important retard ing influence, as expected. In the undisturbed soil, even with much preferential flow, layering appears to strongly inhibit flow below 2 m, but in the disturbed soil, water moves freely and uni formly to deeper depths. This feature is of great importance because, at the lower depths reached
26

in the disturbed soil, water may largely evade the opportunity for removal by evapotranspiration. It may thus increase aquifer recharge.
The results suggest little change in 6 at the 2-m-and-below depths of typical waste burial. Even in the simulated waste trench, which shows more 0 change than the undisturbed profile (Fig. 9), the effects of a 24-hour flood are significantly attenuated over the days required for water to reach these depths. Normally, evaporation would not be suppressed, so the 9 increase at these depths would be even less.
For an estimated rate of deep drainage, if the flow is gravity-driven below a certain depth, K at the field water content of that depth can indicate the downward flux density (Nimmo and others, 1994). Figure 9 suggests that 0 may be essentially constant at a depth of a few m, 6 equaling about 0.23 in the undisturbed and 0.20 in the disturbed soil. If so, then measured K values at these water contents (Fig. 7, with extrapolation required in the disturbed case) indicate about 1 mm or less of deep drainage per year. This is less, though per haps not significantly less, than the estimates of 3.6 to 11 mm per year that Cecil and others (1992) obtained by tracer and Darcy-based meth ods. Assuming there are no losses of water between 3 m and the water table, these estimates would indicate the recharge rate. At an average water content of about 0.2, these recharging flux densities would predict convective transport rates of 5 to 50 mm per year, unrealistically low, given the finding of contamination from preferential transport much deeper than these rates would pre dict (Humphrey and others 1982; Laney and Minkin, 1988).
All of the study methods proved useful for waste-site characterization, but to different degrees. The field methods, while not superior for property determination, do afford the opportunity for direct observation of the actual infiltration and redistribution of water. This feature is especially important because of the difficulty of predicting these phenomena. For property measurement, the scale of observation, up to a few m, seems less important here than the range and conditions of measurement. The laboratory water-retention
measurements provide considerable information about layering, undisturbed-disturbed differ ences, pore distributions, and hydraulic proper ties. The high resolution of these curves was useful for demonstrating the absence of critical differences in shape in the -10- to -100-cm y range, though with this fact established, lower resolution would be adequate. If high-resolution measurements had been possible in the 0- to -10- cm range, they might be valuable for showing macropore structure.
CONCLUSIONS
Landfill construction by excavating and replacing soil, as practiced at the INEEL, has a great effect on the behavior of unsaturated flow, as evidenced by the way that the unsaturated zone responds to a 24-hour flood. The influence of this mechanical disturbance on the hydraulic proper ties, however, is weaker. Field and laboratory measurements give a consistent picture of pro nounced layering of the undisturbed medium that is absent in the simulated waste trench. There also is consistent evidence for a slightly broader pore- size distribution in the undisturbed medium, for example, in the fact that K tends to change faster with 0. This distribution implies that some of the largest pores are made smaller (as by destroying wormholes) and some of the smallest pores are made larger (as by crushing aggregates) in the disturbance of landfill construction.
With infiltration and redistribution from an artificial flood, there is essentially simultaneous wetting throughout a 2-m thickness of profile in the undisturbed soil, but a sharp wetting front in the simulated waste trench. There also is an effec tive blockage of downward movement of water at 2-m depth in the undisturbed medium, but no such blockage in the waste trench. These distinc tions suggest that both preferential flow in macropores and flow retardation due to layering are important in the undisturbed medium. The retarding effects of layers are highly effective even though preferential flow is strongly evi denced in this undisturbed soil.
27

One serious limitation of hydraulic-property measurements is the lack of good data at high water contents, between about 85- and 100-per cent of saturation. Standard measurements of K(6) and 0(\|/) do not embody the relevant phe nomena to give this information, yet it is a crucial influence on the behavior of infiltrated water.
Concerning the value of different study meth ods for evaluating waste sites, either core-sample measurements or field instantaneous-profile mea surements can give unsaturated hydraulic proper ties. However, in the case studied, a physical simulation of an event such as a flood shows the behavior of the unsaturated system better than do the individual property measurements. Even though we had hydrologic properties measured in detail with good agreement by several lab and field methods, a basic Darcy- and Richards-based model did not accurately predict the unsaturated- zone response to a small-scale flood. Of the many possibilities for increasing the complexity of modeling for better predictions, the measured results suggest that a more detailed treatment of layers and of preferential flow might be most usenful.
Concerning the waste site itself, the destruc tion of layers and macropores has significant hydrologic influence. These two elements have opposing effects, layers to retard downward flow, and macropores to increase infiltration during a flood. The net effect, however, may be that land fill construction increases the likelihood of water moving to the water table because the natural lay ering, which could hold water high in the root zone for removal by evapotranspiration, no longer exists.
ACKNOWLEDGMENTS
We are indebted to Larry Mann and the staff of the USGS INEEL Project, especially John Pitt- man, who set up many of the test-trench facilities, and Brennon Orr, Linda Davis, Don Boyce, and Beverly Bowers.
REFERENCES CITED
Allmaras, R.R., Rickman, R.W., Ekin, L.G, and Kimball, B.A., 1977, Chiseling influences on
soil hydraulic properties: Soil Science Society of America Journal, v. 41, p. 796-803.
Allmaras, R.R., Ward, K., Douglas, C.L., and Ekin, L.G, 1982, Long-term cultivation effects on hydraulic properties of a Walla Walla silt loam: Soil and Tillage Research, v. 2, p. 265-279.
Anderson, J.L., and Bouma, J., 1973, Relation ships between hydraulic conductivity and morphometric data of an argillic horizon: Soil Science Society of America Proceedings, v. 37, p. 408-413.
Anderson, S.R., and Lewis, B.D., 1989, Stratigra phy of the unsaturated zone at the Radioactive Waste Management Complex, Idaho National Engineering Laboratory, Idaho: U.S. Geolog ical Survey Water-Resources Investigations Report 89-4065,22 p.
Andraski, B.J., 1996, Properties and variability of soil and trench fill at an arid waste-burial site: Soil Science Society of America Journal, v. 60, p. 54-66.
Arya, L.M., and Paris, J.F., 1981, A physicoempir- ical model to predict the soil moisture charac teristic from particle size distribution and bulk density data: Soil Science Society of America Journal, v. 45, p. 1023-1030.
Azooz, R.H., Arshad, M.A., and Franzluebbers, A.J., 1996, Pore size distribution and hydrau lic conductivity affected by tillage in north western Canada: Soil Science Society of America Journal, v. 60, p. 1197-1201.
Baker, KG, 1977, Factors influencing the crust test for in situ measurement of hydraulic conduc tivity: Soil Science Society of America Jour nal, v. 41, p. 1029-1032.
Bedinger, M.S., 1989, Geohydrologic aspects for siting and design of low-level radioactive- waste disposal: U.S. Geological Survey Cir cular 1034, 36 p.
Blake, GR., and Hartge, K.H., 1986, Particle den sity, in Klute A., ed., Methods of soil analysis,
28

Part I: Madison, Wisconsin, American Soci ety of Agronomy, Soil Science Society of America, p. 377-382.
Burke, W., Gabriels, D., and Bouma, J., 1986, Soil structure assessment: Rotterdam, Nether- lands,A.A. Balkema, 92 p.
Cecil, L.D., Beasly, T.M., Pittman, J.R., Michel, R.L., Kubik, P.W., Sharma, P., Fehn, U., and Gove, H.E., 1992, Water infiltration rates in the unsaturated zone at the Idaho National Engineering laboratory from chlorine-36 and tritium profiles, and neutron logging, in Khar- aka, Y.F., and Maest, A.S., eds., Water-Rock Interactions, v. 1: Rotterdam, Netherlands, A.A. Balkema, p. 709-714.
Clawson, K.L., Start, GE., and Ricks, N.R., 1989, Climatography of the Idaho National Engi neering Laboratory, 2nd edition: U.S. Depart ment of Energy Report DOE/ID-12118,115 p.
Constantz, J., and Herkelrath, W. N., 1984, Sub mersible pressure outflow cell for measure ment of soil-water retention and diffusivity from 5° to 95° C: Soil Science Society of America Journal, v. 48, p. 7-10.
Davis, L.C., and Pittman, J.R., 1990, Hydrologi- cal, meteorological, and geohydrological data for an unsaturated zone study near the radio active waste management complex, Idaho National Engineering Laboratory, Idaho, 1987: U.S. Geological Survey Open-File Report 90-114, 208 p.
Dunker, R.E., Hooks, C.L., Vance, S.L., and Dar- mody, R.G, 1995, Deep tillage effects on compacted surface-mined land: Soil Science Society of America Journal, v. 59, p.192-199.
Ehlers, W, 1976, Rapid determination of unsatur ated hydraulic conductivity in tilled and unfilled loess soil: Soil Science Society of America Journal, v. 40, p. 837-840.
Ehlers, W, 1977, Measurement and calculation of hydraulic conductivity in horizons of tilled and unfilled loess-derived soil: Geoderma, v. 19, p. 293-306.
Elrick, D.E., and Tanner, C.B., 1955, Influence of sample pretreatment on soil moisture reten tion: Soil Science Society of America Pro ceedings, v. 19, p. 279-282.
Payer, M.J., Rockhold, M.L., and Campbell, M.D., 1992, Hydrologic modeling of protective bar riers: comparison of field data and simulation results: Soil Science Society of America Jour nal, v. 56, p. 690-700.
Fuller, W.H., and Warrick, A.W, 1985, Soils in waste treatment and utilization, v. 2: Boca Raton, Florida, CRC Press, 226 p.
Gardner, W.R., 1956, Calculation of capillary con ductivity from pressure plate outflow data: Soil Science Society of America Proceedings, v. 20, p. 317-320.
Gee, GW, Bauer, A., and Decker, R.S., 1978, Physical analyses of overburden materials and mine land soils, in Schaller, F.W., and Sutton, P., eds., Reclamation of Drastically Disturbed Lands: Madison, Wisconsin, American Soci ety of Agronomy, Soil Science Society of America, p. 665-686.
Gee, GW, Campbell, M.D., and Campbell, J.H., 1992, Rapid measurement of low soil water potentials using a water activity meter: Soil Science Society of America Journal, v. 56, p. 1068-1070.
Hamblin, A.P., and Tennant, D., 1981, The influ ence of tillage on soil water behavior: Soil Science, v. 132, p. 233-239.
Healy, R.W, 1990, Simulation of solute transport in variably saturated porous media with sup plemental information on modifications to the U.S. Geological Survey's computer program VS2D: U.S. Geological Survey Water Resources Investigations Report 90-4025, 125 p.
Humphrey, T.G, Smith, T.H., and Pope, M.C., 1982, Projected subsurface migration of radi- onuclides from buried INEL transuranic waste: Nuclear Technology, v. 58, p. 136-149.
29

Jayawardane, N.S., and Prathapar, S.A., 1992, Effect of soil loosening on the hydraulic prop erties of a duplex soil: Australian Journal of Soil Research, v. 30, p. 959-975.
Johnson, C.D., and Skousen, J.G, 1995, Minesoil properties of 15 abandoned mine land sites in West Virginia: Journal of Environmental Quality, v. 24, p. 635-643.
Kaminsky, J.F., 1991, In situ characterization of unsaturated hydraulic properties of surficial sediments adjacent to the radioactive waste management complex, Idaho National Engi neering Laboratory, Idaho: Pocatello, Idaho State University, M.S. thesis, 96 p.
Klute, A., 1982, Tillage effects on hydraulic prop erties of a soil a review, in Unger, P.W. and Van Doren, D.M., Jr., eds., Predicting tillage effects on soil physical properties and pro cesses: Madison, Wisconsin, American Soci ety of Agronomy, Special Publication no. 44, p. 29-43.
Klute, A., and Dirksen, C., 1986, Hydraulic con ductivity and diffusivity, laboratory methods, in Klute A., ed., Methods of soil analysis, Part I: Madison, Wisconsin, American Society of Agronomy, Soil Science Society of America, p. 687-732.
Kool, J.B., Parker, J.C., and Van Genuchten, M.T., 1985, Determining soil hydraulic properties from one-step outflow experiments by param eter estimation, I. Theory and numerical stud ies: Soil Science Society of America Journal, v. 49, p. 1348-1354.
Kool, J.B., and Parker, J.C., 1987, Estimating soil hydraulic properties from transient flow experiments SFTT user's guide: Palo Alto, California, Electric Power Research Institute, 59 p.
Kool, J.B., and Parker, J. C., 1988, Analysis of the inverse problem for transient unsaturated flow: Water Resources Research, v. 24, p. 817-813.
Laney, P.T., and Minkin, S.C., 1988, Subsurface investigations program at the radioactive waste management complex of the Idaho National Engineering Laboratory: Annual Progress Report FY 1987, DOE/ID-10183, 150 p.
Lauren, J.G, Wagenet, R.J., Bouma, J., and Wos- ten, J.H.M., 1988, Variability of saturated hydraulic conductivity in a glossaquic haplu- dalf with macropores: Soil Science, v. 145, p. 20-28.
Leummens, H., Bouma, J., and Booltink, W.G, 1995, Interpreting differences among hydrau lic parameters for different soil series by func tional characterization: Soil Science Society of America Journal, v. 59, p. 344-351.
Melchior, S., andMiehlich, G, 1994, Hydrological studies on the effectiveness of different multi- layered landfill caps, in Christensen, T.H., Cossu, R., and Stegmann, R., eds., Landfiiling of waste-barriers: London, E & FN Spon, p. 115-137.
Mualem, Y., 1976, A new model for predicting the hydraulic conductivity of unsaturated porous media: Water Resources Research, v. 12, p. 593-622.
Nimmo, J.R., 1997, Modeling structural influ ences on soil water retention: Soil Science Society of America Journal, v. 61, p. 712-719.
Nimmo, J.R., and Miller, E.E., 1986, The temper ature dependence of isothermal moisture vs. potential characteristics of soils: Soil Science Society of America Journal, v. 50, p. 1105- 1113.
Nimmo, J.R., Rubin, J,. and Hammermeister, D.P., 1987, Unsaturated flow in a centrifugal field: measurement of hydraulic conductivity and testing of Darcy's law: Water Resources Research, v. 23, p. 124-134.
Nimmo, J. R., 1992, Semiempirical model of soil water hysteresis: Soil Science Society of America Journal, v. 56, p. 1723-1730.
30

Nimmo, J.R., Stonestrom, D.A., and Akstin, K.C., 1994, The feasibility of recharge rate determi nations using the steady-state centrifuge method: Soil Science Society of America Journal, v. 58, p. 49-56.
Paige, GB., and D. Hillel, 1993, Comparison of three methods for assessing soil hydraulic properties: Soil Science, v. 155, p. 175-189.
Passioura, J.B., 1976, Determining soil water dif- fusivities from one-step outflow experiments: Australian Journal of Soil Research, v. 15, p. 1-8.
Pittman, J.R., 1989, Hydrological and meteorolog ical data for an unsaturated zone study near the Radioactive Waste Management Com plex, Idaho National Engineering Laboratory, Idaho, 1985 and 1986: U.S. Geological Sur vey Open-file Report 89-74, 24 p.
Pittman, J.R., 1995, Hydrological and meteorolog ical data for an unsaturated-zone study area near the Radioactive Waste Management Complex, Idaho National Engineering Labo ratory, Idaho, 1988 and 1989: U.S. Geological Survey Open-File Report 95-112, 120 p.
Rightmire, C.T., and Lewis, B.D., 1987, Hydroge- ology and geochemistry of the unsaturated zone, Radioactive Waste Management Com plex, Idaho National Engineering Laboratory, Idaho: U.S. Geological Survey Water- Resources Investigations Report 87-4198, 89 p.
Rose, C.W., Stern, W.R., and Drummond, J.E., 1965, Determination of hydraulic conductiv ity as a function of depth and water content for soil in situ: Australian Journal of Soil Research, v. 3, p. 1-9.
Rossi, C., and Nimmo, J. R., 1994. Modeling of soil water retention from saturation to oven dryness: Water Resources Research, v. 30, p. 701-708.
Schulz, R.K., Ridky, R.W., and O'Donnell, E., 1992, Control of water infiltration into near
surface LLW disposal units: NUREG/CR- 4918, v. 6, p. 1-18.
Shakofsky, S.M., 1993, Changes in the hydraulic properties of a soil caused by construction of a waste trench at a radioactive waste disposal site: San Jose, California, San Jose State Uni versity, M.S. thesis, 53 p.
Shakofsky, S.M,. 1995, Changes in soil hydraulic properties caused by construction of a simu lated waste trench at the Idaho National Engi neering Laboratory, Idaho: U.S. Geological Survey Water-Resources Investigations Report 95-4058, 26 p.
Siefken, D., Pangburn, G, Pennifill, R., andStarmer, R. J., 1982, Site Suitability, Selection and Characterization: U.S. NUREG-0902,20P-
Stone, L.R., Olson, T.C., and Horton, M.L., 1973, Unsaturated hydraulic conductivity for water management measured in situ: Proceedings of the South Dakota Academy of Science, v. 2, p. 168-178.
Striegl, R.G, Prudic, D.E., Duval, J.S., Healy, R.W., Landa, E.R., Pollock, D.W., Thorsten- son, D.C., and Weeks, E.P., 1996, Factors affecting tritium and 14carbon distributions in the unsaturated zone near the low-level radio active-waste burial site south of Beatty, Nevada: U.S. Geological Survey Open-File Report 96-110,16 p.
Topp, GC., 1971, Soil water hysteresis in silt loam and clay loam soils: Water Resources Research, v. 7, p. 914-920.
Watson, K.K., 1966, An instantaneous profile method for determining the hydraulic conduc tivity of saturated porous materials: Water Resources Research, v. 2, p. 709-715.
Winograd, I. J., 1981, Radioactive waste disposal in thick unsaturated zones: Science, v. 212, p. 1457-1464.
31