labor market rigidities and informality 03 31...
TRANSCRIPT

1
Labor Market Rigidities and Informality in Colombia
Camilo Mondragón-Vélez
International Finance Corporation
Ximena Peña
Universidad de Los Andes
Daniel Wills∗
Universidad de Los Andes
March, 2010
Abstract
Informality is at the center of the economic debate in Colombia, fueled by the high level prevalent in the country and its substantial increase during the 1990s. We study the effect of labor market rigidities, namely the increase in non-wage costs and the minimum wage on the size of the informal sector, the transition into and out of informality, and wages. Our results indicate that rises in non-wage costs and the minimum wage, increase the probability of transition into informality as well as the size of the informal sector. The business cycle has second order effects. The analysis across education groups points towards strong exclusion motives for low skilled informal workers, mainly driven by labor demand adjustments in response to increasing hiring costs; and argues somehow in favor of exit motives for workers with higher educational attainment. In addition, we document facts regarding the evolution and characteristics of the informal sector across alternative definitions of informality.
Key Words: Informality, non-wage costs, minimum wage, transition probability
JEL Codes: J31, J32, J38
∗ We would like to thank Santiago Saavedra for excellent research assistance in early stages of this project, Raquel Bernal, Alberto Carrasquilla, Adriana Kugler, Mauricio Santa María and seminar participants at Universidad de los Andes, Rosario, Banco de la República, Fedesarrollo and LACEA Panel Meeting in October 2009 for useful suggestions. The views expressed in this paper are those of the authors and do not necessarily represent those of the IFC or IFC management. All errors and omissions are sole responsibility of the authors. Addresses: [email protected], [email protected], [email protected]
2
1. Introduction
Informality has been at the center of the economic debate in Colombia due to the high levels prevalent in the country and its substantial increase during the 1990s. The informal sector includes a range of heterogeneous activities, from unpaid labor to a number of unregulated salaried jobs. Informality is thought to have negative implications, mainly through inferior working conditions, lack of formal insurance against illness, unemployment and/or old age, as well as low productivity levels for firms. Alternative definitions of informality have been proposed in the literature, each implying a different approach to this phenomenon. The Colombian labor market is characterized by high levels of non-wage costs (NWC) and minimum wage relative to the economy’s level of productivity. NWC are costs faced by the employer (other than the wage) that include health and pension contributions, payroll taxes and transportation (commuting) subsidies, among others. 1 These labor market rigidities imply that the formal sector, where workers comply with regulations, is less able to adjust to the business cycle. Hence, economic policy originally designed to protect workers might be in fact generating increased informality. This paper brings new elements to our understanding of informality in Colombia and suggests directions for future research. We study the evolution of informality between 1984 and 2006; a period that includes both expansions and recessions, structural reforms of the labor market and significant variation in non-wage costs and the minimum wage. By generating individual or city-level variation, we are able to disentangle the effects of NWC, the minimum wage and the business cycle on informality. We begin our analysis by considering alternative definitions of informality and adopt two (primarily driven by data availability): the definition used by the Colombian Statistics Department (DANE, for its initials in Spanish) which is based on firm size and occupation, and one based on contribution to health insurance (as a proxy to compliance with labor market regulations). In regard to the empirical analysis, we first estimate the probability of being informal as a function of individual characteristics, the business cycle and labor market rigidities. Our results suggest that rises in non-wage costs and the minimum wage are highly correlated with informal sector growth. Next, we look at the transitions between sectors. On one hand we measure the transition flows between the formal and informal sectors using transition matrices. These describe, for example, the proportion of job destruction in the formal sector that is absorbed by the informal sector. On the other hand, we estimate the effect of labor market rigidities on the likelihood of switching sectors (controlling by idiosyncratic characteristics and macroeconomic conditions), to determine their role in the decision to make such transition. We find that labor market rigidities are important drivers of the transition into informality, particularly for low skilled workers. However, further research is needed to understand the channels through which labor market rigidities affect the transition into the formal sector, in particular for workers with high educational attainment.
1 Payroll taxes refer to employer contributions to finance public social services such as job training and childcare.
3
One strand of the literature associates informality to labor market rigidities in Colombia. Núñez (2002) finds a positive relation between informality and income taxes on labor revenue for the period 1988-1998. Using a firm panel from the industrial sector, Kugler and Kugler (2009) find that a 10% increase in payroll taxes decrease formal employment between 4 and 5%. Santa María et al. (2009) find that the subsidized regime, financed through NWCs, has increased the incentives to become informal and it is thus acting as a subsidy to informality. Our results suggest that an increase of 10 percentage points in NWC is associated with an increase of 5 to 8 percentage points in the size of the informal sector. Some authors, on the other hand, characterize informal workers and study informality from a segmentation perspective. Flórez (2002) finds that some informal workers are excluded from the formal sector, while others opt out. Perry et al. (2007) document two coexistent phenomena in the Latin American region: exclusion from the formal sector as a result of labor market segmentation; and exit from the formal sector as some workers find better conditions in informality. They show that whereas in many Latin American countries the self-employed choose to be so, the Colombian self-employed are deemed an exception since they seem to be excluded from the formal sector (see for example Cunningham and Maloney, 2001, for the case of Mexico). Bernal (2007) reports that one half of informal workers would accept a formal job for a wage equal to or lower than the one they currently make. Along these lines, our results support the idea of exclusion motives for low skilled informal workers and argue somewhat in favor of exit motives for high skilled workers. The paper is divided into 6 sections. The following section compares and documents the evolution of informality across alternative definitions; while section 3 describes the evolution of labor market rigidities. In sections 4 and 5 we estimate the effect of NWC and the minimum wage on the size of the informal sector, the probability of switching sectors and wages, respectively; the last section concludes.
2. The Evolution of Informality
2.1 Data Description
We use data from the Colombian Household Survey, a repeated cross-section carried out by the National Statistics Department (DANE), for the period 1984-2006. The survey collects information on demographic and socioeconomic characteristics of the population, such as gender, age, marital status and educational attainment, together with labor market characteristics for the population aged 12 or more including occupation, job type, income and industry sector.
Dictated by data availability our analysis focuses on Colombia’s eleven main cities between 1984 and 2000, and the thirteen main cities for the period 2001-2006. In particular we use the Informality Module in the household survey, which allows for several empirical definitions of informality as described in section 2.2. This module is available every two years before 2001, and yearly thereafter. We use observations with a complete set of covariates and restrict the sample to workers between 15 and 70 years of age, who report working between 16 and 84 hours per week. The size of the weighted samples ranged from 1.7 million workers in 1984 to about 6.5 million in 2006.

4
2.2 Informality Definitions
Alternative definitions of informality, usually dictated by data availability, have been proposed in the literature. This section characterizes the evolution of informality using all definitions available from the Colombian Household Survey, and explores the extent to which definitions involving compliance (or non-compliance) with labor market regulations concur with DANE’s official definition related to firm size and occupation.
According to DANE, informal workers are those who: (i) work in firms with 10 or fewer employees; (ii) are unpaid family aids and housekeepers; (iii) are self employed (except for independent professionals and technicians); or (iv) are business owners of firms with 10 or less employees. This definition (in line with the one proposed by the International Labor Office) will be in what follows referred to as Firm Size and Occupation, since it is largely driven by these two dimensions. This definition has been criticized in the literature for not measuring the phenomenon directly (see for example Flórez 2002). That is, even though the negative aspects of informality have to do with lack of compliance, this definition does not explicitly include any criteria related to labor market regulations.
We also consider definitions related to social protection contribution that capture whether workers pay for access to the benefits associated with formal employment. The first social protection definition has to do with old-age insurance: we define formal workers as those who make Pension contributions. The next informality criterion is health insurance contribution2 - Health in what follows. Finally, we consider the Health and Pension criterion that defines workers as formal if they contribute to both health insurance and pension. Being the most comprehensive criterion, it implies the highest levels of informality.
Figure 1 presents the evolution of the informality rate for the period 1984-2006 across these alternative definitions.3 According to Firm Size and Occupation, informality was stable around 52% from 1984 to 1996, grew steadily between 1996 and 2001 to 56%, and remained at this level until the end of the period. This increase is sizable and is at the center of the domestic debate. Under Pension, the percentage of informal workers increased from 1998 to 2001, and then continually decreased until 2006. Informality as measured by Health decreased between 1984 and 1996, then increased from 44% to 49% between 1996 and 2000, and finally decreased between 2001 and 2006. Moreover, informality is higher if measured through pension contributions as compared to health contributions, suggesting either that workers value health more than old-age insurance,
2 Informality behaves very differently when measured by health access instead of health contribution, mainly due to the expansion of the “subsidized regime” (free health insurance provided to the poor). Also, according to Colombian Law, workers should contribute individually to social security. However, if an individual has health insurance the spouse, children and parents are also covered. Therefore, covered spouses have no incentive to contribute as law-abiding families are double-taxed for health insurance. In this paper, we consider workers who are covered by spousal/family insurance or who work but are covered by the subsidized regime as informal. 3 The time series for each definition is presented according to data availability.

5
or the existence of informal old-age insurance mechanisms such as family or friends. Informality measured by Health and Pension follows closely the Pension criterion. The dotted line, measured on the right axis, is the urban unemployment rate. The informality definitions that have to do with compliance seem to follow the cycle closer than the Firm Size and Occupation definition. However, according to all definitions informality increased in the second half of the 1990s and peaked around year 2000, after the deep economic recession of the late 1990s.
Figure 1. The Evolution of Informality by Alternative Definitions
2.3 To What Extent do Alternative Definitions of Informality Concur?
Despite the difference in levels, the evolution of informality measured by Pension and Health is very similar. Taking a closer look at the composition of these groups, those classified as informal under Health are almost a subset of those classified as informal in Pension: on average, one percentage point of those considered informal using the Health criterion are formal under Pension. Hence, given that Health captures the relevant dynamics of informality measured by compliance and is available for a longer period than Pension, it will be used in the remainder of the paper as the benchmark definition for compliance of labor market regulations.
The levels of informality suggested by Health are lower than those measured by Firm Size and Occupation. Moreover, their trends in time are not identical. Thus, the question of whether these alternative definitions are classifying the same workers as informal arises. To address this issue, we first present a Venn diagram (Figure 2) portraying the extent to which these definitions concur using data from year 2006 (a similar analysis is presented in Henley et al. 2006 for the Brazilian case).
.05
.1
.15
.2
.25
.3
.45
.5
.55
.6
.65
1984 1986 1988 1990 1992 1994 1996 1998 2000 2002 2004 2006 Year
Firm Size and Occupation Health Health and Pension Pension Unemployment (right axis)
Info
rmal
ity R
ate
Unem
ploy
men
t Rat
e

6
Figure 2. Concurrence of Informality Definitions, 2006
Figure 2 has three main implications. First, the majority of informal workers under Firm Size and Occupation or Health (38.9% of total workers), are informal under both definitions. This is because non-compliance with social security regulations is a small-firm phenomenon. Second, the Firm Size and Occupation definition captures the bulk of workers considered informal under Health (90% of health informality), despite the fact that it does not include any criteria regarding social security compliance. Third, the difference between the two definitions is still sizable as about one fourth of all workers is classified as formal or informal depending on the definition used.
Figure 3. Informality under Health across Occupations and Firm Size
38.9%
5%
38.7%
Formal Workers
17.5%
Firm Size and Occupation
Health
0
.2
.4
.6
.8
1
1985 1990 1995 2000 2005Year
Private Wage Earner Public Wage Earner Household Services Self EmployedBusiness Owner
By Occupation
0
.2
.4
.6
.8
1
1985 1990 1995 2000 2005Year
Works alone 2-5 workers 6-10 workers 10+
By Firm Size
Info
rmal
ity L
evel
s
Info
rmal
ity L
evel
s

7
Differences in informality levels across firm size and occupations measured by Health are staggering, as displayed in Figure 3. Less than 20% of individuals working in firms with more than 10 employees are informal compared to over 80% of those working alone. This reflects the fact that not only compliance costs are more difficult to cover for small firms, but also these firms find it is easier to stay below the government’s radar. Differences in informality measured by Health across occupations are also important: while about 85% of the self employed and household services (who are informal according to the Firm Size and Occupation definition) do not contribute to health insurance, few government employees are informal.
Figure 4. Comparison between Firm Size and Occupation and Health 2000-2006
As mentioned above, the classification differences between Firm Size and Occupation and Health are substantial. Figure 4 shows the evolution of the concurrence between the two definitions, that is, the information contained in the Venn Diagram over time. The left panel of Figure 4 shows the evolution of the classification differences between 1984 and 2006. Notice that the percentage of workers classified as informal under Health but as formal under Firm Size and Occupation (Informal by Health – Formal by Firm Size in the graph) has been stable for the period of study at around 7%. Workers classified as informal using Firm Size and Occupation, but formal using Health (Informal by Firm Size– Formal by Health in the graph), have increased from 10% in 1984 to 17% in 2006. This may be related with increasing enforcement efforts in regards to health insurance contributions. The right panel of Figure 4 shows the percentage of workers who are either informal or formal under both definitions. The percentage of workers classified as formal or informal under both definitions ranges between 36% and 42%.4
4 Who are the misclassified workers? Workers who are informal under Firm Size and Occupation but are formal under Health can be grouped in two categories. On the one hand, they are relatively educated, older and wealthier. On the other, they are often unpaid family aids, business owners and household
.2
1985 1990 1995 2000 2005 YearInformal by Firm Size Formal by Health
Differences in Definitions
1985 1990 1995 2000 2005 YearFormal Informal
Agreement in Definitions
Overlap of Definitions
.44
.42
.4
.38
.36
.15
.1
.05
Informal by Health Formal by Firm Size
% o
f Tot
al W
orke
rs
% o
f Tot
al W
orke
rs
8
2.4 Informality and the Business Cycle
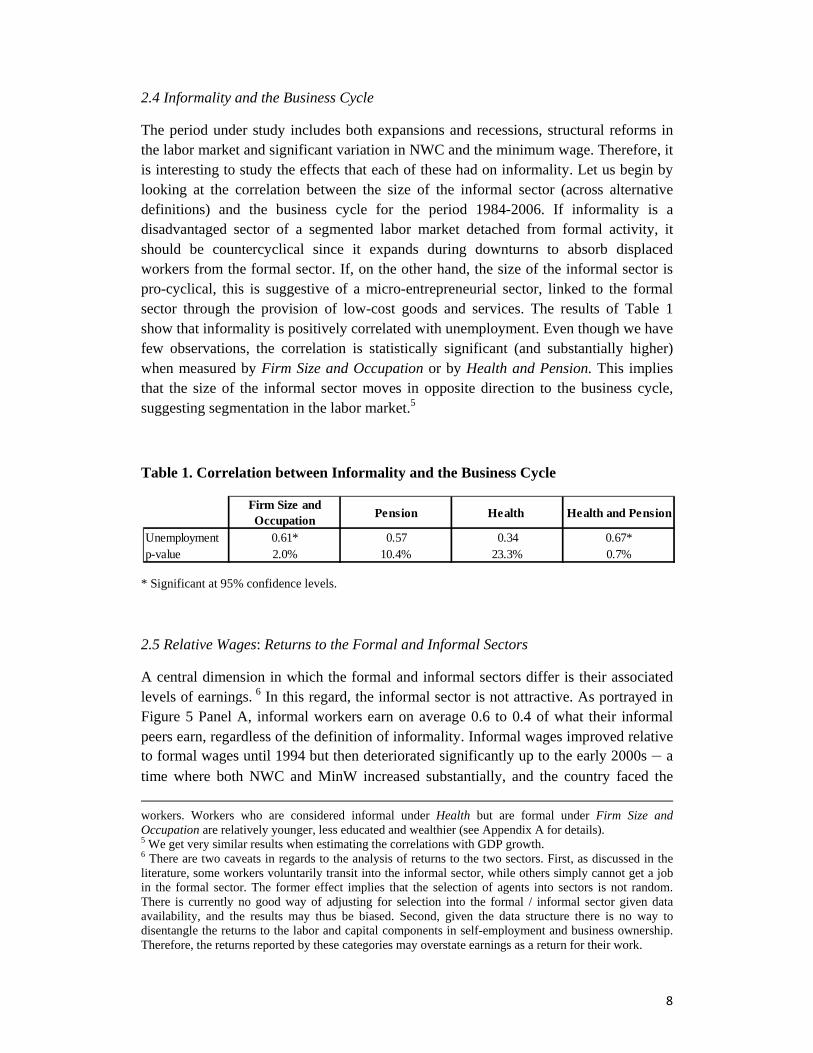
The period under study includes both expansions and recessions, structural reforms in the labor market and significant variation in NWC and the minimum wage. Therefore, it is interesting to study the effects that each of these had on informality. Let us begin by looking at the correlation between the size of the informal sector (across alternative definitions) and the business cycle for the period 1984-2006. If informality is a disadvantaged sector of a segmented labor market detached from formal activity, it should be countercyclical since it expands during downturns to absorb displaced workers from the formal sector. If, on the other hand, the size of the informal sector is pro-cyclical, this is suggestive of a micro-entrepreneurial sector, linked to the formal sector through the provision of low-cost goods and services. The results of Table 1 show that informality is positively correlated with unemployment. Even though we have few observations, the correlation is statistically significant (and substantially higher) when measured by Firm Size and Occupation or by Health and Pension. This implies that the size of the informal sector moves in opposite direction to the business cycle, suggesting segmentation in the labor market.5
Table 1. Correlation between Informality and the Business Cycle
* Significant at 95% confidence levels.
2.5 Relative Wages: Returns to the Formal and Informal Sectors
A central dimension in which the formal and informal sectors differ is their associated levels of earnings. 6 In this regard, the informal sector is not attractive. As portrayed in Figure 5 Panel A, informal workers earn on average 0.6 to 0.4 of what their informal peers earn, regardless of the definition of informality. Informal wages improved relative to formal wages until 1994 but then deteriorated significantly up to the early 2000s ― a time where both NWC and MinW increased substantially, and the country faced the workers. Workers who are considered informal under Health but are formal under Firm Size and Occupation are relatively younger, less educated and wealthier (see Appendix A for details). 5 We get very similar results when estimating the correlations with GDP growth. 6 There are two caveats in regards to the analysis of returns to the two sectors. First, as discussed in the literature, some workers voluntarily transit into the informal sector, while others simply cannot get a job in the formal sector. The former effect implies that the selection of agents into sectors is not random. There is currently no good way of adjusting for selection into the formal / informal sector given data availability, and the results may thus be biased. Second, given the data structure there is no way to disentangle the returns to the labor and capital components in self-employment and business ownership. Therefore, the returns reported by these categories may overstate earnings as a return for their work.
Firm Size and Occupation Pension Health Health and Pension
Unemployment 0.61* 0.57 0.34 0.67*p-value 2.0% 10.4% 23.3% 0.7%

9
deepest recession in recent history. Starting in 2002 informal wages recovered, but even after several years of high economic growth informal workers relative earnings in 2006 were still lower than those observed in the 1980s.
There are sizeable differences in relative returns across education groups (see Figure 5 Panel B), but the trends for each group are similar to the trend observed for the total.7 Using Health, at the beginning of the period, informal high skilled workers (those with completed secondary or more) were relatively better off than their low skilled peers. In the second half of the 1990s, the relative wages for the high skilled group decreased even more than those of low skilled individuals. (The results using Firm Size and Occupation are similar.)
Figure 5. Trends in Relative Informal to Formal Mean Wages by Informality definitions by Education Group (using Health definition)
3. Labor Market Rigidities and Informality
The Colombian labor market is characterized by relatively high NWC and wage inflexibility associated with the minimum wage (Bernal et al., 2009). Such rigidities are thought to contribute to the high unemployment and informality rates prevalent in the economy mainly due to the lack of adaptability of the formal sector to economic cycles. The coexistence of high levels of NWC and a binding minimum wage reinforce each other’s negative effects.
7 Workers with less than eleven years of schooling are classified as low skilled, while workers with eleven or more completed years of schooling are classified as high skilled. On average, 8.7% of the Colombian workforce has completed tertiary education. Appendix B displays the sample sizes and distributions across sectors of these two education groups. This classification splits the Colombian workforce roughly in half: 53% of workers are low skilled and 47% high skilled. When comparing the composition of the formal and informal sectors, roughly one out of every three informal workers are high skilled, whereas two out of every three formal workers are high skilled.
.4.4
5.5
.55
.6.6
5In
form
al/F
orm
al H
ourly
Wag
es
1985 1990 1995 2000 2005Year
Firm size and occup. Health
.5.6
.7.8
Info
rmal
/For
mal
Hou
rlyW
ages
1985 1990 1995 2000 2005Year
Low Education High Education

10
The literature has extensively studied the effect of payroll taxes and the minimum wage on the labor market. An increase in NWC makes labor relatively more expensive as compared to capital. Hence, employers can either shift the production away from labor, destroying formal working posts, or try to pass through the additional cost to employees via lower wages. However, the nominal downward rigidity imposed by a high and binding minimum wage, implies that formal employers cannot always completely pass on NWC to workers via prices generating further job destruction, which pushes more workers into either informality or unemployment. Increases of the minimum wage beyond price and productivity growth can also generate job destruction directly. If the minimum wage increases in real terms, firms destroy formal working posts whose productivity levels lie between the old and new minimum wage level.
Gruber (1997) shows that payroll taxes reduce labor demand and wages in equilibrium. Kugler and Kugler (2009) introduce NWC and a minimum wage into the Stiglitz-Shapiro model of efficiency wages. They find that NWC decrease formal employment when taxes are not completely shifted to workers via lower wages. This is always the case when the minimum wage is binding. Albrecht et. al (2008), in an extension of the Mortensen-Pissarides search and matching model, find that rises in NWC increase the size of the informal sector. Fortin, Marceau and Savard (1997) suggest that higher taxes on labor and a higher minimum wage increase the number of firms operating in the informal sector, decreasing the demand of informal labor at the expense of decreasing vacancies for formal workers. Kristensen and Cunningham (2006) show that rises in the minimum wage increase the relative cost of labor which, given the presence of downward wage rigidities, make the formal sector unable to adjust via prices forcing it to do so via quantities. Card and Krueger (1995) review the literature about minimum wages and suggest that an increase in the minimum wage increases wages and reduces employment in the covered (formal) sector. The effect in the uncovered (informal) sector depends on the model of labor supply chosen, but is either negative or ambiguous on wages and either positive or ambiguous on employment.
Let us describe the evolution of NWC and the minimum wage over the period of study. Colombia faced very profound reforms, as did other countries in Latin America, in the early 1990s. In particular, Law 100 of 1993 structurally reformed the Colombian social security system, both in health and pensions. Two regimes were created in health insurance: contributive (an employment-based mandatory insurance system) and subsidized. Before 1993, health insurance contributions amounted to 8% of the wage, while after the reform contributions increased to 12%.8 Similarly, pension contributions rose from 8% to 13.5% of the wage in a three year period (Flórez, 2002, and Santa María et al. 2009). 9 Therefore, Law 100 increased NWC by 9.5 percentage points.
8 In the case of wage-earners the worker and employer share the burden (4% and 8%, respectively) and the self-employed have to contribute the full amount. Nearly 10 percentage points of the contribution finance the worker’s insurance and the remainder contributes to the health access of the poor and unemployed in the subsidized regime. 9 Contributions for workers earning more than four minimum wages rose from 8% to 14.5%.

11
In addition to the steep increase in NWC, Bernal et al., (2009) suggest that four aspects of the current design of the Colombian social protection system, embedded in Law 100 of 1993, generate informality. First, since social security benefits are multi-dimensional, workers who prefer partial coverage over full coverage may opt out of the whole package and hence become informal. Second, there is a percentage of the population for whom the quality of the services offered in the contributive and subsidized regimes is comparable. Since the subsidized regime is free of charge, it is optimal for eligible workers in this population to remain in the subsidized regime which implicitly implies passing up formal jobs.10 Third, the current design does not allow for an easy transition between regimes. Thus, workers in the subsidized regime are reluctant to accept a formal job and enter the contributive regime, since re-entering the subsidized regime is time-consuming. Finally, workers who are eligible for the subsidized regime (i.e. classified as poor) are also eligible for an array of social programs. Therefore, by accepting a formal job, the worker and his family gain access to the contributive health insurance regime but can potentially loose other benefits.
The minimum wage in Colombia is high. In a cross-country comparison, Maloney and Nuñez (2004) find that the Colombian minimum wage ―as measured by the minimum to median wage ratio― is the highest in Latin America.11 In addition, the minimum wage in Colombia is binding and it indexes the whole wage distribution, since increases in the minimum wage are adopted as a benchmark for wage increases in the whole economy (Maloney and Núñez, 2004). The effect is stronger for wages close to the minimum and decreases for higher wages in the distribution. In addition, a sizeable fraction of the workforce earns less than the minimum, especially in the informal sector. Hence, not only does the existence of a minimum wage level generate wage inflexibilities, especially around the minimum, but its evolution can have important effects on the dynamics of the labor market.
In this paper NWC includes severance payments, health and pension contributions, payroll taxes, two annual bonuses and vacation payments, and a transportation (commuting) subsidy. 12 The latter is originally set at a fixed amount and is exclusive for workers earning less than two times the minimum wage. In our calculation of NWC this
10 One of the claimed recent successes of Colombian public policy is precisely the increase in coverage of the subsidized regime. 11 Since changes in the minimum wage should take into account both changes in the purchasing power as well as in labor productivity, a good way to characterize its evolution in time is to take the ratio between the minimum and the median wage –as a proxy for productivity. This measure trivially controls for inflation. 12 The payroll taxes finance public social services, which are paid solely by the employer, and are locally referred to as ‘parafiscales’. They are contributions to: (i) the Instituto Colombiano de Bienestar Familiar (ICBF) that aims at protecting children and improving the welfare of the Colombian families; (ii), the Servicio Nacional de Aprendizaje (SENA) that aims at investing in social and technical development of the Colombian workers through training programs; and (iii) Cajas de Compensación Familiar (CCF) whose main function is to redistribute a portion of the payroll of the covered work force through monetary subsidies and in-kind services to workers with the lowest wages.

12
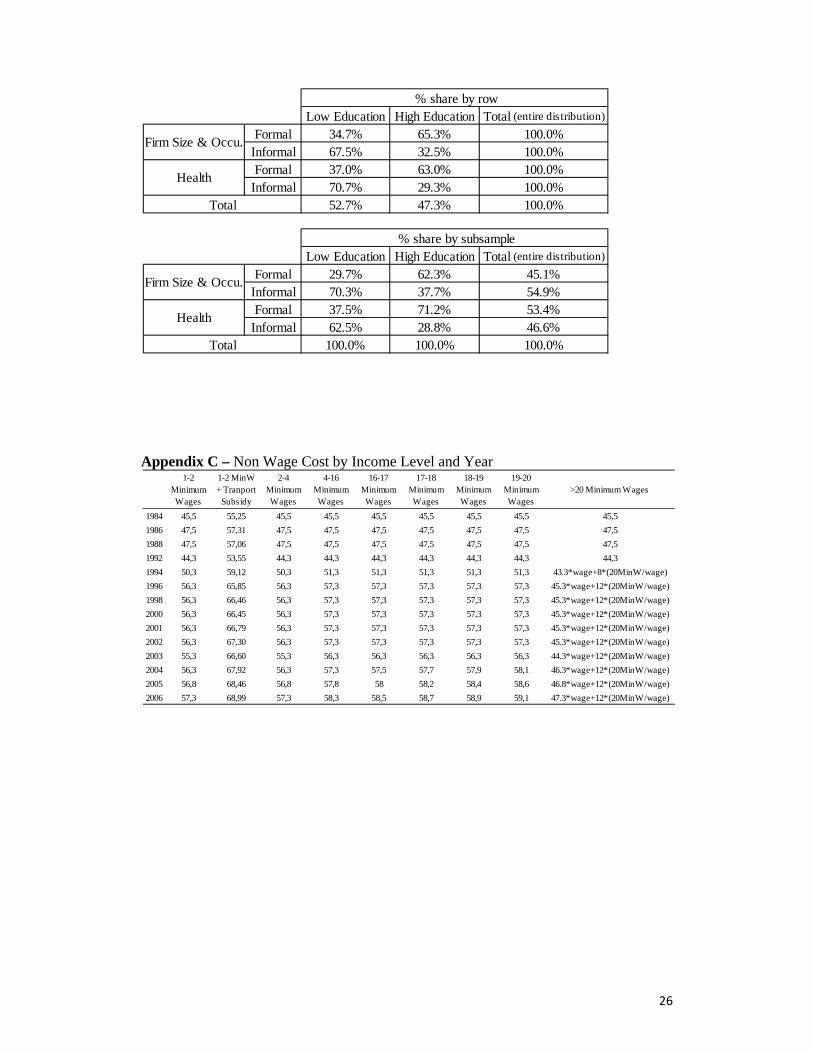
transportation subsidy is included as a percentage of the minimum wage. 13 For example in 1993 out of the 45.6 points of salary that correspond to NWC, 7 are health, 8 are pension contributions, 9.3 are severance payments, 9 are payroll taxes, 4.2 are vacation payments and 8.3 are two annual bonuses. In addition, the transportation subsidy accounted for 9.3% of the minimum wage. For a detailed description of NWC by year and income see appendix C. Our measure of NWC does not include severance payments for unfair dismissals (as in Cárdenas and Bernal, 2003) due to the lack of information to estimate the probability of being unfairly dismissed, nor work uniform subsidies mandated by law given the difficulty to determine their costs in time and applicability across sectors. It is important to note that the total NWC we include in our calculations is a proxy for the percentage of the wage employers would have to pay, regardless of whether they actually pay them or not.
Figure 6. Informality and Labor Market Rigidities
Figure 6 displays the informality rates under Firms Size and Occupation and Health, alongside the minimum to median wage ratio (MinW) and NWC. Both NWC and MinW display secular increases during the period of study. The major increase in NWC was due to Law 100 of 1993, which substantially increased the payroll taxes. MinW remained relatively stable around 85% from the mid 1980s to the early 1990s, decreased to 70% in the mid 1990s, escalated to over 90% by 2000 and has remained at this level until the end of the analysis period. This secular increase was the result of an inflation
13 We compared different ways to include the transportation subsidy and the results were robust to the different specifications tested. In particular, if the subsidy is included as the fixed amount mandated by law, it can become an unrealistically high percentage of the salary for those workers earning less than the minimum wage. In addition, as a robustness check we repeated the estimations in the paper without the transportation subsidy in the NWC measure, and the main results don’t change.
.7
.8
.9
1
.45
.5
.55
.6
.65
1984 1986 1988 1990 1992 1994 1996 1998 2000 2002 2004 2006Year
Firm Size and Occupation HealthNon Wage Labor Costs Min/Median Wage Ratio (second axis)
Min
/Med
ian
Wag
e R
atio
Info
rmal
ity R
ate,
Non
Wag
e C
osts

13
forecast error combined with legislation by the Constitutional Court.14 The combination of these decisions implied that the minimum wage has been effectively maintained at a very high level since. As shown in Figure 6, the increase in NWC precedes the increase in informality, while the increase in the MinW coincides with it.
Summarizing, the increase in NWC and the minimum wage are regarded by some analysts as key drivers of the high levels of unemployment and informality in Colombia (see for instance Bernal et. al 2009). One the one hand, higher NWC increase the cost of formality for both firms and workers, generating incentives to avoid compliance by voluntary (Exit, related to labor supply behavior) and involuntary (Exclusion, related to labor demand behavior) motives from the individuals’ point of view. On the other hand, increases in the minimum wage could imply higher informality via Exclusion from the formal sector. Thus, the following sections explore the empirical validity of these hypotheses for Colombia over the past twenty years.
4. The Size of the Informal Sector
We exploit the observed variation in MinW and NWC over the period 1984-2006 to determine their effect on the size of the informal sector. In these estimations we use the two alternative definitions of informality discussed in section 2.3 (Firm Size & Occupation, and Health). We pool observations from all the quarters for which the informality module is available in the period of interest to estimate the effects of labor market rigidities on the probability of being informal, using a probit model and controlling for individual characteristics. We estimate the following model:
is a dummy variable that takes the value of 1 if individual i residing in city c at time t is classified as informal, is the (national) minimum wage to median wage ratio in city c at time t, and is the level of non-wage costs (as a percentage of the individual’s salary). 15 Note that besides its time variation, NWC also varies across individuals. First, highly paid individuals have higher pension contributions (as a
14 Increases in the minimum wage for the following year in Colombia are negotiated by the end of the previous year, and guided by the projected inflation rate plus calculated increases in productivity. In December 1998 the expected inflation for year 1999 was in the range of 15% to 17%, and the negotiated increase in the minimum wage was 16%. However, during the course of the year the country fell into the deepest recession since the 1930s and the realized inflation rate for year 1999 was 9%. Therefore, the minimum wage increased 7% in real terms. The following year, the Constitutional Court ruled that minimum wage increases could never be below the observed inflation rate of the previous year (Constitutional Court Sentence Nº 815/99, October 20 1999).
15 When we eliminate the regional variation in MinW by using the national min-median ratio the estimated effects are higher.

14
percentage of their wages) in order to finance part of the country’s subsidized regime. For instance, workers earning more than 4 minimum wages have to contribute an additional percentage point of their monthly earnings to pension, and workers earning more than 16 minimum wages contribute up to two extra percentage points. Second, workers earning less than two minimum wages receive a transportation (commuting) subsidy which is about 10% of the minimum wage.16 HH Income pcict is real household income per capita, which is a proxy for the business cycle. Xict is a vector of individual controls that include age and age squared, educational attainment, gender and marital status (defined by marriage or cohabitation), in addition to industry sector and city dummies.17 The regressions were estimated using year and city clustered robust standard errors to account for the fact that although our sample spans over 22 years, we only have observations in 14 periods while MinW varies across years and cities but not across individuals.
The estimated effects of NWC, MinW and the business cycle on the size of the informal sector, measured through the workers’ probability of being informal, are shown in Table 2. The results suggest that labor market rigidities can have sizeable effects on the rate of informality, as the increases observed in NWC and MinW during the period of study are associated with a higher fraction of informal workers. For instance, an increase in 10 percentage points (pp in what follows) in NWC is associated with an increase in the probability of being informal of 5 to 8pp, depending on the definition of informality. To put this result in perspective, Kugler and Kugler (2009) estimate that an increase of 10% in NWC decreases formal employment between 4 and 5 percent. Similarly, the results obtained when using the government’s official definition of informality suggest that a rise of 20pp in MinW (such as the one observed between 1996 and 2001) implies an increase of 2pp in the informality rate.18 The economic cycle coefficient, when significant, implies counter-cyclicality (though it has in general second order effects).19
16 As discussed earlier, the main findings of the paper are robust to the inclusion or exclusion of transportation/commuting subsidies within NWC. 17 We use real household income per capita instead of regional GDP in order to generate variation across individuals. Our main findings are robust to changes in the business cycle proxy, for example by using real total household income. When we use regional GDP business cycle effects are in general not statistically significant. A better proxy for business cycle would be the growth of real household income per capita. However, because we’re working with repeated cross-sections, it is impossible to build such a measure. 18 To the best of our knowledge, there are no other estimations of the effect of the minimum wage on the size of the informal sector. 19 Regression estimates are only shown for the variables of interest; detailed and complete results for this estimation are shown in Appendix D. The estimated coefficients for the control variables indicate that informality rates tend to be higher for women, the young and single (implying relatively small effects though), and the low educated; and that there is significant variation across regions and economic sectors. Gender and marital status differences are not significant when using the Health definition of informality in the total sample.

15
Table 2 - Estimated Effects on the Size of the Informal Sector, Total Sample
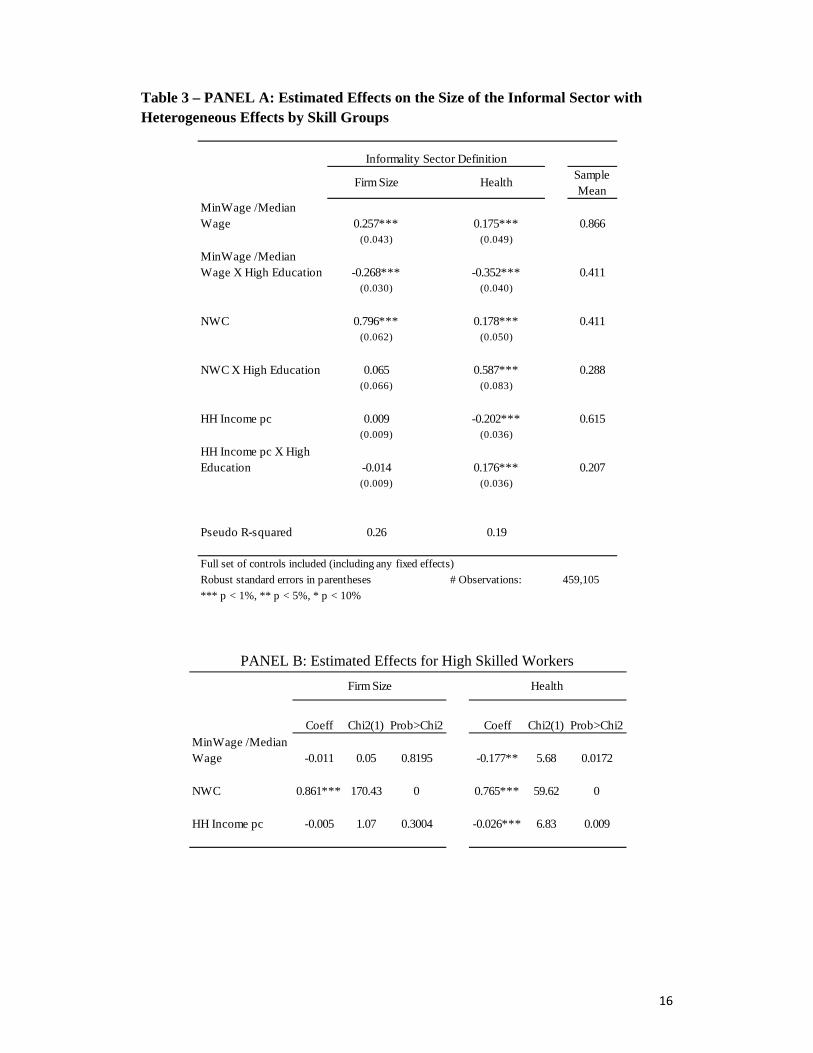
The magnitude and significance of NWC and MinW marginal effects on the total sample vary with the definition of informality. While effects are higher when informality is measured by Firm Size and Occupation, the coefficient of MinW is neither statistically nor economically significant when using Health. Given these robustness issues we explore potential differences across education groups in the estimations that follow. Hence, we study heterogeneous effects of the model on two different groups: i) low skilled workers, which includes individuals with less than completed secondary; and iii) high skilled workers, which includes workers with completed secondary or more, as described in section 2.5. The estimates in Table 3 suggest (in general) significant differences of MinW and NWC effects between low and high skilled workers, which could be interpreted as a gradual segmentation of the labor force. First, higher MinW and NWC imply higher informality for those within the low skill group regardless of the definition of informality. These results could be linked to the concept of Exclusion (as in Perry et. al., 2007): higher MinW and NWC negatively affect the supply of formal jobs for low skilled individuals, leaving them with the choice of informal paid jobs or involuntary self-employment.20 Since the vast majority of informality is captured within this group, we consider these results the most relevant in regards to the effects of labor market rigidities on the size of the informal sector.
20 This is consistent with the findings of Ardagna and Lusardi (2010), and Mondragón-Velez and Peña (2010).
Firm Size Health Sample Mean
MinWage 0.116*** 0.001 0.866(0.044) (0.063)
NWC 0.836*** 0.472*** 0.615(0.058) (0.069)
HH Income pc -0.002 -0.067*** 0.305(0.004) (0.017)
Pseudo R-squared 0.26 0.19
Full set of controls included (including any fixed effects)Robust standard errors in parentheses 459,105*** p < 1%, ** p < 5%, * p < 10%
Informality Sector Definition
# Observations:
16
Table 3 – PANEL A: Estimated Effects on the Size of the Informal Sector with Heterogeneous Effects by Skill Groups
PANEL B: Estimated Effects for High Skilled Workers
Firm Size Health Sample Mean
MinWage /Median Wage 0.257*** 0.175*** 0.866
(0.043) (0.049)
MinWage /Median Wage X High Education -0.268*** -0.352*** 0.411
(0.030) (0.040)
NWC 0.796*** 0.178*** 0.411(0.062) (0.050)
NWC X High Education 0.065 0.587*** 0.288(0.066) (0.083)
HH Income pc 0.009 -0.202*** 0.615(0.009) (0.036)
HH Income pc X High Education -0.014 0.176*** 0.207
(0.009) (0.036)
Pseudo R-squared 0.26 0.19
Full set of controls included (including any fixed effects)Robust standard errors in parentheses # Observations: 459,105*** p < 1%, ** p < 5%, * p < 10%
Informality Sector Definition
Coeff Chi2(1) Prob>Chi2 Coeff Chi2(1) Prob>Chi2MinWage /Median Wage -0.011 0.05 0.8195 -0.177** 5.68 0.0172
NWC 0.861*** 170.43 0 0.765*** 59.62 0
HH Income pc -0.005 1.07 0.3004 -0.026*** 6.83 0.009
Firm Size Health

17
To enable an easier interpretation of the results, we include an additional panel in the results table with the net effect for the high skill group, and the significance level.21 Clearly, the effects of MinW and NWC on high skilled workers are different from those for low skilled workers. Increases in MinW seem to decrease the probability of being informal for high skilled workers. However, the effect is weakly significant under Health and not significant under Firm Size and Occupation. Therefore, given that the Colombian MinW is high and binding as discussed in section 3, rises in real terms turn out to be a regressive policy in terms on the size of the informal sector: it seems to protect high skilled workers and pushes low skilled ones to informality (and/or unemployment).
Rises in NWC, on the other hand, increase the probability of being informal for both low and high skilled workers. When informality is measured by Firm Size and Occupation, NWC equally affect low and high skilled workers since the interaction coefficient between NWC and high skilled is not significant. When we use Health, we see that NWC affect the probability of being informal for high skilled individuals more than for low skilled ones. Further research is needed to explain this phenomenon. Finally, when using the Health definition the effect of the business cycle is countercyclical for all workers, but the effect is stronger on low skilled workers. When the economy is contracting, low education workers are more likely to be informal which suggests exclusion. Overall, the results described above suggest a strong link of informal low skilled workers with Exclusion motives.
5. Transitions between the Informal and Formal Sectors
5.1 Measuring the Flows: Transition Matrices
In this section we study the flows of agents within the labor force between the formal and informal sectors. First, we use transition matrices for each of the available cross-sections during the period 1986 to 2006. Then, we characterize each of the flows involving entry into or exit from the informal sector by estimating transition probabilities as functions of demographics, occupation-specific and other idiosyncratic labor-history characteristics. Since our database is composed of repeated cross-sections, we build the transitions within 12-month periods using retrospective questions. We observe the sector to which a worker belongs at the time of the survey; consider only workers who switched jobs during the previous year; and only use the Firm Size and Occupation definition, as retrospective information on contributions to health insurance is not available.
21 The significance level was calculated using a Chi2 test; the standard errors were computed using the delta method.
18
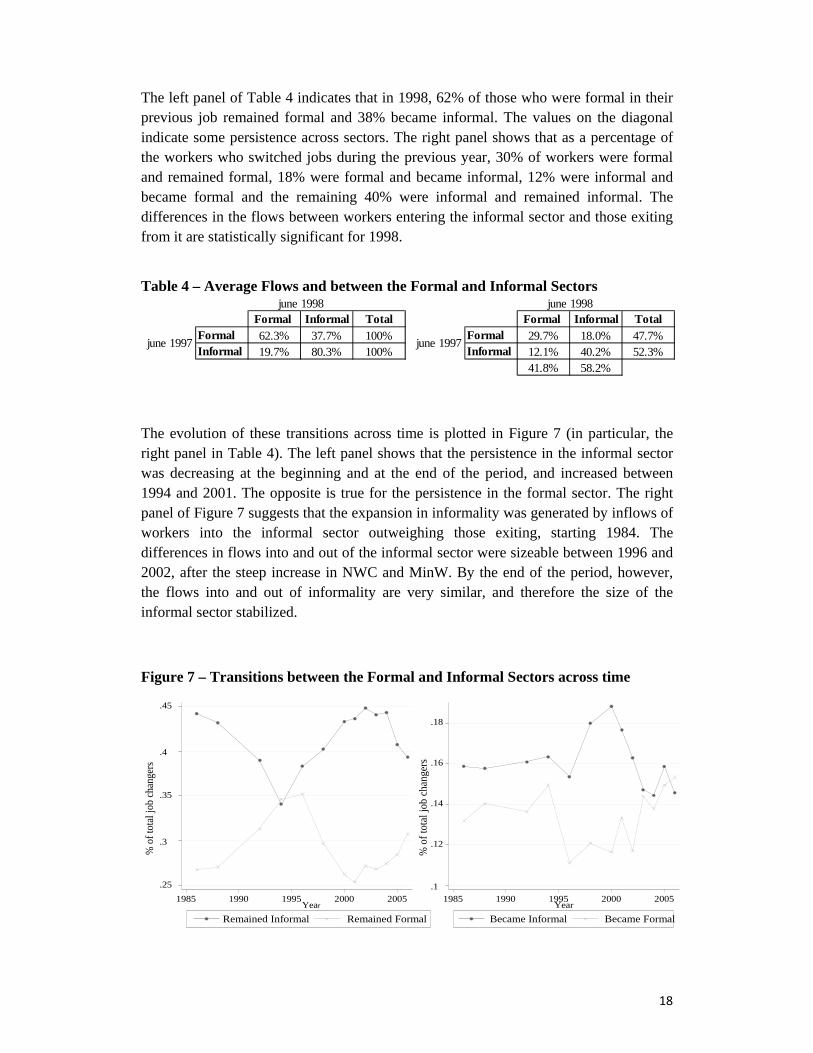
The left panel of Table 4 indicates that in 1998, 62% of those who were formal in their previous job remained formal and 38% became informal. The values on the diagonal indicate some persistence across sectors. The right panel shows that as a percentage of the workers who switched jobs during the previous year, 30% of workers were formal and remained formal, 18% were formal and became informal, 12% were informal and became formal and the remaining 40% were informal and remained informal. The differences in the flows between workers entering the informal sector and those exiting from it are statistically significant for 1998.
Table 4 – Average Flows and between the Formal and Informal Sectors
The evolution of these transitions across time is plotted in Figure 7 (in particular, the right panel in Table 4). The left panel shows that the persistence in the informal sector was decreasing at the beginning and at the end of the period, and increased between 1994 and 2001. The opposite is true for the persistence in the formal sector. The right panel of Figure 7 suggests that the expansion in informality was generated by inflows of workers into the informal sector outweighing those exiting, starting 1984. The differences in flows into and out of the informal sector were sizeable between 1996 and 2002, after the steep increase in NWC and MinW. By the end of the period, however, the flows into and out of informality are very similar, and therefore the size of the informal sector stabilized.
Figure 7 – Transitions between the Formal and Informal Sectors across time
Formal Informal Total Formal Informal TotalFormal 62.3% 37.7% 100% Formal 29.7% 18.0% 47.7%Informal 19.7% 80.3% 100% Informal 12.1% 40.2% 52.3%
41.8% 58.2%
june 1998
june 1997
june 1998
june 1997
.25
.3
.35
.4
.45
1985 1990 1995 2000 2005Year
Remained Informal Remained Formal
.1
.12
.14
.16
.18
1985 1990 1995 2000 2005Year
Became Informal Became Formal
% o
f tot
al jo
b ch
ange
rs
% o
f tot
al jo
b ch
ange
rs
19
5.2 The Effect of Labor Market Rigidities on the Probability of Switching Sectors
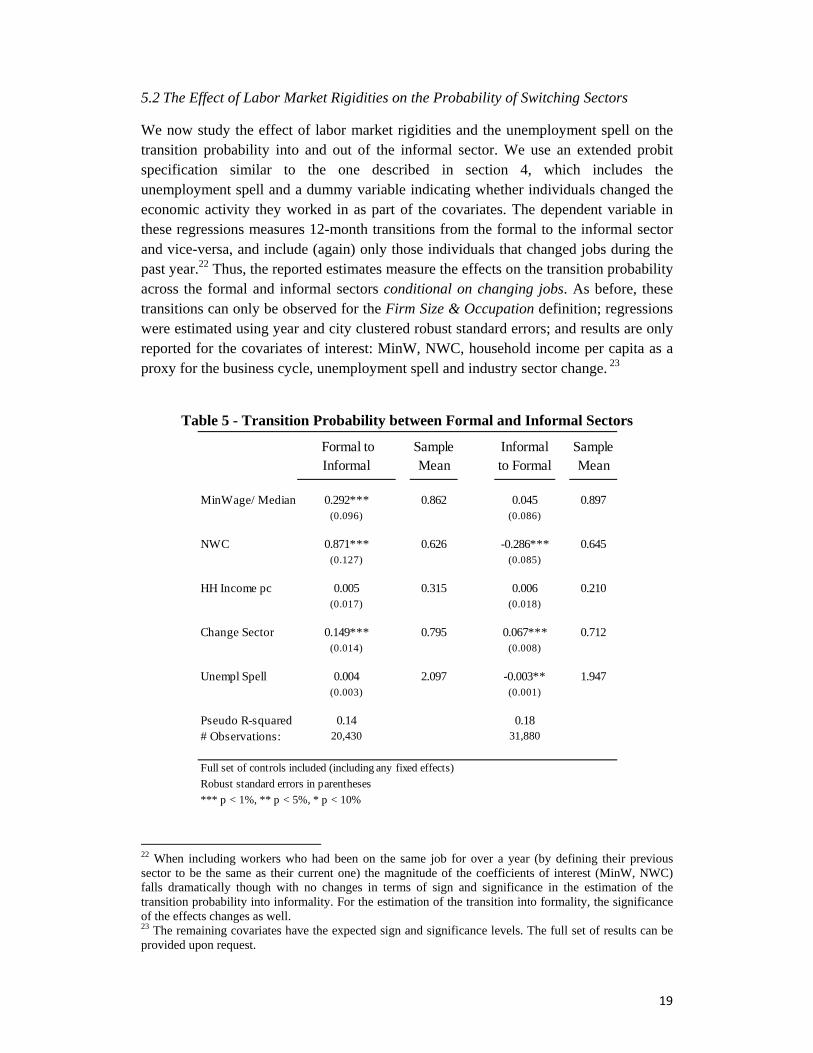
We now study the effect of labor market rigidities and the unemployment spell on the transition probability into and out of the informal sector. We use an extended probit specification similar to the one described in section 4, which includes the unemployment spell and a dummy variable indicating whether individuals changed the economic activity they worked in as part of the covariates. The dependent variable in these regressions measures 12-month transitions from the formal to the informal sector and vice-versa, and include (again) only those individuals that changed jobs during the past year.22 Thus, the reported estimates measure the effects on the transition probability across the formal and informal sectors conditional on changing jobs. As before, these transitions can only be observed for the Firm Size & Occupation definition; regressions were estimated using year and city clustered robust standard errors; and results are only reported for the covariates of interest: MinW, NWC, household income per capita as a proxy for the business cycle, unemployment spell and industry sector change. 23
Table 5 - Transition Probability between Formal and Informal Sectors
22 When including workers who had been on the same job for over a year (by defining their previous sector to be the same as their current one) the magnitude of the coefficients of interest (MinW, NWC) falls dramatically though with no changes in terms of sign and significance in the estimation of the transition probability into informality. For the estimation of the transition into formality, the significance of the effects changes as well. 23 The remaining covariates have the expected sign and significance levels. The full set of results can be provided upon request.
Formal to Informal
Sample Mean
Informal to Formal
Sample Mean
MinWage/ Median 0.292*** 0.862 0.045 0.897(0.096) (0.086)
NWC 0.871*** 0.626 -0.286*** 0.645(0.127) (0.085)
HH Income pc 0.005 0.315 0.006 0.210(0.017) (0.018)
Change Sector 0.149*** 0.795 0.067*** 0.712(0.014) (0.008)
Unempl Spell 0.004 2.097 -0.003** 1.947(0.003) (0.001)
Pseudo R-squared 0.14 0.18# Observations: 20,430 31,880
Full set of controls included (including any fixed effects)Robust standard errors in parentheses*** p < 1%, ** p < 5%, * p < 10%

20
The first column of Table 5 shows the estimates for the transition probability into the informal sector. These results imply that labor market rigidities are important drivers of the transition into informality, consistent with the findings of section 4 on the size of the informal sector. A rise of 10pp in NWC increases the probability of transiting into informality (given that the worker switched jobs) by 8.7pp, whereas a 20pp increase in the min-median ratio does so by 6pp. Unemployment spell effects have the expected sign, though they are not significant.24
In regards to the transition into formality (third column of Table 5) the effects of NWC, unemployment spell and the business cycle have the expected signs (though with small economic significance for the last two). The probability of transition into formality decreases with higher NWC or unemployment spell, as expected. Again, the positive correlation of the transition into formality with changes in the economic activity arises from the nature of informal activities and the Exclusion motives associated with them. On the other hand, even though increases in MinW increase the probability of transiting into informality, the reverse is not true: MinW effects appear insignificant (economically and statistically) in the transition into the formal sector. In order to explore behavioral differences and try to find suitable explanations to the asymmetric effect of MinW on the transition probabilities we explore, as before, the robustness of these results across different education groups. On the other hand, changes in economic activity are positively correlated with both the transition into informality, and with the transition into formality. The first suggests that this decision is not necessarily related to a career path, and in line with Exclusion motives.
The first column of Table 6 shows that the effects on the transition into the informal sector for the total sample are mainly driven by the low skill group. The strongly positive and significant effects of MinW and NWC on the probability of transition into informality are fully consistent with those observed on the size of the informal sector for this particular group. This constitutes additional support to the idea of strong Exclusion motives as MinW and NWC effects work mainly through quantity adjustments in the demand for low skill labor. Again, to better interpret the results in Table 6 we include Panel B with the net effects for the high skill group.25 For high skilled workers, the effect of increases in MinW (that is, the sum of the low skill plus the interaction coefficients) is not statistically significant. This implies that increases in MinW don´t affect the probability of transiting from the formal to the informal sector for this group. This result is in line with the findings from section 4. Higher NWC increase the transition from the formal to the informal sector for all workers, but especially so for high skilled ones.
24 It is expected for the probability of transition into informality to: i) increase with higher NWC or MinW as firms decrease the supply of formal jobs in response to larger hiring costs; ii) decrease with the business cycle as the supply of formal job opportunities is pro-cyclical; and iii) increase with the unemployment spell as the odds of getting a job in the formal sector are hurt by a long unemployment spell. 25 Again, the significance level was calculated using a Chi2 test; the standard errors were computed using the delta method.

21
Table 6 – PANEL A: Transition Probability between Sectors, by Skill Levels
PANEL B: Estimated Effects for High Skilled Workers
Formal to Informal
Sample Mean
Informal to Formal
Sample Mean
MinWage/ Median Wage 0.470*** 0.862 0.052 0.897(0.074) (0.098)
MinWage /Median Wage X High Education -0.327*** 0.513 -0.021 0.278
(0.079) (0.068)
NWC 0.567*** 0.626 -0.393*** 0.645(0.135) (0.106)
NWC X High Education 0.557*** 0.368 0.306** 0.201(0.190) (0.154)
HH Income pc 0.017 0.315 -0.013 0.210(0.058) (0.018)
HH Income pc X High Education -0.010 0.251 0.042 0.083
(0.056) (0.027)
Change Sector 0.153*** 0.795 0.065*** 0.712(0.017) (0.010)
Change Sector X High Education -0.009 0.455 0.005 0.225
(0.030) (0.018)
Unempl Spell 0.009*** 2.097 -0.004* 1.947(0.003) (0.002)
Unempl Spell X High Education -0.009*** 1.170 0.002 0.610
(0.003) (0.003)
Pseudo R-squared 0.14 0.18# Observations: 20,430 31,880
Full set of controls included (including any fixed effects)Robust standard errors in parentheses*** p < 1%, ** p < 5%, * p < 10%
Coeff Chi2(1) Prob>Chi2 Coeff Chi2(1) Prob>Chi2MinWage /Median Wage 0.143 1.65 0.1989 0.031 0.16 0.6928
NWC 1.124*** 46.29 0 -0.087 0.47 0.4939
HH Income pc 0.007 0.15 0.7042 0.029 1.39 0.2389
Change Sector 0.144*** 47.04 0 0.06*** 31.89 0
Unempl Spell 0 0.01 0.93 -0.002 1.11 0.2915
Firm Size Health

22
Regarding the transition from the informal to the formal sector, increases in MinW are not statistically significant for any group. However, lower NWC imply a higher transition into formality for the low skilled group as expected, linked again to the idea of quantity adjustments via the demand for labor. The total effect for high skilled individuals (that is, the sum of the low skill plus the interaction coefficients) is not statistically significant. Consistent with our findings in section 4, these estimations strongly support the Exclusion motive for the low skilled group. When looking at heterogeneous effects, changes in economic activity are again positively correlated both with the transition into informality, and with the transition into formality.
6. Conclusion
Informal workers are vulnerable, frequently uncovered by social security, have relatively low education and on average earn lower wages. The secular increase in the size of the informal sector in Colombia is highly correlated with increasing labor market rigidities, namely the minimum wage and non-wage costs. The combination of increased rigidities has made the formal sector less able to adjust to economic cycles. Informal workers are affected by these rigidities not only because the minimum wage stopped being binding in the informal sector, but also due to the high percentage of informal workers that is paid below the minimum.
The coexistence of high non-wage costs and minimum wage implies that the formal sector adjusts to the economic cycle through quantities - cutting back on (mostly, low skilled) jobs, generating lower wages within the informal sector. Rigidities have also consequences on the relative sizes of the formal and informal sector, which have ultimately triggered the documented increase in the latter. All in all our results suggest that labor market rigidities affect low skilled workers the most. Further research is needed to understand the channels through which labor market rigidities affect the transition into the formal sector and in particular, the motivations of such transitions for informal workers with high educational attainment.
In terms of policy design this paper provides useful evidence in regards to the costs that labor market rigidities imply for (vulnerable) workers, implemented in the first place to protect them. However, in regards to policy recommendations the glass is half full, as an analysis of the benefits these instruments provide is required to put the associated costs in perspective. Along these lines, future research could provide a comprehensive approach to face the complex social and economic challenge informality represents across the developing world.

23
References
Albrecht, J., L. Navarro and S. Vroman (2009) “The Effects of Labor Market Policies in an Economy with an Informal Sector” Economic Journal, July.
Bernal, R. (forthcoming) “The Informal Labor Market in Colombia: Identification and Characterization” Desarrollo y Sociedad.
Bernal, R., A. Camacho, C. Flórez, A. Gaviria, C. Jaramillo, O. Nupia, X. Peña, C. Rodríguez, F. Sánchez, M. Urrutia (2009) “Desarrollo económico: retos y políticas públicas” Documento CEDE 01, Enero.
Card, David and Alan B. Krueger (1995) Myth and Measurement: the New Economics of the Minimum Wage. Princeton University Press.
Cárdenas, Mauricio and Raquel Bernal (2003) “Determinants of Labor Demand in Colombia: 1976-1996” NBER Working Papers 10077, National Bureau of Economic Research.
Cunningham, W. (2007) Minimum Wages and Social Policy. “Lessons from Developing Countries” Directions in Development, human Development, World Bank, Washington, D.C.
Cunningham, W.V. and Maloney, W.F. (2001), “Heterogeneity among Mexico’s microenterprises: an application of factor and cluster analysis”, Economic Development and Cultural Change, 50(1): 131-156.
Gruber, J. (1997) “The Incidence of Payroll Taxation: Evidence for Chile” Journal of Labor Economics, Vol. 15, No. 3, Part 2: Labor Market Flexibility in Developing Countries (Jul., 1997), pp. S72-S101
Henley, A, G. Arabsheibani and F. Carneiro (2006) “On Defining and measuring the Informal Sector” IZA DP No. 2473, November.
Kristensen, N. and W. Cunningham (2006) “Do Minimum Wages in Latin America and the Caribbean Matter: Evidence from 19 countries”. Policy Research Working Paper 3870, World Bank, Washington, D.C.
Kugler, A. and M. Kugler (2009) "The Labor Market Effects of Payroll Taxes in a middle Income country: Evidence from Colombia" Economic Development and Cultural Change, January.
Fortin, B., N. Marceau and L. Savard (1997) “Taxation, wage controls and the informal sector” Journal of Public Economics Volume 66, Issue 2, 1 November 1997, Pages 293-312
Flórez, C. E., “The Function of the Urban Informal Sector in Employment: Evidence from Colombia 1984-2000”. CEDE Working Paper No. 2002-04.
24
Núñez, J. “Empleo informal y evasión fiscal en Colombia”. (2002) Archivos de Economía, 210, DNP.
Maloney, W.F. and J. Núñez (2004) “Measuring the Impact of Minimum wages: Evidence from Latin America” in Law and Employment: Lessons from Latin America and the Caribbean, ed. James Heckman and Carmen Pagés, 109-130. University of Chicago Press and National Bureau of Economic Research.
Mondragón-Vélez, C. and X. Peña (2010) "Business Ownership and Self-Employment in Developing Economies: The Colombian Case," in International Differences in Entrepreneurship, edited by Josh Lerner and Antoinette Schoar, University of Chicago Press .
Perry, G., W. Maloney, O. Arias, P. Fajnzylber, A. Mason, and J. Saavedra-Chanduvi (2007). “Informality: Exit and Exclusion”. The World Bank, Washington D.C.
Santa María, M., F. García and A. V. Mujica (2009) “El mercado laboral y la reforma de la salud en Colombia: Incentivos, preferencias y algunas paradojas”. Mimeo Fedesarrollo.

25
Appendix A - Misclassified workers across Alternative Informality Definitions
Appendix B – Sample Size and Distribution across the Formal and Informal Sectors, Informality Definitions and Education Groups
Firm Size and Occup. HealthVARIABLES not Health not Firm Size and Occup.
Complete primary 0.253*** -0.087***(0.011) (0.013)
Complete secondary+ 0.427*** -0.195***(0.012) (0.015)
Complete tertiary+ 0.147*** 0.133***(0.019) (0.021)
Private wage earner -0.340* 4.968***(0.201) (0.086)
Public wage earner Perfect predictor 4.124***(0.090)
Household worker 0.269 Perfect predictor(0.201)
Self eployed -0.421** 4.622***(0.201) (0.086)
Business owner 0.190 4.444***(0.201) (0.090)
Other Occupation -0.616*** 5.159(0.219) (0.000)
Age 0.010*** -0.011***(0.000) (0.000)
Log(wage) 0.081*** 0.036***(0.005) (0.007)
Constant -1.933*** -6.111***(0.202) (0.097)
Observations 417118 431171
Omitted categories are <Primary and Unpaid Family Aid
Characteristics of Misclassified WorkersInformal under:
Standard errors in parentheses*** p<0.01, ** p<0.05, * p<0.1
Low Education High Education Total (entire distribution)Formal 71,922 135,222 207,144
Informal 170,130 81,831 251,961Formal 90,723 154,443 245,165
Informal 151,329 62,611 213,940242,052 217,053 459,105Total
Education Level
Firm Size & Occu.
Health
26
Appendix C – Non Wage Cost by Income Level and Year
Low Education High Education Total (entire distribution)Formal 34.7% 65.3% 100.0%
Informal 67.5% 32.5% 100.0%Formal 37.0% 63.0% 100.0%
Informal 70.7% 29.3% 100.0%52.7% 47.3% 100.0%Total
Health
% share by row
Firm Size & Occu.
Low Education High Education Total (entire distribution)Formal 29.7% 62.3% 45.1%
Informal 70.3% 37.7% 54.9%Formal 37.5% 71.2% 53.4%
Informal 62.5% 28.8% 46.6%100.0% 100.0% 100.0%Total
% share by subsample
Firm Size & Occu.
Health
1-2 Minimum Wages
1-2 MinW + Tranport
Subsidy
2-4 Minimum Wages
4-16 Minimum Wages
16-17 Minimum Wages
17-18 Minimum Wages
18-19 Minimum Wages
19-20 Minimum Wages
>20 Minimum Wages
1984 45,5 55,25 45,5 45,5 45,5 45,5 45,5 45,5 45,51986 47,5 57,31 47,5 47,5 47,5 47,5 47,5 47,5 47,51988 47,5 57,06 47,5 47,5 47,5 47,5 47,5 47,5 47,51992 44,3 53,55 44,3 44,3 44,3 44,3 44,3 44,3 44,31994 50,3 59,12 50,3 51,3 51,3 51,3 51,3 51,3 43.3*wage+8*(20MinW/wage)1996 56,3 65,85 56,3 57,3 57,3 57,3 57,3 57,3 45.3*wage+12*(20MinW/wage)1998 56,3 66,46 56,3 57,3 57,3 57,3 57,3 57,3 45.3*wage+12*(20MinW/wage)2000 56,3 66,45 56,3 57,3 57,3 57,3 57,3 57,3 45.3*wage+12*(20MinW/wage)2001 56,3 66,79 56,3 57,3 57,3 57,3 57,3 57,3 45.3*wage+12*(20MinW/wage)2002 56,3 67,30 56,3 57,3 57,3 57,3 57,3 57,3 45.3*wage+12*(20MinW/wage)2003 55,3 66,60 55,3 56,3 56,3 56,3 56,3 56,3 44.3*wage+12*(20MinW/wage)2004 56,3 67,92 56,3 57,3 57,5 57,7 57,9 58,1 46.3*wage+12*(20MinW/wage)2005 56,8 68,46 56,8 57,8 58 58,2 58,4 58,6 46.8*wage+12*(20MinW/wage)2006 57,3 68,99 57,3 58,3 58,5 58,7 58,9 59,1 47.3*wage+12*(20MinW/wage)
27
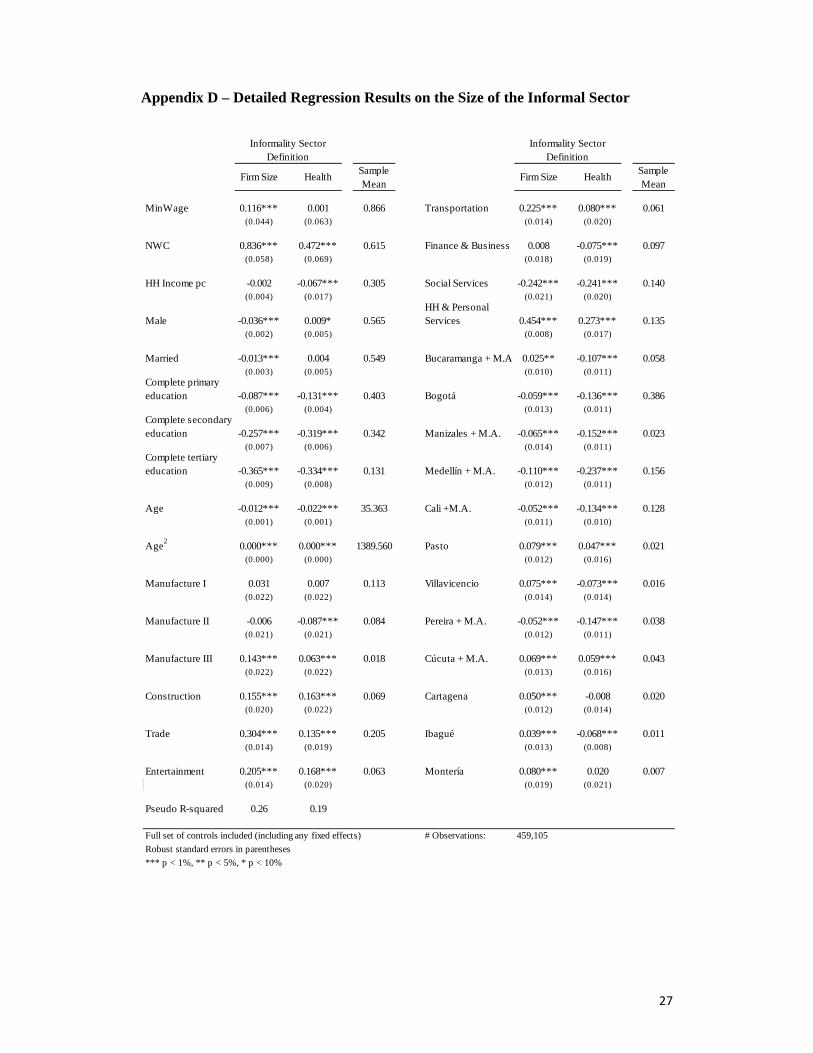
Appendix D – Detailed Regression Results on the Size of the Informal Sector
Firm Size Health Sample Mean
Firm Size Health Sample Mean
MinWage 0.116*** 0.001 0.866 Transportation 0.225*** 0.080*** 0.061(0.044) (0.063) (0.014) (0.020)
NWC 0.836*** 0.472*** 0.615 Finance & Business 0.008 -0.075*** 0.097(0.058) (0.069) (0.018) (0.019)
HH Income pc -0.002 -0.067*** 0.305 Social Services -0.242*** -0.241*** 0.140(0.004) (0.017) (0.021) (0.020)
Male -0.036*** 0.009* 0.565HH & Personal Services 0.454*** 0.273*** 0.135
(0.002) (0.005) (0.008) (0.017)
Married -0.013*** 0.004 0.549 Bucaramanga + M.A 0.025** -0.107*** 0.058(0.003) (0.005) (0.010) (0.011)
Complete primary education -0.087*** -0.131*** 0.403 Bogotá -0.059*** -0.136*** 0.386
(0.006) (0.004) (0.013) (0.011)Complete secondary education -0.257*** -0.319*** 0.342 Manizales + M.A. -0.065*** -0.152*** 0.023
(0.007) (0.006) (0.014) (0.011)Complete tertiary education -0.365*** -0.334*** 0.131 Medellín + M.A. -0.110*** -0.237*** 0.156
(0.009) (0.008) (0.012) (0.011)
Age -0.012*** -0.022*** 35.363 Cali +M.A. -0.052*** -0.134*** 0.128(0.001) (0.001) (0.011) (0.010)
Age2 0.000*** 0.000*** 1389.560 Pasto 0.079*** 0.047*** 0.021(0.000) (0.000) (0.012) (0.016)
Manufacture I 0.031 0.007 0.113 Villavicencio 0.075*** -0.073*** 0.016(0.022) (0.022) (0.014) (0.014)
Manufacture II -0.006 -0.087*** 0.084 Pereira + M.A. -0.052*** -0.147*** 0.038(0.021) (0.021) (0.012) (0.011)
Manufacture III 0.143*** 0.063*** 0.018 Cúcuta + M.A. 0.069*** 0.059*** 0.043(0.022) (0.022) (0.013) (0.016)
Construction 0.155*** 0.163*** 0.069 Cartagena 0.050*** -0.008 0.020(0.020) (0.022) (0.012) (0.014)
Trade 0.304*** 0.135*** 0.205 Ibagué 0.039*** -0.068*** 0.011(0.014) (0.019) (0.013) (0.008)
Entertainment 0.205*** 0.168*** 0.063 Montería 0.080*** 0.020 0.007(0.014) (0.020) (0.019) (0.021)
Pseudo R-squared 0.26 0.19
Full set of controls included (including any fixed effects) # Observations: 459,105Robust standard errors in parentheses*** p < 1%, ** p < 5%, * p < 10%
Informality Sector Definition
Informality Sector Definition