labor market flexibility, unions, and collective
TRANSCRIPT

Labor Market Flexibility, Unions, and Collective Bargaining: An Empirical Application
in the Turkish Labor Market*
Ipek Ilkkaracan Ajas
Assistant Professor of Economics Istanbul Technical University, Faculty of Management,
Macka, Istanbul 34367, Turkey. [email protected]
Paper presented at the 9th Conference of the Research Network Alternative Macroeconomic Policies (Germany) in cooperation with the Post Keynesian Economic Study group (UK) and the ASssociation pour le Developpement
des Etudes Keynesiennes (France)
MACROECONOMICS AND MACROECONOMIC POLICIES – ALTERNATIVES TO THE ORTHODOXY
28-29 October 2005, BERLIN
* This paper is based on a research project entitled “The Institutional Characteristics of the Labor Market and Unemployment” in collaboration with the State Institute of Statistics, and supported by the Turkish Businessmen’s Association (TUSIAD).
ABSTRACT This paper presents a critique of the common orthodox view that labor market institutions such as labor unions and collective bargaining practices undermine wage flexibility. The study uses firm-level panel data from the manufacturing industry for the period 1996-2001 to explore the extent of wage flexibility in the Turkish labor market. The effects of unionization and collective bargaining in wage determination are explored within the context of a wage-bargaining model. The findings indicate that the labor market in Turkey is characterized by a considerable degree of flexibility as shown by the negative correlation between wages and the rate of unemployment. While unionization seems to exert an upward pressure on wages; collective bargaining seems to apply a negative pressure. This finding is interpreted as pointing to the double role of collective bargaining practices in the wage determination process depending on the economic conjecture. Collective bargaining has the potential to act as a mechanism of wage restraint in times of economic contraction and crisis (the years of 1996-2001 in Turkey), as labor unions become willing to compromise wages in return for stability of employment. On the other hand, in times of economic expansion, collective bargaining enables the acquisition of a larger share of value-added by enhancing the bargaining power of workers. Finally, when the analysis is repeated at a two-digit manufacturing sub-industry basis, the extent of wage flexibility as interpreted through the unemployment elasticity of pay seems to exist in all sub sectors of the manufacturing industry, yet its degree varies substantially depending on the level of unionization and collective bargaining in the sub sector. JEL classification: J31; J41; J51; J52; E24 Key Words: wage flexibility; collective bargaining; wage bargaining; Turkey
1

I. Introduction Whether the labor market entails an adequate degree of wage flexibility has been one of the on-going debates between the employer organizations and the organized workforce in Turkey. The employer organizations argue that the processes that play into the determination of labor costs is far too rigid. This rigidity, they argue, becomes threatening to the sustainability of the workplace particularly in times of economic crises. The labor unions, on the other hand, defend that the wage determination process entails substantial flexibility to the extent that the bottlenecks of profitability in times of economic contraction is usually overcome at the expense of the declining share of labor. Wage employment makes up approximately 50% of total employment in Turkey; and as much as 75% of non-agricultural employment. Agricultural employment accounts for as much as 34% of total employment as of 2003 and 50% of those employed in agriculture work in the status of unpaid family workers. Of the total non-agricultural wage and salary workers approximately one third is employed in manufacturing while as much as 60% is employed in the service sector, where most of public sector employment is concentrated. Recent household labor force survey based results indicate that a substantial 27% of total employment is located in the so-called “informal sector.” Of the total non-agricultural wage and salary workers 20% are identified as located in the informal sector. Examining data of the 1990-2003 period, a time of increasing market liberalization in Turkey, it is also seen that the share of informal sector in non-agricultural employment has been on a steadily increasing trend from 25% in 1990 to 32% in 2003. (TUSİAD, 2004) The existence of a sizeable agricultural sector with dominance of subsistence workers; combined with the existence of such a substantial size and ever growing informal sector in non-agricultural employment would lead to the expectations of a rather flexible wage structure. Indeed the time series data on private sector wages constitutes a highly volatile series. As Figure 1 indicates, in the post-1980 period marking the start of economic and financial liberalization, wages demonstrate a volatile up and down trend depending upon the changes in the macroeconomic conjecture as well as the political developments and their reflections of labor market institutions. The tight political environment of the military cue in the early 1980s, all labor union activity has been suspended, while the switch from an import-substitutionist to an export-oriented policy has emphasized the importance of global competitiveness. This resulted in a sharp decline of real wages. Towards the end of 1980s, with the further grounding of the multi-party democratic system, all labor union activity was liberalized. Combined with high and steady economic growth rates in this period, real wages have more than recovered the losses incurred earlier in the decade. As a specific development of this period, it can also be said that the strong and populist increases in public sector wages has also affected the dynamics in the private sector leading to parallel sharp increases in wage demands in this sector.
2

Figure 1
real annual wage payments per workerprivate manufacturing industry 10+
1987-2001
1987 19881989
1990
19911992 1993
1994 1995 1996 1997 1998 1999 20002001
0
2
4
year
in m
illio
ns
TL
(198
7=10
0) The 1990s mark the start of consistent macroeconomic instability characterized by frequent economic crises and devaluations of the domestic currency. The period of economic contraction and crisis first struck with the 1994 crisis, has lead to a reversal of this trend. The bottlenecks of profitability in the private sector combined with the ever increasing budget deficits in the public sectors, has lead once again to falling real wages. This general trend has become more obvious with the subsequent economic crises observed in 1998, and more severely in 2001 (Bulutay, 1999; TUSIAD, 2002). The unemployment data shown in Figure 1 starting from 1990 onwards indicates the macro effects of these frequent crises on the labor market. The labor market flexibility – rigidity debate is actually centered around the non-agricultural formal sector employment and in particular in those sub-sectors which have relatively strong labor union presence and institutionalized collective bargaining practices. Figure 2 shows the allocation of labor unions and collective bargaining covereage by subsectors of the manufacturing and service industries. Figure 2
nonagricultural unemployment 1988-2004
19881989 19911992199319941995
1996199719981999
2000
20012002 2003
20041990
5
10
15
20
This paper aims to explore the question of whether wage flexibility exists in the labor market in Turkey; and to what extent institutional mechanisms such as labor unions and collective
3

bargaining practices play a role in wage determination. In particular, the paper is interested in exploring the role of institutional mechanisms and their effects on wage flexibility in view of changing macroeconomic conditions. We use private sector manufacturing industry data for the 1994-2001 period to look at the responsiveness of wages to market conditions such as unemployment and profitability; and the effects of unionization and collective bargain coverage rates on the degree of wage flexibility. The analysis is conducted for the manufacturing industry as a whole, as well as for the two-digit sub-sectors in order to explore whether there is substantial variation in wage flexibility and the role of institutional mechanisms therein depending on the sector. II. Theoretical Framework In the wage bargain models, wages are determined through a bargaining process between union-member workers and price-setting firms over their respective shares of the output. In their version of the union bargain model, Carlin and Soskice (1990) formalize the wage setting process as a Nash bargain, and derive the functional form of the wage-unemployment relationship as follows:
wb = b + (β/U)(π/E)
Here the four determinants of the bargained real wage wb are: • unemployment benefits b which set a lower limit to wages such that w has to be greater
than b in order to induce workers to perform wage labor; • the unemployment rate U which inserts a negative pressure on wages; • workers' bargaining power β, which is some composite measure of the extent of the level
of worker organization, positively correlated to w; and • profitability per employee π/E which is also positively correlated to w and can be
interpreted as some sort of upper limit to the wage rate as will be explained below. The equilibrium wage w is defined as that wage rate where the competing claims of the unions for a bargained real wage (wB) and of the firms for a price-determined real wage (wP) are consistent. Price-determined real wage wP, which is determined by mark-up over cost and labor productivity, represents firms' claim for profits; it shows what is left for real wages once firms in the aggregate have taken their profits, and it does not vary with the level of employment. If the claims to real profits add up to more than is available in output per head, workers will use their union power to secure higher money wages and firms will put up their prices resulting in inflation. The model suggests that the rate of unemployment at the equilibrium wage set at wB = wP, is the non-accelerating inflation rate of unemployment (NAIRU). In another version of imperfect competition models of wage setting, called efficiency wage models, employers are foreseen as strategically setting wages above the market-clearing level despite the absence of union participation in wage setting. The wage set by the employer has been called the "efficiency wage" to indicate the advantages of the higher wage from the firm's perspective for inducing improved productivity and reducing unit costs. Firms choose to pay higher wages to deter workers from shirking and to increase productivity, given the technical difficulties and costs of monitoring. Here the emphasis is on the ability of workers to vary the amount of effort they put into a day's work. Consequently purchasing labor as cheaply as possible is not necessarily in the best interest of the firm to the extent that it is unable to monitor the workers' effort levels. Workers' tendency to shirk, and hence the efficiency wage is a
4

decreasing function of the rate of unemployment, because the risk of being caught shirking and dismissed, carries a higher cost in times of higher unemployment. In an early formal treatment by Shapiro and Stiglitz (1984), the functional form of the unemployment-wage relationship that emerges from the efficiency wage models is formulated as follows:
weff = b + e/(σU)
Here the determinants of weff, the minimum wage consistent with the discouragement of shirking are:
• unemployment benefits b, a wage minimum similar to the wage bargain model above; • work effort e such that e = 0 is the full shirking condition, and e = 1 is the no shirking
condition; • σ, a measure of the strength of the monitoring mechanism, it stands for the probability of
being caught when shirking; • the rate of unemployment U, again negatively correlated to the wage rate.
As monitoring becomes less costly and more effective (as σ→1) or as unemployment goes up (as U → 1), the efficiency wage weff needed to discourage shirking decreases. Note that the notion of "firm's ability to pay" as measured by profitability per employee in the wage bargain model above, does not appear here. Hence the efficiency wage model foresees a lower limit to the wage rate as set by b, but there is no mention of an upper limit. Wage bargain models are deemed more appropriate for the European labor markets where unions constitute the institutional mechanism in the wage setting process, while the efficiency-wage models attempt to account for the rigidity of above-market-clearing wage rates in labor markets where unions do not play a dominant role, such as the U.S. Insider-outsider models, on the other hand, emphasizes that it is costly for employers to fire the already employed workers, and hire new ones. This is due to the legal and administrative costs involved in hiring and firing as well as the costs of retraining new workers. The “insiders” aware of these costs have an edge in the wage bargain which they use to keep their wages high. The higher such insider costs are, depending on the firm, industry and specific job description, the higher will be the wage level (Snower, 2001). In labor markets with low unemployment the probability of replacing an insider with an outsider is lower, hence wage demands of insiders will be higher. Rising profitability will similarly lead to higher wage demands of insiders. Finally, labor unions and collective bargaining practices are institutional mechanisms that make it harder for employers to replace insiders with outsiders. As can be seen from the above discussion, these alternative wage models entail an equilibrium wage concept where unemployment is an assumed phenomenon in the labor market, as distinct from the neoclassical model. Accordingly, wages remain at present levels even in the face of unemployment, because in many instances employers refrain from doing so in order to avoid low productivity and motivation of present workers, or the costs of replacing present workers with new ones.
5

III. Empirical Models and Applied Work Eventually all three theoretical models used in the literature have overlapping empirical expectations. They predict a positive correlation between the wage rate and profitability; and a negative correlation between the wage rate and unemployment. Profitability and unemployment are primary indicators of market conditions; and the presence of such correlations between the wage rate and these variables are taken to be indicative of labor market flexibility. Unions and collective bargaining practices, on the other hand, are institutional mechanisms that regulate how and to what extent wages will respond to these market conditions. Moreover, it is expected that factors such as the industry, occupation, firm characteristics, and the like will also be effective in wage determination as they are institutional characteristics that determine to what extent “efficiency wage” or “insider-outsider” type of considerations are in place. In larger firms, for instance, monitoring worker effort becomes harder; hiring-firing processes are more costly; and as such efficiency wage or insider-outsider become factors more dominant in wage determination. Similarly for certain high skill occupations and industries, that require higher levels of training and work experience, monitoring of work effort is not a straightforward matter; hiring-firing costs are higher and as such we expect wages to be higher due to again efficiency wage and insider-outsider factors. As such empirically it becomes difficult to distinguish the different models of wage bargaining from one another. Most applied work confirms the presence of the above-suggested types of correlations in different labor markets around the world; negative correlation with unemployment; positive correlation with profit rates; variation of wages depending on industry, occupation and firm characteristics. (Blanchflower and Oswald, 1994; Johansen, et. Al., 2001) As above-mentioned type of correlations are identified in applied work, they are interpreted in the context of one model or another depending on the theoretical perspective of the researcher. Some applied work in recent years have tended to see these as complimentary rather than competing models of wage determination. (Carneiro, 1999; Strand, 2003; İlkkaracan, 2003). Here wage determination is described as a more comprehensive “rent-sharing” process where the value-added emerging from the production process is distributed between profits and wages. In this process of rent-sharing, efficiency wages, insider-outsider factors, or institutional mechanisms such as labor unions and collective bargaining, are all determinants of the distribution dynamics, or put another way, the wage bargain. IV. Data and Methodology The empirical work using Turkish manufacturing data aimed at identifying the degree to which factors such as unemployment, profitability, unionization, collective bargaining, and workplace characteristics – such as firm size or sub sector – play a role in wage determination in Turkey. Ideally, applied work should entail analysis of wage extensive time series data covering all sectors, and disaggregated at the level of the worker. Unfortunately, however, Turkey has limited data available which is provided by theTurkish State Institute of Statistics (SIS), the only institution which collects wage data in a systematic manner. This study makes use of the SIS data provided by the Annual Manufacturing Industry Survey. The unit of observation is workplace; the survey covers all workplaces in the manufacturing industry with 10 or more workers. As such while interpreting the findings, one needs to be
6

aware of the fact that workplaces with less 10 workers, hence predominantly informal sector workplaces, are not covered in the survey. Also as the data is manufacturing data, it leaves out important sectors of employment such as services. The Annual Manufacturing Industry Surveys provide the following data: average wage rate and related payments at the workplace; value-added per worker; number of workers disaggregated by sex; partial data on skill-education levels of the workforce; industry, private/public sector, and geographical location of the firm. The surveys, however, do not entail any information on unionization or collective bargaining coverage of the workplace. Hence data pertaining to the variable of labor unions was extracted from the Annual Labor Statistics of the Ministry for Labor. This data has been organized in the form of percent of union member workforce at the level of 2-digit industry. One difficulty encountered here was that the two-digit industry classification used by the Ministry for Labor does not overlap with the SIS classification used in the Annual Manufacturing Industry Survey. As such the two classifications were matched through a re-categorization process.† Collective bargaining data, on the other hand, is extracted from the Workplace Income Survey that has been conducted by SIS on an annual basis ever since 1996. This variable is again calculated on a two-digit industry basis, as percentage of workers in the industry covered by a collective bargaining agreement. Finally the unemployment rate used is from the Household Labor Force Surveys of SIS; and the price index is from SIS Price Statistics. The wage regression equation used is as follows: Ln(RW)it = α0 + α1VAit + α2VAit-1 + α3VAit-2 + α4ΔlnUt + α5FSit + α6UNIindt + α7CBindt + α8HSit + α9MSit + α10 FWit + Σ32
ind=11 αind IND + Σ44r=33 αr REG + εit
i = workplace; t = year; ind = industry; r = region RW = real wage VA = value added per worker ΔlnU = rate of change in urban unemployment (lnUt – lnUt-1 = ln(Ut/Ut-1) FS = firm size (number of workers) UNI = rate of unionization (% of union member workers in two-digit sub industry) CB = rate of collective bargaining (% of workers in two-digit sub industry covered by a collective bargaining agreement) HS = % of workers at the firm with high level qualifications MS = % of workers at the firm with medium level qualifications FW = % of female workers at the firm IND = sub industry location of the firm (21 dummy variables at two-digit level) REG = geographical location of the firm (11 dummy variables) The dependent variable is the average annual payments per worker at the workplace including net wage/salary payments, overtime, bonus/premium, social and in-kind support payments.
† Another problem with unionization data from the Labor Statistics of the Ministry of Labor is that they are generally overstated due to a number of technical erros used in their calculation; such as the omission of informal sector workers, etc.
7

The variable is calculated by dividing the total payments to workers at the workplace by the number of workers, and deflating by the consumer price index.‡
Value added per workers has been integrated into the analysis as a proxy for profitability. As construction of profits entail value of total output minus production costs including wage costs, use of profits per head as the dependent variable would have lead to the econometric problem of simultaneity bias. As such we preferred the use of value-added per worker.§ Considering that changes in current value added would show their effects on wages only with some time lag; and also considering that collective bargaining agreements in Turkey are conducted at two-year intervals, we have also used one- and two-year lagged values of this variable. The nominal values have been deflated by the consumer price index to convert them into real values. The rate of unemployment would have been used ideally at a regional level or at the level of the two-digit sub industry. Similar studies conducted in other countries, point out that wages are much more responsive to regional or industry unemployment rates rather than labor market wide unemployment (Blanchflower and Oswald, 1994; Boushey, 2002). However, given the unavailability of regional or industry unemployment rates, we used the country-wide annual urban unemployment rate.**
The form in which the unemployment variable will enter the regression analysis is another important empirical issue. The logarithmic form allows for the possibility of a nonlinear relationship. When this is in the “level” form, it implies a reaction of wages to the level of unemployment; however when it is the rate of change form, it implies that wages react to the direction and rate of change in unemployment. We have tried out these different forms of the unemployment variable in the wage regressions, and as the rate of change in unemployment has produced the most consistent results, we made a preference for this form. Firm size, i.e. the number of workers at the workplace, has been integrated into the analysis, as a factor that affects wages in the context of the above-explained “efficiency wage” considerations. The variable could also be found to be significant due to a number of other factors; namely as an indicator of the firm’s capital power and ability to pay, the possibility of union organizing at the workplace, or as an indicator of on-the-job training investment and insider-outsider costs. Union organizing and collective bargaining variables are unfortunately not at the level of the workplace but at the level of the sub industry of the firm. As mentioned above, the need for a matching process between the SIS and Labor Ministry sub industry classification schemes was another problem with the unionization variable. Nevertheless, considering the ‡ The deppendent variable could have been defined as hourly rather than annual payments. As such we would have covered the effects of changes in work hours on wage payments. However, due to some problşems with acquiring dependable data on work hours we could not include this variable in the analysis. § A number of studies on wage determination using the “rent-sharing” model such as Carneiro (1999), Estevao and Tevlin (2000), Johansen, et. al. (2001) use value-added per worker rather than profitability as an indicator of ability of workplace to pay. ** The use of the country-wide annual unemployment rate resulted in having merely six observations of unemployment for the period of analysis. As the dependent variable consisted of many more observations at a higher level of disaggregation, the regression analysis is prone to the so-called “Moulton aggregation bias”. Accordingly when an independent variable consisting of only a few observations is used in the analysis of a dependent variable with many more observations, the coefficient on the independent variable can carry an artificially low standard error. In order to control for such a bias, we have repeated the analysisi by aggregating the dependent variable at the three-digit subindustry basis; and the coefficient on unemployment was still found to be statistically significant.
8

significance of these institutional variables in wage determination, they have been integrated into the analysis despite such technical shortcomings. The percentage of high- or medium-level qualification workers, or the percentage of female workers, are variables that have been integrated into the regressions equation in order to neutralize the effects of a heterogeneous workforce on wage payments. The qualification variables are not perfect indicators but rather proxies since the Annual Manufacturing Industry Survey entails limited categories of job description from which the qualification categories have been derived. Finally, sub industry and regional dummies have been included in the wage regression in order to account for variations in wage payments due to region based infrastructural, cost-of-living, and institutional factors; as well as sub industry based supply, demand, productivity, and institutional factors. The hypotheses are as follows: α1, α2, α3 › 0; α4 ‹ 0; α5 › 0; α6 › 0; α7 › 0; α8, α9 › 0; α10 ‹ 0. We expect a positive correlation between the wage rate and value added per worker as an indicator of profitability; a negative correlation with the rate of change of the unemployment rate; a positive correlation with the number of workers as an indicator of firm size; a positive correlation with the institutional variables of unionization rate and collective bargain coverage rate in the sub-industry; a positive correlation with the ratio of high- and medium-skill workers at the firm; and finally a negative correlation with the ratio of female workers. It is not possible to make any a priori assumption regarding the regional and industry dummies. Only in the context of the above-described wage bargain models, we can expect more capital-intensive sectors using sophisticated production technologies and as such requiring higher qualified workforce to pay relatively higher wages due to a number of factors such as ability of the firm to pay; efficiency wages and insider-outsider type concerns. The analysis is conducted for the 1996-2001 time period. Annual manufacturing data is available from 1993 onwards. However, the data on collective bargain coverage by sub-industry is available only from 1996 onwards. Hence, the analysis period is started from 1996. The database constructed entails 65384 observations on private sector firms for a period of 6 years. The sample is balanced in terms of its distribution over time with approximately 10 to 11 thousand observations per year. V. Findings The findings of the wage regression for the manufacturing industry as a whole are provided in Table 1. All coefficients are statistically significant and carry the expected signs. The only exception is the collective bargain variable which carries a negative coefficient contrary to our hypothesis, which will be discussed below.
9

Table 1: Wage Regression Annual manufacturing Survey Data 1996-2001: Covers all firms with 10 or more workers; the analysis is restricted to the private sector only
VAit Value added per worker in the ith workplace in year t)
.00005
(.000002) VAit-1(one lag of VAi)
.000015 (.000002)
VAit-2(two lags of VAi)
.000005 (.000001)
∆lnU (lnUt - lnU1t) rate of change in the annual urban unemployment rate
-.1431 (.0073851)
FSit Number of workers in the ith firm in year t)
.00059 (.000016)
UNIindt (% of unionized workers in industry ind in year t)
.00552
(.00028) CBindt (% of workers covered by a collective labor bargain in industry ind in year t)
-.00279 (.00029)
Variables on qualification levels of the workers at the firm
Yes (3)
Industry dummies
Yes (21)
Regional dummies
Yes (11)
(Overall) R2 .2832 No. Of observations 65384
Notes: Dependent variable is ln(RW)it, avregare real wage per wprker at firm i in year t (including overtime, bonus/premium, compensation, social and in-kind payments) Standard errors are in parantheses. Coeffients with a minimum level of 5% statistical significance are shwon in bold. In order to account for heterogeneity of the workforce, three variables have been added including the ratio of high- and medium-qualified, and female workers in firm i in year t. In addition 21 industry and 11 regional dummies are used. The model has been estimated using the random effects method appropriate for the panel structure of the data and using Stata software.
10

The coefficient on value-added per worker indicates a positive correlation to the wage rate as expected. Since the dependent variable is in logarithmic form, multiplying the coefficient on value-added with its mean value would yield the value-added elasticity of wages. Doing this procedure for all time lags of the variable and summing them up, we find a long-term value-added elasticity of wages of 0.03. In other words, a doubling of value-added per worker would lead to an approximately 3% rise in wages, holding all other factors constant. Similar studies using labor market data from the U.S. find a profit elasticity of wages ranging between 0.02 to 0.05 (Blanchflower, 1996). While this might be thought of as being rather low, researchers point out that profitability is a highly volatile series such that it is common for three- to four-fold changes in short periods of time; which would lead to 8%-20% change in wages. Another study again using U.S. data, finds value added elasticity of wages that changes between 0.03 and 0.3 employing different methods of analysis (Estevao and Tevlin, 2000). Another cross section study on the Norwegian labor market estimates value added elasticity of wages at 0.05 (Johansen and Ringdall, 2001). The elasticity we find for Turkey is in a similar range. Findings point out to a statistically significant negative correlation between unemployment and wages. The coefficient of -0.1431 indicates that a 10% increase in the rate of change in unemployment will lead to a 1.4% fall in wages. The most dramatic change in unemployment in the period of analysis is in the year 2001 to the economic crisis at the time; while urban unemployment was on a falling trend from 1999 to 2000 (from 11.4% to 8.8%), it has increased back to %11.6 in 2001. This means a 70% increase in the rate of change of unemployment as it has been defined here. When multiplied with the unemployment elasticity, this is indicative of a 10% fall in the real wage purely due to the effects of unemployment, holding all other factors constant. In a similar study looking at the wage- unemployment relationship using 1994 cross section data for manufacturing industry in Turkey, Ilkkaracan and Selim (2003) estimate an unemployment elasticity of pay of approximately 0.01. Here the unemployment variable if formulated as the level. Hence a doubling of the unemployment rate is expected to lead to a 10% fall in wages. The coefficient on firm size is positive as expected. A one person increase in the number of workers is expected to raise wages by 0.06%. Accordingly, holding all other factors constant, there will be a 30% real wage differential between a 10-worker company and a 500-worker company. This can be interpreted for pointing out the need in large work places for higher efficiency wages in order to increase worker productivity given the difficulties in monitoring work effort. When we look at the institutional variables of unionization and collective bargain coverage, we see that the former has a positive effect on wages as expected while the latter has a negative effect contrary to our expectations. The coefficient on percentage of unionized workers shows that a one per cent increase in the ratio of unionized workers in the sub-industry will lead to a 0.55% rise in the real wage. In the 1996-2001 period, all 13 manufacturing sub-industries reported by the Ministry for Labor indicates that unionization has been on falling trend; ranging between a minimum of
11

5% fall to a maximum of 20% fall. This means that real wage would be expected to decrease by 3% to 11% due to the falling unionization rates holding all other factors constant. The negative coefficient on collective bargaining shows that a one per cent increase the ratio of workers covered by a collective bargain in the sub-industry is likely to lead to a 0.28% fall in the real wage. When we look at the 22 manufacturing sub-industries reported by SIS, we see that in 17 there has been a decrease in the rate of collective bargain coverage; an increase in 3 sub-industries; and no change in 2 sub-industries. The negative correlation here is contrary to our expectations. Assuming this finding not to be a result of technical problems with data calculation, we need a different interpretation for the relationship between wages and collective bargaining. Collective bargain practices is on the one hand an expression of the organized bargaining power of workers. At the same time it allows for a two-way communication between the employer and the employed. In this context the employees can express their different demand not only with respect to wages but also other working conditions, and employers can express the implications of certain increases in labor costs and the effects of macroeconomic or industry based conjectures in terms of the sustainability of business and as such sustainability of employment. Collective bargains entail the aim of ensuring the sustainability of employment as much as improvement of wages and other working conditions and this is a significant distinction from individual wage bargain dynamics. Hence it is possible that in times of economic contraction and crises, collective bargaining becomes a vehicle for restraining the short-term wage demands of workers in return for the long-term aim of sustainability of employment. As such the negative coefficient on the collective bargain variable can be interpreted as indicative of the specific dynamics of the 1996-2001 period, which is marked by an economic crisis at the beginning (the 1994 crisis) and at the end (the 2001 crisis). It is a known fact that in certain sub-industries, collective bargaining agreements have been subject to revisions during the 2001 crisis in order to cancel wage increases due to the deteriorating market conditions at the time. As such we can say that collective bargains become a vehicle for workers to make compromises on wages (i.e. restrain wages) in bad economic times in return for employer compromises for avoiding worker dismissals. On the contrary, in times of economic expansion, it can be hypothesized that collective bargains become a vehicle for workers assuring a larger share of the increase in profits due to their organized bargaining power. As such it is a vehicle that makes rent haring more effective but the effect on wages works in different directions depending on the economic conjecture. Table 2 shows an ordering of the sub-industry dummy coefficients from the highest to the lowest. The omitted sub-industry is the food and beverage sub-industry. As such the coefficients are indicative of how much higher the wage rate is expected to be in that particular sub-industry compared to the food and beverage sub-industry, when all the other wage determinant factors are held constant. For example, the top most chemicals industry is expected to pay a 73% higher real wage than the food and beverage industry holding all other factors constant. ††
†† As the dependent variable is in logarithmic form, in order to find the elasticity with respect to a dummy variable that takes on the dual value of 0 or 1, we take the antilog of the coefficient, subtract 1, which gives us the per cent change in the dependent variable.
12

Table 2: Industry Coefficients of Manufacturing Wage Regression Industry
Industry Dummy Coefficient *
Average ratio of qualified workers**
Average value-added per worker***
Average number of workers
Average real wage***
Chemicals 0.55 40 1144 225 162 Tobacco 0.50 34 2131 399 173 Coal and oil products
0.40
41
2475
66
192
Publishing and printing
0.39
41
972
59
99
Motorized land vehicles
0.37
27
529
193
105
Other transport vehicles
0.33
31
728
108
111
Paper and paper products
0.31
31
691
78
111
Main metal 0.31
25
677
99
97
Elektrical machinery and equipment
0.29
32
482
98
97
Radio, TV, communication equipment
0.29
35
645
226
123
Medical, delicate, optical equipment
0.28
36
459
59
99
Office, accounting and computer equipment
0.22
60
760
94
133
Machinery and equipment (other than electrical)
0.20
30
411
67
80
Plastic and rubber 0.16
28
497
69
85
Minerals (non-metallic)
0.15
24
460
83
78
Wood products
0.14
21
312
47
59
Leather
0.11
19
303
52
63
Metal goods (except machinery and equipment)
0.10
27
441
63
84
Furniture
0.06
27
325
67
47
Food and beverage
---
26
550
72
76
Textiles
-0.09
20
386
132
66
Apparel
-0.13
19
317
94
58
Notes: * As all coeffieiencts are statistically significant at the 1% level, standard errors are not shown here. ** Sum of percentages of high- and medium-qualified workers..*** In millions of TL with 1994 prices.
13

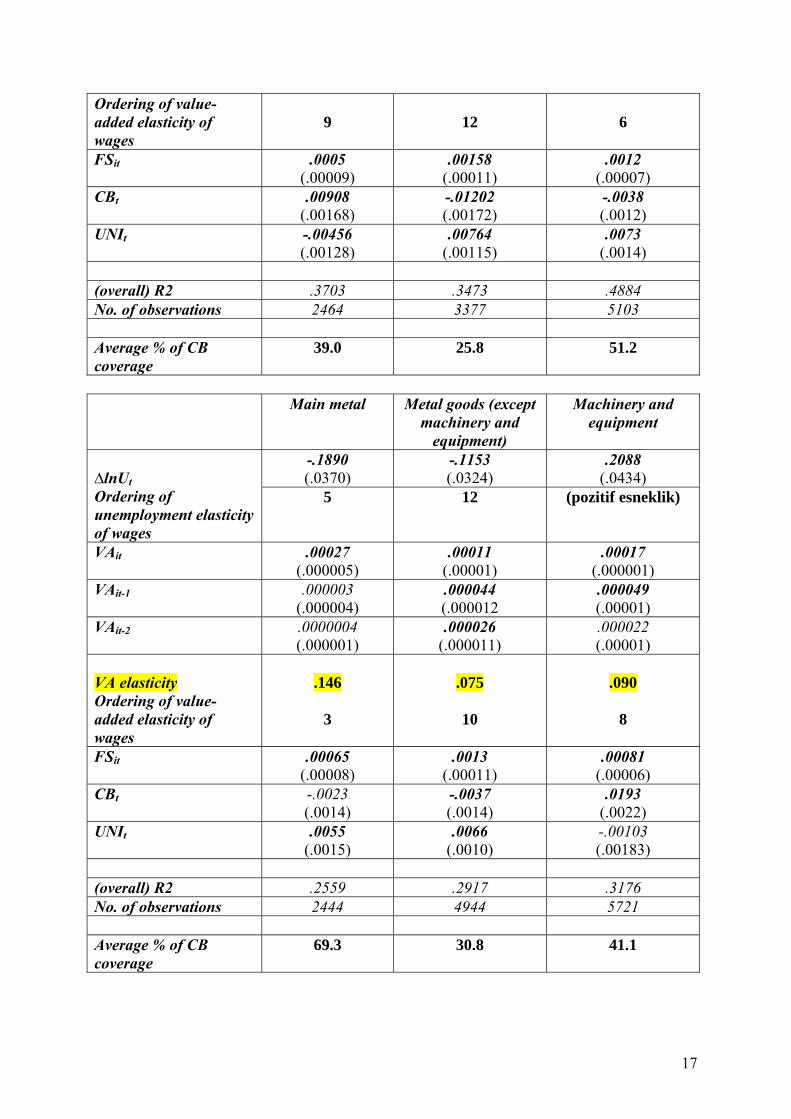
The ordering in Table 2 shows that the more capital intensive sectors using somewhat more sophisticated production technologies, are in the upper part leading to higher than average wages. The ordering of qualified worker ratio, value-added per worker, firm size are also ordered more or less from the highest towards the lowest. These observations confirm the expectations of efficiency wage and insider-outsider type wage models. In industries which have high ratios of qualified workers, use capital-intensive (or technology-intensive) production methods, and where firm size is large, the employer will need higher efficiency wages to motivate productivity on the job; and also will face higher on-the-job training costs such that will have more of a stake at avoiding replacement of insiders with outsiders. Similarly these capital-intensive firms will be the ones with higher ability to pay. In order to analyze whether wage bargain dynamics show variation with changing rates of unionization and collective bargain coverage, we have repeated the wage regressions for 19 of the 22 manufacturing sub-industries which provided adequate number of observations. Table 3 shows the results of these wage regressions for each sub-industry. In almost all the sectors, wages entail a negative correlation with unemployment and a positive correlation with value-added per worker. The only exception is the machinery and equipment industry where we find a statistically significant positive coefficient on unemployment. In the industries of leather, printing and publishing, and electrical machinery, the coefficient on unemployment is negative, yet very low and statistically insignificant. In the remaining industries we see that the conditions of wage flexibility exist yet with significant variation. In addition to the coefficients, Table 3 also shows that ordering of the unemployment and the value-added elasticity of wages among the 19 sub-industries (in the range of the highest elasticity of 1 to the lowest elasticity of 19). Accordingly, the highest value-added elasticity is found the industries of medical, delicate and optical equipment, electrical machinery and equipment, and main metal. A doubling of value-added per worker in these industries, lead to a 21%, 18% and 15% increase in the real wage respectively. The highest unemployment elasticities of pay, on the other hand, are found in the industries of food and beverage, medical, delicate and optical equipment, textiles and apparel. A 10% increase in the rate of change of unemployment is expected to lead to a 3%-2% fall in the real wage in these sectors. The lowest unemployment elasticity of pay on the other hand, is found in the industries of leather, printing and publishing, and electrical machinery and equipment; and as mentioned above the coefficient is not statistically significant.
14

Table 3: Wage Regressions at the Level of 2-digit Sub-Industry Annual manufacturing Survey Data 1996-2001: Covers all firms with 10 or more workers; the analysis is restricted to the private sector only
Food and Beverage
Textiles Apparel Leather
∆lnUt
-.3073 (.0207)
-.1891 (.0193)
-.1791 (.0202)
-.0021 (.0663)
Ordering of unemployment elasticity of wages
1
5 6 14
VAit
.000076 (.000005)
.000099 (.00000819)
.000098 (.000008)
.000084 (.000018)
VAit-1
.000004 (.000004)
.0000264 (.000008)
.000023 (.00001)
.000049 (.000019)
VAit-2
.000011 (.000004)
.0000251 (.000008)
.000017 (.00001)
.000058 (.000018)
VA elasticity Ordering of value-added elasticity of wages
.046
17
.055
16
.042
18
.057
14
FSit
.0006 (.00005)
.0005 (.00003)
.0005 (.00004)
.0007 (.0002)
CBt
-.02690 (.00141)
-.01122 (.00114)
.0415 (.0026)
.0208 (.0065)
UNIt
.0106 (.0006)
.0181 (.0013)
-.0201 (.0018)
-.0010 (.0047)
(overall) R2 .2430 .2469 .1380 .1820 No. of observations 9619 9602 9171 1944 Average % of CB coverage
30.82 47.81 10.63 10.26
Notes: Dependent variable is ln(RW)it, avregare real wage per wprker at firm i in year t (including overtime, bonus/premium, compensation, social and in-kind payments) Standard errors are in parantheses. Coeffients with a minimum level of 5% statistical significance are shwon in bold. In order to account for heterogeneity of the workforce, three variables have been added including the ratio of high- and medium-qualified, and female workers in firm i in year t. In addition 21 industry and 11 regional dummies are used. The model has been estimated using the random effects method appropriate for the panel structure of the data and using Stata software. Average % of CB coverage has been calculated for the 1996-2001 period as an unweighetd average.
15
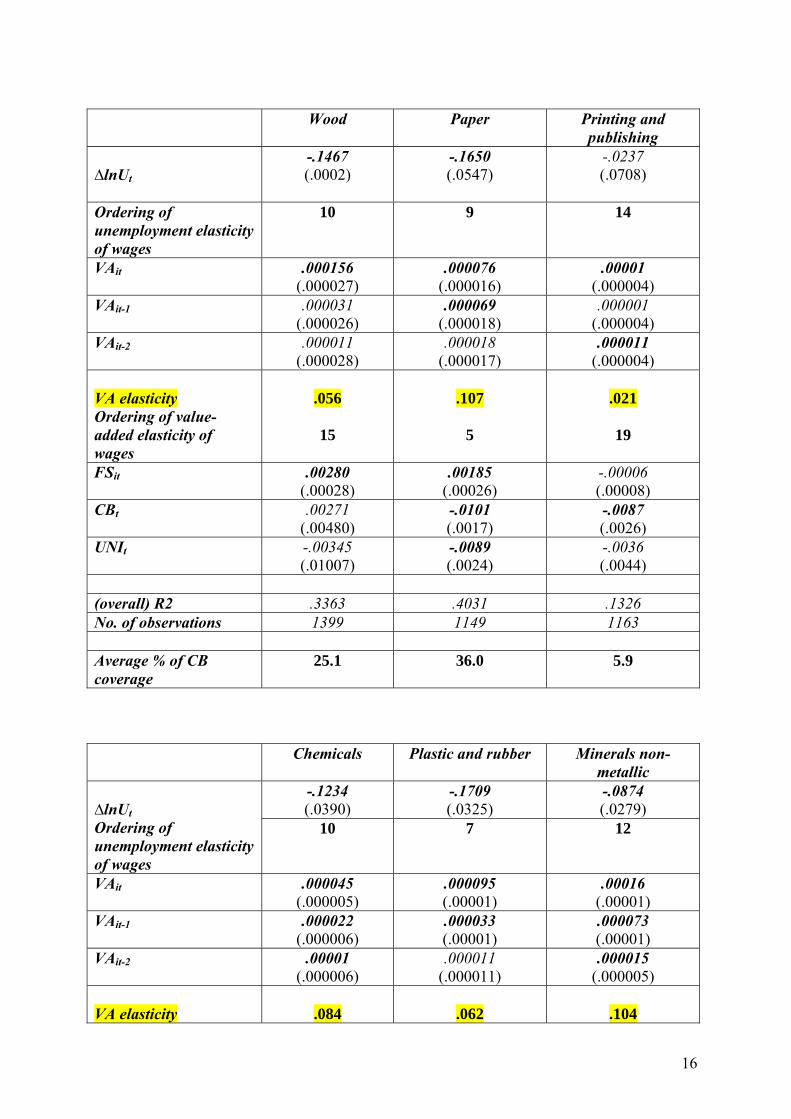
Wood Paper Printing and
publishing ∆lnUt
-.1467 (.0002)
-.1650 (.0547)
-.0237 (.0708)
Ordering of unemployment elasticity of wages
10 9 14
VAit
.000156 (.000027)
.000076 (.000016)
.00001 (.000004)
VAit-1
.000031 (.000026)
.000069 (.000018)
.000001 (.000004)
VAit-2
.000011 (.000028)
.000018 (.000017)
.000011 (.000004)
VA elasticity Ordering of value-added elasticity of wages
.056
15
.107
5
.021
19
FSit
.00280 (.00028)
.00185 (.00026)
-.00006 (.00008)
CBt
.00271 (.00480)
-.0101 (.0017)
-.0087 (.0026)
UNIt
-.00345 (.01007)
-.0089 (.0024)
-.0036 (.0044)
(overall) R2 .3363 .4031 .1326 No. of observations 1399 1149 1163 Average % of CB coverage
25.1 36.0 5.9
Chemicals Plastic and rubber Minerals non-metallic
-.1234 (.0390)
-.1709 (.0325)
-.0874 (.0279)
∆lnUtOrdering of unemployment elasticity of wages
10 7 12
VAit
.000045 (.000005)
.000095 (.00001)
.00016 (.00001)
VAit-1
.000022 (.000006)
.000033 (.00001)
.000073 (.00001)
VAit-2
.00001 (.000006)
.000011 (.000011)
.000015 (.000005)
VA elasticity
.084
.062
.104
16
Ordering of value-added elasticity of wages
9
12
6
FSit
.0005 (.00009)
.00158 (.00011)
.0012 (.00007)
CBt
.00908 (.00168)
-.01202 (.00172)
-.0038 (.0012)
UNIt
-.00456 (.00128)
.00764 (.00115)
.0073 (.0014)
(overall) R2 .3703 .3473 .4884 No. of observations 2464 3377 5103 Average % of CB coverage
39.0 25.8 51.2
Main metal Metal goods (except
machinery and equipment)
Machinery and equipment
-.1890 (.0370)
-.1153 (.0324)
.2088 (.0434)
∆lnUtOrdering of unemployment elasticity of wages
5 12 (pozitif esneklik)
VAit
.00027 (.000005)
.00011 (.00001)
.00017 (.000001)
VAit-1
.000003 (.000004)
.000044 (.000012
.000049 (.00001)
VAit-2
.0000004 (.000001)
.000026 (.000011)
.000022 (.00001)
VA elasticity Ordering of value-added elasticity of wages
.146
3
.075
10
.090
8
FSit
.00065 (.00008)
.0013 (.00011)
.00081 (.00006)
CBt
-.0023 (.0014)
-.0037 (.0014)
.0193 (.0022)
UNIt
.0055 (.0015)
.0066 (.0010)
-.00103 (.00183)
(overall) R2 .2559 .2917 .3176 No. of observations 2444 4944 5721 Average % of CB coverage
69.3 30.8 41.1
17

Electrical
machinery and equipment
Radio, TV, communication
equipment
Medical, delicate and optical equipment
∆lnUt
-.0348 (.0407)
-.2027 (.1034)
-.1953 (.0887)
Ordering of unemployment elasticity of wages
13
2
4
VAit
.00024 (.000022)
.00013 (.00003)
.00018 (.00004)
VAit-1
.000086 (.00002)
.000044 (.00003)
.00014 (.00006)
VAit-2
.000064 (.00002)
.000037 (.00003)
.00013 (.00005)
VA elasticity Ordering of value-added elasticity of wages
.178
2
.129
4
.206
1
FSit
.00056 (.00007)
.00035 (.00008)
.00228 (.00051)
CBt
-.01778 (.0023)
-.00194 (.00099)
-.00898 (.00169)
UNIt
.0267 (.0025)
-.0127 (.0056)
.0125 (.0047)
(overall) R2 .3889 .5086 .4187 No. of observations 2041 360 409 Average % of CB coverage
55.4 32.1 9.4
Motorized land vehicles
Other transport vehicles
Furniture and other
∆lnUt
-.1215 (.0493)
-.2007 (.1176)
-.1663 (.0377)
Ordering of unemployment elasticity of wages
11
3
8
VAit
.00009 (.00002)
.00006 (.00002)
.00006 (.00001)
VAit-1
.00003 (.00002)
.00002 (.00003)
.00002 (.00001)
VAit-2 .00006 .00001 .00012
18
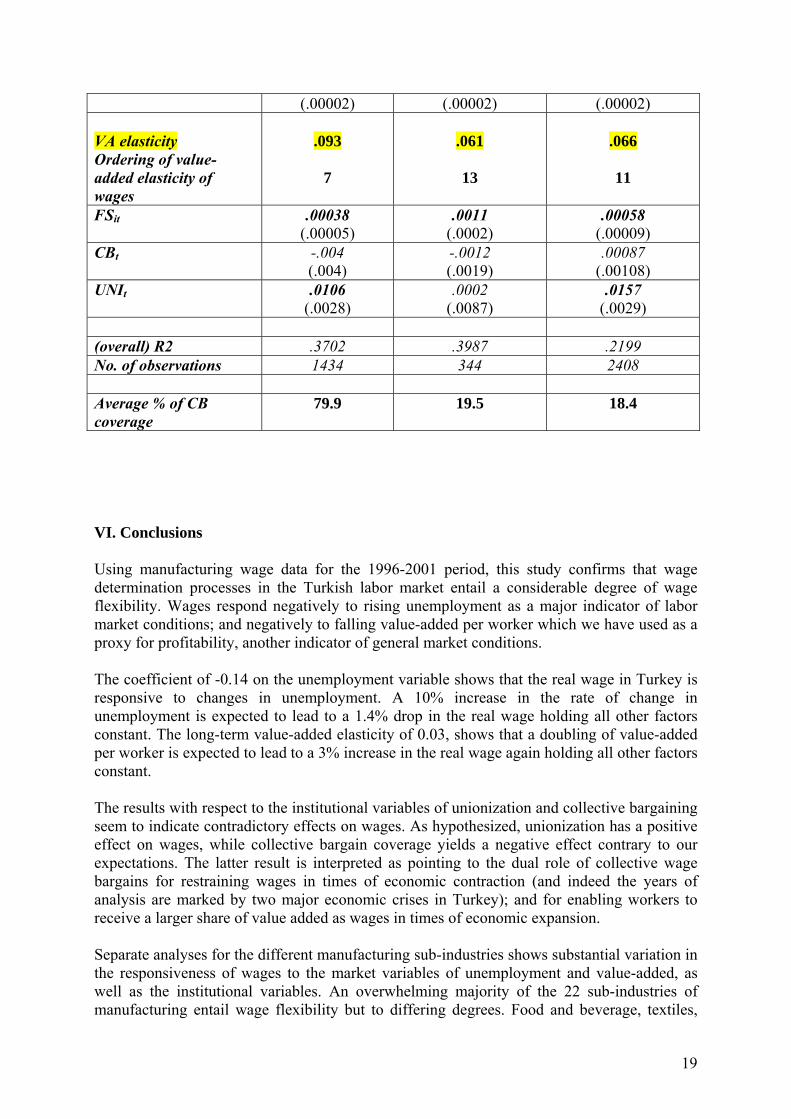
(.00002) (.00002) (.00002) VA elasticity Ordering of value-added elasticity of wages
.093
7
.061
13
.066
11
FSit
.00038 (.00005)
.0011 (.0002)
.00058 (.00009)
CBt
-.004 (.004)
-.0012 (.0019)
.00087 (.00108)
UNIt
.0106 (.0028)
.0002 (.0087)
.0157 (.0029)
(overall) R2 .3702 .3987 .2199 No. of observations 1434 344 2408 Average % of CB coverage
79.9 19.5 18.4
VI. Conclusions Using manufacturing wage data for the 1996-2001 period, this study confirms that wage determination processes in the Turkish labor market entail a considerable degree of wage flexibility. Wages respond negatively to rising unemployment as a major indicator of labor market conditions; and negatively to falling value-added per worker which we have used as a proxy for profitability, another indicator of general market conditions. The coefficient of -0.14 on the unemployment variable shows that the real wage in Turkey is responsive to changes in unemployment. A 10% increase in the rate of change in unemployment is expected to lead to a 1.4% drop in the real wage holding all other factors constant. The long-term value-added elasticity of 0.03, shows that a doubling of value-added per worker is expected to lead to a 3% increase in the real wage again holding all other factors constant. The results with respect to the institutional variables of unionization and collective bargaining seem to indicate contradictory effects on wages. As hypothesized, unionization has a positive effect on wages, while collective bargain coverage yields a negative effect contrary to our expectations. The latter result is interpreted as pointing to the dual role of collective wage bargains for restraining wages in times of economic contraction (and indeed the years of analysis are marked by two major economic crises in Turkey); and for enabling workers to receive a larger share of value added as wages in times of economic expansion. Separate analyses for the different manufacturing sub-industries shows substantial variation in the responsiveness of wages to the market variables of unemployment and value-added, as well as the institutional variables. An overwhelming majority of the 22 sub-industries of manufacturing entail wage flexibility but to differing degrees. Food and beverage, textiles,
19

ready wear, industries, for example have very high unemployment elasticity of wages yet very low value-added elasticity. On the other hand, electrical machinery and equipment and main metal industries have very high value-added elasticity of wages yet relatively low unemployment elasticity. In most of the sub-industries, there is a positive correlation with the rate of unionization. Collective bargain variable on the other hand, seem to carry a positive correlation with wages in a number of sub-sectors where collective bargaining coverage is limited such as ready wear, leather, machinery and equipment, and chemicals. This is contrary to the general trend that was identified for the manufacturing industry as a whole, a negative correlation between collective bargain coverage and the wage rate. This sub-industry variation, can be interpreted as follows. In sectors where collective bargain coverage is limited, this institutional mechanism loses its effectiveness as an agent of wage centralization / coordination, and as such is unable to function as a mechanism of wage restraint in the face of economic crises. The results have also confirmed that in different sectors, the responsiveness of wages to market conditions is dependent on institutional factors dominating that sector. Despite some exceptions, generally speaking, as coverage under collective bargains expands, unemployment elasticity of pay becomes lower. This might be indicative of the fact that wages are somewhat insulated from the effects of unemployment in such sectors as the negotiation of employment sustainability and wage increase take place simultaneously. Moreover, we find that as coverage under collective bargains expands, value added elasticity of pay becomes higher. This finding is consistent with the negative effects of collective bargain on wages in times of economic contraction. The dialogue established between employers and employees through the collective bargaining mechanisms enables more effective translation of changes in employer’s ability to pay on the wages of the workforce. Such a mechanism work to the favor of workers in times of economic expansion, as increases in profitability is more effective translated onto wage increases. In times of economic contraction, however, it works more to the favor of employers, as workers agree to wage restraints in the face of deteriorating profitability and in apprehension of employment losses. As such the institutional practice of collective wage bargaining should be seen not as an institution based on one side losing and the other side winning, but rather as a mechanism through which both sides will win through integrative bargaining.
20

References Abraham, K.G. and J.C. Haltiwanger. 1995. Real Wages and the Business Cycle, Journal of Economic Literature, Vol. 33 (September): 1215-1264. Blanchflower, D.G., and A.J. Oswald. 1994. The Wage Curve, Cambridge and London: The MIT Press. Blanchflower, D.G., A.J. Oswald, P. Sanfey. 1996. Wages, Profits and Rent-Sharing, Quarterly Journal of Economics, February: 227-251. Botwinick, H. 1993. Persistent Inequalities: Wage Disparity under Capitalist Competition, Princeton: Princeton University Press. Büyükuslu, A.R. 2004. Avrupa Birliği Perspektifinden and Endüstri İlişkileri Boyutuyla Yeni İş Kanunu: Esneklik and İş Güvencesi. İstanbul: Derin Yayınları. Calmfors, L: and J. Drifill. 1988. Bargaining structure, corporatism and macroeconomic performance, Economic Policy, 6: 16-61. Carlin, W. and D. Soskice. 1990. Macroeconomics and the Wage Bargain: A Modern Approach to Employment, Inflation and the Exchange Rate, New York: Oxford University Press. Carneiro, Francisco G. 1999. Insider power in wage determination: Evidence from Brazilian data. Review of Development Economics, 3(2): 155-169. Davies, S. 2004. A rough guide to trade union movement in the European Union, Working Paper Series No:49, Cardiff University, School of Social Sciences. Engin, M. 1999. Toplu İş Sözleşmesi Sistemi, Galatasaray Üniversitesi Yayınları, No: 15. Estevao, M. and S. Tevlin. 2000. “Do Firms share their success with workers? The response of wages to product market conditions”. FED Working Paper No.95-48. Division of Research and Statistics, Federal Reserve Board. İlkkaracan, İ. 2003. An alternative non-linear model of the wage curve and some empirical evidence from the U.S., Proceedings of the Economics for the Future Conference, Cambridge University, U.K. İlkkaracan, İ., and R. Selim. 2003. The role of unemployment in wage determination: Further evidence on the wage curve from Turkey, Applied Economics, v.35 (14): 1589-98. Johansen, K., K. Ringdall and T.A. Thoring. 2001. Firm profitability, regional unemployment and human capital in wage determination., Applied Economics, no.33: 113-121. Kenworthy, L. 2001. Wage-setting measures: A survey and assessment, World Politics 54: 57-98. OECD. 2004. Employment Outlook.
21

OECD. 1997. Employment Outlook. OECD. 1994. Employment Outlook. Onaran, Ö. 2002. Measuring Wage Flexibility: the case of Turkey before and after structural adjustment. Applied Economics, No:34: 767-781. Shapiro, C., and J. Stiglitz. 1984. Equilibrium unemployment as worker discipline device, American Economic Review, vol. 74: 433-44. Snower, D. J. 2001. Insiders versus Outsiders, Journal of Economic Perspectives 15 (1) (Winter):165-188. Soskice, D. 1990. Wage Determination: The changing role of institutions in advanced industrialized countries, Oxford Review of Economic Policy, Vol.6 (4) : 36-61. Strand, J. 2003. Wage Bargaining versus Efficiency wages: A Synthesis, Bulletin of -Economic Research, 55 (1):
22