labor market effects of international outsourcing - diw berlin
TRANSCRIPT

Daniel Horgos
Labor Market Effects of International Outsourcing: How Measurement Matters
SOEPpapers on Multidisciplinary Panel Data Research
Berlin, October 2007

SOEPpapers on Multidisciplinary Panel Data Research at DIW Berlin This series presents research findings based either directly on data from the German Socio-Economic Panel Study (SOEP) or using SOEP data as part of an internationally comparable data set (e.g. CNEF, ECHP, LIS, LWS, CHER/PACO). SOEP is a truly multidisciplinary household panel study covering a wide range of social and behavioral sciences: economics, sociology, psychology, survey methodology, econometrics and applied statistics, educational science, political science, public health, behavioral genetics, demography, geography, and sport science. The decision to publish a submission in SOEPpapers is made by a board of editors chosen by the DIW Berlin to represent the wide range of disciplines covered by SOEP. There is no external referee process and papers are either accepted or rejected without revision. Papers appear in this series as works in progress and may also appear elsewhere. They often represent preliminary studies and are circulated to encourage discussion. Citation of such a paper should account for its provisional character. A revised version may be requested from the author directly. Any opinions expressed in this series are those of the author(s) and not those of DIW Berlin. Research disseminated by DIW Berlin may include views on public policy issues, but the institute itself takes no institutional policy positions. The SOEPpapers are available at http://www.diw.de/soeppapers Editors:
Georg Meran (Vice President DIW Berlin) Gert G. Wagner (Social Sciences) Joachim R. Frick (Empirical Economics) Jürgen Schupp (Sociology)
Conchita D’Ambrosio (Public Economics) Christoph Breuer (Sport Science, DIW Research Professor) Anita I. Drever (Geography) Elke Holst (Gender Studies) Frieder R. Lang (Psychology, DIW Research Professor) Jörg-Peter Schräpler (Survey Methodology) C. Katharina Spieß (Educational Science) Martin Spieß (Survey Methodology) Alan S. Zuckerman (Political Science, DIW Research Professor) ISSN: 1864-6689 German Socio-Economic Panel Study (SOEP) DIW Berlin Mohrenstrasse 58 10117 Berlin, Germany
Contact: Uta Rahmann | [email protected]
Labor Market Effects of InternationalOutsourcing: How Measurement
Matters
Daniel Horgos∗
Abstract
As regards labor market effects of International Outsourcing, empirical studies have dif-
ficulties in confirming theoretical results. The use of different indices adds to the puzzle.
The paper examines whether measurement differences are one reason for the mismatch
between empirical and theoretical findings. In fact, considering the properties of various
outsourcing indices and applying a panel data estimation of the effects on the within in-
dustries’ wage gap in Germany, theory and empirics can be reconciled: while the wage
gap increases in the aggregate, the service sector and the high skill intensive industries, it
decreases in the low skill intensive industries – which is in line with theoretical findings by
Arndt (1997, 1998).
Keywords: International Outsourcing; wage differential
JEL classification: F16; J31
∗Department of Economics, Helmut Schmidt University - University FAF Hamburg, Holstenhofweg
85, 22043 Hamburg, Germany, email: [email protected]. Thanks are due to Daniel Bernhofen,
Barbara Dluhosch, Thierry Mayer, Daniel Mirza, Farid Toubal and to the Participants of the RIEF
VIIth Doctoral Meetings in Rennes, France.
1

Contents
1 Introduction 3
2 Design: First Theoretical Differences 6
3 Measurement: Analyzing Descriptive Properties 11
4 Quality: Extracting the Driving Forces 15
5 Performance: Estimating Adjustment Effects 17
6 Conclusions 23
References 25
Appendix 28
2
1 Introduction
Since International Outsourcing moved into the focus of political and social discussion,
it has been blamed to reduce relative demand for low skilled labor. Thus, beside
skill-biased technical change, International Outsourcing is seen as one main culprit for
labor market disruptions in industrialized countries. While Outsourcing is defined as
the procurement of inputs from an external supplier, it is the international component,
namely the use of a production fragment produced abroad, that achieves most attention
in public discussion as well as in economic research.1 In order to investigate the
determinants and the effects of International Outsourcing, a huge area of theoretical
and empirical research emerged.
Jones and Kierzkowski (1990) focus on the importance of producer services to link
fragmented production blocks and, thus, very early present a non-formal model to
describe the process of International Outsourcing. Based on this model, they deepen
the discussion on determinants and adjustment effects of International Outsourcing in
several following contributions.2 Feenstra and Hanson (1996a,b) focus on labor market
adjustment effects and show that International Outsourcing increases the relative wage
of high skilled labor in both, the insourcing as well as the outsourcing country. With
this framework, Feenstra and Hanson first present International Outsourcing, beside
skill-biased technical change, as an additional explanation of the decline of relative
low skilled labor demand and, thus, relative wages of the low skilled. Within a se-
ries of papers, Arndt (1997, 1998a,b) embeds International Outsourcing into a general
equilibrium international trade model and investigates industry specific effects. Since
producers shed their less competitive production blocks to get more effective com-
petitors on world markets, International Outsourcing increases relative wages in labor
intensive industries, whereas relative wages in capital intensive industries decrease.
With this pattern Arndt concludes that the aggregate welfare-reducing implications
of International Outsourcing may be exaggerated. Deardorff (2001a,b) shows within
a combination of a Ricardian and a Heckscher-Ohlin model, that the adjustment ef-
fects of International Outsourcing strongly depend on the nature of fragmentation,
in particular the factor intensities of the relocated production blocks. Depending on
the effects on terms of trade, International Outsourcing can either increase or lower
a countries welfare. Deardorff additionally mentions that International Outsourcing
may be a force toward factor price equalization. Embedding International Outsourcing
into an increasing returns to scale framework, Burda and Dluhosch (2001, 2002) present
different determinants as well as labor market adjustment effects compared to the re-
1For a detailed definition of International Outsourcing see e.g. Jones and Kierzkowski (1990), Arndt
(1998b), or Deardorff (2001b).2See e.g. Jones and Kierzkowski (2001a,b, 2004, 2005)
3
sults achieved with traditional Heckscher-Ohlin models. As a reaction of monopolistic
competition, International Outsourcing increases the skill wage premium and, thus,
behaves similar to skill-biased technical change in the short run. They additionally
note, that, when firms enter the market, results may change.
In order to test theory, a lot of empirical work emerged measuring the level and
estimating adjustment effects of International Outsourcing. Since it is not possible to
directly observe International Outsourcing at an aggregated macro level, there is a
need to proxy it. Therefore, several indices were developed and a few of them are very
common in use. Campa and Goldberg (1997) e.g. measure International Outsourcing
using an index called vertical specialization. Within a descriptive analysis they show
that, from 1974-1993, International Outsourcing increased strongly in the United States
(US), Canada and the United Kingdom (UK), but not in Japan. Hummels et al. (2001)
measure International Outsourcing as imported inputs used to produce products that
are afterward exported. Based on OECD input-output tables they document several
key aspects of International Outsourcing for various countries. Yeats (2001) uses the
measure of imported inputs in total imports and concludes for a variety of countries
that International Outsourcing is already at a quite high level.
The use of different indices to measure International Outsourcing turns out to be a
serious problem when it comes to the estimation of labor market adjustment effects.
Berman et al. (1993) proxy International Outsourcing with parts and components pur-
chased from abroad and, thus, use a very narrow measure. Regressing the share of
high skilled wages in total wages on the components of a quasi-fixed cost function, in-
cluding their International Outsourcing proxy, they investigate the shift from unskilled
toward skilled labor in the US manufacturing industries during the 1980s. As results
Berman et al. show that International Outsourcing has only small effects while it is
the labor saving technical change that turns out to be the main driving force. By con-
trast, Feenstra and Hanson (1996a,b, 1999) use a more general index of International
Outsourcing, namely the imported inputs in total inputs. As estimation result they
present a positive, highly statistically significant effect of International Outsourcing on
the change in the non production wage share of the US manufacturing industry. Thus,
they highlight the importance of International Outsourcing for understanding changes
in labor demand and first note that measurement differences can be one crucial point of
achieving different results. Egger and Egger (2002) examine the effects of International
Outsourcing within the involved low-wage countries. As proxy they use the imported
inputs in total imports as well as intermediate goods exports in total exports and find
a significant positive (negative) effect of imports (exports) on wages in the manufac-
turing industry. Focusing on the manufacturing sector in France, Strauss-Kahn (2003)
shows that International Outsourcing contributes significantly to the decline of the
share of unskilled workers in employment. She bases her calculations on an index
4

called vertical specialization and, like Berman et al. (1993) and Feenstra and Hanson
(1996b, 1997), estimates labor market effects using a cost share equation of a translog
function. She recommends policy to focus on education and relocation subsidies and
not, like sometimes mentioned by globalization critics, to restrict International Out-
sourcing since it tends to increase average welfare. For the UK, Hijzen et al. (2004)
estimate the effects of International Outsourcing on labor demand in the manufactur-
ing sector over the period 1984-1996. Only considering the imported inputs in a given
industry from the same industry, they use a very narrow measure. As main result they
show that International Outsourcing nevertheless has a strong negative effect on the
demand of low skilled workers and, thus, is an important component in explaining the
changing skill structure. Geishecker and Görg (2005) show for the German economy
that International Outsourcing may have different adjustment effects in different indus-
tries. As index they use imported inputs in total output. While for the manufacturing
sector as a whole, effects of International Outsourcing are not significant, results differ
when considering a more disaggregated industry level. Estimating a microeconomic
log wage equation they show that, while low skilled workers in the low skill intensive
industries experience significant reductions in their real wage, there is no such effect
for low skilled workers in the high skill intensive industries. On the other hand, high
skill workers significantly gain from fragmentation only in the high skill intensive in-
dustries while the effect on their real wage in the low skill intensive industries is not
significant. Amiti and Wei (2004) investigate the role of service outsourcing for the US
and the UK, showing that it is much lower but increases at a faster pace than material
outsourcing in both countries. Using imported inputs in total inputs, they estimate
labor market adjustment effects with a standard labor demand equation (as shown
e.g. in Hamermesh (1993)). As result they present only insignificant effects of service
outsourcing on job growth in the UK.3 Thus they summarize that service outsourcing
does not induce a fall in aggregate employment but could lead to overall positive effects
since it increases the productivity within industries.4
As this literature review shows, empirical investigations failed to test some impor-
tant effects stated by theory. In particular, there is no empirical contribution showing
that International Outsourcing increases relative wages in labor intensive industries
but reduces them in capital intensive ones (e.g. shown by Arndt (1997, 1998a,b)), or
showing that International Outsourcing leads to an increase of the relative wage of
3In a companion paper Amiti and Wei (2005) show for the US economy that a negative effect occurs
when looking at a more disaggregated industry level, but this effect disappears when considering
aggregated sectors.4With respect to service outsourcing, a big amount of descriptive analysis emerged in the last years.
The McKinsey Global Institute (2003) presents a widely quoted study and predict job losses due to
service outsourcing from 2003 to 2015. However, they note that the amount of job losses is only a
relative small share of the overall job losses due to business cycle.
5

high skilled labor at the aggregated whole economy level (e.g. mentioned by Feen-
stra and Hanson (1996a,b, 1999)). Rather, empirical results differ strongly and, thus,
a quite blurry picture emerges. The different estimation results are not only due to
different data, but also due to the use of different International Outsourcing indices,
what makes the puzzle additionally confusing. This contribution investigates if mea-
surement differences may be one reason for the difficulties of empirical contributions in
testing important theoretical findings. In section (2), the design of different indices gets
examined. Therefor, five commonly used indices are accurately defined and compared
with respect to their theoretical differences. In section (3), International Outsourcing
is measured with these indices from 1991-2000 in Germany to assess their descriptive
properties. To investigate the quality of the indices, several shift-share analysis are
applied in section (4). Thus, the indices’ variance is decomposed in order to examine
if they really capture International Outsourcing activities or if they are mainly driven
by other forces. To investigate their performance when it comes to the estimation of
labor market adjustment effects, several panel data analysis are applied in section (5),
using data from the German Socio Economic Panel (SOEP). With a very direct form of
estimating adjustment effects, the within industries’ wage differential is regressed on
the different indices. Section (6) concludes by summarizing the major findings. As it
turns out, fundamental differences exist between the International Outsourcing indices.
With respect to these differences and with the kind of panel data estimation focusing
more directly on the effects on the wage differential, highly significant results occur
confirming the above mentioned theoretical findings. Within the period 1991-2000, In-
ternational Outsourcing significantly increases the wage gap in Germany in the whole
economy, the service sector and the high skill intensive industries, but not in the low
skill intensive industries. There, the wage gap decreases.
2 Design: First Theoretical Differences
To start with the analysis, this section investigates theoretical differences of five Inter-
national Outsourcing indices that are very common in use. Since some of them miss a
concrete definition, they first get accurately defined. By comparing their designs and
extracting theoretical differences, a picture emerges providing first hints with respect
to their properties as descriptive measures.
Imported Inputs as Share of Total Imports
One index to proxy International Outsourcing is the share of "Imported Inputs in Total
Imports" (IITM). This index is used e.g. by Yeats (2001) to measure the magnitude
and the nature of global production sharing for several OECD countries in 1995. Egger
6

and Egger (2002) calculate this share for seven central and eastern European Countries.
While Egger (2003) and Egger and Egger (2003) refer to the results presented in Yeats
(2001) only to measure the magnitude of International Outsourcing, they turn to another
index described below (imported inputs as share of gross output) to measure the
development of International Outsourcing. Chen et al. (2005) also use IITM to proxy
International Outsourcing for 10 OECD countries and different years during the period
1968-1998. The IITM index can be calculated using
IITMt =
n∑j=1
z∑w=1
iwjt
z∑w=1
mwt
(1)
with iwjt as imported inputs from industry w = 1, . . . , z used to produce output in
industry j = 1, . . . ,n at point of time t and mwt as total imports of good w. To obtain
the desired level of industry aggregation, different industries j can be aggregated.5 To
obtain total imports, one has to aggregate over w goods. To calculate the International
Outsourcing indices, most empirical contributions use input-output tables.6
Equation (1) directly clarifies one problem arising with the IITM index: the lack of
information on total imports m at the disaggregated industry level j. While input-
output tables provide information on the imports of commodity w used as inputs in
production of industry j, they do not observe total imports of good w used in industry
j. With respect to total imports, input-output tables do not differentiate between the
industries j where they are used. Thus, it is only possible to match imported inputs i
and total imports m at the aggregated whole economy level but not at a disaggregated
industry level j. When the IITM index is calculated for disaggregated industries,
imported inputs used in industry j are related to total imports of commodity w (with
w = j due to the symmetry of input-output tables). Thus, the numerator and the
denominator are referred to different dimensions, what may result in values difficult
to interpret. This problem gets magnified with the examination of time series and,
thus, when focusing on the change of International Ousourcing. However, all of the
mentioned papers recently used the IITM index intuitively considered this problem
and only calculated this index for one period t at an aggregated level. To analyze5Within the whole paper, different levels of industry aggregation are considered, namely the whole
economy, the manufacturing industry, the low skill intensive industries of the manufacturing sector,
the high skill intensive industries of the manufacturing sector as well as the service industry.6As Chen et al. (2005) mention, input-output tables have several advantages in measuring International
Outsourcing activities. One of the attractive features is that they contain information on imported
inputs at a disaggregated industry level. Thus, they provide the possibility to exactly identify the
industries abroad from which the inputs get imported and the industries in the home country that
use the imported intermediates in production.
7

the development of International Outsourcing or the amount at a more disaggregated
industry level, they proceeded with other International Outsourcing indices.
Imported Inputs as Share of Total Inputs
Another frequently used index to measure International Outsourcing activities is the
ratio of "Imported Inputs to Total Inputs" (IITI). Feenstra and Hanson (1996b) use this
index to measure International Outsourcing for the US manufacturing sector. Amiti
and Wei (2004) calculate IITI for the UK and differ between service and manufacturing
inputs. Bardhan and Kroll (2003) also use the index to measure International Outsourc-
ing for the US. In addition to the manufacturing sector, they calculate this share for the
high-tech-manufacturing industries. The European Economic Advisory Group (2005)
also refers to the IITI index and present results for several European countries in the
years 1995 and 2000. The IITI measure can be calculated using
IITIt =
n∑j=1
z∑w=1
iwjt
n∑j=1
z∑w=1
qwjt
=
n∑j=1
z∑w=1
iwjt
n∑j=1
z∑w=1
(iwjt + dwjt)(2)
with iwjt as imported inputs from industry w = 1, . . . , z used to produce output in
industry j = 1, . . . ,n at point of time t and qwjt as the value of total inputs from
industry w used in industry j.7 Total inputs qwjt can also be separated into imported
inputs iwjt and domestically produced inputs dwjt. To obtain the measure for different
levels of industry aggregation, the factors of IITI can be aggregated over the desired
j industries. By contrast to IITM, the IITI index relates comparable values and, thus,
achieves interpretable results also at disaggregated industry levels as well as for the
development of International Outsourcing over time.
Imported Inputs as Share of Gross Output
A third measure of International Outsourcing is the index "Imported Inputs as share
of Gross Output" (IIGO). The IIGO index is e.g. used in Egger and Egger (2003).
They calculate the average annual change of International Outsourcing between 1990
and 1997 at the 3-digit NACE industry aggregation for 11 European countries. As
results, Egger and Egger show that, on average, International Outsourcing increased,
especially in the southern EU member states. Geishecker and Görg (2005) use this
7Since Feenstra and Hanson (1996b) and Amiti and Wei (2004) do not use typical input-output tables
as data, they have no information of the value of imported inputs i. Thus, they estimate i similar as
described for the vertical specialization index below.
8
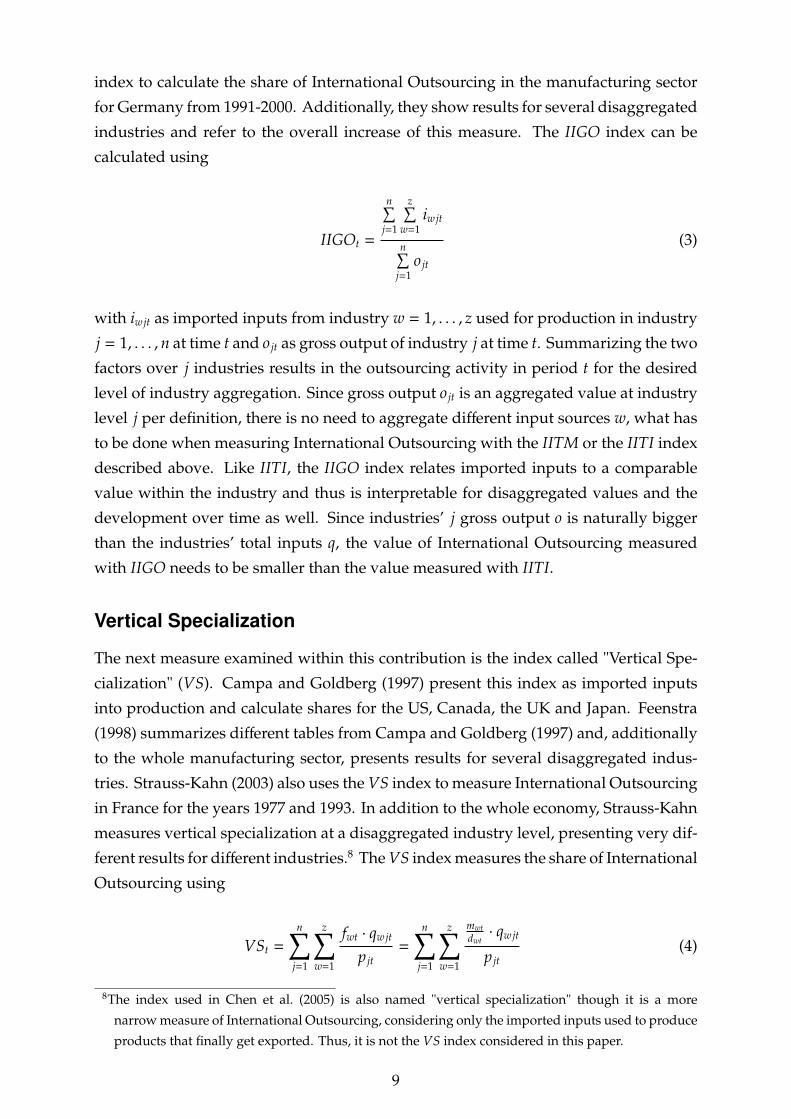
index to calculate the share of International Outsourcing in the manufacturing sector
for Germany from 1991-2000. Additionally, they show results for several disaggregated
industries and refer to the overall increase of this measure. The IIGO index can be
calculated using
IIGOt =
n∑j=1
z∑w=1
iwjt
n∑j=1
o jt
(3)
with iwjt as imported inputs from industry w = 1, . . . , z used for production in industry
j = 1, . . . ,n at time t and o jt as gross output of industry j at time t. Summarizing the two
factors over j industries results in the outsourcing activity in period t for the desired
level of industry aggregation. Since gross output o jt is an aggregated value at industry
level j per definition, there is no need to aggregate different input sources w, what has
to be done when measuring International Outsourcing with the IITM or the IITI index
described above. Like IITI, the IIGO index relates imported inputs to a comparable
value within the industry and thus is interpretable for disaggregated values and the
development over time as well. Since industries’ j gross output o is naturally bigger
than the industries’ total inputs q, the value of International Outsourcing measured
with IIGO needs to be smaller than the value measured with IITI.
Vertical Specialization
The next measure examined within this contribution is the index called "Vertical Spe-
cialization" (VS). Campa and Goldberg (1997) present this index as imported inputs
into production and calculate shares for the US, Canada, the UK and Japan. Feenstra
(1998) summarizes different tables from Campa and Goldberg (1997) and, additionally
to the whole manufacturing sector, presents results for several disaggregated indus-
tries. Strauss-Kahn (2003) also uses the VS index to measure International Outsourcing
in France for the years 1977 and 1993. In addition to the whole economy, Strauss-Kahn
measures vertical specialization at a disaggregated industry level, presenting very dif-
ferent results for different industries.8 The VS index measures the share of International
Outsourcing using
VSt =
n∑j=1
z∑w=1
fwt · qwjt
p jt=
n∑j=1
z∑w=1
mwtdwt· qwjt
p jt(4)
8The index used in Chen et al. (2005) is also named "vertical specialization" though it is a more
narrow measure of International Outsourcing, considering only the imported inputs used to produce
products that finally get exported. Thus, it is not the VS index considered in this paper.
9

with qwjt as the total value of inputs from industry w = 1, . . . , z to produce output in
industry j = 1, . . . ,n in year t and fwt as the fraction of imported goods mwt to domes-
tically used goods dwt. As imported and domestically used goods, the VS measure
in literature mostly considers final, intermediate as well as capital goods. Thus, the
numerator of (4) can be seen as an estimation of imported inputs by industry j at time
t (comparable with the numerators of the indices described above) which is related to
the value of total production p jt. Depending on the desired level of aggregation, the
factors can again be summed over j = 1, . . . ,n industries. As the above mentioned
IITM, the VS index also uses total imports m not available at the industry level j. But
by contrast, VS does not relate these imported goods from industry w with other factors
at the industry level j. Instead, the imports mwt get related to the domestic use of goods
dwt and thus the m/d fraction uses the same dimensions in the numerator as well as
in the denominator. This solves the above mentioned problem with the IITM index.
Thus, similar to the IITI and IIGO indices it is possible to obtain interpretable values at
a disaggregated industry level as well as for the development of the index over time.
Value Added as Share of Production
As a fifth proxy of International Outsourcing activities, an index frequently cited in
a debate on the German economy is examined. As Sinn (2003) called the German
economy a "bazaar economy" whose growth of value added by domestic manufactures
declines and has already fallen behind the growth of production, he started a new round
of discussion using a well known index to measure the declining share of domestic
"Value Added in Production" (VAP). He highlights the strong fall after 1995 and
illuminates unequal developments in different industries.9 The VAP measure can be
calculated using
VAPt =
n∑j=1
v jt
n∑j=1
p jt
(5)
with v jt as value added and p jt as the value of production in industry j = 1, . . . ,n at
time t. Again, depending on the desired level of aggregation, j can be summed over9With respect to the huge discussion about the bazaar economy it has to be mentioned, that the critics
of Sinn’s thesis base their argumentation on other indices. Bofinger (2005) e.g. argues that the
term "bazaar economy" is inappropriate as long as the domestically produced share of exports is
larger than 50 percent. Thereby he refers to calculations of the German Federal Statistical Office
(Statistisches Bundesamt, 2004), showing that, while the import share of the exporting industries has
risen indeed, the domestically value added share of GDP increased also. For a detailed investigation
of this discussion see Sinn (2005).
10

different industries. The VAP index also relates factors directly comparable at the
industry level j and, since International Outsourcing should lead to lower value added
in the home industries, the index is expected to be an inverse proxy of International
Outsourcing activities. Thus, VAP can be seen as an indirect International Outsourcing
index measuring exactly the opposite, the decrease of an industries’ value added since
it relocates fragmented production blocks e.g. to a relative low wage country.
Since all the equations described above measure International Outsourcing at time t
one can use a standard index formula like
IOz0,t =
IOzt
IOz0
, (6)
with IOz denoting the respective International Outsourcing index (z = IITO, IITI, IIGO,
VS or VAP), to achieve the development of International Outsourcing over time.
As these theoretical definitions show, the IITM index may lead to trouble since it
relates values not comparable at a disaggregated industry level. Thus, it is difficult
to make any expectations about the behavior of the index as a proxy of International
Outsourcing activities, except that the values of the index should be relatively high
since import values are relatively small compared with total inputs (IITI), gross output
(IIGO) or total production (VS). Another important result is the expectation of the VAP
index to evolve inverse to International Outsourcing activities and, thus, to the other
three indices IITI, IIGO and VS. Since the value of total inputs is necessarily smaller
than the value of total production or gross output, the IITI index should result in higher
values than the IIGO and the VS. However, IITI and IIGO are designed as very direct
measures of International Outsourcing and, thus, can be assumed to be quite good
proxies. With respect to VS, the quality as well as the performance of the index depend
on the goodness of the m/d-ratio (see equation (4)) as a proxy for the "international"
component of an industries’ production pattern. If this ratio turns out to capture an
industries’ international activity quite well, the index should have similar properties
as the IITI and the IIGO index and, thus, could also be expected to be a good proxy for
International Outsourcing activities.
After comparing the theoretical design of the different International Outsourcing in-
dices, the next section uses these indices to measure the level as well as the development
of International Outsourcing within the German economy.
3 Measurement: Analyzing Descriptive Properties
While empirical literature mostly focus on econometrical estimations, only few atten-
tion is set on descriptively measuring International Outsourcing. This section inves-
11

Table 1: Values of International Outsourcing in GermanyIITM IITI IIGO VS VAP
1991
Whole Economy 57% 16% 7% 7% 51%
Manufacturing Industry 52% 24% 12% 11% 37%
Low Skill Industries 61% 25% 13% 13% 34%
High Skill Industries 46% 24% 11% 10% 40%
Service Industry 146% 9% 3% 3% 59%
1995
Whole Economy 58% 15% 6% 6% 52%
Manufacturing Industry 50% 24% 12% 12% 35%
Low Skill Industries 57% 23% 12% 12% 33%
High Skill Industries 46% 24% 11% 11% 37%
Service Industry 144% 8% 3% 3% 61%
2000
Whole Economy 55% 19% 8% 9% 50%
Manufacturing Industry 48% 29% 14% 15% 33%
High Skill Industries 56% 28% 14% 14% 33%
Low Skill Industries 44% 29% 14% 15% 33%
Service Industry 133% 11% 4% 5% 59%
tigates the behavior of the indices when used as descriptive measurements. Within a
first step, the amount of International Outsourcing in Germany is calculated for the
years 1991, 1995 and 2000. A second step investigates the development of International
Outsourcing from 1991-2000 (additionally differentiating between the two sub-periods
1991-1995 and 1995-2000). All the calculations in this section are based on input-output
tables from the German Federal Statistical Office.10
Table (1) summarizes the amount of International Outsourcing in Germany for the
years 1991, 1995 and 2000 and for different levels of industry aggregations, namely the
whole economy, the manufacturing industry, additionally separated into the high and
low skill intensive industries, as well as the service industry.11
With nearly 60 percent, the IITM index measures the highest values of International
Outsourcing in Germany. However, as mentioned in section (2), problems occur when
calculating IITM, especially at the disaggregated industry level. By contrast, the results
of the IITI, the IIGO and the VS index show much lower values. As expected with the
theoretical design of the indices, the values of the IITI index are in any case higher than
those of the IIGO and the VS index. With respect to IITI, the lowest share of International
10To calculate the indices from input-output tables, the equations presented in section (2) have to be
slightly rearranged into some matrix-algebra. The necessary formulas are presented in Appendix I.11To differ between high and low skill intensive industries of the manufacturing sector the paper refers
to a cluster analysis done by Geishecker and Görg (2005). The results of this cluster analysis are
presented in Appendix II.
12

Table 2: Development of International Outsourcing in GermanyIITM IITI IIGO VS VAP
1991-2000
Whole Economy −3% 20% 19% 28% −2%
Manufacturing Industry −7% 20% 18% 29% −12%
Low Skill Industries −7% 14% 11% 6% −2%
High Skill Industries −4% 24% 25% 47% −17%
Service Industry −9% 29% 30% 38% −1%
1991-1995
Whole Economy 1% −6% −7% −6% 2%
Manufacturing Industry −3% −1% 1% 3% −5%
Low Skill Industries −6% −6% −5% −6% −2%
High Skill Industries 0% 3% 5% 11% −7%
Service Industry −1% −4% 6% −9% 2%
1995-2000
Whole Economy −4% 27% 27% 37% −4%
Manufacturing Industry −4% 21% 17% 26% −7%
Low Skill Industries −1% 21% 16% 14% −1%
High Skill Industries −4% 21% 19% 33% −11%
Service Industry −8% 35% 38% 51% −3%
Outsourcing occurs in the service industry with around 10 percent, followed by the
whole economy. The highest values are measured within the manufacturing industry as
well as the high skill and the low skill intensive industries. The IIGO and the VS index
present a quite similar picture of International Outsourcing in Germany. Compared to
the other indices they result in the smallest values, with the manufacturing as well as the
high skill and low skill intensive industries around 10−15 percent, the whole economy
around 7 percent and the service sector around 3 − 5 percent. In line with the results
of the IITI index, the indices show similar between industry structures of International
Outsourcing. Thus, the relatively small amount of International Outsourcing in the
service industry compared to the manufacturing industry (already shown by several
other country studies, e.g. Amiti and Wei (2004)) can also be confirmed for the German
economy. The VAP index results in relatively high values of International Outsourcing
and, thus, lies between the IITM and the other three indices.
To analyze the development of the indices, table (2) presents the percentage change
of International Outsourcing in Germany for different time periods.
The table clearly shows the inverse behavior of the VAP index. From 1991-2000, the
index decreased for all levels of industry aggregations. The effect was extraordinary
within the manufacturing industry and the high skill intensive industries with a decline
of 12 percent and 17 percent, respectively. A much lower, but still decreasing effect
occurred in the whole economy and in the low skill intensive industries, while in
13

the service industry, value added was only marginally decreasing. Considering an
additional separation in two time periods, value added in production seems to be more
stable during the first period (1991-1995) than in the second period (1995-2000), where
the main decrease occurred. With respect to the IITM index, most of the industries also
show an inverse pattern of International Outsourcing.12 Due to an enormous decrease of
the index for the service sector in the second period (1995-2000), this sector also depicted
the strongest fall over the whole time period. However, the problems mentioned
above should be kept in mind. Considering the other three indices IITI, IIGO and VS,
results show similar patterns of the development of International Outsourcing over time
but, however, with noticeable differences. Considering the whole period, the service
industry is exposed to very high growth rates with around 30 − 40 percent. Another
remarkable pattern is the stronger increase of International Outsourcing activities in
high skill intensive industries compared to the low skill intensive industries. The
VS index generally shows very intense patterns of the development of International
Outsourcing with an extraordinary high increase of 47 percent in the high skill intensive
industries. With a bigger variance, results are most above or below the IITI or the IIGO
index. While in the first years (1991-1995), the indices more or less fluctuated, the big
increase of International Outsourcing occurred in the second period (1995-2000).
Summarizing the descriptive properties of the indices it turns out, that International
Outsourcing increased in Germany during the considered time period. In most parts of
the economy International Outsourcing fluctuated slightly during the first years (1991-
1995), but increased sharply within the second time period (1995-2000). The service
sector shows the strongest increase of International Outsourcing, but is still on a fairly
low level. An important pattern to note is that International Outsourcing is at a higher
level and increases faster in the high skill intensive industries than in the low skill
intensive ones. Beside these general findings, noticeable differences exist between the
different indices. Due to the above mentioned problems, the IITM index seems to be
inadequate to measure the value as well as the development of International Outsourc-
ing. Thus, results differ strongly from the results achieved with the other three indices
IITI, IIGO and VS. They behave quite similar and present an increase of International
Outsourcing activities with the VS index depicting changes more intensively than the
other two indices. As expected from the theoretical definitions in section (2), the VAP
index is an inverse measure of International Outsourcing. However, this does not hold
for the service sector. There, value added stayed nearly stable. Thus, in the service in-
dustry Germany focuses a strong increase of International Outsourcing without losing
value added. This could e.g. be due to the high rate of innovation and firm start ups in
parts of the service sector.
12Appendix III presents some algebra showing the possibility of the IITM index to decrease even if
International Outsourcing increases.
14

After examining the behavior of the International Outsourcing indices when being
used as descriptive measurements, the next section investigates the quality of the
different indices.
4 Quality: Extracting the Driving Forces
With respect to the design of the different indices, it is possible that they indeed capture
International Outsourcing activities. However, there may be other forces at work,
that drive the main part of their variance. If, e.g. a highly vertically specialized
industry increases its share of production relative to economy wide production, the
index is forced to increase even though the Outsourcing activity of the industry has not
changed or even declined. Thus, the increase of an index could be due to structural
changes, what would be an objectionable attribute. To examine if the indices are really
driven by International Outsourcing activities, several shift-share analysis are applied
within this section. Shift-share analysis are used to decompose the variance of an index
into different components. While fixing one component the intrinsic variation of the
other component (that is allowed to adjust flexible) can be extracted.13
To investigate the quality of an index in really capturing International Outsourc-
ing activities, the indices’ variance is decomposed into the change of the industries’
International Outsourcing activity (the within component) and the relative structural
change of the industry (the between component) using
∆IOz = ∆
n∑j=1
θ jF j =
n∑j=1
θ j∆F j +
n∑j=1
F j∆θ j (7)
with IOz as the value of the index (z = IITM, IITI, IIGO,VS,VAP), F j as industries’ j
International Outsourcing activity and θ j as the structural component of industry j. A
bar over the variable denotes the statistical mean of the 1991 and the 2000 values and
∆ indicates absolute changes. The structural component θ j differs slightly with respect
to the different indices. If the index e.g. relates Imported Inputs to Gross Output
(IIGO), θ j is the share of the output of industry j to economy wide output. The within
component F j really captures the variation of the industries’ International Outsourcing
activity by focusing on imported inputs. The results of the shift share analysis for the
period 1991-2000 are summarized in table 3.
While the row "within" depicts the variation of the industries’ International Out-
sourcing intensity (∑n
j=1 θ j∆F j), the structural changes are shown in row "between"
13The fixed component works as a form of statistical data benchmark. As results differ with different
benchmarks, it is important to decide which benchmark should be used. In this contribution the
arithmetic mean value is used.
15

Table 3: Outsourcing vs. Industry Structure (1991-2000)IITM IITI IIGO VS VAP
Whole EconomyWithin −0.0078 0.0378 0.0149 0.0214 −0.0233
Between −0.0077 −0.0058 −0.0022 −0.0022 0.0138
Total −0.0154 0.0320 0.0127 0.0193 −0.0094
Within / Total 50% 118% 117% 111% 247%
Manufacturing IndustryWithin −0.0241 0.0533 0.0212 0.0326 −0.0433
Between −0.0126 −0.0058 0.0002 0.0004 0.0004
Total −0.0367 0.0475 0.0214 0.0330 −0.0429
Within / Total 66% 112% 99% 99% 101%
High Skill IndustriesWithin 0.0016 0.0571 0.0257 0.0463 −0.0625
Between −0.0195 −0.0009 0.0016 0.0024 −0.0053
Total −0.0179 0.0562 0.0273 0.0487 −0.0678
Within / Total −9% 102% 94% 95% 92%
Low Skill IndustriesWithin −0.0720 0.0475 0.0138 0.0100 −0.0133
Between 0.0287 −0.0124 −0.0001 −0.0018 0.0056
Total −0.0433 0.0351 0.0137 0.0082 −0.0078
Within / Total 166% 135% 101% 122% 172%
Service IndustryWithin 0.0957 0.0241 0.0106 0.0137 −0.0115
Between −0.1666 0.0012 −0.0008 −0.0009 0.0060
Total −0.0709 0.0252 0.0098 0.0129 −0.0055
Within / Total −135% 95% 108% 107% 209%
(∑n
j=1 F j∆θ j). Row "total" shows the sum of the two different components and, thus,
presents the overall change of the index (∆IOz). The row "within / total" presents the
contribution of the change in real International Outsourcing activities to the total vari-
ation of the index. In line with measurement results in section (3), the indices increase
over the whole period 1991-2000, except the inverse VAP and the IITM index. Since the
shift-share analysis bases on calculations on the disaggregated industries, problems
arise again for IITM. While the "within" component presents the ratio of imported
inputs of industry j to imports of commodity w, the structural "between" component
captures the change of imports of good w in total imports. Due to the vague separation
of industries and commodities, it is difficult to interpret results reasonable. This prob-
lem additionally leads to "within / total" ratios far away from the aspired 100 percent,
depicting that the IITM index may not be good in capturing International Outsourcing
activities.
The three indices IITI, IIGO and VS show similar results within different levels of
industry aggregation. As the high values in the row "within / total" show, the change
of the indices are mainly driven by the change of International Outsourcing. However,
despite these similarities, there are significant differences as well. The strongest "total"
increase can be measured with the IITI index. While the structural "between" compo-
nent mostly decreases, the "within" component capturing International Outsourcing
16

increases in all the depicted sectors. This results in a "within / total" share mostly
above 100 percent, showing that the IITI index slightly underestimates International
Outsourcing activities. The difference of the "within / total" ratio from the 100 percent
benchmark is slightly higher than the deviation of the results obtained with the other
two indices IIGO and VS. The "total" variations of the VS index are mostly not so in-
tense than those obtained with the IITI, but even stronger than those of the IIGO index.
In all the considered aggregation levels, the increase of the index is mainly driven by the
increase of the International Outsourcing component while the structural component
decreases, except in the manufacturing industry and the high-skill intensive industries.
Thus, the "within / total" ratio is quite high and, as the ratio of the IIGO index, very
smooth nearby the 100 percent margin. The IIGO index shows a similar pattern but
with slightly smaller variations of the total change as well as the structural component.
With respect to the VAP index, the decrease in total change clearly shows the inverse
structure of the index. While the "within" component (value added of industry j in
the industries’ production) decreases over all the different industry aggregation levels,
the structural "between" component mostly increases, however, not as strong as the
decrease of the inverse "within" component. This leads in some industries to a quite
low "total" change and, thus, to very high "within / total" ratios.
These results show, that the IIGO and the VS index are quite good in proxying
International Outsourcing activities and the IITI index is not far behind. However,
the IITM index behaves not well and, thus, can be misleading measuring International
Outsourcing activities. After examining the quality of the indices in really capturing
International Outsourcing activities, the next section investigates the performance of
the different indices when they are used to estimate labor market adjustment effects.
5 Performance: Estimating Adjustment Effects
As mentioned above, empirical contributions failed to test some theoretical key aspects
of International Outsourcing. First, the result that International Outsourcing leads to
an increase of relative wages in labor intensive industries but to a decrease of relative
wages in capital intensive industries (shown e.g. by Arndt (1997, 1998a,b)). Since
most of the empirical investigations focus on the manufacturing sector, the effects that
International Outsourcing leads to an increase of relative wages of the high skilled in
the whole economy (mentioned e.g. by Feenstra and Hanson (1996a,b, 1999)) could
also not be shown. Rather, estimation results differ strongly due to the use of different
indices and, thus, a quite blurry picture emerges. In this section, several panel data
analysis are applied to investigate the labor market effects of different International
Outsourcing indices. Thus, this section investigates if the mismatch between theoretical
and empirical results can be due to measurement differences.
17

Data
The econometric analysis bases on the German Socio Economic Panel (covering the
years 1984-2006) and on input-output tables from the Federal Statistical Office in Ger-
many (covering the years 1991-2000). The input-output tables are used to calculate (i)
the International Outsourcing indices as described in section (2) and (ii) the output of
each industry (according to the 2-digit NACE classification). To estimate labor market
effects, the wage gap per industry is calculated on base of the SOEP data. With respect
to the waves H/8 to Q/17 (covering the years 1991-2000) the data includes information
on the wages of around 40,000 individuals. In the sample, wages are observed as aver-
aged real wages per hour, including additional payments like e.g. 13th or 14th month
pay, holiday or Christmas bonuses. Since the SOEP data assigns each individual to
the 2-digit NACE industry where she works and observes the education of each in-
dividual with respect to the international comparable ISCED classification, additional
information is provided to aggregate the individual data in order to obtain the desired
information on a macro level.14 To aggregate the individual wages, the mean average
within each 2-digit NACE industry is calculated, separated for high skilled and low
skilled labor.15 Thus, with the mean wage of high skilled as well as low skilled labor
in each 2-digit NACE industry, with the output of each industry and with the Interna-
tional Outsourcing activity proxied by one of the five indices, the wide version of the
desired panel data is completed and can simply be rearranged into the long version
needed for the econometric analysis below.16
Estimation and Results
To provide a first overview of the correlation structure between the different Interna-
tional Outsourcing indices, table 4 presents the correlation matrix.
As the table shows, the IITI and the IIGO index are highly correlated with a correlation
coefficient above 80 percent. The VS index is additionally similar to the IITI and IIGO
index with positive and high correlations as well. As mentioned above, the VAP index
is an inverse index of International Outsourcing with negative but also quite high
correlations with the IITI, the IIGO and the VS indices. By contrast, the IITM index is
14The "International Standard Classification of Education" (ISCED) from UNESCO (1997) provides a
standardized scheme classifying individuals in (1) primary education, (2) lower secondary educa-
tion or second stage of basic education, (3) secondary education, (4) post-secondary, non tertiary
education, (5) first stage of tertiary education or (6) second stage of tertiary education.15In line with the ISCED, low skill educated workers are defined as individuals with primary, lower
secondary or second stage of basic education whereas high skilled labor are individuals with some
form of post secondary education.16For detailed informations about the structure and the different variables of the SOEP see Haisken-
DeNew and Frick (2005).
18

Table 4: Correlation Matrix of the IndicesIITI IIGO VS VAP IITM
IITI 1.0000
IIGO 0.8867 1.0000
VS 0.6471 0.4378 1.0000
VAP −0.4126 −0.5124 −0.5038 1.0000
IITM −0.1164 −0.0711 −0.1521 0.0796 1.0000
also negatively correlated but with very low correlation coefficients.
To analyze the effects of International Outsourcing on the within industries’ wage
differential between high and low skilled workers,
lnWD jt = β0 + β1IOzjt + β2Y jt + u j + ε jt (8)
is estimated, with WD jt as the wage differential between high and low skilled work-
ers in industry j at time t. The explanatory variable of interest is the International
Outsourcing activity IOzjt measured with index z (z = IITM, IITI, IIGO, VS, VAP). As
control variable, the output of each industry Y jt is additionally included. The regres-
sion allows for an industry-level effect u j expected to be correlated with the exogenous
variables but not with the error term ε jt. Equation (8) is estimated for the different levels
of industry aggregation (whole economy, manufacturing industry, low skill industries,
high skill industries and the service industry) using the fixed-effects (FE) panel esti-
mator on the full sample. Since the level of International Outsourcing is expected to
vary over the industries and thus, the explanatory variables to be correlated with the
industry-level effect u j, it is indicated to use the FE estimator from an economic point
of view. In such cases, the FE estimator is assumed to be both, consistent and efficient.
However, to confirm the use of the FE estimator additionally from a statistical point
of view, the Hausman test is applied. The Hausman test analyzes the rejection of the
null hypothesis H0 assuming that the orthogonality condition of the u j, imposed by
a random-effect estimator, holds. As results show, H0 can be mostly rejected indicat-
ing that the consistent and efficient FE estimator should be used.17 Table 5 presents
the estimation results of the industries’ wage differential for the aggregated whole
economy.
17However, for some indices in some industries, the H0 can not be rejected at a significant level and,
thus, the RE estimator would lead to more efficient results. But even if the RE estimator would
be more efficient, the FE estimator is still consistent. On the other hand, when the RE estimator is
not efficient it is additionally not consistent. Thus, following the economic intuition and to decide
in favor of consistence and comparability, the FE estimator is also used in the few cases where the
RE estimator would be more efficient from a statistical point of view. However, all the models are
additionally estimated with the RE estimator. Differences in results are only marginal, not affecting
the core information.
19

Table 5: Effects of International Outsourcing on the Wage GapWhole Economy
Model 1.1
(IITM)
Model 1.2
(IITI)Model 1.3
(IIGO)
Model 1.4
(VS)
Model 1.5
(VAP)
IO0.0816
(1.52)
0.2122
(0.14)
10.8575∗∗
(2.25)
3.0250
(0.93)
−3.7565∗∗∗
(−2.83)
Y7.42e-06∗∗
(2.27)
8.04e-06∗∗∗
(2.50)
5.55e-06∗
(1.68)
6.76e-06∗∗
(1.95)
6.55e-06∗∗
(2.09)
Observations 342 383 385 385 385
Groups 42 47 48 48 48
R2 0.0238 0.0206 0.0349 0.0228 0.0431
Prob > F 0.0277 0.0307 0.0026 0.0210 0.0006
(t-Statistics in parantheses)
* / ** / *** significant at 10 / 5 / 1 percent
The effects of International Outsourcing are depicted by variable IO, depending on
the respective index. As the table shows, with each index (considering the inversity
of the VAP), International Outsourcing increases the wage differential between high
and low skilled workers within the aggregated whole economy. However, only for the
IIGO and the VAP, the increasing effect is additionally statistical significant (with a
t-Statistic of 2.25 and −2.83 respectively). The VS, the IITI and the IITM index confirm
the increasing effect on the wage gap, but not within the statistical significant range.
Thus, achieving significant results for the aggregated whole economy strongly depends
on the index used to proxy International Outsourcing.
Since the R-squares are still at a quite low level, the goodness of the overall model
does not seem to be very satisfying. Anyway, since the R-squares in longitudinal
analysis do not have all the properties of the OLS R-squares, they should be handled
with care and can be misleading when used as the main gauge for success.18 Thus, the
F-values that are with all estimation models significant at least on the 5 percent level
are additionally presented and show that the models are fitted well.
The next series of panel data estimations investigate the effects of International Out-
sourcing on the wage gap for more disaggregated industry levels. Table 6 presents the
results for the manufacturing and the service industry.
In the manufacturing industry, the positive effects obtained within the whole econ-
omy can not be confirmed. The estimated coefficients do not range within a common
significance level and are additionally varying in tendency. Even the models as a whole
18The OLS R-squares have the property of being equal to both, the squared correlation between y and y
and the fraction of the variation of y explained by y. This is a special property of OLS estimates. In
general, the squared correlation between y and y is not equal to the ratio of the variances. Thus with
panel-data analysis, the R-squares are mostly calculated as correlations squared in three variants:
overall, between and within. The R-squares in the tables 5 - 7 are the within-variants since they are
ordinary ones for FE estimations. But however, interpreting them as the main gauge for success of
the estimation can be misleading.
20
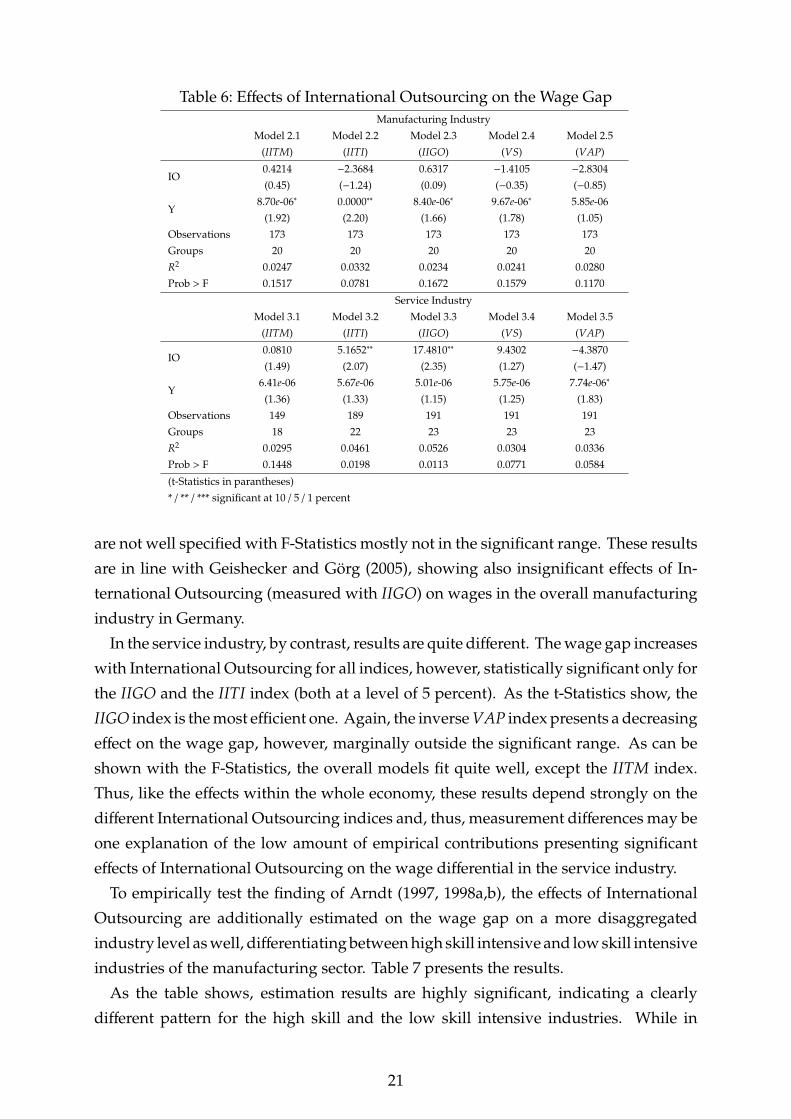
Table 6: Effects of International Outsourcing on the Wage GapManufacturing Industry
Model 2.1
(IITM)
Model 2.2
(IITI)Model 2.3
(IIGO)
Model 2.4
(VS)
Model 2.5
(VAP)
IO0.4214
(0.45)
−2.3684
(−1.24)
0.6317
(0.09)
−1.4105
(−0.35)
−2.8304
(−0.85)
Y8.70e-06∗
(1.92)
0.0000∗∗
(2.20)
8.40e-06∗
(1.66)
9.67e-06∗
(1.78)
5.85e-06
(1.05)
Observations 173 173 173 173 173
Groups 20 20 20 20 20
R2 0.0247 0.0332 0.0234 0.0241 0.0280
Prob > F 0.1517 0.0781 0.1672 0.1579 0.1170
Service Industry
Model 3.1
(IITM)
Model 3.2
(IITI)Model 3.3
(IIGO)
Model 3.4
(VS)
Model 3.5
(VAP)
IO0.0810
(1.49)
5.1652∗∗
(2.07)
17.4810∗∗
(2.35)
9.4302
(1.27)
−4.3870
(−1.47)
Y6.41e-06
(1.36)
5.67e-06
(1.33)
5.01e-06
(1.15)
5.75e-06
(1.25)
7.74e-06∗
(1.83)
Observations 149 189 191 191 191
Groups 18 22 23 23 23
R2 0.0295 0.0461 0.0526 0.0304 0.0336
Prob > F 0.1448 0.0198 0.0113 0.0771 0.0584
(t-Statistics in parantheses)
* / ** / *** significant at 10 / 5 / 1 percent
are not well specified with F-Statistics mostly not in the significant range. These results
are in line with Geishecker and Görg (2005), showing also insignificant effects of In-
ternational Outsourcing (measured with IIGO) on wages in the overall manufacturing
industry in Germany.
In the service industry, by contrast, results are quite different. The wage gap increases
with International Outsourcing for all indices, however, statistically significant only for
the IIGO and the IITI index (both at a level of 5 percent). As the t-Statistics show, the
IIGO index is the most efficient one. Again, the inverse VAP index presents a decreasing
effect on the wage gap, however, marginally outside the significant range. As can be
shown with the F-Statistics, the overall models fit quite well, except the IITM index.
Thus, like the effects within the whole economy, these results depend strongly on the
different International Outsourcing indices and, thus, measurement differences may be
one explanation of the low amount of empirical contributions presenting significant
effects of International Outsourcing on the wage differential in the service industry.
To empirically test the finding of Arndt (1997, 1998a,b), the effects of International
Outsourcing are additionally estimated on the wage gap on a more disaggregated
industry level as well, differentiating between high skill intensive and low skill intensive
industries of the manufacturing sector. Table 7 presents the results.
As the table shows, estimation results are highly significant, indicating a clearly
different pattern for the high skill and the low skill intensive industries. While in
21

Table 7: Effects of International Outsourcing on the Wage GapHigh Skill Industries
Model 4.1
(IITM)
Model 4.2
(IITI)Model 4.3
(IIGO)
Model 4.4
(VS)
Model 4.5
(VAP)
IO−0.0600
(−0.06)
4.4351∗
(1.70)
19.2405∗∗∗
(2.54)
20.6216∗∗∗
(4.04)
−12.9968∗∗∗
(−4.00)
Y9.37e-06∗∗
(2.27)
6.20e-06
(1.39)
3.34e-06
(0.72)
−5.43e-06
(−1.04)
−3.15e-06
(−0.64)
Observations 87 87 87 87 87
Groups 10 10 10 10 10
R2 0.0644 0.0989 0.1384 0.2314 0.2286
Prob > F 0.0825 0.0202 0.0038 0.0001 0.0001
Low Skill Industries
Model 5.1
(IITM)
Model 5.2
(IITI)Model 5.3
(IIGO)
Model 5.4
(VS)
Model 5.5
(VAP)
IO1.2567
(0.58)
−6.9474∗∗∗
(−2.59)
−24.1515∗∗
(−2.12)
−15.9718∗∗∗
(−2.88)
18.8228∗∗∗
(3.03)
Y7.21e-07
(0.03)
7.09e-06
(0.31)
9.94e-06
(0.42)
0.0000
(0.68)
0.0000
(0.71)
Observations 86 86 86 86 86
Groups 10 10 10 10 10
R2 0.0056 0.0841 0.0583 0.1017 0.1114
Prob > F 0.8135 0.0387 0.1082 0.0189 0.0127
(t-Statistics in parantheses)
* / ** / *** significant at 10 / 5 / 1 percent
the high skill intensive industries International Outsourcing significantly increases the
wage differential between high and low skilled workers, in the low skill intensive
industries International Outsourcing significantly reduces this wage gap. By contrast
to the results of the more aggregated industry levels, significant effects can be obtained
with almost every International Outsourcing index (except the IITM), only varying in
the level of significance. Thus, these results confirm the theoretical findings of Arndt
(1997, 1998a,b) and, since they do not depend as strong on measurement differences as
the more aggregated sectors, may be due to the panel data estimation focusing more
directly on the within industries wage gap.
Before turning to the concluding remarks, the main findings of the panel data estima-
tion are summarized. Based on the SOEP data, the within industries’ wage differential
between high and low skilled labor is regressed on the output and the International
Outsourcing activity of an industry. Since most of the existing literature estimates the
effects of International Outsourcing on the change in wages or unemployment, this
form of estimation (considering the wage gap as endogenous variable) differs slightly
and focuses more directly on the above mentioned theoretical questions. As it turns out,
results confirm several theoretical findings but differ strongly with respect to the differ-
ent International Outsourcing indices. The IITM yields only insignificant results and
thus, should not be used to estimate adjustment effects of International Outsourcing.
The three indices IITI, IIGO and VS yield quite similar result and show good properties
22

when being used in econometrical panel data analysis. The IIGO index leads to the
best performance in more aggregated industries and, thus, can be used to show that
the wage gap significantly increases in the whole economy. The results of Arndt (1997,
1998a,b) that the wage gap increases in the high skill intensive industries but decreases
in the low skill intensive ones can be shown with almost every index and, thus, is only
minor related to measurement differences. Instead, this may be due to the more direct
estimation of International Outsourcing on the within industry wage gap. The inverse
VAP index also yields significant results and, thus, may be used in econometrical anal-
ysis as well. Additionally, results show that International Outsourcing also increases
the wage gap in the service industries.
6 Conclusions
Since the 1990s, labor market adjustment effects of International Outsourcing are in the
focus of many theoretical and empirical investigations. While a lot of effects stated
by theory could be confirmed with empirical estimations, there exist some important
adjustment effects where empirical contributions failed to confirm theory: These are
the results that International Outsourcing increases relative wages in labor intensive
industries, but decreases relative wages in capital intensive industries (shown by Arndt
(1997, 1998a,b)), and that International Outsourcing leads to an increase of the relative
wage of high skilled labor at the aggregated whole economy level (shown e.g. by
Feenstra and Hanson (1996a,b, 1999)). Since there is a lack of possibilities to observe
International Outsourcing on a macro level, several indices got developed and a few
of them are very common in use. Thus, empirical results differ strongly what addi-
tionally confuses the puzzle. This contribution investigates five different International
Outsourcing indices to address the question if the mismatch between theoretical and
empirical findings may be due to measurement differences.
With a four-step analysis, the design of the indices, the behavior when they are used
as descriptive measurements, the quality in really capturing International Outsourcing
activities, and the performance of the indices are examined when it comes to economet-
rical estimations of labor market adjustment effects. The applied estimation technique
differs slightly from other contributions. With a fixed effect panel data estimation us-
ing the German SOEP data for the period 1991-2000 the within industries wage gap is
regressed on the output and the International Outsourcing activity of an industry. As it
turns out, with consideration of the differences of the International Outsourcing indices
and with this kind of panel data estimation, results confirm both theoretical findings.
The wage differential between high and low skilled labor significantly increases in the
whole economy, the service industry, the high skill intensive industries, but not in the
low skill intensive industries. There International Outsourcing lowers the wage gap.
23

As the comparative analysis shows, the IIGO index may obtain good results for
more aggregated industry levels like the whole economy and the service sector, while
the IITI and the VS index behave quite well for disaggregated industry structures
within the manufacturing industry. However, all three indices are defined as very
direct proxies of International Outsourcing with a high quality of really capturing
International Outsourcing activities and a good performance in econometrical analysis
as well. Also the more indirect, inverse measure VAP proxies International Outsourcing
quite well and turns out to achieve significant results when being used in the panel data
estimation. By contrast, with the IITM index, difficulties arise within the theoretical
design leading to measurement problems and a low quality of the index in capturing
International Outsourcing activities. As a result, the econometrical performance of the
index is relatively low.
Since significant effects of International Outsourcing on the wage gap within the
whole economy can only be obtained with the IIGO and the VAP index, measurement
differences turn out to be crucial to test effects on aggregated industry levels. By con-
trast, the result of Arndt (1997, 1998a,b) does not depend as strong on the use of different
indices. Thus, this result may depend on the more direct way of estimating adjustment
effects. With this contribution, the concluding remark of Arndt (1997) is empirically
confirmed: the aggregated welfare-reducing effects of International Outsourcing on
low-skilled workers may be exaggerated since their relative wages decrease in high
skill intensive industries but increase in low skill intensive ones. However, since Inter-
national Outsourcing increases also the wage gap within the service sector, there may
be forces at work worsening low skilled labor in the tertiary sector and, thus, even in
the aggregate. Due to the quite low magnitude but the strong increase of International
Outsourcing in the service industry, this problem may be magnified soon with Service
Outsourcing reaching higher levels.
24

References
Amiti, M. and S.-J. Wei (2004). Fear of service outsourcing: Is it justified? NBER
Working Paper 10808.
Amiti, M. and S.-J. Wei (2005). Service offshoring, productivity, and employment:
Evidence from the united states. IMF Working Paper WP / 05 / 238.
Arndt, S. W. (1997). Globalization in the open economy. North American Journal of
Economics and Finance 8 (1), 71–79.
Arndt, S. W. (1998a). Globalization and the gains from trade. Koch, K. - J. and K.
Jaeger (eds.), Trade, Growth, and Economic Policy in Open Economies: Essays in honor of
Hans-Jürgen Vosgerau, 3–12.
Arndt, S. W. (1998b). Super-specialization and the gains from trade. Contemporary
Economic Policy 16, 480–485.
Bardhan, A. D. and C. A. Kroll (2003). The New Wave of Outsourcing, Research Report,
Fischer Center for Real Estate and Urban Economics. University of California, Berkely.
Berman, E., J. Bound, and Z. Griliches (1993). Changes in the demand for skilled labor
within u.s. manufacturing: Evidence from the annual survey of manufacturing.
NBER Working Paper 4255.
Bofinger, P. (2005). Wir sind besser, als wir glauben: Wohlstand für alle. München.
Burda, M. and B. Dluhosch (2001). Fragmentation, globalization and labour markets.
GEP Research Paper Series, Research Paper 2001 / 5.
Burda, M. and B. Dluhosch (2002). Cost competition, fragmentation, and globalization.
Review of International Economics 10 (3), 424–441.
Campa, J. and L. S. Goldberg (1997). The evolving external orientation of manufaturing
industries: Evidence from four countries. NBER Working Paper 5919.
Chen, H., M. Kondratowicz, and K.-M. Yi (2005). Vertical specialization and three facts
about U.S. international trade. North American Journal of Economics and Finance 16,
33–59.
Deardorff, A. V. (2001a). Fragmentation across cones. Arndt, S. W and H. Kierzkowski
(eds.): Fragmentation: New Production Patterns in the World Econmy, Oxford, 35–51.
Deardorff, A. V. (2001b). Fragmentation in simple trade models. North American Journal
of Economics and Finance 12, 121–137.
25

Egger, H. (2003). Outsourcing in a Global World. University of Zürich, Dissertation.
Egger, H. and P. Egger (2002). How international outsourcing drives up eastern euro-
pean wages. Weltwirtschaftliches Archiv 138, 83–96.
Egger, H. and P. Egger (2003). On market concentration and international outsourcing.
Applied Economics Quarterly 49, 49–64.
European Economic Advisory Group (2005). Outsourcing. CESifo (eds.): Report on the
European Economy, Chapter 2, 39–50.
Feenstra, R. C. (1998). Integration of trade and disintegration of production in the
global economy. Journal of Economic Perspectives 12 (4), 31–50.
Feenstra, R. C. and G. H. Hanson (1996a). Foreign investment, outsourcing, and relative
wages. Feenstra, R. C. and G. M. Grossman and Irwin, D. A. (eds.), The Political Economy
of Trade Policy, Essays in Honor of Jagdisch Bhagwati, 89–127.
Feenstra, R. C. and G. H. Hanson (1996b). Globalization, outsourcing, and wage
inequality. American Economic Review 86, 240–245.
Feenstra, R. C. and G. H. Hanson (1997). Foreign direct investment and relative wages:
Evidence from Mexico’s maquiladoras. Journal of International Economics 42, 371–393.
Feenstra, R. C. and G. H. Hanson (1999). The impact of outsourcing and high-technology
capital on eage estimates for the united states, 1979-1990. Quarterly Journal of Eco-
nomics 114, 907–940.
Geishecker, I. and H. Görg (2005). Do unskilled workers always lose from fragmenta-
tion. North American Journal of Economics and Finance 16, 81–92.
Haisken-DeNew, J. P. and J. R. Frick (2005). Desktop Companion to the German Socio-
Economic Panel. Available at www.diw.de/deutsch/sop/service/dtc/dtc.pdf.
Hamermesh, D. S. (1993). Labor Demand. Princeton, New Yersey: Princeton University
Press.
Hijzen, A., H. Görg, and R. C. Hine (2004). International outsourcing and the skill
structure of labour demand in the United Kingdom. IZA Discussion Paper 1249.
Hummels, D., J. Ishii, and K.-M. Yi (2001). The nature and growth of vertical special-
ization in world trade. Journal of International Economics 54, 75–96.
Jones, R. W. and H. Kierzkowski (1990). The role of services in production and inter-
national trade: A theoretical framework. Jones, R. W. and A. O. Krueger (eds.), The
Political Economy of International Trade, Essays in Honor of Robert E. Baldwin, 31–48.
26
Jones, R. W. and H. Kierzkowski (2001a). A framework for fragmentation. Arndt, S. W.
and Kierzkowski, H. (eds), Fragmentation, New Production Patterns in the World Economy,
17–34.
Jones, R. W. and H. Kierzkowski (2001b). Globalization and the consequences of
international fragmentation. Calvo, G. A., R. Dornbusch, and M. Obstfeld (eds.), Money,
Capital Mobility, and Trade: Essays in Honor of Robert A. Mundell, 365–383.
Jones, R. W. and H. Kierzkowski (2004). International trade and agglomeration: An
alternative framework. HEI Working Papers No: 10/2004.
Jones, R. W. and H. Kierzkowski (2005). International fragmentation and the new
economic geography. North American Journal of Economics and Finance 16, 1–10.
McKinsey Global Institute (2003). Offshoring: Is it a Win-Win Game. San Francisco:
McKinsey Global Institute.
Sinn, H.-W. (2003). Der kranke Mann Europas: Diagnose und Therapie eines Kathed-
ersozialisten. Deutschland-Rede, Stiftung Schloss Neu Hardenberg, Live Übertragung im
Deutschland Ratio am 15. November 2003, Manuskript: www.ifo.de.
Sinn, H.-W. (2005). Basar-Ökonomie Deutschland: Exportweltmeister oder Schlus-
slicht. ifo Schnelldienst, Sonderausgabe.
Statistisches Bundesamt (2004). Volkswirtschaftliche Gesamtrechnung, Input-Output-
Rechnung: Importabhängigkeit der deutschen Exporte 1991, 1995, 1998 bis 2000 und 2002.
Strauss-Kahn, V. (2003). The role of globalization in the within-industry shift away
from unskilled workers in France. NBER Working Papers 9716.
UNESCO (1997). International Standard Classification of Education.
Yeats, A. J. (2001). Just how big is global production sharing? Arndt, S. W. and H.
Kierzkowski (eds.): Fragmentation, New Production Patterns in the World Economy, 108–
143.
27

Appendix I: Matrix Algebra to calculate the Indices
from Input-Output Tables
To calculate the different International Outsourcing indices from input-output tables,
the equations shown in section (2) have to be transferred into some matrix algebra. The
necessary formulas are presented in this appendix.
For the IITM index use
IITMt = u′i[u′m]−1 (9)
with i as the z × 1 vector of inputs imported by industry j, m as the n × 1 vector of total
imports from industry w (n = z) and u is the n × 1 vector of 1’s. Thus, IITMt is the
industries’ j share of imported inputs to total imports at time t.
To calculate IITI from input-output tables one can use
IITIt ≡ u′i[u′x]−1=u′i[u′(i + d)]−1 (10)
with i as the n × 1 vector of imported inputs used by industries j, d as the n × 1 vector
of total inputs used by industries j and u as a n × 1 vector of 1’s. The n × 1 vector of
total inputs in industries j can be calculated by x = i + d.
For the IIGO index use
IIGOt = u′i[u′o]−1 (11)
with i as the n × 1 vector of imported inputs used by industries j, o as the n × 1 vector
of gross output of the industries j and u as n × 1 vector of 1’s.
To obtain the VS index from input-output tables,
VSt = (diag(p−1))[diag[diag(m)(d−1)]Q]′ (12)
can be used, with m as the (z×1) vector of imports, d as the (z×1) vector of domestically
used goods, Q the (z×n) matrix of all inputs (domestically produced as well as imported)
and p the (n × 1) vector of total production. The single elements of the resulting (n × z)
28

matrix VSt reflect the imported inputs from industry w embodied in the production of
industry j and thus need to get additionally aggregated over the w = 1 . . . z goods.
Finally, VAP can be calculated from input-output tables using
VAPt = u′v[u′p]−1 (13)
with v as the n × 1 vector of value added, p as the n × 1 vector containing the values of
production and u as a n × 1 vector of 1’s.
Appendix II: Differentiating between High and Low Skill
Intensive Industries
To separate the industries of the manufacturing sector into high skill intensive and low
skill intensive ones, the paper refers to a cluster analysis done by Geishecker and Görg
(2005). Following a k-means cluster analysis technique (with the use of a standard
Euclidean distance measure) they group industries with respect to the education of
the workers within a specific industry. Table 8 presents the classification result on the
2-digit NACE aggregation level.
Table 8: Classification of high Skill and Low Skill IndustriesSource: Geishecker and Görg (2005)
Industry NACE
Food products and beverages/tobacco 15
Textiles 17
Wearing apparel 18
Low
Skill
Indu
stri
es
Tanning, dressing of leather 19
Wood products, except furniture 20
Pups, paper and paper products 21
Coke, refined petroleum 23
Rubber and plastic products 25
Other non metallic mineral products 26
Fabricated metal products 28
Furniture; manufacturing n.e.c. 36
Publishing, printing and reproduction 22
Chemicals and chemical products 24
Basic metals 27
Hig
hSk
illIn
dust
ries
Machinery and equipment 29
Office machinery and computer 30
Electrical machinery and apparatus 31
Radio, television and communication 32
Medical, precision and optical instrum. 33
Motor vehicles, trailer 34
Other transport equipment 35
29

Appendix III: The Inversity of the IITM Index
Considering the whole economy, the IITM index is defined as i/m with i as imported
inputs and m as total imports. To calculate the percentage change of IITM from 1991
to 2000, one can use the index formulaIITM2000
IITM1991. The index will decrease if IITM2000 <
IITM1991.
IITM2000 < IITM1991i2000
m2000<
i1991
m1991
i2000
i1991<
m2000
m1991
i2000 − i1991
i1991<
m2000 −m1991
m1991
dii1991
<dm
m1991
i < m
Thus, if the percentage change of i (i) is smaller than the percentage change of m (m),
the percentage change of the IITM index is negative ( ˆIITM < 0) though International
Outsourcing (as imported inputs i) is still positive. This was exactly the case for the
considered time period in the German economy.
As an example, one can focus on the raw data for the German economy from 1991-
2000: The amount of International Outsourcing i in 1991 was 206, 789 (in Mill. EUR) and
it increased with di = 137, 971 to an amount of 344, 760 leading to an percentage change
of i = 0.67. Total imports m in 1991 were observed with 362, 020 and increases with
dm = 260, 780 to an amount of 622, 800, leading to an percentage change of m = 0.72.
Thus, m > i leading to a decrease of the IITM index though International Outsourcing
i increased.
30