labor market competition with immigrants and party choice
TRANSCRIPT

Labor Market Competition with Immigrants andParty Choice: Evidence From A Skill-Cell Approach∗
Henning Finseraas†, Marianne Røed‡, and Pal Schøne§
October 28, 2015
Abstract
Most research on the political consequences of immigration highlights the roleof cultural animosity rather than labor market competition. We challenge this posi-tion by pointing to important problems with the operationalization of labour marketcompetition in most of the existing literature. To overcome these problems we relyon Borjas’ skill-cell approach, which incorporates that labour market competition istwo-dimensional and depends on the combination of education level and potentialexperience in the labor market. By access to detailed administrative data coveringthe whole Norwegian population, we get a precise measure of each skill-cells’ ex-posure to immigration and relate this measure to voting behaviour in five nationalelections. We find results which support labor market competition theory, and ev-idence of a polarizing effect of immigration on vote shares. The polarizing effectpoints to the existence of a protectionist and a compensatory response to labourmarket competition with immigrants.
∗We would like to thank...Grant number 236801 (Research Council of Norway) is acknowledged. Partof the data used in this paper is provided, prepared and made available by the Norwegian Social ScienceData Service (NSD). NSD is not responsible for the analyses/interpretation of data presented here.†Henning Finseraas (corresponding author): Institute for Social Research, P.box 3233 Elisenberg, 0208
Oslo, Phone: +47 95169855, Norway e-mail: [email protected].‡Institute for Social Research, [email protected].§Institute for Social Research, [email protected].
1 Introduction
Immigration into and within Europe has increased rapidly over the last 25 years. Norway
is no exception. Over the period we analyze in this paper (1993-2009), the immigrant
share of the population increased from 5 to 10 per cent. Parallel with the increase, the
composition of the immigrant population is increasingly dominated by immigrants from
low-income countries. Over the same period, a very heterogenous set of anti-immigration
parties have increased their vote shares or consolidated their positions in national par-
liaments across Europe. The Austrian Freedom Party (FPO), the Danish People’s Party
(DF), and the Swiss People’s Party (SVP) are prominent examples. Fremskrittspartiet
(FrP), Norway’s main anti-immigration party, increased its vote share from 6.3 percent
in 1993 to 22.9 percent in 2009. After the 2013 election, they entered the government
offices as a coalition partner to Høyre (H), the main conservative party. Concerns among
segments of the electorate about the consequences of immigration is one obvious reason
for the improved position of anti-immigration parties. During the 1990s, FrP was the only
alternative for voters opposing immigration, and although the social democratic party Ar-
beiderpartiet (Ap) advocated strict immigration policies when in government 2005-2013,
FrP remains the issue owner of immigration issues in election campaigns (Karlsen and
Aardal 2007).
Broadly speaking, there are two schools in the academic literature on why people op-
pose immigration. The first has its theoretical underpinnings in economics and argues that
the economic consequences of immigration, in particular downward pressure on wages, is
an important explanation for opposition to immigration (e.g. Mayda 2006). The second
school draws from sociology and psychology, and argues that the cultural consequences
of immigration is the main driver of anti-immigration sentiments (e.g. Sides and Citrin
2007). This paper is situated in the first school. However, we stress throughout the pa-
per that we believe that a horse-race between these two approaches is a flawed way to
approach this issue, as economic and cultural drivers obviously can operate at the same
time.
2

Specifically, we study the importance of downward pressure from immigration on na-
tives’ wages and employment opportunities on vote shares. To emphasize labour market
competition with immigrants as important for political behaviour is highly controver-
sial. In their review of the literature on immigration attitudes, Hainmueller and Hopkins
(2014) argue that labour market competition theory has been debunked as important for
immigration attitudes. According them, labour market competition theory is a “zom-
bie theory” (pg. 241) due to its resilience in the literature despite its limited empirical
support.
We argue that Hainmueller and Hopkin’s (2014) position needs to be reassessed. The
key challenge when assessing the importance of labour market competition is to identify
voters who compete with immigrants on the labour market. Unfortunately, the previous
literature has relied on too coarse measures of exposure to competition. Typically binary
indicators of whether the voter is low-skilled or high-skilled has been used, and these
indicators have been directly derived from the respondents’ level of education (Scheve
and Slaughter 2001; Mayda 2006; Hainmueller and Hiscox 2007, e.g.). As we spell out
below, the labour economics literature on wage effects of immigration has for long argued
that we need to take into account not only level of education, but also labour market
experience when identifying who is competing with immigrants (Borjas 2003). It is no
surprise that labour market theory has received scant support if its key variable has been
poorly defined.
We follow Borjas (2003) and identify voters competing with immigrants on the labour
market by classifying voters into different skill cells. Bratsberg et al. (2014) use this
approach on Norwegian data and find negative wage effects of immigration for natives
with similar skills as the immigrants. We use the same high quality, population-wide ad-
ministrative data as Bratsberg et al (2014) to show that an increasing level of immigrants
within ones skill cell is associated with decreasing wage levels over the period we study.
Next we theorize how the labour market consequences of competition will influence
party choice. We point to the common expectation that the anti-immigrant party FrP will
become more attractive as voters exposed to competition will decrease immigration (the
3

protectionist response), but we also highlight the potentially offsetting effect of increased
demand for income redistribution and regulation of the labour market (the compensatory
response). Although we expect the former to dominate the latter, voter polarization is
one potential empirical implication of immigration.1
Our analysis of the vote share of FrP provide robust evidence that labour market
competition is important for party choice. A one SD increase in the share of immigrants
within a skill cell is associated with a two percentage points increase in FrP’s vote share.
This OLS estimate is robust to a set of controls and remains when applying an IV-
approach to account for potential selection problems into skill cells. The point estimate
is larger for share of EU immigrants than for non-Western immigrants, further pointing
to labour market competition as being important.
The analyses of vote shares for other parties show, however, that the impact of im-
migration is more complicated than just fueling anti-immigration voting. We find that
immigration is associated with decreasing vote shares for FrP’s main competitors on the
left (Ap) and on the right (H). However, we also find a positive relationship with the
vote share of Sosialistisk Venstreparti (SV); a New Left, pro-immigration party. Thus,
we find signs of a polarizing effect of immigration, moving voters away from the political
center. Using individual level panel data, we show that ideological predispositions prior
to the immigration shock are important for how individuals respond to the shock. Those
holding leftist positions on both immigration and economics prior to the shock are more
likely to vote for SV. Our interpretation is that voters with this particular ideological pre-
disposition demand more social protection and regulation when facing competition from
immigrants, making FrP voting an unattractive vote choice. We consider the polarizing
effect of immigration to be an important finding of the paper, and in the conclusion we
elaborate on the theoretical and empirical implications of this result.
1The offsetting effect implies that the expected net effect on FrP’s vote share depends on the welfarestate platforms of competing parties, a point missed in the previous empirical literature.
4

2 Labor Market Competition with Immigrants and Voting
Immigration and Wages
Standard neoclassical labor market theory says that an increase in the supply of one
type of skill has a negative effect on the marginal product of that skill. In a competitive
labor market, wages are set by the marginal product, thus workers holding the skill which
has increased in supply will experience a decrease in their wage level. The effects are
the exact opposite for workers with skills that are complementary to the skill which has
increased, thus they should expect a wage increase. The implication is that the effect of
immigration on individuals’ wages depends critically on immigrants’ skills. To the degree
that immigrants are mainly substitutes (complements) for natives, wage effects will be
negative (positive). In addition to potential effects on wages, immigration might also
push natives out of the labor market.
There are two main approaches to the empirical study of immigration and wages.
One approach is the area-approach, which takes advantage of geographical variation in
immigration and study its relationship to wages in the area (e.g. Card 1990). The second
approach is to use identify workers who are exposed to competition from immigrants and
study their wage development. Borjas’ (2003) skill cell approach, which we rely on in this
paper, belongs to the second class of studies.
The skill cell approach was developed as a response to some troublesome aspects of the
area approach in wage studies.2 A key concern in area studies is the endogenous sorting
of immigrants and natives according to characteristics of the local labor market. When
people move in response to immigration, immigration influences wages in all regions, not
just the region experiencing the shock (Borjas 2003). This implies that it is difficult to
identify wage effects of immigration using the area approach and it calls for a national
rather than a regional approach to identify wage effects. This reasoning is transferable to
studies of the political effects of immigration, in particular if one is interested in labour
2A vast research literature in labor economics using the area approach–although of which the greaterpart is based on US data–often find small and often insignificant wage effects of immigration, yet effectstend to be more negative in the European studies (See Okkerse 2008, for a review).
5

market competition as the mechanism of the political effects.
The skill-cell approach allocates individuals to 32 skill groups defined by the combi-
nation of educational attainment and potential labor market experience.3 Defining skill
group by the combination of education and experience incorporates the idea that work-
ers with the same level of education, but different levels of experience, is unlikely to be
perfect substitutes on the labour market (Borjas 2003, 1339). The “two-dimensionality”
of the skill cell approach is particularly important when studying the wage effects of im-
migration because even skills cells within the same level of education tend to experience
different levels of immigrant competition. The different exposure to immigration across
skill cells with the same level of education–which we document for Norway in Figure 1
below–implies that level of education is a poor proxy for exposure to competition. Thus,
it is ill-suited to identify effects of competition.
Another beneficial aspect of the skill cell approach is that it is more difficult to “escape”
your skill cell if exposed to competition than it is to escape a geographic area, industry
or occupation which is exposed to immigration.4 This eases the need for an instrumental
variables approach to identify effects of immigration, in particular when we follow skill
cells over time, as we do below. However, there might still be concerns about immigrant
selection to skill cells with a positive wage development, which, if not accounted for, will
cause a downward bias in the wage estimates (Borjas 2003). In a robustness check we
rely on an IV-approach to study the severity of this bias.
It is important to keep in mind that the estimated wage effect using Borjas’ (2003)
skill cell approach is the partial effect of immigration. The partial effect is the impact
of immigration on the wages of workers with similar skills as the newcomers, given the
supply of other factors and aggregated supply. In recent years, Ottaviano and Peri (2012)
and others, have moved beyond the partial effect and attempt to estimate the total effect
of immigration. When estimating the total effect one aims to account for immigration-
induced changes in the supply of other factors, as well as the possibility for natives and
immigrants to be imperfect substitutes within skill groups. Ottaviano and Peri’s estimate
3See Bratsberg et al. (2014) for a study of wage effects of immigration on Norwegian data.4But see Ottaviano and Peri (2012).
6

of the short-run impact of immigration on native wages is negative, but smaller than the
one reported in Borjas (2003).5
Finally, a major topic of discussion in the recent empirical literature is whether immi-
grant and native labor within the same skill cell are close substitutes in production, which
is a key assumption in Borjas’ approach. A set of papers analyzing US data conclude that
the evidence points in the direction of perfect substitution Borjas (2003); Borjas, Grogger,
and Hanson (2010); Aydemir and Borjas (2007); Jaeger (1996), while others find indica-
tions of imperfect substitution (Ottaviano and Peri 2012, 2008; Manacorda, Manning, and
Wadsworth 2012). Bratsberg et al’s (2014: 379ff) study on Norwegian data is the most
relevant in our case, and they find a high degree of substitutability between natives and
immigrants with similar skills.
Immigration and Voting
The negative effect on wages and positive effect on the risk of unemployment imply that
immigration might have effects on policy preferences. Most intuitively, we should expect
support for liberal immigration policies to be affected. Unless workers were fully aware of
the effects of immigration prior to immigration taking place, we should expect support for
immigration of similar skill-type workers to change in a more restrictive direction when
the detrimental effects manifest.6 Voters respond to the negative effects of immigration
by demanding restrictions of entry, i.e a protectionist, insider response.
However, immigration-induced negative effects on wages and heightened risk of un-
employment might also influence support for public transfers. We might label this a
compensatory or regulatory response. Standard models predict that support for income
redistribution will increase if wages fall and risk of unemployment increases (e.g. Cusack,
Iversen, and Rehm 2006). The theoretical expectation for how support for social insur-
ance will change is less straightforward. For a given risk of unemployment, a drop in
wage income will lead to lower support for social insurance because workers become more
5With regard to the total effect, their estimates for the US between 1990 and 2006 reduced the averagenative wage by 0.4 percent in the short run but increased the native wage by 0.6 percent in the long run.
6Support for immigration of skill-types which are complementary to their own, might however changein a positive direction.
7
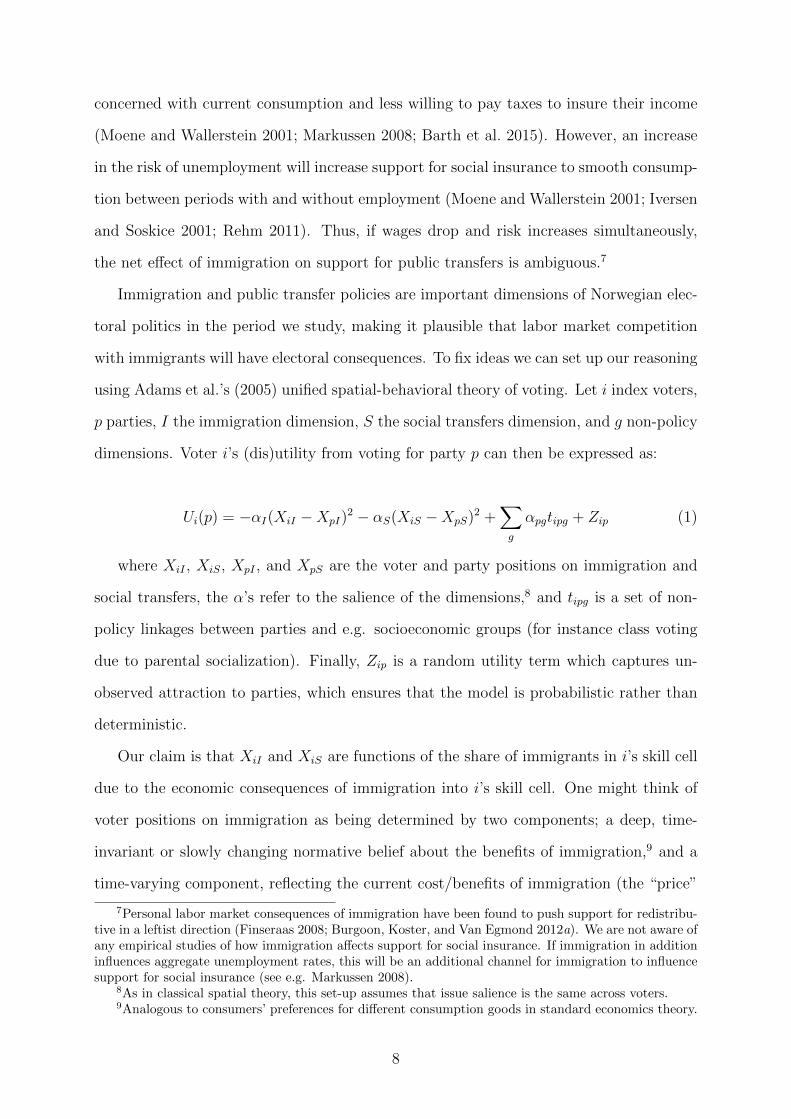
concerned with current consumption and less willing to pay taxes to insure their income
(Moene and Wallerstein 2001; Markussen 2008; Barth et al. 2015). However, an increase
in the risk of unemployment will increase support for social insurance to smooth consump-
tion between periods with and without employment (Moene and Wallerstein 2001; Iversen
and Soskice 2001; Rehm 2011). Thus, if wages drop and risk increases simultaneously,
the net effect of immigration on support for public transfers is ambiguous.7
Immigration and public transfer policies are important dimensions of Norwegian elec-
toral politics in the period we study, making it plausible that labor market competition
with immigrants will have electoral consequences. To fix ideas we can set up our reasoning
using Adams et al.’s (2005) unified spatial-behavioral theory of voting. Let i index voters,
p parties, I the immigration dimension, S the social transfers dimension, and g non-policy
dimensions. Voter i’s (dis)utility from voting for party p can then be expressed as:
Ui(p) = −αI(XiI −XpI)2 − αS(XiS −XpS)2 +
∑g
αpgtipg + Zip (1)
where XiI , XiS, XpI , and XpS are the voter and party positions on immigration and
social transfers, the α’s refer to the salience of the dimensions,8 and tipg is a set of non-
policy linkages between parties and e.g. socioeconomic groups (for instance class voting
due to parental socialization). Finally, Zip is a random utility term which captures un-
observed attraction to parties, which ensures that the model is probabilistic rather than
deterministic.
Our claim is that XiI and XiS are functions of the share of immigrants in i’s skill cell
due to the economic consequences of immigration into i’s skill cell. One might think of
voter positions on immigration as being determined by two components; a deep, time-
invariant or slowly changing normative belief about the benefits of immigration,9 and a
time-varying component, reflecting the current cost/benefits of immigration (the “price”
7Personal labor market consequences of immigration have been found to push support for redistribu-tive in a leftist direction (Finseraas 2008; Burgoon, Koster, and Van Egmond 2012a). We are not aware ofany empirical studies of how immigration affects support for social insurance. If immigration in additioninfluences aggregate unemployment rates, this will be an additional channel for immigration to influencesupport for social insurance (see e.g. Markussen 2008).
8As in classical spatial theory, this set-up assumes that issue salience is the same across voters.9Analogous to consumers’ preferences for different consumption goods in standard economics theory.
8

of immigration). Similarly for position on social transfers. Holding platforms, salience,
and position on other dimensions constant, voters move closer to the position of the party
with a restrictive immigration policy platform when facing labour market competition
from immigrants. In the Norwegian context these voters should become more likely to
vote for FrP, which is the anti-immigration party in Norwegian politics.10 Obviously, party
platforms are not constant, and will shift with shifts in voter preferences.11 Thus, voters
exposed to competition with immigrants have to shift further in a restrictive direction
than the parties, e.g. ∆XiI > ∆XpI , in order for voter utilities to change. Below we
explain why this is plausible in our case.
The immigration-induced positive shift in the utility from FrP’s platform might be
lower if XiS is a function of share of immigrants. This is because increased risk of unem-
ployment will push XiS to the left, which will decrease the utility from FrP’s platform for
most voters, since FrP’s position on social transfers is to the right of center. During the
1970s and 1980s, FrP advocated a right-libertarian position on the welfare state, but they
have since moved away from this position. Today they have no clear ideological position
on the welfare state, which differentiates them from the main anti-immigration parties in
Sweden and Denmark.12 In this case, |∆XiI | > |∆XiS| has to hold for ∆Ui(FrP ) > 0
(again holding party positions constant). If, however, the main effect on XiS is through
lower wages, immigration will cause a shift to the right on the social transfer dimension,
but to the left on redistribution. Depending on how sensitive demand for redistribution
and social insurance are to wage changes, the shift on the social transfer dimension will not
necessarily work against the positive shift in utility from closeness to FrP’s immigration
platform.
The ambiguous effects of immigration on XiS make it plausible that the protectionist
response outweigh the compensatory response so that the probability of voting for FrP
will increase from labour market competition with immigrants. However, since there are
10Here we assume that voters are forward-looking and votes sincerely, not strategically.11See Adams (2012) for a review of the literature.12FrP advocate lower tax rates and supports policies which makes the tax system less progressive,
however, due to Norway’s large oil fund they do not have to advocate cuts in social transfers to financethe tax cuts. The main anti-immigration parties in Sweden and Denmark have pro-welfare state positions.
9

two possible responses to the shock, one might envision that different groups of voters
choose different responses. One way to think of this choice is that your response depends
on your deep-held normative convictions, i.e. that the short-term effect is a function of
your normative views, or that normative views decide which policy dimension is being
“triggered” by the economic shock. Recent research on political responses to job loss
during the Great Recession indeed finds that the response depends on ideological predis-
positions (Margalit 2013). Thus, exploring the effects of immigration for different types
of parties is important.
Previous Empirical Research on Immigration and Political Behavior
Like the literature on immigration and wages, the literature on the electoral consequences
of immigration has relied on two strategies. The most popular approach is to take advan-
tage of geographical variation in immigration or ethnic diversity and study its relationship
to local political outcomes (see e.g. (Arzheimer 2009)). Sørensen (2015) analyzes the re-
lationship between immigration and Frp voting at the local level, using both aggregate
and individual level data. Utilizing a two-way fixed effects approach, he finds small,
short-term, positive effects of immigration shocks on Frp voting. Few studies attempt to
account for geographical sorting, but Halla et al. (2014) and Harmon (2014) are two re-
cent exceptions.13 Halla et al. (2014) study the relationship between share of immigrants
in the local community and voting for the Freedom Party of Austria (FPO). To give their
estimates a causal interpretation, they rely on a 2SLS-approach where they instrument
actual immigrant share with predicted immigrant share based on historical settlement
patterns. They find a positive relationship between immigrant share and FPO vote share,
in particular in areas with low- and medium-skilled immigration. Harmon (2014) studies
the relationship between immigration and party bloc vote shares. He too relies on a 2SLS
approach where he instruments the immigrant share with highrise homes’ share of the
13See also Enos (forthcoming) and Dahlberg, Edmark, and Lundqvist (2012). Enos (forthcoming)relies on a large restructuring of public housing in Chicago to identify how proximity to Blacks causesConservative voting behavior among Whites. Proximity to long-term minorities is a different issue thanimmigration, in particular when interested in the labour supply effects of immigration. Dahlberg etal. (2012) use a Swedish refugee placement policy to identify a negative effect of ethnic diversity onpreferences for redistribution, but they do not study its impact on vote choices.
10

1970 housing stock, and finds that immigration increases the right-wing bloc’s vote share.
These studies have designs which makes it plausible that they identify causal effects of
immigration. However, since they follow areas over time they are ill-suited as tests of to
what degree labour market competition is the mechanism behind the results.
The second strategy attempts to directly identify competition at the individual level
and examine its relationship to political views. The early, seminal, papers using this
approach (Scheve and Slaughter 2001; Mayda 2006) use level/years of education as a proxy
for exposure to competition. Both papers find that low-skilled workers are more likely
to oppose liberal immigration policies. Moreover, both papers rely on the area approach
to study heterogeneity in the education-preference relationship. Scheve and Slaughter
(2001) find no evidence that the education-preference relationship depends on the size of
the immigration population in the local labor market, but Mayda (2006) find that high
educated workers are relatively more pro-immigration in countries where immigrants have
a skill-mix in their favor.
Due to these studies, and others, there is a consensus in the empirical literature that
low-skilled workers are less supportive of liberal immigration policies (see e.g. Hainmueller
and Hopkin’s (2014) review of the literature.) However, there is disagreement over to what
degree these findings reflect labor market competition with immigrants. Some argue that
educational differences in immigration preferences reflect tolerance, openness and political
correctness, pointing to empirical findings that highly educated workers are more likely
to support immigration of all skill-types, including skills they compete with (Hainmueller
and Hiscox 2007, 2010; Hainmueller, Hiscox, and Margalit forthcoming).
Level of education is, however, a coarse measure of exposure to competition. Some
recent papers use more specific measures of exposure to immigrant competition and find
support for competition theory (Ortega and Polavieja 2012; Pecoraro and Ruedin 2014;
Malhotra, Margalit, and Mo 2013).14 Most notably, Ortega and Polavieja (2012) iden-
tify variation in exposure through survey items regarding how much on-the-job training
which is necessary to conduct their job, and how important manual and communicative
14In addition, Finseraas, Pedersen, and Bay (forthcoming) find that educational differences in immi-gration opinions change with the business cycle in a manner consistent with competition theory.
11
skills are in their job. They find that those holding communicative skills are particularly
likely to support immigration, also when they attempt to account for endogeneity. Pec-
oraro and Ruedin (2014), using Swiss panel data, find a negative relationship between
increases in proportion foreign-born within one’s occupation and wages and support for
equal opportunities for foreigners.15 Neither of these studies examine party choice.
3 Empirical Strategy
Skill cells
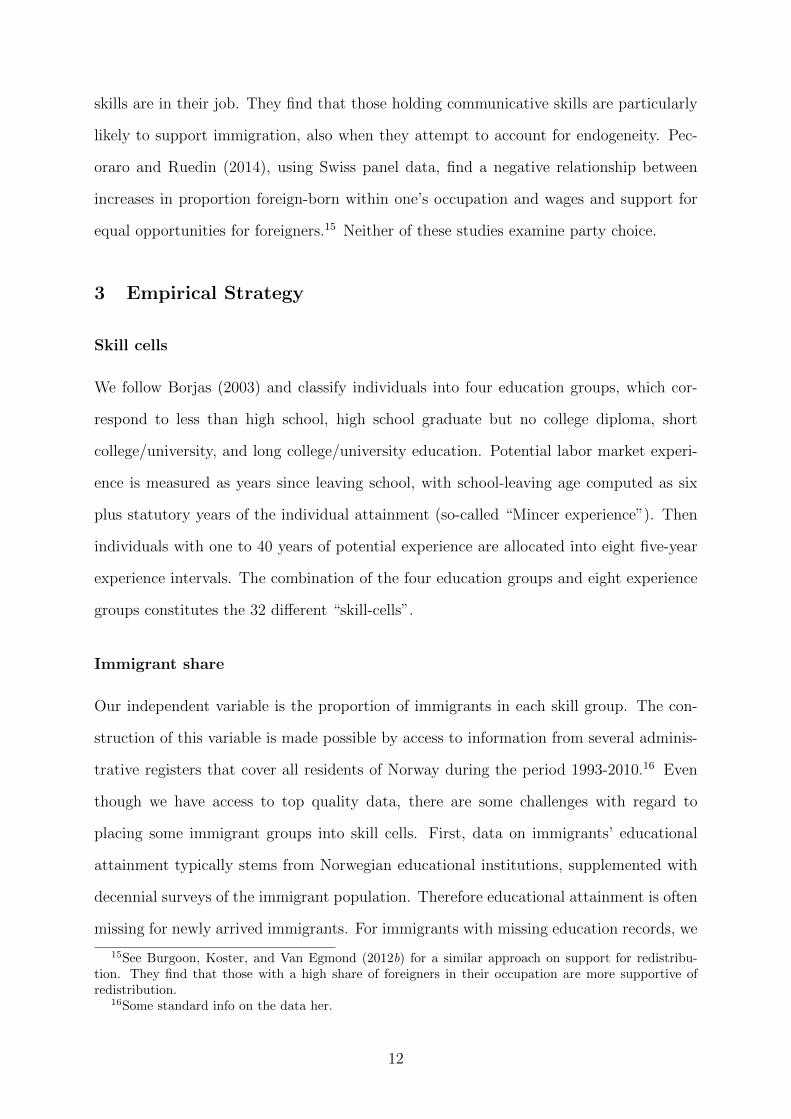
We follow Borjas (2003) and classify individuals into four education groups, which cor-
respond to less than high school, high school graduate but no college diploma, short
college/university, and long college/university education. Potential labor market experi-
ence is measured as years since leaving school, with school-leaving age computed as six
plus statutory years of the individual attainment (so-called “Mincer experience”). Then
individuals with one to 40 years of potential experience are allocated into eight five-year
experience intervals. The combination of the four education groups and eight experience
groups constitutes the 32 different “skill-cells”.
Immigrant share
Our independent variable is the proportion of immigrants in each skill group. The con-
struction of this variable is made possible by access to information from several adminis-
trative registers that cover all residents of Norway during the period 1993-2010.16 Even
though we have access to top quality data, there are some challenges with regard to
placing some immigrant groups into skill cells. First, data on immigrants’ educational
attainment typically stems from Norwegian educational institutions, supplemented with
decennial surveys of the immigrant population. Therefore educational attainment is often
missing for newly arrived immigrants. For immigrants with missing education records, we
15See Burgoon, Koster, and Van Egmond (2012b) for a similar approach on support for redistribu-tion. They find that those with a high share of foreigners in their occupation are more supportive ofredistribution.
16Some standard info on the data her.
12
assume that their schooling distribution is similar to that of immigrants with the same
gender, age, and origin. Our approach is explained in detail in the Appendix.
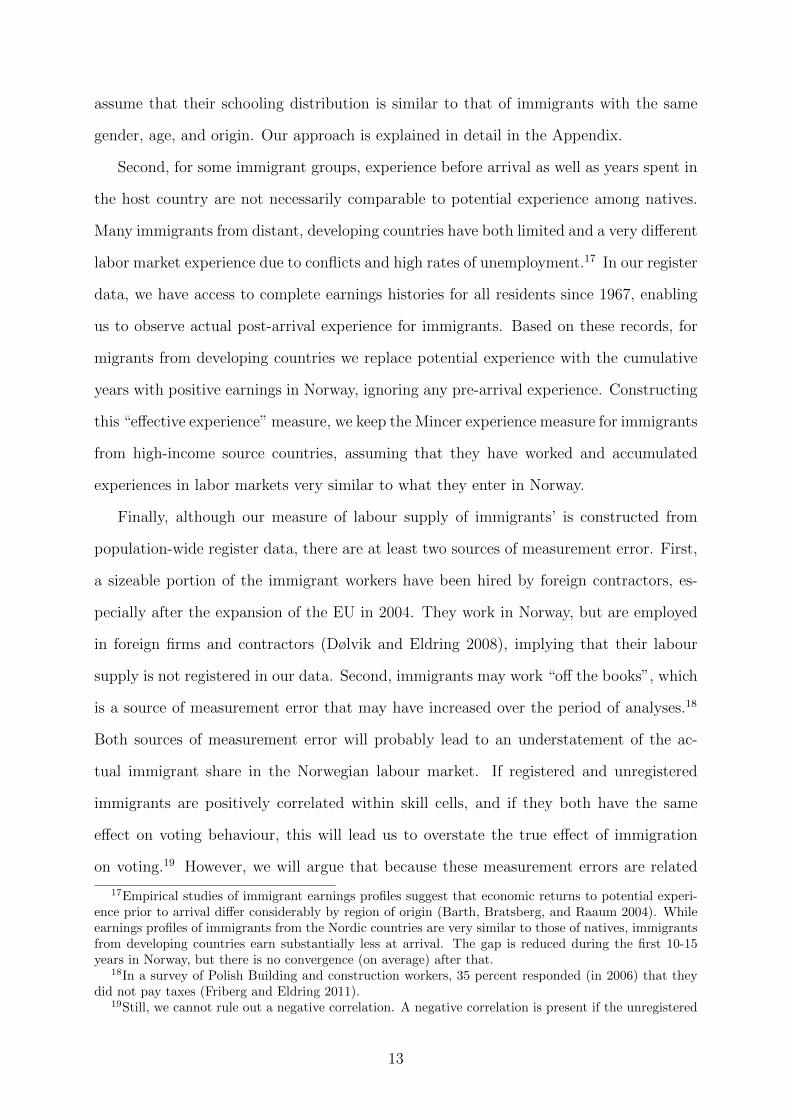
Second, for some immigrant groups, experience before arrival as well as years spent in
the host country are not necessarily comparable to potential experience among natives.
Many immigrants from distant, developing countries have both limited and a very different
labor market experience due to conflicts and high rates of unemployment.17 In our register
data, we have access to complete earnings histories for all residents since 1967, enabling
us to observe actual post-arrival experience for immigrants. Based on these records, for
migrants from developing countries we replace potential experience with the cumulative
years with positive earnings in Norway, ignoring any pre-arrival experience. Constructing
this “effective experience” measure, we keep the Mincer experience measure for immigrants
from high-income source countries, assuming that they have worked and accumulated
experiences in labor markets very similar to what they enter in Norway.
Finally, although our measure of labour supply of immigrants’ is constructed from
population-wide register data, there are at least two sources of measurement error. First,
a sizeable portion of the immigrant workers have been hired by foreign contractors, es-
pecially after the expansion of the EU in 2004. They work in Norway, but are employed
in foreign firms and contractors (Dølvik and Eldring 2008), implying that their labour
supply is not registered in our data. Second, immigrants may work “off the books”, which
is a source of measurement error that may have increased over the period of analyses.18
Both sources of measurement error will probably lead to an understatement of the ac-
tual immigrant share in the Norwegian labour market. If registered and unregistered
immigrants are positively correlated within skill cells, and if they both have the same
effect on voting behaviour, this will lead us to overstate the true effect of immigration
on voting.19 However, we will argue that because these measurement errors are related
17Empirical studies of immigrant earnings profiles suggest that economic returns to potential experi-ence prior to arrival differ considerably by region of origin (Barth, Bratsberg, and Raaum 2004). Whileearnings profiles of immigrants from the Nordic countries are very similar to those of natives, immigrantsfrom developing countries earn substantially less at arrival. The gap is reduced during the first 10-15years in Norway, but there is no convergence (on average) after that.
18In a survey of Polish Building and construction workers, 35 percent responded (in 2006) that theydid not pay taxes (Friberg and Eldring 2011).
19Still, we cannot rule out a negative correlation. A negative correlation is present if the unregistered
13

to immigration, the estimated effect will consist of the combined effect of registered and
non-registered immigrants.20 In a robustness check we rely on a 2SLS approach to correct
for measurement error.
Data on vote choice
There is no administrative data of election results broken down by skill cells. Thus, we
have to rely on survey data to get estimates of vote choices in the different skill cells. This
is challenging because a typical survey data set contains relatively few observations from
each skill cell, in particular for the most unusual skills cells (like the combination of few
years of labor market experience and no education beyond compulsory schooling). The
implication is that we need to combine data from a large amount of surveys to be sure
that we get a reasonable estimate of the distribution of votes for each election for all skill
cells.
In order to achieve this we combine information from 61 surveys which contain the
necessary information to identify each voter’s skill cell and a question on what party s/he
voted for in the previous national election.21 We do not include surveys asking about
what party you would have voted for if there were a national election tomorrow, since
FrP often get higher support between election years. We include some measurement error
by using between election year surveys, since we then assume that voters belonged to the
same skill cell in the election year as in the year of the survey. This will be inaccurate
for those completing education between the election year and the time of the survey.22 In
addition, misreporting might increase with the number of years since the prior election.
However, measurement error in the dependent variable will usually not bias coefficient
estimates, only increase the standard errors (Wooldridge 2003, 302).
After pooling data from the surveys we derive the vote shares for each skill cell in the
five elections over the 1993-2009 period. In the main specification we weight the skill cells
labour is used as a substitute for registered.20Hanson (2006) discusses the difference between legal and illegal immigration in the US labour mar-
ket. He argues that if the omitted variable is immigrant-related, one could, instead of treating it as ameasurement error, consider the estimated impact as the total effect of immigration (legal plus illegal).
21There is a list of the included surveys in the Appendix.22Since we know voters’ year of birth there is no bias in labor market experience.
14

by the number of observations behind the aggregated vote share (Borjas, 2003). Since
we are not interested in estimating descriptive statistics of the population we do not use
the survey weights from the specific surveys.23 The number of observations behind each
skill cell aggregate ranges from 54 (skillcell 32, 1993) to 1934 (skillcell 20, 2009), the
mean/median is 654/515 observations.24
Empirical specification
In our main analysis of vote choice, we study the aggregated vote shares in each skill
cell in the five national (Storting) elections (1993, 1997, 2001, 2005, 2009) for which we
have data on the proportion immigrants in each skill cell. Let y be the vote share of the
particular party for voters with education i, experience j, at election t. Following Borjas
(2003) we estimate WLS/OLS regressions25 of the following form:
Yijt = βIijt + αi + γj + µt + αi ∗ γj + αi ∗ µt + γj ∗ µt + εijt (2)
where αi refers to fixed effects (FE) for levels of education, γj refers to FE for levels of
experience, and µt refers to FE for years.26 As in Borjas (2003) we also add interactions
between the fixed effects. The inclusion of these fixed effects implies that we identify
the effect of immigration from changes within skill cells which are independent of skill cell
specific trends. This is a powerful design, as it implies that we account for general shifts in
e.g. the relationship between education and party choice.27 Standard errors are clustered
at the skill level, since the variation we base our identification on varies across skill cells.28
As mentioned, we weight the skill cells by the number of observations behind the
23One alternative is to use post-stratification techniques to get estimates of votes shares in each skillcell (Lax and Phillips 2009). However, we prefer the transparent approach of aggregating the raw surveydata.
24Nine skill cells have less than 100 observations. The mean is lowest for the 2001 election (476). Ingeneral, the number of observations is lowest in the skill cell of those with the combination of low levelof education and few years of labor market experience.
25An alternative to estimating the models using OLS is to estimate the vote shares jointly in a seeminglyunrelated regressions (SUR)-framework (Tomz, Tucker, and Wittenberg 2002). However, since we includethe same covariates in all regressions, SUR and OLS will yield identical coefficient estimates.
26εijt is the error term, assumed to be normally distributed.27Berglund (2007) argues that socio-economic characteristics have become less important for party
choice over the period we study.28All results go through if we instead rely on standard errors which only adjust for heteroscedasticity.
15

aggregated vote share. The purpose of the weighting is to improve precision of the esti-
mates, but it will be a red flag with regard to bias from omitted variables if estimates vary
substantively depending on whether weights are applied (Solon, Haider, and Wooldridge
2013). We therefore report robustness checks were we do not use weights.
The β coefficient will be unbiased as long as the residual in (2) is orthogonal to Iijt.
The identifying assumption is that there are no skill-group specific residual change in
voting behaviour that is correlated with the immigrant share. One potential threat to
this assumption is the existence of external factors affecting both voting behaviour and
inflow of immigrants within skill-cells. For example, we know that changes in business
cycles affect migrant flows; immigrant flows increase when labour demand is high, and
decrease when labour demand is low. Furthermore, if the share of votes to FrP is also
systematically affected by business cycles, our estimate of the immigration effect on voting
behaviour will be biased. To account for this we include an estimation where a skill-
specific unemployment variable is included, measured as the share of natives within each
cell who were registered as unemployed during the year. In robustness checks, we also
examine other potential threats to the identifying assumption. Moreover, we construct
an instrument for observed immigrant share based on a push-model of immigration and
directly tackle the endogeneity problem in a 2SLS framework.
Connection between the theoretical and empirical specification
It is useful to consider the empirical specification in equation 2 in light of the theoretical
model in equation 1. We do not measure the salience of the issue dimensions (αI) or the
party platforms (XpI). These variables do not vary across skill cells, but they do vary
across elections. The inclusion of the year fixed effects implies that the impact of these
variables are accounted for. The non-policy, socio-demographic attractions to FrP are
captured by the education dummies (and the experience dummies), which represent an
important correlate of party choice in Norway (e.g. Finseraas and Vernby 2014).
Above we argue that our set-up implies that shifts in party platform positions will
plausibly be smaller than shifts among voters. We believe this is plausible because each
16

skill cell comprises a small part of the electorate, so that shifts within one skill cell will
not have much impact on the distribution of policy positions in the electorate as a whole.
More specifically, we assume that FrP do not weight the importance of a small number
of skill cells very heavily when they decide their policy platform. Even if parties have
core voter groups which they pay particular attention to, theoretical multiparty spatial
models suggest that as long as there are sufficiently strong non-policy attachments to
parties, then parties will calibrate their platform position against changes in the median
or mean position of the electorate (Adams 2012, 409). Moreover, some empirical studies
find that parties located away from the center–like FrP on the immigration dimension–are
less likely to shift its position in response to shifts in public opinion (Adams et al. 2006).
Thus, we consider our empirical specification to be well suited to identify the impact of
immigration.
4 Empirical results
Immigration and wages
We begin the empirical analysis by re-examining the relationship between immigration
and wages since the analysis in Bratsberg et al. (2014) does not cover all the election years
in our analysis. To study the impact of immigration on wages we use the empirical set-up
as described in equation (2), with the outcome variable being the log of annual earnings.
We study the relationship using annual data, covering the years 1993-2009, since there is
no reason to restrict the analysis to the election years. By studying annual earnings we
capture the combined effect on hourly wage, work hours per week, and days worked.
The results for earnings are presented in Table 1. The coefficients in the table are
those for the immigrant share variable in the different specifications. In all specifications
we find a negative and significant relationship between the immigrant share and log of
annual earnings. According to the estimates in row 1, a one percentage point increase
in immigrant share is associated with a 0.66 percent reduction in annual earnings. The
coefficient is robust to a set of controls, and drops in size only when we control for the
17
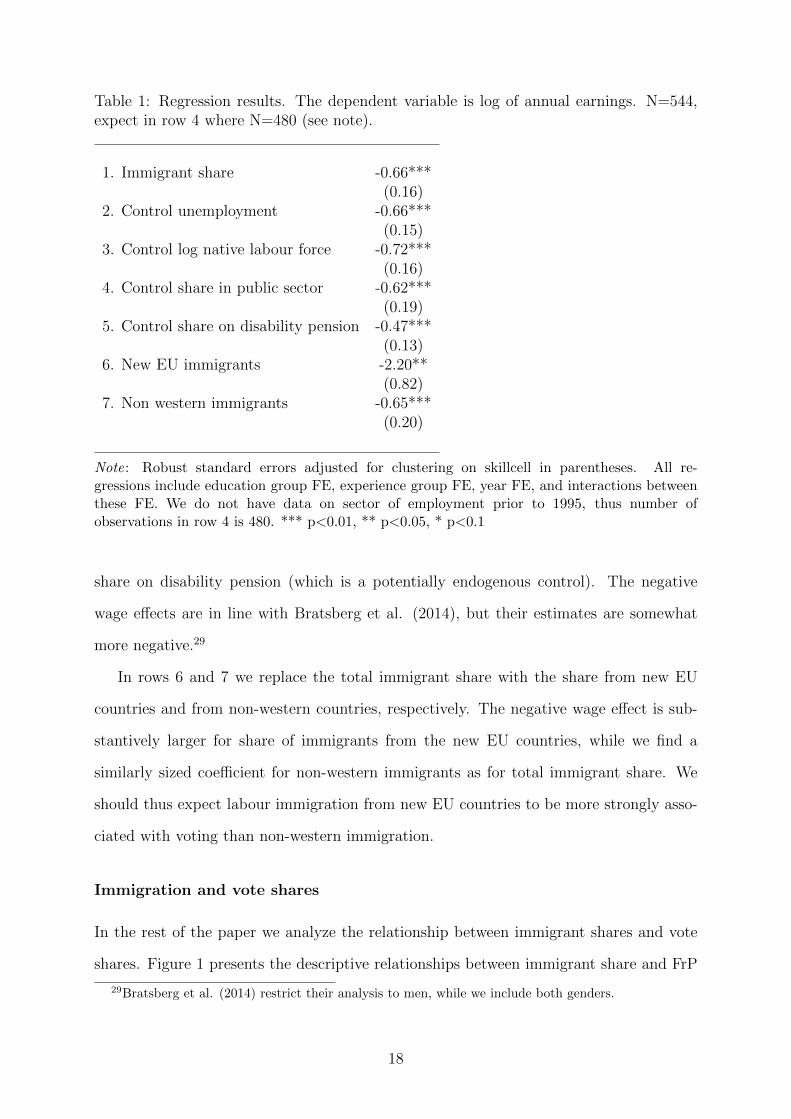
Table 1: Regression results. The dependent variable is log of annual earnings. N=544,expect in row 4 where N=480 (see note).
1. Immigrant share -0.66***(0.16)
2. Control unemployment -0.66***(0.15)
3. Control log native labour force -0.72***(0.16)
4. Control share in public sector -0.62***(0.19)
5. Control share on disability pension -0.47***(0.13)
6. New EU immigrants -2.20**(0.82)
7. Non western immigrants -0.65***(0.20)
Note: Robust standard errors adjusted for clustering on skillcell in parentheses. All re-gressions include education group FE, experience group FE, year FE, and interactions betweenthese FE. We do not have data on sector of employment prior to 1995, thus number ofobservations in row 4 is 480. *** p<0.01, ** p<0.05, * p<0.1
share on disability pension (which is a potentially endogenous control). The negative
wage effects are in line with Bratsberg et al. (2014), but their estimates are somewhat
more negative.29
In rows 6 and 7 we replace the total immigrant share with the share from new EU
countries and from non-western countries, respectively. The negative wage effect is sub-
stantively larger for share of immigrants from the new EU countries, while we find a
similarly sized coefficient for non-western immigrants as for total immigrant share. We
should thus expect labour immigration from new EU countries to be more strongly asso-
ciated with voting than non-western immigration.
Immigration and vote shares
In the rest of the paper we analyze the relationship between immigrant shares and vote
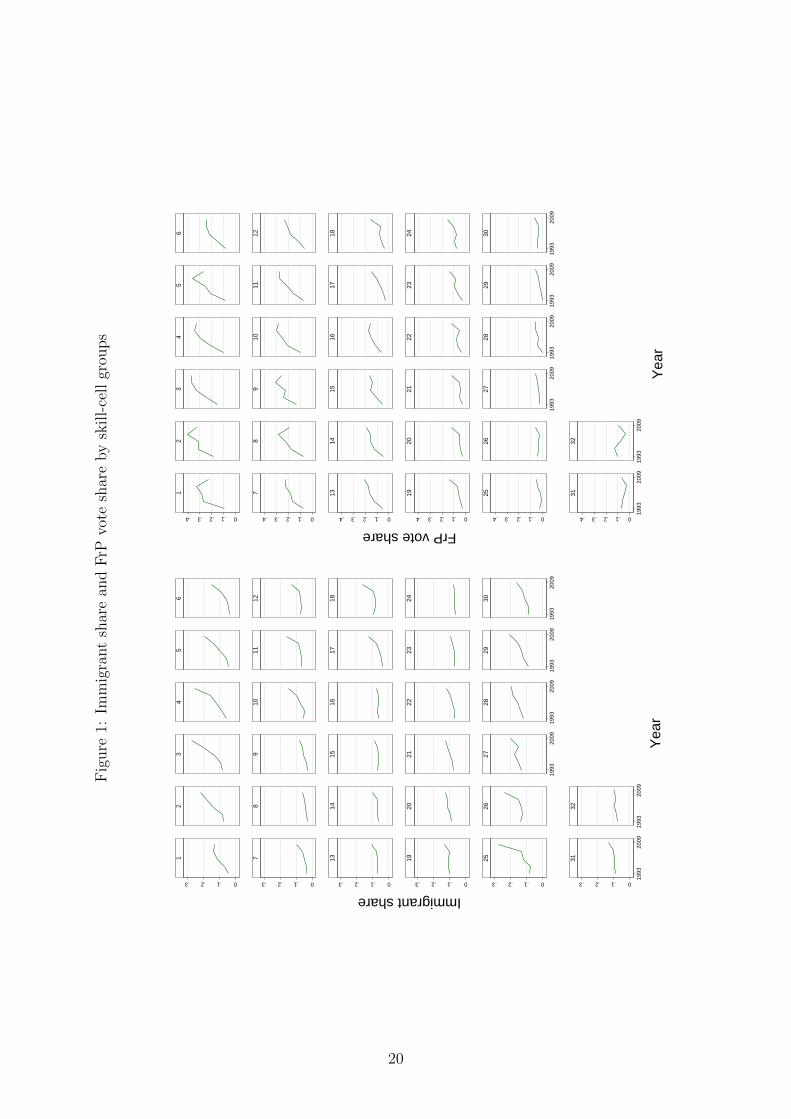
shares. Figure 1 presents the descriptive relationships between immigrant share and FrP
29Bratsberg et al. (2014) restrict their analysis to men, while we include both genders.
18
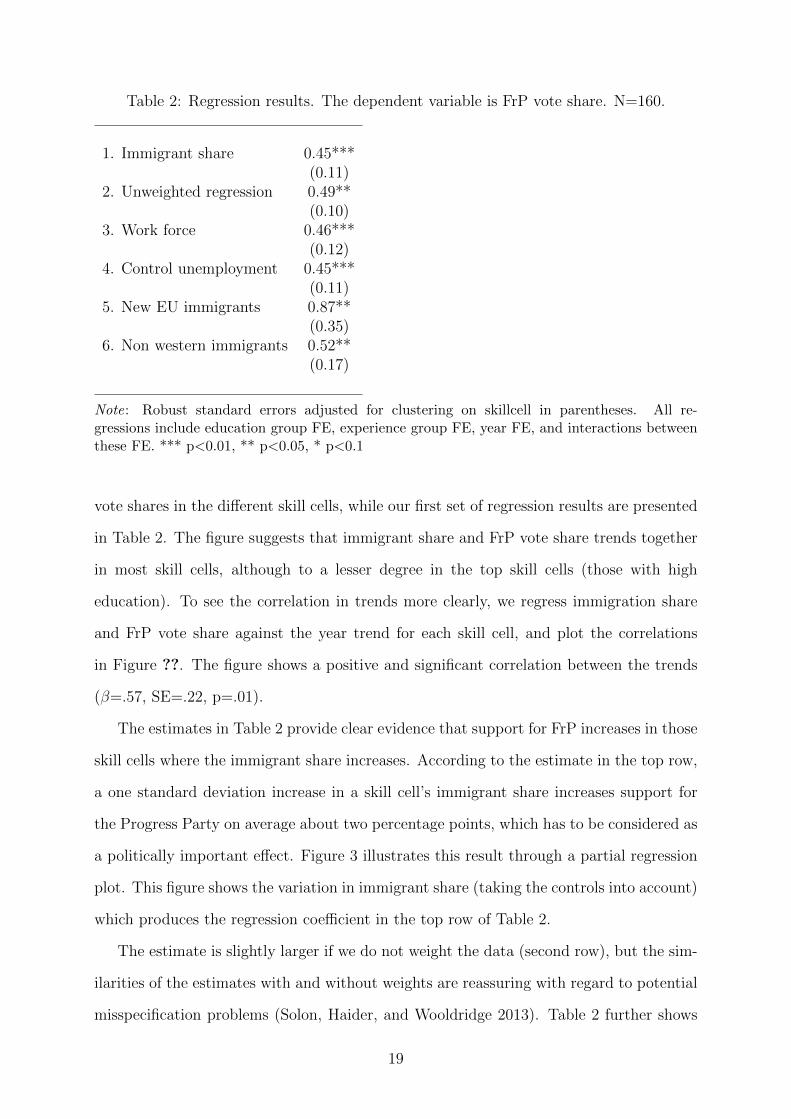
Table 2: Regression results. The dependent variable is FrP vote share. N=160.
1. Immigrant share 0.45***(0.11)
2. Unweighted regression 0.49**(0.10)
3. Work force 0.46***(0.12)
4. Control unemployment 0.45***(0.11)
5. New EU immigrants 0.87**(0.35)
6. Non western immigrants 0.52**(0.17)
Note: Robust standard errors adjusted for clustering on skillcell in parentheses. All re-gressions include education group FE, experience group FE, year FE, and interactions betweenthese FE. *** p<0.01, ** p<0.05, * p<0.1
vote shares in the different skill cells, while our first set of regression results are presented
in Table 2. The figure suggests that immigrant share and FrP vote share trends together
in most skill cells, although to a lesser degree in the top skill cells (those with high
education). To see the correlation in trends more clearly, we regress immigration share
and FrP vote share against the year trend for each skill cell, and plot the correlations
in Figure ??. The figure shows a positive and significant correlation between the trends
(β=.57, SE=.22, p=.01).
The estimates in Table 2 provide clear evidence that support for FrP increases in those
skill cells where the immigrant share increases. According to the estimate in the top row,
a one standard deviation increase in a skill cell’s immigrant share increases support for
the Progress Party on average about two percentage points, which has to be considered as
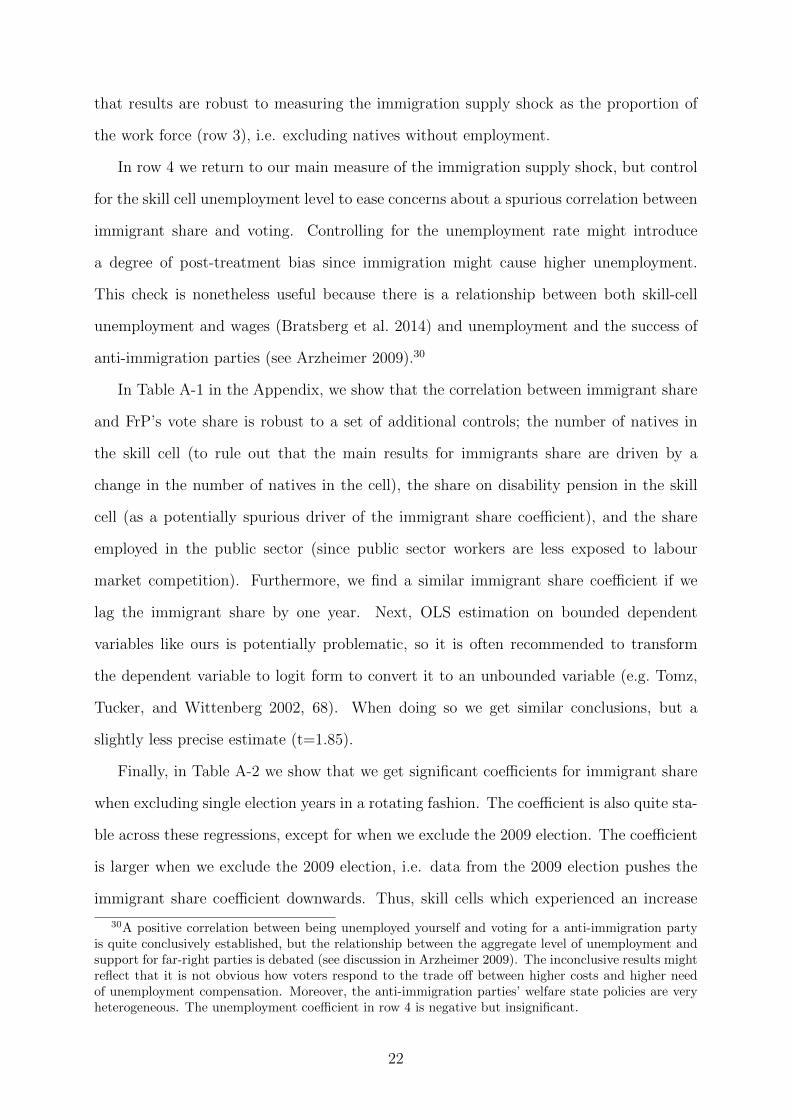
a politically important effect. Figure 3 illustrates this result through a partial regression
plot. This figure shows the variation in immigrant share (taking the controls into account)
which produces the regression coefficient in the top row of Table 2.
The estimate is slightly larger if we do not weight the data (second row), but the sim-
ilarities of the estimates with and without weights are reassuring with regard to potential
misspecification problems (Solon, Haider, and Wooldridge 2013). Table 2 further shows
19
Fig
ure
1:Im
mig
rant
shar
ean
dF
rPvo
tesh
are
by
skill-
cell
grou
ps
0.1.2.3 0.1.2.3 0.1.2.3 0.1.2.3 0.1.2.3 0.1.2.3
1993
2009
1993
2009
1993
2009
1993
2009
1993
2009
1993
2009
12
34
56
78
910
1112
1314
1516
1718
1920
2122
2324
2526
2728
2930
3132
Immigrant share
Yea
r
0.1.2.3.4 0.1.2.3.4 0.1.2.3.4 0.1.2.3.4 0.1.2.3.4 0.1.2.3.4
1993
2009
1993
2009
1993
2009
1993
2009
1993
2009
1993
2009
12
34
56
78
910
1112
1314
1516
1718
1920
2122
2324
2526
2728
2930
3132
FrP vote share
Yea
r
20

Figure 2: Trends in immigrant shares and FrP vote shares
1
2
34
5
6
78 9
1011
12
1314
1516
17
1819
20 21
22
23
24
25
26
27
28 29
30
31
32
-.00
50
.005
.01
.015
Tre
nd F
rP v
ote
shar
e
0 .005 .01 .015Trend immigrant share
Note: The figure shows the correlation between each skill cell’s trend in immigrant shares (X-axis) andFrP vote shares (Y-axis). β=.57, SE=.22, p=.01, N=32.
Figure 3: Partial regression plot from main specification
20091997
20011993
2005
2009199319971993
1993
19932009
1993
2009
2005
19971997
20011997
1993
1993
2005
2009
19972005
2001
20092001
1993
200120052009
2009199319972001
1993
200920052001
1993
20092001
19972009
2005
2001
19972001
200520051997
1997200919932001
19931997
1997
2001
1997
1997
1997
200520092001
1993
1997
2001
20092009
1997
2005200520011993
2005
2001
20091993
2005
2009
2001
2001
2005
2001
200919932005
200120052001
1997
2005
2001
200920012005
1993
2005
2009
1993
2009
2009
2005
2009
1993
1997
2009
199719931997
2009
200520012001
1993
2005
2001
1997
1993
20052005
1997
20092009
1997
199319972005
1997
20011997
2005
2001
199319931993199719971993
2005
1993
2001
2001
1993
2005
2009
1993
2005
1997
1997
2005
2001
2009
2005
2001
2009
20092009
-.08
-.03
.02
.07
e( v
ote
shar
e F
rP| X
)
-.08 -.03 .02 .07e( Immigrant share | X )
21
that results are robust to measuring the immigration supply shock as the proportion of
the work force (row 3), i.e. excluding natives without employment.
In row 4 we return to our main measure of the immigration supply shock, but control
for the skill cell unemployment level to ease concerns about a spurious correlation between
immigrant share and voting. Controlling for the unemployment rate might introduce
a degree of post-treatment bias since immigration might cause higher unemployment.
This check is nonetheless useful because there is a relationship between both skill-cell
unemployment and wages (Bratsberg et al. 2014) and unemployment and the success of
anti-immigration parties (see Arzheimer 2009).30
In Table A-1 in the Appendix, we show that the correlation between immigrant share
and FrP’s vote share is robust to a set of additional controls; the number of natives in
the skill cell (to rule out that the main results for immigrants share are driven by a
change in the number of natives in the cell), the share on disability pension in the skill
cell (as a potentially spurious driver of the immigrant share coefficient), and the share
employed in the public sector (since public sector workers are less exposed to labour
market competition). Furthermore, we find a similar immigrant share coefficient if we
lag the immigrant share by one year. Next, OLS estimation on bounded dependent
variables like ours is potentially problematic, so it is often recommended to transform
the dependent variable to logit form to convert it to an unbounded variable (e.g. Tomz,
Tucker, and Wittenberg 2002, 68). When doing so we get similar conclusions, but a
slightly less precise estimate (t=1.85).
Finally, in Table A-2 we show that we get significant coefficients for immigrant share
when excluding single election years in a rotating fashion. The coefficient is also quite sta-
ble across these regressions, except for when we exclude the 2009 election. The coefficient
is larger when we exclude the 2009 election, i.e. data from the 2009 election pushes the
immigrant share coefficient downwards. Thus, skill cells which experienced an increase
30A positive correlation between being unemployed yourself and voting for a anti-immigration partyis quite conclusively established, but the relationship between the aggregate level of unemployment andsupport for far-right parties is debated (see discussion in Arzheimer 2009). The inconclusive results mightreflect that it is not obvious how voters respond to the trade off between higher costs and higher needof unemployment compensation. Moreover, the anti-immigration parties’ welfare state policies are veryheterogeneous. The unemployment coefficient in row 4 is negative but insignificant.
22

in its immigrant share from 2005 to 2009 responded to a lesser degree than immigrant
supply shocks between the other election years. We suspect that this could be related to
the financial crisis, even though Norway was not heavily hit by the crisis. In line with this
interpretation, the immigrant share estimate when excluding the 2009 election becomes
more similar to the others when we control for skill cell unemployment.
As in Borjas’ (2003) analysis of wage effects, the immigration effect is mainly driven
by the changes in immigrant share net of skill-specific trends. This is evident Figure A-1
which shows that there is no relationship between immigrant share and FrP’s vote share
if we leave out the interactions between the fixed effects. This is not surprising in light
of the growth of FrP’s vote share since the early 1990s. Since the beginning of the 1990s,
FrP has grown relatively faster among those with high education, since very few of those
with high education voted FrP when FrP was a small party. Those with high education
tend to be in skill cells with a smaller growth in immigrant share, thus, this underlying
trend conceal the impact of labour market competition from immigration. That said,
this underlying trend clearly points to factors unrelated to labor market competition as
important factors behind support for FrP.
If economic concerns are the sole reason immigrant share is related to vote shares,
we should not expect the country background of immigrants to matter per se. However,
we should expect the effect to vary with the skills of the immigrant group causing the
supply shock. Our analysis above as well as previous research (Bratsberg et al. 2014)
show that wage effects for this period are stronger for Western than for non-Western
immigrants, leading us to expect a stronger correlation between FrP’s vote share and share
of Western immigrants. Rows 5 and 6 show the results when we replace the immigrant
share variable with the share of immigrants from the new EU countries and share of non-
western immigrants. Immigrants from the new EU countries are mainly low-skilled labour
immigrants, construction workers in particular. Since the 2004 expansion of the EU, there
has been a massive increase in immigration from this group. Non-western immigrants are
typically refugees and asylum seekers of which there has been a steady growth over the
period (see Brochmann and Hagelund (2012) for an overview of immigration to Norway
23

over this period).
Since labour immigrants are closer substitutes to natives than non-western immigrants,
we should see a larger impact of new EU immigration than non western immigration.
In contrast, if immigration drives FrP voting due to non-economic, cultural concerns,
as conventional wisdom claims (Hainmueller and Hopkins 2014), we should see larger
impact of non-western immigration. In line with the competition theory, the results
show a much larger coefficient for new EU immigration. We find results in the same
direction if we estimate the coefficients simultaneously. When running such a regression
we find a coefficient for non-western immigrant of .39 (cluster SE=.16) compared to .65
(cluster SE=.36) for new EU immigration, however, since the latter coefficient is somewhat
imprecisely estimated we cannot reject a null hypothesis of equal coefficients.
Endogeneity
One concern about the previous estimates is that there is a correlation between the residual
and immigrant share, for instance due to business-cycle effects. In addition measurement
error is a potential concern. Borjas (2003) expects his wage estimates to be downward
biased from selection since immigration is likely to be targeted towards skill-cells with a
positive wage development. So far we have addressed this concern by adding controls for
e.g. the unemployment rate. The results in Table A-1 suggest that this potential bias is
not very important.
An alternative approach to the selection problem is to identify the effects of immigra-
tion from exogenous variation in immigrant share. One promising source of exogenous
variation is “migration-push” factors in migration-exporting countries. Inspired by Llull
(2015), we allow the effects of the push factors to vary across skill cells, and set up a
regression model predicting the number of immigrants from exporting countries–we have
information on ancestry country from the register data–in each skill cell from a set of
push-factors. These push variables are log(GDP), log(population size), the freedom of
assembly and association index (Cingranelli and Richards 2010), the political terror scale
(Giavazzi, Petkov, and Schiantarelli 2014), log of years of civil war 1800-2007, log of years
24
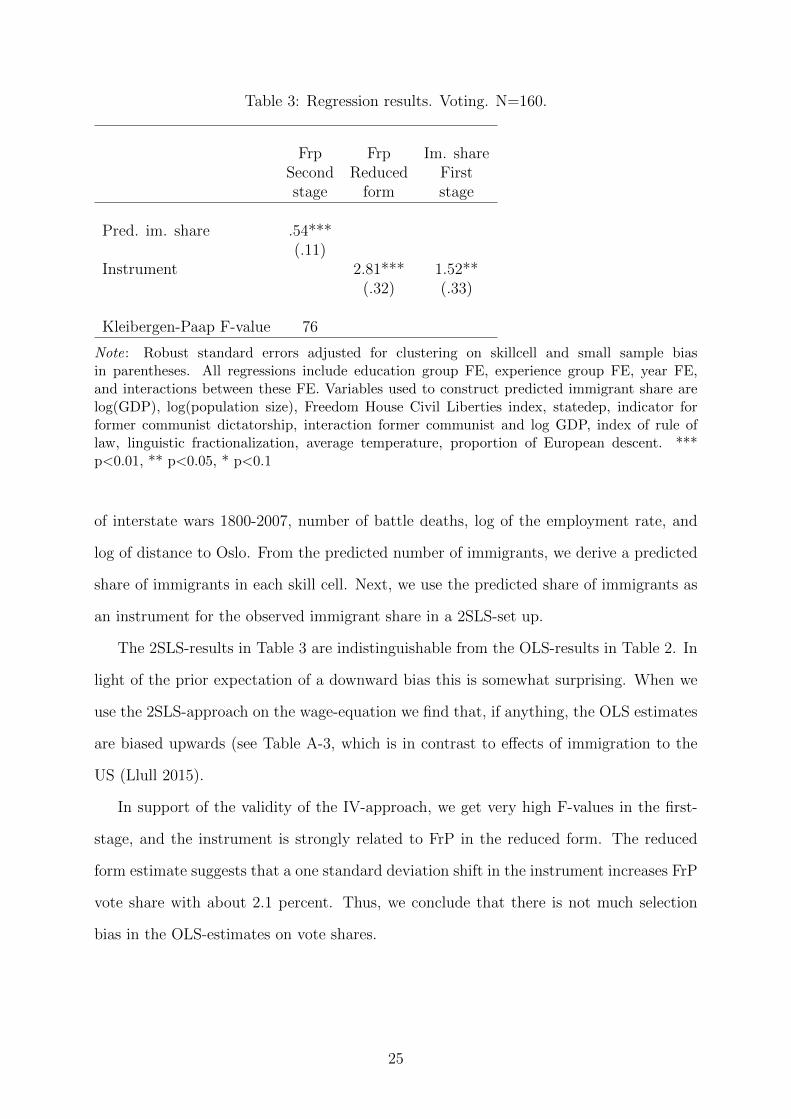
Table 3: Regression results. Voting. N=160.
Frp Frp Im. shareSecond Reduced Firststage form stage
Pred. im. share .54***(.11)
Instrument 2.81*** 1.52**(.32) (.33)
Kleibergen-Paap F-value 76
Note: Robust standard errors adjusted for clustering on skillcell and small sample biasin parentheses. All regressions include education group FE, experience group FE, year FE,and interactions between these FE. Variables used to construct predicted immigrant share arelog(GDP), log(population size), Freedom House Civil Liberties index, statedep, indicator forformer communist dictatorship, interaction former communist and log GDP, index of rule oflaw, linguistic fractionalization, average temperature, proportion of European descent. ***p<0.01, ** p<0.05, * p<0.1
of interstate wars 1800-2007, number of battle deaths, log of the employment rate, and
log of distance to Oslo. From the predicted number of immigrants, we derive a predicted
share of immigrants in each skill cell. Next, we use the predicted share of immigrants as
an instrument for the observed immigrant share in a 2SLS-set up.
The 2SLS-results in Table 3 are indistinguishable from the OLS-results in Table 2. In
light of the prior expectation of a downward bias this is somewhat surprising. When we
use the 2SLS-approach on the wage-equation we find that, if anything, the OLS estimates
are biased upwards (see Table A-3, which is in contrast to effects of immigration to the
US (Llull 2015).
In support of the validity of the IV-approach, we get very high F-values in the first-
stage, and the instrument is strongly related to FrP in the reduced form. The reduced
form estimate suggests that a one standard deviation shift in the instrument increases FrP
vote share with about 2.1 percent. Thus, we conclude that there is not much selection
bias in the OLS-estimates on vote shares.
25

Table 4: Regression results. Voting. N=160.
Vote Vote Vote Voteshare share share shareFrP Ap H SV
Immigrant share 0.45*** -0.58*** -0.34** 0.44**(0.11) (0.21) (0.14) (0.16)
Unweighted regressions 0.49*** -0.51*** -0.35** 0.37**(0.10) (0.16) (0.16) (0.15)
New EU immigrants 0.87** -1.19* -0.73** 0.48(0.35) (0.63) (0.27) (0.31)
Non western immigrants 0.52*** -0.58* -0.42* 0.64***(0.17) (0.31) (0.23) (0.21)
Note: Robust standard errors adjusted for clustering on skillcell in parentheses. All re-gressions include education group FE, experience group FE, year FE, and interactions betweenthese FE. *** p<0.01, ** p<0.05, * p<0.1
Other parties
Next we examine how immigrant share influences the vote share of other parties. The
results for three relevant parties are presented in Table 4, where we for comparison also
include the results for FrP. These parties are Arbeiderpartiet (Ap, Labour), Høyre (H,
The conservative party), and Sosialistisk Venstreparti (SV, the Socialist Left Party). Ap
is a social democratic party which appeals to voter groups with similar characteristics as
FrP’s core voters, H is a secular conservative party and FrP’s main competitor on the
right, while SV is a New Left party diametrically opposed to FrP on many dimensions,
in particular on immigration. We find no significant results for the other main parties.
The results show that the increase in FrP’s vote share is partly on expense of Ap,
for which we consistently find negative and significant effects. This result is unsurprising
since there is competition between these two parties for the votes of the low pay, low
educated segments of the electorate (see e.g Finseraas and Vernby 2014). Immigration is
also negatively related to the vote share of H, thus parties competing with immigrants
appears to abandon the main party both on the right and on the left. For both Ap and H,
the coefficients are larger for labour immigration, pointing to competition as an important
mechanism.
26

Perhaps the most surprising results are those for SV. SV is the most immigration-
friendly party in the Norwegian Storting, but similar to FrP, they appear to gain in
skill cells with an increasing share of immigrants.31 Thus, the protectionist and the
compensatory response appears to exist together. We do not find a larger coefficient for
EU immigration for SV, in contrast, the non-western immigration coefficient is the largest.
This finding suggests that non-economic policy concerns are more important for SV’s vote
share than for the vote share of FrP, Ap, and H. Importantly, the results together points
to immigration as a driver of voter polarization rather than causing uniform shifts in one
partisan direction.
The polarizing effect of labour market competition
To dig deeper into the polarizing effect of labour market competition, we return to the
theoretical framework, which posits that workers can react to competition by demanding
less immigration or more public intervention. The former links competition to FrP voting,
the latter links competition to SV voting. Based on the previous results we suggest that
a voter’s choice of response depends on her deep held values on these issues: Those who
hold leftist ideological predispositions will become more likely to vote SV when facing
labour market competition from immigrants, those without a normative commitment to
the left are more likely to turn to FrP. One way to think about this in the theoretical
framework above is that the response is determined by the normative, time-invariant
views on immigration and public intervention. While the economic shock moves the time-
varying components in the same direction for all voters, the normative views determine to
what degree the different dimensions are triggered when circumstances change. For those
holding leftist ideological predispositions, the immigration induced economic shock mainly
triggers the social transfers and regulation dimension, while the immigration dimension
are triggered for those holding rightist predispositions.
We are unable to provide a rigorous test of this claim, but we employ the panel feature
of the Norwegian election studies to shed some light on this perspective. The panel feature
31In the Appendix we show that we get larger effects for SV when we instrument immigrant share.
27

Table 5: Regression results. Voting.
Voting VotingFrP SV
Immigrant shareXRestrictivet−1 0.45 -1.46**(0.71) (0.53)
Immigrant shareXRedistributiont−1 0.10 1.17***(0.54) (0.38)
Immigrant share 0.44 -0.73(0.80) (0.64)
Restrictive immigration policyt−1 0.23*** -0.10***(0.05) (0.04)
More redistributiont−1 -0.03 0.05**(0.03) (0.02)
Observations 2,498 2,498
Note: Robust standard errors adjusted for clustering on skillcell in parentheses. All re-gressions include education group FE, experience group FE, year FE, and interactions betweenthese FE. *** p<0.01, ** p<0.05, * p<0.1
is a rotating panel where a subset of the respondents in each election is re-interviewed
in the subsequent election (four years later). We pool the subset of respondents who
are interviewed for the second time in the 1993-2009 elections and add the information
about these respondents from the first interview four years earlier. In particular we
add information about their views on immigration and income redistribution. Next, we
estimate regression models identical to those above, but on individual level data, and add
interaction terms between previously stated political preferences and current exposure to
labour market competition with immigrants:
Yt = β1It + β2It × Pt−1 + β3Pt−1 + αi + γj + µt + αi ∗ γj + αi ∗ µt + γj ∗ µt + εijt (3)
where Pt−1 is the political view as measured in the previous election. As before, αi refers
to fixed effects (FE) for levels of education, γj refers to FE for levels of experience, and
µt refers to FE for election years, and we add interactions between the fixed effects. The
key interest is on β2 which tells us whether the impact of immigrant share depends on
views on immigrants/redistribution in the previous election.
28
Views on immigration policy is measured using a question where voters are asked to
express their view on immigration on a scale from 0 to 10, where 0 equals “easier for
immigrants to get access to Norway” while 10 equals “even more restrictions on immi-
gration to Norway”.32 We recode this variable to the 0 to 1 range. We measure views on
income redistribution using the question on whether they agree that “we have come far
enough in reducing economic inequalities”. Respondents are asked to state their views
using Liekert-scale answer categories.
The results are presented in Table 5. Two important results emerge. First, immigrant
share is positively related to FrP voting irrespective of ideological predisposition, however,
the effect is much larger among those holding restrictive views on immigration prior to the
immigrant shock. The effect is doubled if we go from the most liberal (Restrictivet−1 =0)
to the most restrictive (Restrictivet−1 =1). Second, immigrant share is negatively related
to SV voting for most voters, however there is a positive correlation for those initially
holding very liberal immigration views and egalitarian views on redistribution. This group
score 0 on Immigrant shareXRestrictivet−1, thus the marginal effect of immigrant share
is positive since 1.17 − 0.73 > 0. We hasten to add, however, that the small sample
size makes it difficult to draw strong conclusions, so results should only be considered as
suggestive.
5 Conclusion
Immigration creates opportunities and challenges for receiving countries. In most ad-
vanced economies, immigration causes a downward pressure on wages and employment
opportunities of workers with similar skills, at least in the short run. We demonstrate such
effects in Norway, and propose that workers have two political responses; they can demand
more restrictive immigration policies or they can demand more public intervention in the
form of social transfers and regulations. Previous research has mainly been preoccupied
with the former response, which we show is unfortunate. This is because when there is
several responses, the structure of party competition, the positioning of the political par-
32The asymmetry in the scale was present in all years
29
ties on the relevant political dimensions, will determine the popularity of the responses,
and thus what parties which will gain and lose among voters competing with immigrants
on the labour market. Unless one party combines policies to address both responses,
several parties might gain votes among those facing competition from immigrants. In-
corporating these party position differences is a major challenge to cross-national studies
of the electoral consequences of immigration, and might explain the conflicting results in
the empirical literature.
We are the first study of political responses to immigration which utilizes the skill cell
approach to identify who competes with immigrants. Using this approach we find much
more support for labour market competition theory than in the previous literature. We
find that Norway’s most right-wing party on immigration and the most left-wing party
on public interventions gain votes among voters exposed to labour market competition
from immigrants. Voters’ choice of response appears to depend on ideological predisposi-
tions, which we suggest is because ideology determines what political dimension is being
triggered when exposed to competition.
Our results show that immigration causes political polarization among voters exposed
to its labour market consequences. The polarized response among voters might make it
more difficult to reach political consensus on policy changes to counterweight the negative
wage effects. Further theoretical and empirical studies of the polarizing effect of labour
market competition with immigrants appear as an important direction of research. In
our view, too much of the literature on the political consequences of immigration have
been concerned about the relative importance of ideology and self-interest. Our results
suggest that understanding the interaction between ideology and economic consequences
is a more fruitful direction of research.
30

References
Adams, James. 2012. “Causes and Electoral Consequences of Party Policy Shifts inMultiparty Elections: Theoretical Results and Empirical Evidence.” Annual Review ofPolitical Science 15: 401–419.
Adams, James F., Samuel Merrill III, and Bernard Grofman. 2005. A Unified Theoryof Party Competition: A Cross-National Analysis Integrating Spatial and BehavioralFactors. New York: Cambridge University Press.
Adams, James, Michael Clark, Lawrence Ezrow, and Garrett Glasgow. 2006. “Are NicheParties Fundamentally Different from Mainstream Parties? The Causes and the Elec-toral Consequences of Western European Parties’ Policy Shifts, 1976–1998.” AmericanJournal of Political Science 50(3): 513–529.
Arzheimer, Kai. 2009. “Contextual Factors and the Extreme Right Vote in WesternEurope, 1980–2002.” American Journal of Political Science 53(2): 259–275.
Aydemir, Abdurrahman, and George J. Borjas. 2007. “Cross-country variation in theimpact of international migration: Canada, Mexico, and the United States.” Journalof the European Economic Association 5(4): 663–708.
Barth, Erling, Bernt Bratsberg, and Oddbjørn Raaum. 2004. “Identifying earnings assimi-lation of immigrants under changing macroeconomic conditions.” Scandinavian Journalof Economics 106(1): 1–22.
Barth, Erling, Henning Finseraas, Karl O. Moene, and Kjersti M. Østbakken. 2015. “In-surance or redistribution motives? Behaviors and beliefs in the welfare state .” Workingpaper.
Berglund, Frode. 2007. “Nye sosiale skiller: sektor teller, ideologi avgjør [New socialcleavages: Sector matters, ideology decides].” In Norske velgere [Norwegian voters], ed.Bernt Aardal. Oslo: N.W. Damm & Søn.
Borjas, George J. 2003. “The Labor Demand Curve Is Downward Sloping: Reexaminingthe Impact of Immigration on the Labor Market.” Quarterly Journal of Economics118(4): 1335–1374.
Borjas, George J., Jeffrey Grogger, and Gordon H. Hanson. 2010. “Immigration and theEconomic Status of African-American Men.” Economica 77(306): 255–282.
Bratsberg, Bernt, Oddbjørn Raaum, Marianne Røed, and Pal Schøne. 2014. “ImmigrationWage Effects by Origin.” Scandinavian Journal of Economics 116(2): 356–393.
Brochmann, Grete, and Anniken Hagelund. 2012. Immigration policy and the Scandina-vian welfare state 1945-2010. Palgrave Macmillan.
Burgoon, Brian, Ferry Koster, and Marcel Van Egmond. 2012a. “Support for redis-tribution and the paradox of immigration.” Journal of European Social Policy 22(3):288–304.
31
Burgoon, Brian, Ferry Koster, and Marcel Van Egmond. 2012b. “Support for redis-tribution and the paradox of immigration.” Journal of European Social Policy 22(3):288–304.
Card, David. 1990. “The Impact of the Mariel Boatlift on the Miami Labor Market.”Industrial & Labor Relations Review 43(2): 245–257.
Cingranelli, David, and David Richards. 2010. “The Cingranelli and Richards (CIRI)Human Rights Data Project.” Human Rights Quarterly 32(2): 401–424.
Cusack, Thomas, Torben Iversen, and Philipp Rehm. 2006. “Risk at Work: The Demandand Supply Sides of Government Redistribution.” Oxford Review of Economic Policy22(3): 365–389.
Dahlberg, Matz, Karin Edmark, and Helene Lundqvist. 2012. “Ethnic Diversity andPreferences for Redistribution.” Journal of Political Economy 120(1): 41–76.
Dølvik, Jon Erik, and Line Eldring. 2008. “Arbeidsmobilitet fra de nye EU-landene tilNorden-utviklingstrekk og konsekvenser [Labour mobility from the New EU countriesto the Nordic countries-development and consequences].”.
Enos, Ryan D. forthcoming. “What the Demolition of Public Housing Teaches us Aboutthe Impact of Racial Threat on Political Behavior.” Forthcoming, American Journal ofPolitical Science .
Finseraas, Henning. 2008. “Immigration and Preferences for Redistribution: An EmpiricalAnalysis of European Survey Data.” Comparative European Politics 6(4): 407–431.
Finseraas, Henning, and Kare Vernby. 2014. “A mixed blessing for the left? Early voting,turnout and election outcomes in Norway.” Electoral Studies 33: 278–291.
Finseraas, Henning, Axel West Pedersen, and Ann-Helen Bay. forthcoming. “When theGoing Gets Tough: The Differential Impact of National Unemployment on the PerceivedThreats of Immigration.” Political Studies .
Friberg, Jon H., and Line Eldring. 2011. “Polonia i Oslo 2010. Mobilitet, arbeid og levekarblant polakker i hovedstaden [Polonia in Oslo 2010. Mobility, work and living standardsamong Polacks in the capital].” Fafo Report 2011:27.
Giavazzi, Francesco, Ivan Petkov, and Fabio Schiantarelli. 2014. “Culture: Persistenceand Evolution.” Unpublished working paper.
Hainmueller, Jens, and Daniel J. Hopkins. 2014. “Public Attitudes Toward Immigration.”Annual Review of Political Science 17: 225–249.
Hainmueller, Jens, and Michael J. Hiscox. 2007. “Educated Preferences: ExplainingAttitudes toward Immigration in Europe.” International Organization 61(2): 399–442.
Hainmueller, Jens, and Michael J. Hiscox. 2010. “Attitudes Toward Highly Skilled andLow Skilled Immigration: Evidence from a Survey Experiment.” American PoliticalScience Review 104(1): 61–84.
32
Hainmueller, Jens, Michael J. Hiscox, and Yotam M. Margalit. forthcoming. “Do Con-cerns about Labour Market Competition Shape Attitudes Toward Immigration? NewEvidence.” Journal of International Economics .
Halla, Martin, Alexander F. Wagner, and Zweimuller. 2014. “Immigration and Voting forthe Extreme Right.” Unpublished paper.
Hanson, Gordon H. 2006. “Illegal Migration from Mexico to the United States.” Journalof Economic Literature 44(4): 869–924.
Harmon, Nikolaj A. 2014. “Immigration, Ethnic Diversity and Political Outcomes: Evi-dence from Denmark.” Unpublished paper.
Iversen, Torben, and David Soskice. 2001. “An Asset Theory of Social Policy Preferences.”American Political Science Review 95(04): 875–893.
Jaeger, David. 1996. “Skill Differences and the Effect of Immigrants on the Wages ofNatives.” Working Paper, William and Mary College.
Karlsen, Rune, and Bernt Aardal. 2007. “Dagsorden og sakseierskap [Agenda and IssueOwnership].” In Norske velgere [Norwegian Voters], ed. Bernt Aardal. Oslo: Damm &Sønn.
Lax, Jeffrey R., and Justin H. Phillips. 2009. “How Should We Estimate Public Opinionin the States?” American Journal of Political Science 53(1): 107–121.
Llull, Joan. 2015. “The Effect of Immigration on Wages: Exploiting Exogenous Variationat the National Level.” Working paper.
Malhotra, Neil, Yotam Margalit, and Cecilia Hyunjung Mo. 2013. “Economic Explana-tions for Opposition to Immigration: Distinguishing Between Prevalence and Condi-tional Impact.” American Journal of Political Science 57(2): 391–410.
Manacorda, Marco, Alan Manning, and Jonathan Wadsworth. 2012. “The impact ofimmigration on the structure of wages: Theory and evidence from Britain.” Journal ofthe European Economic Association 10(1): 120–151.
Margalit, Yotam. 2013. “Explaining Social Policy Preferences: Evidence from the GreatRecession.” American Political Science Review 107(1): 80–103.
Markussen, Simen. 2008. “How the left prospers from prosperity.” European Journal ofPolitical Economy 24(2): 329–342.
Mayda, Anna M. 2006. “Who Is Against Immigration? A Cross-Country Investigation ofIndividual Attitudes Toward Immigrants.” Review of Economics and Statistics 88(3):510–530.
Moene, Karl O., and Michael Wallerstein. 2001. “Inequality, Social Insurance, and Redis-tribution.” American Political Science Review 95(4): 859–874.
Okkerse, Liesbet. 2008. “How to measure labour market effects of immigration: A review.”Journal of Economic Surveys 22(1): 1–30.
33

Ortega, Francesc, and Javier G. Polavieja. 2012. “Labor-market exposure as a determinantof attitudes toward immigration.” Labour Economics 19(3): 298–311.
Ottaviano, Gianmarco I.P., and Giovanni Peri. 2008. “Immigration and National Wages:Clarifying the Theory and the Empirics.” NBER Working Paper No. 14188.
Ottaviano, Gianmarco I.P., and Giovanni Peri. 2012. “Rethinking the Effect of Immigra-tion on Wages.” Journal of the European Economic Association 10(1): 152–197.
Pecoraro, Marco, and Didier Ruedin. 2014. “More than this: The Occupational Share ofForeigners and Attitudes to Equal Opportunities.” Available at SSRN 2477145.
Rehm, Philip. 2011. “Social Policy by Popular Demand.” World Politics 63(2): 271–299.
Scheve, Kenneth, and Matthew Slaughter. 2001. “Labor market competition and indi-vidual preferences over immigration policy.” Review of Economics and Statistics 83(1):133–145.
Sides, John, and Jack Citrin. 2007. “European opinion about immigration: the role ofidentities, interests and information.” British Journal of Political Science 37(3): 477–504.
Solon, Gary, Steven J. Haider, and Jeffrey Wooldridge. 2013. “What Are We WeightingFor?” NBER Working Paper No. 18859.
Sørensen, Rune. 2015. “The impact of immigration on voters’ preferences: A dwindlingeffect.” Working paper.
Tomz, Michael, Joshua A. Tucker, and Jason Wittenberg. 2002. “An Easy and AccurateRegression Model for Multiparty Electoral Data.” Political Analysis 10(1): 66–83.
Wooldridge, Jeffrey M. 2003. Introductory Econometrics. Mason, Ohio: Thompson South-Western.
34

Appendix
List of survey data sets
Data are gathered from 61 data sets. A majority of the data sets are provided by theNorwegian Social Science Data Services (NSD) and publicly available (www.nsd.uib.no)for free unless noted. NSD is not responsible for the analyses/interpretation of data. Allsurveys are nationwide:National Election Studies 1993, 1997, 2001, 2005, 2009, 2013 (recall question)Local Election Studies 1995, 1999, 2003, 2007The EU referendum study 1994Standard Eurobarometer 42.0 1994Statistics Norway’s Omnibus Surveys, a total of 40 surveys in the period 1994-2004European Social Survey 2002, 2004, 2006, 2008, 2010, 2012International Social Survey Programme 1996, 2010, 2011, 2012Comparative Study of Electoral Systems 1997, 2001, 2005, 2009Generations and Gender Survey (GGS-Norway) 2007/2008Respons Time Series of Opinion Polls 2005-2012Medborgerundersøkelsen 2001FAMI-survey on views on poverty 2007NOVA-survey on views on globalization 2008/2009
35

Additional information on the allocation of immigrants to skill cells
We use educational attainment collected from the National Education Database. Theeducation database is built up from records obtained directly from Norwegian educationalinstitutions and the Norwegian State Educational Loan Fund, as well as self-reportedattainment taken from census records and two surveys (from 1989 and 1999) that wereadministered to all foreign residents with missing educational attainment. Still, missingeducation remains a problem in the immigrant labor force data. To illustrate, the fractionof resident immigrants in our data with missing records of educational attainment is0.138 in 1993, 0.121 in 1999, and 0.387 in 2006. In order to compute immigrant sharesby education and experience levels, it is therefore necessary to allocate immigrants withmissing data across skill groups.
Our allocation procedure starts with the assumption that for each observation year,birth cohort, gender, and country of origin (broadly defined in four major regions), thedistribution of attainment is the same for immigrants with missing and non-missing data.To illustrate the procedure, consider the 427 resident male immigrants born in 1959 in oneof the neighboring Nordic countries and counted in the Norwegian labor force in 2006. Ofthese 47-year old men, 129 have missing on educational attainment. Among the 298 menwith non-missing data, the frequency distribution across the four attainment levels used inthe analysis is 40, 27, 25, and 8 percent. Accordingly, we estimate that, in 2006, the countof Nordic male high-school dropouts with 30 (= 47−17) years of experience is 52 persons(0.40 ∗ 129) higher than the observed count (120); that of high-school graduates with 28years of experience is 35 persons higher; that of men with some college and 24 years ofexperience 32 persons higher; and that of college graduates with 21 years of experience10 persons higher than the observed count. When we follow the same procedure for otherbirth years, we estimate that the 2006 count of Nordic male dropouts with 26-30 years ofexperience is 202 persons higher than the observed count of 596 persons. A feature of theallocation procedure is that it tends to blow up counts in low education-low experiencecells and leave counts in high attainment-high experience cells unchanged. The reason forthe latter is that very few immigrants in the oldest birth cohorts (i.e., born before 1946)have missing data. Conversely, for the majority of, say, 20-year old Nordic males, we lackeducation data, and these individuals must by definition belong to a low attainment-lowexperience cell.
36

Additional empirical results
Figure A-1: Partial regression plot without interactions between the fixed effects
2009
1997
1993
1993
2009
1993
1993
1997
1997
1993
19972009
1997
20052005
1993
2009
2001
2001
20012001
2005
20011993
199720051993
1997
1993
20091997
1997
1997
1993
2009
2001
2001
2001
1993
2005
20092009
1993
2005
20012005
2005
1993
1993
2005
2005
20011997
2009
2009
1997
1997
2005
2001
2005
1993
2001
2009
2009
20051997
1993
1997
2001
20052001
20012009
1993
1993
1997
2009
2001
2005
2009
1993
19972005
1997
2009
2005
19972009
2009
2001
1997
1993
1993
2005
200519932009
1997
1997
20052001
1997
2005
1997
2001
2005
1993
200120052001
2005
2001
2009
2001
1993
1997
1993
2009
2005
19972005
19932001
19931997
2009
1993
2009
2001
2001
1997
2009
1997
2001
1993
2001
2009
199720092001
2005
2001
2005
2001
1993
1997
1993
2001
2009
1997
1993
2005
2005
2009
2005
2009
2005
2009
2009
2009
-.1
-.05
0.0
5.1
.15
e( v
ote
shar
e F
rP |
X )
-.05 0 .05 .1 .15e( Immigrant share | X )
Note: The full line is the regression line when the outlier in the bottom righthand corner is excluded.The dotted line is the regression line when this observation is included. Both regression lines have a slopwhich is insignificantly different from zero.
37
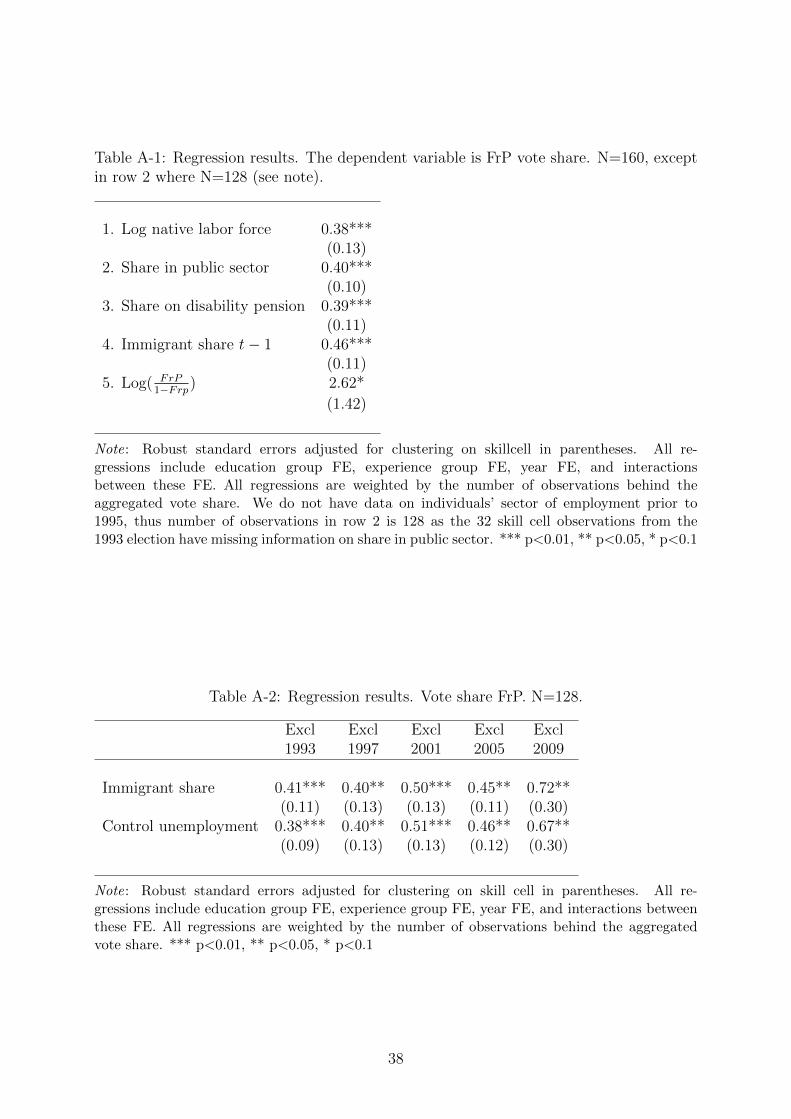
Table A-1: Regression results. The dependent variable is FrP vote share. N=160, exceptin row 2 where N=128 (see note).
1. Log native labor force 0.38***(0.13)
2. Share in public sector 0.40***(0.10)
3. Share on disability pension 0.39***(0.11)
4. Immigrant share t− 1 0.46***(0.11)
5. Log( FrP1−Frp
) 2.62*
(1.42)
Note: Robust standard errors adjusted for clustering on skillcell in parentheses. All re-gressions include education group FE, experience group FE, year FE, and interactionsbetween these FE. All regressions are weighted by the number of observations behind theaggregated vote share. We do not have data on individuals’ sector of employment prior to1995, thus number of observations in row 2 is 128 as the 32 skill cell observations from the1993 election have missing information on share in public sector. *** p<0.01, ** p<0.05, * p<0.1
Table A-2: Regression results. Vote share FrP. N=128.
Excl Excl Excl Excl Excl1993 1997 2001 2005 2009
Immigrant share 0.41*** 0.40** 0.50*** 0.45** 0.72**(0.11) (0.13) (0.13) (0.11) (0.30)
Control unemployment 0.38*** 0.40** 0.51*** 0.46** 0.67**(0.09) (0.13) (0.13) (0.12) (0.30)
Note: Robust standard errors adjusted for clustering on skill cell in parentheses. All re-gressions include education group FE, experience group FE, year FE, and interactions betweenthese FE. All regressions are weighted by the number of observations behind the aggregatedvote share. *** p<0.01, ** p<0.05, * p<0.1
38
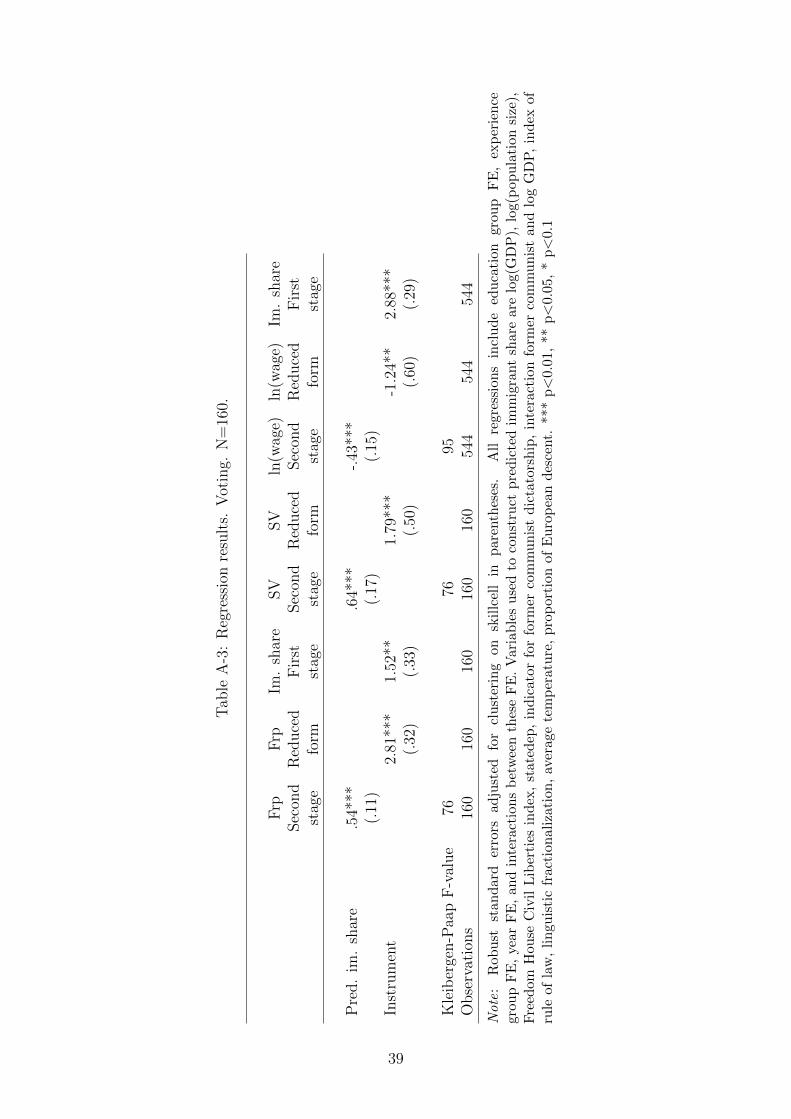
Tab
leA
-3:
Reg
ress
ion
resu
lts.
Vot
ing.
N=
160.
Frp
Frp
Im.
shar
eSV
SV
ln(w
age)
ln(w
age)
Im.
shar
eSec
ond
Red
uce
dF
irst
Sec
ond
Red
uce
dSec
ond
Red
uce
dF
irst
stag
efo
rmst
age
stag
efo
rmst
age
form
stag
e
Pre
d.
im.
shar
e.5
4***
.64*
**-.
43**
*(.
11)
(.17
)(.
15)
Inst
rum
ent
2.81
***
1.52
**1.
79**
*-1
.24*
*2.
88**
*(.
32)
(.33
)(.
50)
(.60
)(.
29)
Kle
iber
gen-P
aap
F-v
alue
7676
95O
bse
rvat
ions
160
160
160
160
160
544
544
544
Note
:R
ob
ust
stan
dar
der
rors
adju
sted
for
clu
ster
ing
onsk
illc
ell
inp
aren
thes
es.
All
regr
essi
on
sin
clu
de
edu
cati
on
gro
up
FE
,ex
per
ien
cegro
up
FE
,ye
ar
FE
,an
din
tera
ctio
ns
bet
wee
nth
ese
FE
.V
aria
ble
suse
dto
con
stru
ctp
red
icte
dim
mig
rant
share
are
log(G
DP
),lo
g(p
op
ula
tion
size
),F
reed
om
Hou
seC
ivil
Lib
erti
esin
dex
,st
ate
dep
,in
dic
ato
rfo
rfo
rmer
com
mu
nis
td
icta
tors
hip
,in
tera
ctio
nfo
rmer
com
mu
nis
tan
dlo
gG
DP
,in
dex
of
rule
of
law
,li
ngu
isti
cfr
act
ion
ali
zati
on
,av
erage
tem
per
atu
re,
pro
por
tion
ofE
uro
pea
nd
esce
nt.
***
p<
0.0
1,
**
p<
0.0
5,
*p<
0.1
39