labor force to lecture hall: postsecondary policies … hamilton project • brookings 1 labor force...
TRANSCRIPT

The Hamilton Project • Brookings 1
Sarah Turner
POLICY PROPOSAL 2017-06 | APRIL 2017
Labor Force to Lecture Hall: Postsecondary Policies in Response to Job Loss

2 Informing Students about Their College Options: A Proposal for Broadening the Expanding College Opportunities Project
The Hamilton Project seeks to advance America’s promise
of opportunity, prosperity, and growth.
We believe that today’s increasingly competitive global economy
demands public policy ideas commensurate with the challenges
of the 21st Century. The Project’s economic strategy reflects a
judgment that long-term prosperity is best achieved by fostering
economic growth and broad participation in that growth, by
enhancing individual economic security, and by embracing a role
for effective government in making needed public investments.
Our strategy calls for combining public investment, a secure social
safety net, and fiscal discipline. In that framework, the Project
puts forward innovative proposals from leading economic thinkers
— based on credible evidence and experience, not ideology or
doctrine — to introduce new and effective policy options into the
national debate.
The Project is named after Alexander Hamilton, the nation’s
first Treasury Secretary, who laid the foundation for the modern
American economy. Hamilton stood for sound fiscal policy,
believed that broad-based opportunity for advancement would
drive American economic growth, and recognized that “prudent
aids and encouragements on the part of government” are
necessary to enhance and guide market forces. The guiding
principles of the Project remain consistent with these views.
MISSION STATEMENT

The Hamilton Project • Brookings 1
Labor Force to Lecture Hall: Postsecondary Policies in Response to Job Loss
Sarah TurnerUniversity of Virginia and National Bureau of Economic Research
NOTE: This policy proposal is a proposal from the author. As emphasized in The Hamilton Project’s original strategy paper, the Project was designed in part to provide a forum for leading thinkers across the nation to put forward innovative and potentially important economic policy ideas that share the Project’s broad goals of promoting economic growth, broad-based participation in growth, and economic security. The author(s) are invited to express their own ideas in policy proposal, whether or not the Project’s staff or advisory council agrees with the specific proposals. This policy proposal is offered in that spirit.
APRIL 2017

2 Labor Force to Lecture Hall: Postsecondary Policies in Response to Job Loss
Abstract
While periods of weak labor market demand and high unemployment may be a good time for newly unemployed workers to invest in their educations, the same weak economic conditions make it difficult for individuals to finance worthwhile postsecondary investments. The two types of public policies that could facilitate such investments—federal financial aid and unemployment insurance—are poorly aligned, making it difficult for newly unemployed workers to identify high-quality postsecondary options and to finance such investments. Current policy infrastructure presents newly unemployed workers with a complicated labyrinth that may contribute to missed opportunities for skill attainment and poor outcomes for those who do enroll. Recommendations for policy reconfiguration include: (1) Restructure federal financial aid for workers who experience job loss; (2) Provide systematic, customized guidance to help newly unemployed workers choose (and complete) postsecondary programs; (3) Limit access to postsecondary programs with poor performance. Not only are government institutions at the intersection of postsecondary and workforce policy in need of reform, but the evidentiary base is woefully inadequate to support the public and private investment. There is potential to not only improve outcomes for individuals through high return postsecondary programs, but to also increase the efficiency of federal and state expenditures by better aligning workforce and postsecondary policies.

The Hamilton Project • Brookings 3
Table of Contents
ABSTRACT 2
CHAPTER 1. INTRODUCTION 5
CHAPTER 2. BACKGROUND: POSTSECONDARY PARTICIPATION AND THE UNEMPLOYED 7
CHAPTER 3. THE CHALLENGE 16
CHAPTER 4. THE PROPOSAL: ENROLLMENT FOR EMPLOYMENT AND EARNINGS 18
CHAPTER 5. QUESTIONS AND CONCERNS 21
CHAPTER 6. CONCLUSION 22
AUTHOR AND ACKNOWLEDGMENTS 23
ENDNOTES 24
REFERENCES 26

4 Labor Force to Lecture Hall: Postsecondary Policies in Response to Job Loss

The Hamilton Project • Brookings 5
Chapter 1. Introduction
College isn’t just for kids. In Fall 2013, 47 percent of undergraduate students were over the age of 21. These older students often seek postsecondary education
as a way to reskill in challenging labor markets. Indeed, it is a straightforward implication of economic theory that workers should consider skill investments during periods of slack employment demand or unemployment, as it is in these periods when the opportunity cost of time is at a temporary low.1 But while postsecondary education might be a relatively good investment when labor markets are weak, the same business cycle conditions can exacerbate credit constraints, making it difficult for individuals to finance worthwhile college investments. Two types of public policies can help. First, a web of financial aid programs including Pell Grants are available to potential adult students as well as to more-recent high school graduates. In addition, unemployment insurance (UI) provides basic income supplements to those who lose jobs, while adding some constraints—for those who enroll in training and education programs—on the programs that UI recipients may participate in while maintaining benefit eligibility. Yet these two disconnected policy channels do not currently provide a clear path for workers, particularly those facing weak labor demand and job loss, to identify and pursue postsecondary options for skill acquisition.
Benefits to postsecondary attainment are widely extolled by policy organizations and leaders in many contexts. Promoting postsecondary investments for workers in the weak labor market of May 2009, President Obama stated, “In a 21st century economy where the most valuable skill you can sell is your knowledge, education is the single best bet we can make, not just for our individual success, but for the success of the nation as a whole.”2 However, postsecondary enrollment is neither free nor without risk for students and taxpayers. Postsecondary grant funding through the Pell Grant program for adult (independent) students reached
$20.6 billion in 2010–11 before declining to $15 billion in 2014–15. Public funding is also provided through a wide array of other channels, including state appropriations to public institutions, federal tax credits, and subsidies to the federal student loan program. For individuals, costs extend beyond direct tuition charges not covered by financial aid to include potentially lost wages while enrolled and, in the worst cases, non-dischargeable student debt obligations that become burdensome when postsecondary attendance does not lead to improved employment outcomes.
Evidence shows that federal financial aid—in combination with labor market policies such as UI—is poorly configured to allow adult workers, particularly those experiencing unemployment, to make high-return postsecondary investments. Rhetoric extolling the virtues of job training and collegiate skills often collides with difficulties in negotiating applications for postsecondary financial aid and questions about how postsecondary participation reconciles with UI benefit eligibility. Indeed, the absence of cooperation and well-articulated policies aligning state-level employment offices (which administer UI) and the federal Department of Education is notable given the ostensible overlapping interests.
Evidence shows that federal financial aid...
is poorly configured to allow adult workers,
particularly those experiencing
unemployment, to make high-return
postsecondary investments.

6 Labor Force to Lecture Hall: Postsecondary Policies in Response to Job Loss
For individuals to make worthwhile investments in skills, they must be able to identify high-return courses of study that are well-suited to their circumstances and they must have access to financial aid and income support to make these investments. Rather than coordinating and aligning objectives across workforce and postsecondary institutions, current policy infrastructure presents a complicated labyrinth that can contribute to missed opportunities for skill attainment and poor outcomes for those who do enroll.
What is required is policy reconfiguration that actively coordinates labor market policies and postsecondary policies, including student aid. Recommendations include
1. Restructuring federal financial aid for workers who experience job loss and aligning this aid with income support programs such as UI;
2. Providing systematic, customized guidance to help workers choose and complete postsecondary programs for which they are well matched; and
3. Limiting access to postsecondary programs that have a record of poor performance, while fostering the development of high-performing programs that meet workforce needs.
Reforming policy to help the unemployed acquire the skills they need to thrive in the 21st century labor market is vital for improving productivity and fostering economic growth. There is potential not only to improve outcomes for individuals through high return postsecondary programs, but also to increase the efficiency of federal and state expenditures by recognizing the need for the alignment of workforce and postsecondary policies.

The Hamilton Project • Brookings 7
Chapter 2. Background: Postsecondary Participation and the Unemployed
Unlike demand for many goods and services, demand for postsecondary education tends to increase in economic downturns. For example, total postsecondary
enrollment increased from 18.2 million to 21 million between Fall 2007 and Fall 2010 (NCES 2012, Table 198). In turn, enrollment increases have also occurred across age groups: between 2007 and 2010 the postsecondary enrollment rate increased from 48.7 percent to 50.8 percent for those ages 18–19, from 30.5 percent to 32.6 percent for those ages 20–24, and from 6.7 percent to 8.5 percent for those ages 25–30 (Barr and Turner 2013).3
Figure 1 shows the overall trend in college enrollment in relation to the unemployment rate. The graph shows the long-run increase in college enrollment, as well as the cyclicality of enrollment, with enrollment levels rising as the unemployment rate increases (orange line). Enrollment by employment status and age appears in figure 2, with the employed appearing in
the top panel and those unemployed appearing in the bottom panel. Presumably, the variation over the business cycle in enrollment rates among the unemployed reflects lower labor market returns relative to skill development when job offers are scarce. What we see is a clear positive gradient in enrollment rates between 2008 and 2012, which is much more pronounced for the unemployed than for the employed. For the unemployed, enrollment rates for those ages 21–23 increased from 16.3 percent to 23.1 percent between 2008 and 2012, from 10.4 percent to 12.7 percent for those ages 24–26, and from 8.1 percent to 12.1 percent for those ages 27–29. Among the unemployed, enrollment rates are higher among those who lose their jobs than those on temporary layoff (Barr and Turner 2015a). Although enrollment rates decline in 2014 as the economy improves, the persistence of some enrollment demand likely reflects continued demand for skill upgrading in the face of technical change.
FIGURE 1.
Enrollment by Age, 1970–2015
Source: U.S. Census Bureau 2016; U.S. Census Bureau and Bureau of Labor Statistics n.d.
0
1
2
3
4
5
6
Ages 14–19 Ages 20–21 Ages 22–24
1970 1975 1980 1985 1990 1995 2000 2005 2010 2015
Une
mpl
oym
ent r
ate
Enro
llmen
t (m
illio
ns)
2
0
4
6
8
10
12
Ages 25–34 Age 35 and above Unemployment rate

8 Labor Force to Lecture Hall: Postsecondary Policies in Response to Job Loss
Substantial shares of individuals receiving unemployment insurance—a subset of the unemployed—enroll in education programs. Calculations from the Survey of Income and Program Participation suggest that between 15 percent and 20 percent of UI recipients ages 20–30 enrolled within six months of initial UI receipt over a similar period (Barr and Turner 2015a). Focusing on a group of permanently dislocated workers receiving UI, Jacobson, LaLonde, and Sullivan (2005) find 23.5 percent of women under 35 and 16.8 percent of men in this age range had completed at least one community college course.
COLLEGE CHOICE: WHERE ADULTS ENROLL
Although there has been increasing attention paid to the link between where students attend college and both college attainment and subsequent labor market outcomes for recent high school graduates (see box 1), postsecondary choice has received less attention for adult students. For adults pursuing terminal certificates or associate degrees, program choice—whether to pursue training in health care, computer programming, or culinary arts—has a significant impact on future earnings and employment outcomes. Moreover, there is ample evidence that there are substantial differences in institutional quality and resources that impact long-term outcomes.4
FIGURE 2.
Enrollment Rate by Employment Status and Age
Employed
Unemployed
Source: U.S. Census Bureau 2008–14.
0
10
20
30
40
50
60
2008 2010 2012 2014
18–20 21–23 24–26 27–29 30–34 Total
18–20 21–23 24–26 27–29 30–34 Total
Age
Age
0
10
20
30
40
50
60Pe
rcen
tPe
rcen
t
2008 2010 2012 2014
0
10
20
30
40
50
60
2008 2010 2012 2014
18–20 21–23 24–26 27–29 30–34 Total
18–20 21–23 24–26 27–29 30–34 Total
Age
Age
0
10
20
30
40
50
60
Perc
ent
Perc
ent
2008 2010 2012 2014

The Hamilton Project • Brookings 9
BOX 1.
Research Lessons from College Choices of Recent High School GraduatesResearch in the past decade on the collegiate attainment of young people has focused on how they negotiate the transition from high school to college. A key finding is that there are substantial differences by family socioeconomic circumstances in how students select colleges and their subsequent collegiate attainment. Low-income students are systematically less likely than their more-affluent peers to attend selective colleges and universities, and are more likely to attend community colleges and less-selective public institutions. For example, examining data from North Carolina on students from a broad achievement range, Bowen, Chingos, and McPherson (2009) show that 40 percent of students who were well-qualified to attend a selective college in 1999 did not enroll in one, with this finding appreciably more pronounced among students in the bottom quartile of family income (59 percent of SAT-taking students) than among students from the top quartile (27 percent). This so-called undermatching is linked to lower college graduation rates (Bowen, Chingos, and McPherson 2009). Notably, it is at the college application stage—not in college admissions or in enrollment decisions—where the behavior of low-income, high-achieving students most clearly diverges from that of their higher-income counterparts (Avery and Turner 2009; Dillon and Smith 2015; Hoxby and Avery 2012).
In the past decade there have been a number of innovations intended to improve the tools and skills that students have to transition from high school to college; examples include the Expanding College Opportunities Project (Hoxby and Turner 2013), the Chicago Schools Project (Roderick et al. 2009), and the College Advising Corps (Horng et al. 2013). The Expanding College Opportunities Project was a randomized control trial that provided customized information about collegiate characteristics, financial aid, and the net price of attendance to high-achieving, low-income students. Key insights included that students and their families were poorly informed about qualitative differences (e.g., graduation rates) among colleges, that they misperceived net price (often underestimating the effects of financial aid), and that they were unaware of optimal application strategies, which entailed consideration of a portfolio of institutions.
The Expanding College Opportunities Project had marked effects on application behavior and college choice, raising the question of whether there are lessons learned that can be applied to the very different population of potential adult students. Like young people in low-income and first-generation families, low-income adults sometimes lack a network of trusted adults to guide them in program selection. Yet there are also notable differences that must be considered. First, adult students are generally not well-positioned to consider the national market for postsecondary options, but are instead constrained geographically in their choices. Second, whereas much of the high-school-to-college research focuses on overall academic characteristics of the college or university, outcomes for adult students may be especially dependent on the particular programs (e.g., nursing, accounting) they enter within institutions.
TABLE 1.
Undergraduate Enrollment by Age and Type of Institution Ages 18–21 Ages 22–29 Ages 30–39
2007–08 2011–12 2007–08 2011–12 2007–08 2011–12
Public
Research universities 1,925,100 2,103,000 805,100 858,600 127,100 152,100
Master’s and Bachelor’s 1,360,100 1,467,200 797,000 848,500 209,100 229,000
Associate’s 2,580,500 2,969,000 1,730,200 2,106,400 890,800 1,075,200
Other 29,700 22,900 25,300 18,900 10,700 7,600
Total 5,865,800 6,539,100 3,332,300 3,813,500 1,227,000 1,456,200
Private nonprofit
Research universities 463,800 490,500 117,700 122,400 25,000 25,600
Master’s and Bachelor’s 1,097,600 1,182,900 413,900 456,500 172,300 206,000
Associate’s 22,000 25,200 14,900 19,200 7,700 10,500
Other 73,500 76,900 53,100 55,500 22,200 23,600
Total 1,583,300 1,698,700 546,500 598,100 205,000 242,100
All for-profit 221,300 298,900 366,600 597,400 240,700 448,200
Total 7,670,400 8,536,700 4,245,400 5,009,000 1,672,600 2,146,500
Source: U.S. Department of Education n.d.; Author’s calculations using National Science Foundation n.d. (WebCASPAR retrieval system).
Note: Enrollment is restricted to undergraduates and enrollment counts are rounded to the nearest one hundred students. Research universities are those that confer at least 20 doctoral degrees. Master’s and Bachelor’s are those with fewer than 20 doctoral degrees but at least half of all degrees conferred were baccalaureate. Associate’s colleges are those where the highest-level degree awarded was an associate’s degree.

10 Labor Force to Lecture Hall: Postsecondary Policies in Response to Job Loss
Enrollment by age group and type of institution at the undergraduate level is shown in table 1. Older students differ from younger students in the types of postsecondary institutions they attend; the increased enrollment over time for older students is largely concentrated in the for-profit sector and public community colleges. For students ages 22–29, the 18 percent increase (or 763,600 students) in enrollment between 2007 and 2011 was largely split between the for-profit sector (30 percent or 230,800 students) and the community college sector (49 percent or 376,200 students). For students in the 30–39 age range, the increase of 28 percent in enrollment (473,900 students) occurred
to a yet greater degree in the for-profit sector with an addition of 207,500 students (44 percent of the growth).
The size of the for-profit sector more than doubled from 2000 to 2007, and its growth—particularly of online and college chain enrollment—accelerated during the period of the Great Recession (Deming, Goldin, and Katz 2012). But what goes up also comes down: as adult enrollment has contracted with economic recovery, it has been the for-profit sector that has seen the greatest retrenchment. Enrollment at for-profit institutions has declined
TABLE 2.
Distribution of Undergraduate Enrollment Growth by Age Group and Completion Quintile
2007 EnrollmentCompletion
quintileAge 18–21 Age 22–24 Age 25–29 Age 30–34
1 608,100 301,200 282,600 174,200
2 855,900 362,700 212,800 103,600
3 1,020,000 362,300 164,400 69,800
4 1,177,400 321,800 116,200 50,100
5 1,382,000 226,300 56,300 21,400
Total 5,043,500 1,574,300 832,300 419,200
2011 EnrollmentCompletion
quintileAge 18–21 Age 22–24 Age 25–29 Age 30–34
1 682,000 336,300 328,800 218,000
2 937,800 397,700 250,200 141,600
3 1,108,400 378,800 182,100 88,600
4 1,268,700 332,500 126,000 60,200
5 1,456,100 237,300 61,100 26,300
Total 5,453,000 1,682,700 948,200 534,700
Change: 2011–2007Completion
quintileAge 18–21 Age 22–24 Age 25–29 Age 30–34
1 73,900 35,200 46,200 43,700
2 81,900 35,100 37,400 37,900
3 88,300 16,500 17,700 18,800
4 91,400 10,700 9,700 10,100
5 74,100 11,000 4,700 4,900
Total 409,500 108,400 115,800 115,400
Distribution of Change: 2011–2007Completion
quintileAge 18–21 Age 22–24 Age 25–29 Age 30–34
1 18.0% 32.4% 39.9% 37.9%
2 20.0% 32.3% 32.3% 32.9%
3 21.6% 15.2% 15.3% 16.3%
4 22.3% 9.9% 8.4% 8.7%
5 18.1% 10.2% 4.1% 4.2%
Source: U.S. Department of Education n.d.; U.S. Department of Education 2017; author’s calculations.
Note: Quintiles of students are weighted by number of students are enrolled. The lowest completion rate quintile is 1 and the highest completion rate quintile is 5. Enrollment is restricted to undergraduates for whom an institution’s completion rate is known, and enrollment counts are rounded to the nearest one hundred students.

The Hamilton Project • Brookings 11
from 2.022 million students in Fall 2010 to 1.556 million students in Fall 2014 (NCES 2015, Table 303.10).
There are at least two reasons why older students might choose to attend for-profit institutions and community colleges. First, these institutions are largely nonresidential; because these institutions are community-based, students are less likely to have to move. Second, both institution types offer courses of study with vocational, technical, and occupational components. These institutions also concentrate on programs of short duration that might lead directly to occupational or skill certification or job placement.
One concern about the programs chosen by adult students—and particularly those chosen during the recessionary period—is that attendance was concentrated among the lowest-performing institutions as measured by program completion rates. Table 2 shows the distribution of students by the overall quintile of program completion rate provided by the College Scorecard (U.S. Department of Education 2017). Even in the baseline year of 2007, more than 33 percent of 25- to 29-year-olds enrolled and 41 percent of 30- to 34-year-olds enrolled attended institutions in the bottom quintile of all institutions, as ranked by completion rates. As enrollment of these older students ballooned in the subsequent years, nearly 40 percent of the increase of students in these age groups was in the bottom quintile, compared to just a 4 percent increase at institutions in the top quintile.
Consideration of the supply side of the postsecondary education market is fundamental to understanding the expected changes in adult enrollment in response to local economic conditions. A potential distinction between for-profit institutions and public community colleges is in their response to increased enrollment demand generated by downturns. Public institutions are subject to the substantial cyclical fluctuations of state revenues: when state tax collections decrease, public institutions are more likely to face budget cuts.5 As shown in recent work by Deming and Walters (2017) and Bound, Lovenheim, and Turner (2010), decreases in state support for public universities are associated with reduced degree attainment.
Since for-profit institutions do not rely on direct subsidies from the state, their supply response to cyclical downturns is somewhat more elastic: there is evidence that decreases in funding for community colleges generate increased supply of for-profit institutions (Cellini 2009). Still, the overall expansion of adult postsecondary participation, combined with the increase in enrollment in relatively expensive for-profit programs, leads to questions about how adults decide where to attend and whether the institutions chosen are well-matched with student characteristics.
FEDERAL FINANCIAL AID FOR ADULT POSTSECONDARY ENROLLMENT
When adults most need to enroll in a postsecondary program—in the wake of job loss—they are least able to
BOX 2.
Title IV Aid for Adult Students
What are now known as Pell Grants were established in the 1972 revision of the Higher Education Act of 1965, and were and originally known as Basic Educational Opportunity Grants. This program broadened the reach of federal funding for postsecondary education along two dimensions. First, Congress used the language “postsecondary education” rather than “higher education,” intending to broaden the range of options beyond traditional baccalaureate programs. The legislation authorizing the Pell Grant program provided explicit convergence between vocational and liberal arts courses of study in the award of postsecondary aid, essentially expanding the scope of federal aid beyond traditional four-year academic programs to include vocational and technical programs. Second, the legislation provided explicit access for independent students, placing older students on the same footing as recent high school graduates in the competition for federal aid. These programs have provided substantial support for adult postsecondary enrollment since the 1970s. Evaluation of financial need draws a statutory distinction between “dependent” students, for whom parental income is a required part of the needs assessment, and “independent” students, with the latter group including students age 24 or older, those with dependents, and those who have served in the military.
Adult students also have access to federal student loan funds, including subsidized and unsubsidized direct loans, along with the additional PLUS loans available for graduate study. Loan limits are appreciably higher for independent students relative to dependent students.
Pell Grants are limited to those who have not completed a bachelor’s degree and, as a result, they provide no assistance to college-educated workers seeking further education or training. The maximum Pell Grant was $5,775 in 2015–16, whereas the amount a student can borrow varies between independent and dependent students, with independent students allowed to borrow more from federal loan programs than dependent students.

12 Labor Force to Lecture Hall: Postsecondary Policies in Response to Job Loss
afford substantial tuition expenditures out of pocket. Student financial aid, including the distribution of Title IV federal aid (loans and Pell Grants), is available to adult students who meet financial eligibility criteria. Eligibility is based on family financial circumstances assessed through the Free Application for Federal Student Aid (FAFSA); students have access to additional support through tuition tax credits.6 Federal support includes the Pell Grant with a maximum of $5,775 in 2015–16 and federal student loans, which allow adult students to borrow $9,500 in the first year (see box 2).7
For all potential students, the capacity to pay (also known as expected family contribution, or EFC) and, in turn, eligibility for federal financial aid, are determined by looking back at prior year income. For workers going back to school in response to job loss or declining labor market demand, retrospective earnings might poorly characterize an individual’s prospects and true financial condition. In short, there are some adult workers who would benefit from access to aid who are nonetheless ineligible under current policy.
Even with limited available financial support, since 1985–86 more than half of Pell Grant recipients have been independent students. The representation of independent students increases in cyclical downturns, recently rising to 60.5 percent in 2009–10 before receding to 54.9 percent in 2014–15, as shown in figure 3. What this figure also illustrates is the dramatic increase in the number of Pell Grant recipients between 2008–09 and 2009–10 from 6.15 million students to more than 8 million students, reflecting both program changes in 2008
that increased the pool of eligible students and the growth in enrollment demand driven by the recession. The scale of the federal investment in postsecondary training through Pell dwarfs other skill development programs targeted to adults. Spending on the Pell program peaked at $39 billion in 2010–11, while the 2014–15 level was $30.6 billion. In comparison, for fiscal year 2015 workforce development activities under Title I of the Workforce Innovation and Opportunity Act (WIOA; the successor to the Workforce Investment Act [WIA] of 1998) were allocated only about $2.6 billion (Bradley 2015). Spending in a broader set of workforce development programs totaled $12 billion in 2009–10 (Bradley 2013). The absence of transparency and limited salience of financial aid availability are magnified for adult students who are outside the basic support network of high school (Bettinger et al. 2012; Dynarski and Scott-Clayton 2013). To make well-informed postsecondary choices, potential students need to understand the range of potential programs, the likelihood of success in these programs, and the net price of each option. Among adult students, those receiving UI face the additional complication of reconciling potential postsecondary options with the state-specific rules for continuation of UI receipt, as well as rules governing alternative training options provided through WIOA. For those matched to WIOA training services, one option for skill development comes through Individual Training Accounts (ITAs); these accounts operate in a voucher format with participants limited to choices from a list of eligible training providers that provide services in high demand fields.8
FIGURE 3.
Total Pell Grant Awards and Share of Pell Grants to Independent Students
Source: College Board 2016, Table 8.
1970 1975 1980 1985 1990 1995 2000 2005 2010 2015
75
60
45
30
15
0
Num
ber (
mill
ions
)
Perc
ent
Percent of recipients who wereindependent (right axis)
Number of Pell recipients(left axis)
0
2
4
6
8
10 75
60
45
30
15
0
The Hamilton Project • Brookings 13
TABLE 3.
Enrollment and Participation in Training by Age
First Claim Year: 2008 Ages 21–23 Ages 24–26 Ages 27–29 Ages 30–34 Ages 35–39
Not enrolled 86.6% 93.3% 93.4% 94.3% 95.5%
Any training / enrollment 13.4% 6.7% 6.6% 5.7% 4.5%
Approved training 4.3% 2.5% 2.5% 2.6% 1.6%
Nonapproved training 9.1% 4.2% 4.1% 3.1% 2.9%
First Claim Year: 2010
Not enrolled 86.3% 89.9% 91.7% 93.3% 93.7%
Any training / enrollment 13.7% 10.1% 8.3% 6.7% 6.3%
Approved training 4.7% 3.2% 2.6% 2.3% 2.3%
Nonapproved training 9.0% 6.9% 5.7% 4.4% 4.0%
First Claim Year: 2014
Not enrolled 89.3% 91.7% 94.8% 93.2% 95.7%
Any training / enrollment 10.7% 8.3% 5.2% 6.8% 4.3%
Approved training 5.3% 3.3% 1.6% 2.1% 1.7%
Nonapproved training 5.4% 5.0% 3.6% 4.7% 2.6%
Source: Author’s calculations; U.S. Department of Labor 2016.
Note: Data are limited to potential undergraduates, defined as those who have completed high school, but do not have a bachelor’s degree.
TABLE 4.
Demographic Distribution of UI recipients by Enrollment Status
2008 2010 2015
Overall Enrolled Overall Enrolled Overall Enrolled
Education No high school 14.3% 7.4% 12.4% 5.4% 10.4% 4.0%
High school 42.2% 26.9% 42.1% 24.7% 42.0% 23.2%
Some college / Associate’s degree
31.5% 53.0% 32.7% 60.9% 33.7% 58.8%
Bachelor’s degree or more 12.1% 12.6% 12.8% 9.0% 14.0% 14.0%
Race Black non-Hispanic 18.6% 22.3% 16.3% 22.9% 20.9% 24.0%
Gender Female 41.5% 50.3% 40.2% 51.4% 39.2% 46.4%
Wage Mean wage $8,400 $7,500 $8,200 $7,100 $10,000 $9,200
Source: Author’s calculations; U.S. Department of Labor 2016.
Note: Mean wage is the average of the highest quarterly wages for UI recipients during any of the preceding 4 quarters before job loss, rounded to the nearest one hundred dollars.
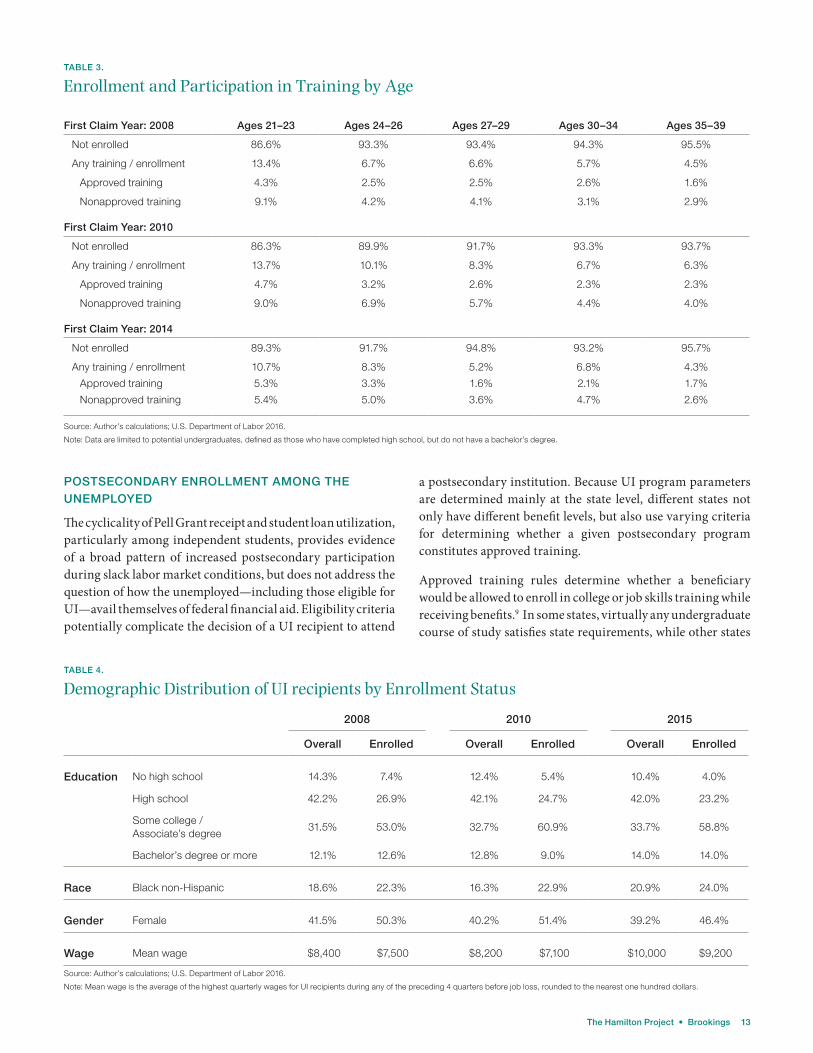
POSTSECONDARY ENROLLMENT AMONG THE UNEMPLOYED
The cyclicality of Pell Grant receipt and student loan utilization, particularly among independent students, provides evidence of a broad pattern of increased postsecondary participation during slack labor market conditions, but does not address the question of how the unemployed—including those eligible for UI—avail themselves of federal financial aid. Eligibility criteria potentially complicate the decision of a UI recipient to attend
a postsecondary institution. Because UI program parameters are determined mainly at the state level, different states not only have different benefit levels, but also use varying criteria for determining whether a given postsecondary program constitutes approved training.
Approved training rules determine whether a beneficiary would be allowed to enroll in college or job skills training while receiving benefits.9 In some states, virtually any undergraduate course of study satisfies state requirements, while other states

14 Labor Force to Lecture Hall: Postsecondary Policies in Response to Job Loss
are more restrictive. For example, in Alabama and South Carolina only explicitly vocational programs meet eligibility criteria, whereas in Delaware and California virtually any undergraduate program qualifies.
UI recipients are nonetheless allowed to pursue training or enrollment even if the program of study is not explicitly approved, and can still receive benefits as long as the individual is able and available for employment. In practice, what this means is that a UI recipient enrolled in a nonapproved program would be considered available for work if the person is willing to quit the training course or to attend the training in such a manner that it does not interfere with being available for work. Empirically, a striking majority of UI recipients enrolled are in nonapproved courses of study, including academic courses, vocational training, and WIA programs. This pattern is shown in table 3, using data from the Benefit Accuracy Measurement (BAM) data set.
These data also allow us to describe the characteristics of the UI recipients who choose to enroll (table 4). Relative to the overall pool of UI recipients, those who seek further training while receiving UI are generally those with some prior college experience that stops short of a bachelor’s degree. Also, while men are the majority of UI recipients, women and black UI recipients are somewhat more likely to enroll than UI recipients from other demographic groups. Finally, those who enroll have somewhat lower pre-UI earnings and are on average younger than other UI recipients.
Some states offer extended training benefits—generally 26 weeks—for those enrolled in approved training programs. The American Recovery and Reinvestment Act (ARRA), signed into law on February 17, 2009, set aside $7 billion to be awarded to states as UI modernization incentive payments, provided the
state UI programs met certain requirements, which included the option of adding a 26-week training component.10 Many states adopted an extended training program effective in 2010, presumably to meet this requirement, while a few states had at least some extended training benefits prior to the passage of the ARRA. Eligibility for these extended benefits may affect the type and duration of postsecondary programs chosen by UI recipients.
Although the general absence of coordination between UI provisions allowing for training and postsecondary enrollment is striking, there is one notable exception in federal policy. In May 2009 the Department of Labor along with the Department of Education put forward informational resources and guidance aimed to encourage education and training for those who had lost jobs (see box 3). At the recommendation of the Department of Labor, a number of states sent letters to UI recipients that provided information about financial aid eligibility and encouragement to consider postsecondary enrollment. Nearly 40 states issued letters at some point after May 2009 to either new UI recipients or all UI recipients. Following the mailing of the letters, there was a marked increase in enrollment, with letter recipients enrolling at a rate about 4–5 percentage points greater than those who did not receive the letter.
The observation of substantial increases in adult enrollment and enrollment among the unemployed does not by itself demonstrate policy effectiveness. Of course, the goal is to increase degree attainment and associated benefits in the labor market. There is also a risk that many individuals attended programs that were low quality or poorly suited to student needs, yielding costs for individuals and taxpayers with little return. On these fronts, the evidence to date is unfortunately inconclusive, largely due to lack of data.
BOX 3.
Pell Letters Provided Relevant Financial Aid Information During the Recession
Enrollment responses to a policy action in 2009 provide important evidence suggesting that UI recipients might lack much of the information needed to make decisions about postsecondary training. As job losses spiked in Spring 2009, economists in the government and those advising policy makers emphasized the need to provide workers with options for skill acquisition during the downturn, while raising concerns that individuals were poorly informed about available training options and federal financial aid.
In May 2009 a virtually unprecedented interagency effort including the White House, the Department of Education, and the Department of Labor put forward informational resources and guidance aimed to encourage education and training for those who had lost jobs. One concern was that state-level UI rules imposed barriers that—either in practice or perception—limited students’ capacity to enroll in training. Second, even when workers wanted to enroll, they were deterred by concerns about financing postsecondary participation. Not only did workers have limited information about federal aid such as Pell Grants, but the emphasis of the application process on prior year earnings failed to reflect their current capacity to pay.
A guidance letter from the Department of Labor (2008) sent to state workforce agencies encouraged states to notify UI recipients of eligibility for financial aid and to provide appropriate application assistance. Because not all states followed the

The Hamilton Project • Brookings 15
guidance, the Department of Labor effectively initiated an informational experiment in which some states sent a model letter (known as the Pell letter) to UI recipients that informed them of their eligibility for Pell Grants and how to pursue enrollment opportunities. In addition, the Department of Education issued guidance to all financial aid officers making it clear that UI receipt should be considered in determination of needs assessment.
The enrollment response to this initiative is the subject of Barr and Turner (2015b). The message of the letters, following the federal prototype, conveyed four broad messages: (1) an encouragement to pursue training with a reference to the benefits of education (“Studies have shown that workers with more education and training have more secure jobs and higher wages”), (2) notification of the availability of Pell Grants with an explicit reference to the maximum dollar amount ($5,350 at the time), (3) an implication that UI recipients would receive special consideration in aid determination, and (4) a set of state contacts to assist workers with the next steps in application and enrollment.
The main takeaway from the comparison of Pell letter recipients to non-recipients is captured in box figure 1. The horizontal axis shows months since initial UI receipt and the vertical axis shows enrollment rates, with the enrollment rates of those who received the letter (green) distinguished from those who did not receive the letter (purple). Enrollment rises steadily over the first six months of a spell before leveling off for both the letter recipients and the nonrecipients. Yet there is a sharp divergence between the two groups, with the letter recipients enrolling at a rate about 4–5 percentage points greater than those who did not receive the letter. A more refined econometric analysis confirms this effect. In addition, qualitative evidence from the National Association of State Workforce Agencies (NASWA 2010) survey suggests that many (but not all) states did, indeed, experience significant responses to the letter, though states lacked a formal mechanism to track responses to the letter mailings.
These are large enrollment effects for a relatively modest intervention. Several factors contributed to the response: the letters were addressed to the individual and represented official communication, the letters contained easy and direct instructions on how to proceed, and the reference of the dollar amount for a Pell Grant could have increased salience.
BOX FIGURE 1.
Enrollment by Months Since First UI Receipt
Source: Barr and Turner 2015b.
Non-recipients Pell Letter recipients
12
10
8
6
4
2
00 10 20 30 40
Perc
ent e
nrol
led
Months since �rst UI receipt

16 Labor Force to Lecture Hall: Postsecondary Policies in Response to Job Loss
Chapter 3. The Challenge
Evidence about the postsecondary participation of the unemployed, combined with economic theory, points to opportunities for policy improvement. Particular areas
for special consideration include: (1) choice of postsecondary programs, (2) financing of postsecondary choices, and (3) availability of postsecondary options, particularly in recessionary conditions. In addition, significant data deficiencies impede both policy-supporting research and the deployment of decision-support tools to help workers select a program.
HOW WORKERS CHOOSE POSTSECONDARY PROGRAMS
How do workers decide whether to enroll in a postsecondary program and, if they decide to do so, how do they choose a program? An understanding of individual preparation and preferences, prospects for success in different programs, labor market returns, and the costs of postsecondary options are all necessary to make a fully informed decision. However, the low success rates and high default rates of many adult students suggest that their choices are not fully informed. These potential students lack access to the information typically provided by high school guidance counselors and a large group of peers who are also considering enrollment. In addition, employment services available to adult potential students at One-Stop Career Centers sometimes include only rudimentary information on postsecondary options and the availability of federal financial aid. Although statements such as, “Studies have shown that workers with more education and training have more-secure jobs and higher wages” (from the model Pell letter) might be correct on average, the costs of unsuccessful training are high.
Given the growing evidence that graduating high school students are often poorly informed about likely postsecondary outcomes, it is not surprising that adult students, including the unemployed, face similar difficulties. These students are often poorly informed about expected outcomes (both earnings and graduation rates) at different programs, as well as the net price of various options. In the past decade, there have been a number of innovations intended to improve the tools and skills that students have to transition to college, but these focus almost exclusively on students at the end of high school.
Those prospective students who are unemployed may especially require assistance extending beyond college choice to include academic guidance that supports completion and attainment. For example, students might be poorly informed about the need to meet the standards of Satisfactory Academic Progress (SAP; Scott-Clayton and Schudde 2016) and, without early guidance, could lose aid eligibility. Adult students might also need additional academic supports or assistance to exercise strong study skills, having spent years away from the routine of school.
FINANCING POSTSECONDARY CHOICES
The difficulty of financing postsecondary investments is a fundamental challenge for the unemployed, who generally have more limited access to credit for both direct college costs and subsistence. In principle, the combination of Pell Grants, federal education loans, and UI can eliminate credit constraints for this population. In practice, the administrative structure, eligibility criteria, and generosity of these programs limit the extent to which credit constraints for the unemployed are ameliorated.
Student Aid Needs Analysis
To receive federal Pell Grants or student loans, a student must complete a FAFSA based on prior year tax and asset information. After doing so, she will receive a judgment on aid eligibility and expected capacity to pay. Although the FAFSA process is itself cumbersome (Dynarski and Scott-Clayton 2013), the backward-looking assessment creates an additional problem for recently unemployed workers: job loss substantially reduces the income available to fund educational investments relative to the prior year information used for the FAFSA. It is possible for institutions to use professional judgment in evaluating the cases of the recently unemployed, but potential students might not be aware of this option, and institutions could be reluctant to use this process given the increased audit risk it entails. In short, needs analysis is poorly configured to the needs of those who lose jobs because it is backward looking and does not reflect current financial circumstances.
UI Benefits and Replacement Income
Continuation of UI benefits to cover family living expenses is likely to be necessary for those without jobs to enroll in

The Hamilton Project • Brookings 17
postsecondary programs on a full-time basis. Although it is possible to enroll in postsecondary programs and continue to receive benefits through the approved training provisions, the administrative hurdles to getting such approval are often significant. What is more, there is wide variation across states in the list of eligible programs; as a result, there are individual-program pairings that make economic sense but would not qualify for approval in some states.
SUPPLY-SIDE CONSTRAINTS
It is well-established that postsecondary demand increases during cyclical downturns, yet it is during these periods when state appropriations to colleges and universities are often cut, resulting in institutions trying to serve more students with fewer resources. Yet it is also at these times that job offers are most limited and adult workers will get the greatest returns to postsecondary investments. Crowding—defined as excess demand during times when enrollment demand is most acute—might constrain the extent to which unemployed workers are able to invest in postsecondary attainment (Bound and Turner 2007). Although the public sector is likely to demonstrate supply constraints and crowding, for-profit providers are positioned to expand during times of increased enrollment demand (Cellini 2009). Some of these for-profit programs provide strong training, but others may exploit vulnerable populations. Deming, Goldin, and Katz (2012) show that although for-profit providers have demonstrable success in relatively short-term certificate programs,
these institutions are also likely to generate more-limited employment prospects, lower earnings, and greater debt burdens for students relative to public and nonprofit options.
DATA AND ANALYTIC DEFICIENCIES
Research evidence on the postsecondary participation of the unemployed is decidedly limited relative to the magnitude of the current federal and state investments. A number of questions have not been adequately addressed: which workers choose to enroll and do those workers benefit the most from postsecondary training? What postsecondary programs are attended by those who choose to enroll? What information and resources do workers use in choosing what institution to attend and what degrees and certificates to pursue? What are the subsequent labor market returns to postsecondary investment and how do they compare to returns to other active labor market programs, including WIA services and direct reemployment? Answers to these questions are hard to come by for at least two reasons. First, data connecting labor market and educational experiences with program participation are scarce because traditional survey data sets are ill-suited to collect such information, while the nature of the questions requires matching across numerous administrative systems. Second, the organization of academic researchers as well as the policy community tends to generate silos, such that the interaction across topics (e.g., unemployment and college enrollment) is limited.

18 Labor Force to Lecture Hall: Postsecondary Policies in Response to Job Loss
Chapter 4. The Proposal: Enrollment for Employment and Earnings
Increased alignment of education and labor market policies is necessary to improve postsecondary attainment and long-term economic prosperity for UI recipients, as well
as adult students more generally. Such coordination has been haphazard at best in recent decades. This paper proposes to integrate labor market policies—particularly UI—with postsecondary financial aid and assistance expected to improve earnings and employment prospects. This Enrollment for Employment and Earnings (EEE) policy would combine guidance on program selection and labor market options with financial aid and income support while enrolled. EEE would replace the Pell Grant program and tuition tax credits for independent UI-eligible students, and would partner with UI and other income support programs.
PROGRAM PARAMETERS
Basic parameters are as follows:
Notification
All UI recipients would be notified of potential eligibility for EEE at the point of UI application. In addition, a short skills inventory and employment interests survey would be embedded in the required registration with the state workforce services agency. Those UI recipients who express an interest in training or enrollment would be provided with more comprehensive information and guidance on postsecondary choice.
Benefit Generosity
UI recipients choosing to enroll in approved training under the EEE program would be eligible for an educational supplement to cover tuition, fees, and direct educational expenses (transportation, books) up to an annual cap of $7,400—1.25 times the current Pell Grant, allowing for full-year enrollment—and a lifetime cap of $15,000 in educational expenditures. UI recipients demonstrating expected advancement in a full-time program would be eligible for 26 weeks of additional UI receipt; for those enrolled in a part-time program, extended training benefits spread over a 52-week period. EEE program recipients would also be eligible for federal student loans, with the maximum availability dependent on expected post-completion earnings and duration of program.
Benefit Eligibility
a. Application: Application for initial EEE benefit receipt requires completion of an enrollment choice module that would provide personalized information on characteristics of program options, including skill prerequisites, program duration, completion statistics, and future earnings. This module would directly link participants to the program application, with EEE resources covering application fees for up to five programs. Eligibility would not be limited to those without four-year degrees, but would also provide for skill acquisition among those with a bachelor’s degree.
b. Acceptance and enrollment: Upon acceptance and enrollment in a particular program, the recipient would be required to complete an academic and financial planning module. Receipt of an EEE tuition award would be subject to an ability to benefit criteria, which would be applied using information obtained as part of this module.11 The EEE award would pay tuition and fees directly to the educational institution, with some of the award to be refunded in the case of incomplete enrollment terms.
c. Continued benefit receipt: Beyond weekly self-reported attendance (consistent with existing UI search requirements), institutional certification of satisfactory academic progress and course completion would be required for continuation of benefits.
Supply-Side Supports
The costs to postsecondary institutions of enrolling UI recipients, providing support services unique to this population, and providing placement services will generally exceed the tuition and fees paid. Failure to acknowledge such excess costs could result in undersupply of program opportunities, particularly in high-demand fields. This would be undesirable given that maintaining incentives for institutions to deliver high-quality programs is also a policy priority. Initially on an experimental basis, the EEE program would provide a per student subsidy to institutions that meet benchmarks related to enrollment, mid-program student progress, program completion, and target earnings and employment outcomes two years after enrollment.
The Hamilton Project • Brookings 19
Demand for education and training is cyclical, with more individuals enrolling when the labor market is weak. This contrasts with state support for higher education, which falls when labor markets decline. The result is predictable crowding and excess demand because options in high return programs are limited.12 To improve the functioning of the program during recessions, the EEE supply-side supports could increase in times of high unemployment while expanding for high-demand subjects such as health sciences and information technology.13
Supply-Side Regulation
Minimum standards for eligible programs would be set by the federal government in terms of Title IV aid eligibility, and states would have the option to regulate access at the program, certificate, and degree level within institutions. States’ workforce agencies would limit access to programs with poor performance records, as indicated by, high default rates, low completion rates, and low employment rates.
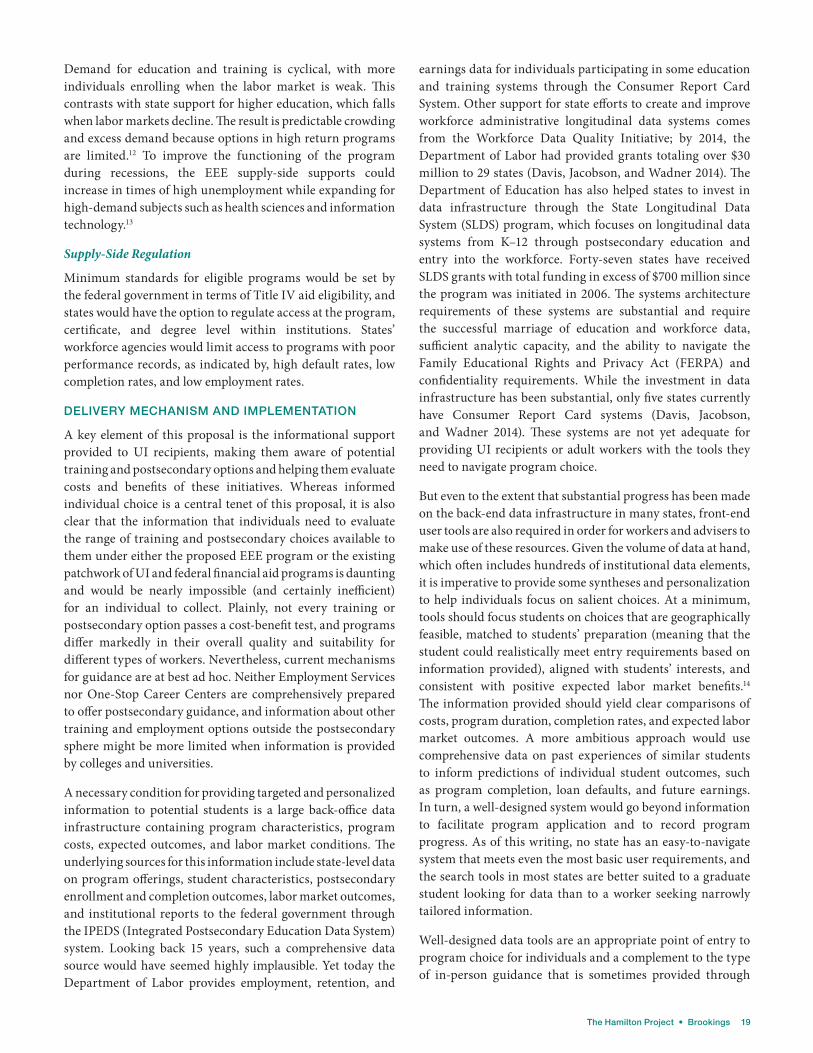
DELIVERY MECHANISM AND IMPLEMENTATION
A key element of this proposal is the informational support provided to UI recipients, making them aware of potential training and postsecondary options and helping them evaluate costs and benefits of these initiatives. Whereas informed individual choice is a central tenet of this proposal, it is also clear that the information that individuals need to evaluate the range of training and postsecondary choices available to them under either the proposed EEE program or the existing patchwork of UI and federal financial aid programs is daunting and would be nearly impossible (and certainly inefficient) for an individual to collect. Plainly, not every training or postsecondary option passes a cost-benefit test, and programs differ markedly in their overall quality and suitability for different types of workers. Nevertheless, current mechanisms for guidance are at best ad hoc. Neither Employment Services nor One-Stop Career Centers are comprehensively prepared to offer postsecondary guidance, and information about other training and employment options outside the postsecondary sphere might be more limited when information is provided by colleges and universities.
A necessary condition for providing targeted and personalized information to potential students is a large back-office data infrastructure containing program characteristics, program costs, expected outcomes, and labor market conditions. The underlying sources for this information include state-level data on program offerings, student characteristics, postsecondary enrollment and completion outcomes, labor market outcomes, and institutional reports to the federal government through the IPEDS (Integrated Postsecondary Education Data System) system. Looking back 15 years, such a comprehensive data source would have seemed highly implausible. Yet today the Department of Labor provides employment, retention, and
earnings data for individuals participating in some education and training systems through the Consumer Report Card System. Other support for state efforts to create and improve workforce administrative longitudinal data systems comes from the Workforce Data Quality Initiative; by 2014, the Department of Labor had provided grants totaling over $30 million to 29 states (Davis, Jacobson, and Wadner 2014). The Department of Education has also helped states to invest in data infrastructure through the State Longitudinal Data System (SLDS) program, which focuses on longitudinal data systems from K–12 through postsecondary education and entry into the workforce. Forty-seven states have received SLDS grants with total funding in excess of $700 million since the program was initiated in 2006. The systems architecture requirements of these systems are substantial and require the successful marriage of education and workforce data, sufficient analytic capacity, and the ability to navigate the Family Educational Rights and Privacy Act (FERPA) and confidentiality requirements. While the investment in data infrastructure has been substantial, only five states currently have Consumer Report Card systems (Davis, Jacobson, and Wadner 2014). These systems are not yet adequate for providing UI recipients or adult workers with the tools they need to navigate program choice.
But even to the extent that substantial progress has been made on the back-end data infrastructure in many states, front-end user tools are also required in order for workers and advisers to make use of these resources. Given the volume of data at hand, which often includes hundreds of institutional data elements, it is imperative to provide some syntheses and personalization to help individuals focus on salient choices. At a minimum, tools should focus students on choices that are geographically feasible, matched to students’ preparation (meaning that the student could realistically meet entry requirements based on information provided), aligned with students’ interests, and consistent with positive expected labor market benefits.14
The information provided should yield clear comparisons of costs, program duration, completion rates, and expected labor market outcomes. A more ambitious approach would use comprehensive data on past experiences of similar students to inform predictions of individual student outcomes, such as program completion, loan defaults, and future earnings. In turn, a well-designed system would go beyond information to facilitate program application and to record program progress. As of this writing, no state has an easy-to-navigate system that meets even the most basic user requirements, and the search tools in most states are better suited to a graduate student looking for data than to a worker seeking narrowly tailored information.
Well-designed data tools are an appropriate point of entry to program choice for individuals and a complement to the type of in-person guidance that is sometimes provided through

20 Labor Force to Lecture Hall: Postsecondary Policies in Response to Job Loss
on-site or online interaction with personnel at the One-Stop Career Centers. For some students all consideration and assessment will follow from the online point of access, whereas others might want or need more-comprehensive guidance services.
In order to create a well-functioning data tool, states should be encouraged to work together to develop and test scalable models for information dissemination and platforms to aid workers with postsecondary choice. Fifty (or more) decentralized and idiosyncratic models would be inefficient, though the state of knowledge does not warrant a mandate for a particular design or a single federal system.
BENEFITS AND COSTS
Well-functioning systems yield long-run returns and represent a form of infrastructure investment, with benefits accruing over many years. The costs include both the actual system design and testing to move from development to implementation at scale.
In assessing program costs and benefits, it is worth noting that much of the service delivery component of the proposed EEE program does not change benefit eligibility to the extent that many UI recipients are already eligible for Pell Grants. Moreover, in some (though not all) states, extended training provisions are already on the books, offering 26 weeks of added UI benefits for those enrolled in approved training.
The two most important factors that impact the benefit-cost proposition for this proposal are (1) take-up and (2) selection. The informational component of the intervention is intended to encourage enrollment among those with a capacity to benefit as well as to discourage or prevent enrollment where outcomes are expected to be poor. To the extent that UI recipients are presently poorly informed about postsecondary options, we would expect take-up to increase. In turn, we would hope that the proposed program would encourage enrollment among those with high expected returns in strong programs of study.
However, with any program of this scope there is a concern about moral hazard: requirements for academic progress are intended to discourage enrollment as a means to avoid labor force participation while gaining few marketable skills (e.g., 24 credit hours of whale-watching and scuba diving).
Though it is not possible to precisely calculate the monetary costs and benefits of the proposal, a general characterization is useful. The benefits and costs of this proposal fall into the following broad categories:
Potential Benefits Potential Costs
Increased skill acquisition/attainment
Greater tuition expenditures
Increased future earnings Increased UI payout/duration
Reduced loan default Intervention development costs
The Hamilton Project • Brookings 21
Chapter 5. Questions and Concerns
1. How would the EEE grants be financed without placing funding for recent high school graduates at risk?
How much the EEE program would cost would depend on enrollment demand and the extent to which enrollment demand would change with altered guidance on funding incentives. EEE grants would explicitly tie grant availability to program duration, which would serve to reduce expenditures by providing incentives for timely completion. While some guidance and information might reduce demand for poorly performing programs, it is plausible that overall enrollment demand would increase, particularly in periods of slack employment demand.
2. The proposed limitations on access and borrowing in poorly performing programs raise many of the same objections that have been noted to the Gainful Employment Rule. Are these limitations disproportionately targeting for-profit higher education?
It is important to emphasize that poorly performing programs exist in the public and private nonprofit sectors as well as among for-profits. Regardless of sector, consumer protection is an appropriate function of the federal government, particularly when taxpayer dollars are at stake.
3. Why is R&D necessary before implementing a system distributing information about postsecondary options and federal financial aid to adult workers and students?
There is a large and growing list of well-intentioned but ineffective tools aimed at informing postsecondary choice. (See NCES [n.d.] and U.S. Department of Education [2017] for examples from the federal government.) The problem of designing effective tools is difficult to resolve because there is a massive amount of data that could be used to evaluate postsecondary options and financing, and different slices of that data are relevant to different individuals based on
geography, aptitude, and preferences. One-size-fits-all messaging will often fail to help individuals determine whether postsecondary education is a good fit given their circumstances; it is also ineffective at matching potential students with the programs that are most appropriate for their goals. Moreover, implementation and delivery are important components of any informational intervention, and it is often the case that pilot projects and efficacy testing can markedly improve the quality of the intervention.
4. Do the challenges discussed here have broader implications for federal financial aid policy?
While the focus of this proposal is on how the unemployed access postsecondary enrollment options, this group represents a minority of adult and independent students receiving federal financial aid through the Pell Grant program, federal student lending, and tuition tax credits. The EEE program sketched above also suggests an overall restructuring of the federal student aid available to adult and independent students, which would be a logical extension. The current backward-looking needs analysis mechanism for allocation of Pell Grants and subsidized student loans is poorly structured to meet the needs of students who experience labor market disruptions or see opportunities to invest in postsecondary programs to improve their career trajectories. The one-size-fits-all approach that places independent and dependent students under the same umbrella might also encumber enrollment decisions for recent high school graduates. Both groups could be better served, while presenting a more efficient use of public resources. A good starting point for such an approach would be the recommendations of the Rethinking Pell Grants panel (College Board 2013), which proposed the division of the Pell Grant into two different aid vehicles: Pell Y, serving young people through the age of 24; and Pell A, serving adults ages 25 and older returning to school.15

22 Labor Force to Lecture Hall: Postsecondary Policies in Response to Job Loss
Chapter 6. Conclusion
High default rates and low program completion rates for adult students suggest that the challenge of closing the skills gap will require policies that aim to do more
than simply increase enrollment rates.16 On the government ledger, the combined spending on Pell Grants, tuition tax credits, state subsidies for postsecondary education—along with labor market programs such as UI for older workers—is in the billions annually. For individual workers, the stakes are yet higher: successful postsecondary investments that produce upgraded skills have the potential to produce long-term gains in earnings, while unsuccessful postsecondary experiences result in lost wages and crippling debt.
Fortunately, a stronger evidentiary base and thoughtful policy reform—including better coordination between workforce and postsecondary policies—can help the unemployed and adult workers more generally to acquire the skills they need to thrive in the 21st-century labor market. The returns to policies that effectively improve postsecondary enrollment decisions of the unemployed are potentially enormous. For these adults, strong postsecondary experiences can boost employment and earnings trajectories, while negative experiences contribute to downward spirals into poverty and dependency.

The Hamilton Project • Brookings 23
Author
Sarah Turner Sounder Family Endowed Chair and University Professor of Education and Economics, University of Virginia; National Bureau of Economic Research
Sarah Turner is a University Professor and the Souder Family Professor at the University of Virginia and a research associate with the National Bureau of Economic Research. Turner’s research focuses on the economics of the education market, with particular attention to higher education. Recent work focuses on the economics of college choice and how federal financial aid affects students’ collegiate attainment. Turner is a Principal Investigator of the Expanding College Opportunities project, a randomized controlled trial that had significant effects on the college choices of low-income, high achievers. Her research also examines scientific labor markets and the flow of foreign students to colleges and universities in the U.S. Turner received her B.A. from Princeton University and her Ph.D. in economics from the University of Michigan.
AcknowledgmentsI am grateful to Emily Cook, Johanna Brownell, Megan Mumford and the team at The Hamilton Project for assistance and good cheer in the preparation of this paper. Ross Miller was exceedingly helpful in facilitating access to Benefit Accuracy Measurement data.

24 Labor Force to Lecture Hall: Postsecondary Policies in Response to Job Loss
Endnotes
1. Broadly, as the unemployment rate rose from 6.5 percent to 10 percent between October 2008 and October 2009, college enrollment followed with a lag, rising from 19.1 million to 21 million between 2008 and 2010. Eighty-seven percent of that increase in enrollment of 1.9 million students was among students 20 years of age and older (National Center for Education Statistics [NCES] 2012, Table 224; NCES 2015, Table 303.45).
2. In these remarks, President Obama continued, “So if we want to help people not only get back on their feet today but prosper tomorrow, we need to take a rigorous new approach to higher education and technical training. And that starts by changing senseless rules that discourage displaced workers from getting the education and training they need to find and fill the jobs of the future” (White House 2009).
3. Significantly, much of the cyclicality of college enrollment has historically come from students outside the pool of recent high school graduates (Barr and Turner 2013; Betts and McFarland 1995; Christian 2007). Using variation within states over time, Barr and Turner (2013) find that over the past two decades relative changes in enrollment rates are greater for students in their 20s than for those in their late teens: a within-state change in the unemployment rate of 5 percentage points predicts a 17 percent increase in enrollment for those ages 20–24, and a 12 percent increase for those ages 18–19. Naturally, much adult enrollment occurs among those in their 20s and 30s rather than among older workers, because the former will have more years over which to recoup the benefit of investment.
4. In addition to the 4,583 degree-granting postsecondary institutions of which 1,620 are public, 1,701 are nonprofit, and 1,262 are for-profit, there are 2,524 institutions that grant terminal (less than two-year) certificates that are also eligible for federal financial aid (NCES 2015, Tables 317.20, 317.30).
5. Although community colleges are sometimes thought of as providing an automatic stabilizer to the local economy (Betts and McFarland 1995), the capacity to perform this function can be limited by the cyclical nature of state funding. As evidence of the severity of crowding in economic hard times, Betts and McFarland (1995) note that during the 1991 recession about 45,000 students in California community colleges withdrew because they were unable to obtain desired courses.
6. The reference to “tax credits” in a general sense captures three related federal programs. First and second, the Hope Scholarship Tax Credit and the Lifetime Learning Credit were introduced in 1997. Third, the American Opportunity Tax Credit (AOTC) was enacted as part of the American Recovery and Reinvestment Act in 2009. The AOTC provides for 100 percent of the first $2,000 of qualifying tuition and fees, plus 25 percent of the next $2,000 for a maximum credit of $2,500; it is partially refundable (up to 40 percent). Bulman and Hoxby (2015) provide convincing evidence that even though tax expenditures on these programs exceed $19 billion, they had little effect on enrollment.
7. Dependent students are limited to $5,500 in first year borrowing (with a maximum of $3,500 in subsidized loans), with a total loan cap of $31,000 in undergraduate debt in federal direct loans; independent students are allowed to borrow up to $9,500 in the first year (with a maximum of $3,500 in subsidized loans), with a total loan cap of $57,500 in undergraduate debt in federal direct loans (see Federal Student Aid n.d.). The higher loan cap for independent students can place them in a particularly vulnerable position in borrowing to attend high-cost private institutions, particularly in the for-profit sector.
8. Under the Job Training Partnership Act of 1982, job training candidates were typically assigned to a publicly provided training program. The Workforce Investment Act subsequently shifted to the voucher-like ITA mechanism. ITAs are typically used for occupational training programs that are shorter in duration than those typically offered as degree-granting programs at community colleges, although many training services open to WIA recipients are located at community colleges. A notable feature of the WIA mandate passed down to states was the requirement for state agencies to collect six metrics for the training providers: (1) program completion rates, (2) employment at placement, (3) wages at placement, (4) retention in employment at six months, (5) wages at six months, and (6) rate of licensure (Van Horn and Fichtner 2011).
9. It is a federal requirement that all states must waive the work requirements for UI recipients in approved training. Federal guidelines include, “All states must include in their law a provision for approved training. Section 3304(a) (8) of the Federal Unemployment Tax Act, requires that compensation shall not be denied to an individual for any week because the claimant is in training with the approval of the state workforce agency or because of the application, to any such week in training, of state law provisions related to availability for work, active search for work, or refusal to accept work. Each state will define what constitutes approved training and waive the requirements for seeking work, refusing work or referral to work and other eligibility requirements” (U.S. Department of Labor 2005, Guide Sheet 3).
10. In order for a state to receive the full incentive payment, the state UI program needed to allow at least two of the following: (1) compensation for individuals seeking part-time work, (2) compensation for individuals who left employment for certain family reasons (such as domestic violence or illness of a family member), (3) an additional 26 weeks of compensation for people who exhaust regular UI and enroll in an approved training program, or (4) payments of at least $15/week for each dependent of an eligible beneficiary.
11. In effect, the individual must be academically qualified to succeed in the program and the program must have ample labor market demand and prospects for employment.
12. This recognition is not new and is well-supported by research evidence. The Hamilton Project (2010) provides a direct recommendation: provide federal funds to address the supply-side deficit through a federal fund to help ramp up community college offerings during recessionary periods.
13. This idea is consistent with the recommendation for a Recession Community College Fund proposed, as proposed by The Hamilton Project (2010).
14. Note that for an increasing number of students, delivery of programs online in whole or in part is a growing option. On the one hand, this increases the set of potential choices, particularly for those in rural areas or with limited supply of postsecondary options (Deming, Lovenheim, and Patterson 2016). On the other hand, knowledge of the returns to such programs is so limited that it is hard to assess whether they are high-return options.
15. The report (College Board 2013, 11) states, “To best serve all recipients, from young high school graduates enrolling in bachelor’s degree programs to older adults seeking short-term labor market preparation, the Pell Grant program should be restructured to eliminate the constraints of a one-size-fits-all program. The program should be divided into two components: Pell Y, serving young people through the age of 24, and Pell A, serving older adults returning to school.” The Pell

The Hamilton Project • Brookings 25
A proposed by the Rethinking Pell panel would provide students with limited funds to cover tuition and fees for 125 percent of the duration of the chosen program at a level of generosity consistent with tuition at a college; while eligibility for Pell A Grants would include those with low earnings, those separated from the labor force, and those experiencing spells of unemployment. The proposal outlined in the text broadly resembles the Pell A.
16. Looney and Yannelis (2015) provide striking evidence that much of the observed increase in default rates between 2000 and 2011 can be attributed to the rise in nontraditional students and the concentration of these students at weak colleges and universities.

26 Labor Force to Lecture Hall: Postsecondary Policies in Response to Job Loss
References
American Recovery and Reinvestment Act of 2009 (ARRA) Pub.L. 111–5 (2009).
Avery, Chris, and Sarah Turner. 2009. “Playing the College Application Game: Critical Moves and the Link to Socioeconomic Circumstances.” Unpublished paper, University of Virginia, Charlottesville.
Barr, Andrew, and Sarah Turner. 2013. “Expanding Enrollments and Contracting State Budgets: The Effect of the Great Recession on Higher Education.” The Annals: American Academy of Political and Social Science 650 (1): 168–93.
———. 2015a. “Out of Work and Into School: Labor Market Policies and College Enrollment During the Great Recession.” Journal of Public Economics 124 (April 2015): 63–73.
———. 2015b, October. “Aid and Encouragement: Does a Letter Increase Enrollment Among UI Recipients?” Working Paper Series No. 40, EdPolicyWorks, Curry School of Education, University of Virginia, Charlottesville, VA.
Bettinger, Eric, Bridget Terry Long, Philip Oreopoulos, and Lisa Sanbonmatsu. 2012. “The Role of Application Assistance and Information in College Decisions: Results from the H&R Block FAFSA Experiment.” Quarterly Journal of Economics 127 (3): 1205–42.
Betts, Julian R., and Laurel L. McFarland. 1995. “Safe Port in a Storm: The Impact of Labor Market Conditions on Community College Enrollments.” Journal of Human Resources 30 (4): 741–65.
Bound, John, Michael Lovenheim, and Sarah Turner. 2010. “Why Have College Completion Rates Declined: Marginal Students or Marginal College?” American Economic Journal: Applied Economics 2 (3): 129–57.
Bound, John, and Sarah Turner. 2007. “Cohort Crowding: How Resources Affect Collegiate Attainment.” Journal of Public Economics 91 (5–6): 877–99.
Bowen, William G., Matthew M. Chingos, and Michael S. McPherson. 2009. Crossing the Finish Line: Completing College at America’s Public Universities. Princeton, NJ: Princeton University Press.
Bradley, David H. 2013. “The Workforce Investment Act and the One-Stop Delivery System.” Report R44135, Congressional Research Service, Washington, DC.
———. 2015. “The Workforce Investment Act and the One-Stop Delivery System.” Report R44252, Congressional Research Service, Washington, DC.
Bulman, George B., and Caroline M. Hoxby. 2015, January. “The Returns to the Federal Tax Credits for Higher Education.” In Tax Policy and the Economy, Volume 29, edited by Jeffrey R. Brown. Chicago, IL: University of Chicago Press.
Cellini, Stephanie Riegg. 2009. “Crowded Colleges and College Crowd-Out: The Impact of Public Subsidies on the Two-Year College Market.” American Economic Journal: Economic Policy 1 (2): 1–30.
Christian, Michael S. 2007. “Liquidity Constraints and the Cyclicality of College Enrollment in the United States.” Oxford Economic Papers 59 (1): 141–69.
College Board. 2013. Rethinking Pell Grants. New York, NY: College Board.
———. 2016. Trends in Student Aid. New York, NY: College Board.Davis, Scott, Louis Jacobson, and Stephen Wadner. 2014. “Using
Workforce Data Quality Initiative Databases to Develop and Improve Consumer Report Card Systems.” IMPAQ International, Columbia, MD.
Deming, David, Claudia Goldin, and Lawrence F. Katz. 2012. “The For-Profit Postsecondary School Sector: Nimble Critters or Agile Predators?” Journal of Economic Perspectives 26 (1): 139–64.
Deming, David J., Michael Lovenheim, and Richard W. Patterson. 2016, October. “The Competitive Effects of Online Education.” Working Paper 22749, National Bureau of Economic Research, Cambridge, MA.
Deming, David, and Chris Walters. 2017. “The Impacts of Price and Spending Subsidies on US Postsecondary Attainment.” Unpublished working paper, Harvard Graduate School of Education, Cambridge, MA.
Dillon, Eleanor Wiske, and Jeffrey Andrew Smith. 2015. “The Consequences of Academic Match between Students and Colleges.” Discussion Paper 9080, Institute for the Study of Labor, Bonn, Germany.
Dynarski, Susan, and Judith Scott-Clayton. 2013. “Financial Aid Policy: Lessons from Research.” The Future of Children 23 (1): 67–91.
Family Educational Rights and Privacy Act (FERPA) (20 U.S.C.), 1974.
Federal Student Aid. n.d. “Subsidized and Unsubsidized Loans.” Federal Student Aid, U.S. Department of Education, Washington, DC.
Hamilton Project. 2010. “Retraining Displaced Workers.” Policy Brief, The Hamilton Project, Brookings Institution, Washington, DC.
Higher Education Act of 1965, Pub. L. 89-329, 79 Stat. (1965).Horng, E. L., B. J. Evans, A. L. Antonio, J. D. Foster, H. S.
Kalamkarian, N. F. Hurd, and E. P. Bettinger. 2013, Winter. “Lessons Learned from a Data-Driven College Access Program: The National College Advising Corps.” New Directions for Youth Development 2013 (140): 55–75.

The Hamilton Project • Brookings 27
Hoxby, Caroline M. and Christopher Avery. 2012. “The Missing “One-Offs”: The Hidden Supply of High-Achieving, Low Income Students.” Working Paper 18586, National Bureau of Economic Research, Cambridge, MA.
Hoxby, Caroline M. and Sarah Turner. 2013. “Informing Students about Their College Options: A Proposal for Broadening the Expanding College Opportunities Project.” Discussion Paper 2013-03, The Hamilton Project, Brookings Institution, Washington, DC.
Jacobson, Louis, Robert LaLonde, and Daniel G. Sullivan. 2005. “Estimating the Returns to Community College Schooling for Displaced Workers.” Journal of Econometrics 125 (1): 271–304.
Job Training Partnership Act of 1982 (Pub.L. 97-300, 29 U.S.C.), 1982.
Looney, Adam, and Constantine Yannelis. 2015, Fall. “A Crisis in Student Loans? How Changes in the Characteristics of Borrowers and in the Institutions They Attended Contributed to Rising Loan Defaults.” Brookings Papers on Economic Activity, Brookings Institution, Washington, DC.
National Association of State Workforce Agencies (NASWA). 2010. “NASWA Survey on Pell Grants and Approved Training for UI.” National Association of State Workforce Agencies, Washington, DC.
National Center for Education Statistics (NCES). 2012. “Digest of Education Statistics.” National Center for Education Statistics, U.S. Department of Education, Washington, DC.
———. 2015. “Digest of Education Statistics.” National Center for Education Statistics, U.S. Department of Education, Washington, DC.
———. n.d. “College Navigator: Find the Right College for You.” National Center for Education Statistics, U.S. Department of Education, Washington, DC.
National Science Foundation (NSF). n.d. “Integrated Science and Engineering Resources Data System.” National Science Foundation, Washington, DC.
Roderick, Melissa, Jenny Nagaoka, Vanessa Coca, and Eliza Moeller. 2009. Making Hard Work Pay Off: Challenges on the Road to College for Students in Chicago Public Schools’ Academically Advanced Programs. Chicago, IL: The University of Chicago Consortium on Chicago School Research.
Scott-Clayton, Judy, and Lauren Schudde. 2016, October. “Performance Standards in Need-Based Student Aid.” Working Paper 22713, National Bureau of Economic Research, Cambridge, MA.
U.S. Census Bureau. 2008–14. “Current Population Survey (CPS).” U.S. Census Bureau, U.S. Department of Commerce, Washington, DC.
———. 2016. “Table A-7. College Enrollment of Students 14 Years Old and Over, by Type of College, Attendance Status, Age, and Gender: October 1970 to 2014.” Census Bureau, U.S. Department of Commerce, Washington, DC.
U.S. Census Bureau and Bureau of Labor Statistics. n.d. “Unemployment Rate.” Labor Force Statistics from the Current Population Survey, U.S. Census Bureau and Bureau of Labor Statistics, Washington, DC.
U.S. Department of Education. 2017, January. “College Scorecard Data.” U.S. Department of Education, Washington, DC.
———. n.d. “Integrated Postsecondary Education Data System (IPEDS): Fall Enrollment.” Institute of Education Sciences, National Center for Education Statistics, U.S. Department of Education, Washington, DC.
U.S. Department of Labor. 2005, July 29. “Chapter 6: Guide Sheets.” In Employment and Training Handbook, 5th ed. U.S. Department of Labor, Washington, DC.
———. 2008. “Training and Employment Guidance Letter No., 21-08.” Employment & Training Administration, U.S. Department of Labor, Washington, DC.
———. 2016. “Benefit Accuracy Measurement (BAM).” U.S. Department of Labor, Washington, DC.
Van Horn, Carl, and Aaron Fichtner. 2011. “Eligible Training Provider Lists and Consumer Report Cards.” In The Workforce Investment Act: Implementation Experiences and Evaluation Findings, edited by Douglas J. Besharov and Phoebe H. Cottingham. Kalamazoo, MI: Upjohn Institute.
White House. 2009, May 8. “Remarks on the National Economy and Job Training.” President Barack Obama. Public Papers of the Presidents of the United States, White House, Washington, DC.
Workforce Investment Act of 1998 (WIA), Pub.L. 105-220, 112 Stat. 936, 1998.
Workforce Innovation and Opportunity Act (WIOA) (Pub.L. 113-128), 2014.

28 Labor Force to Lecture Hall: Postsecondary Policies in Response to Job Loss

The Hamilton Project • Brookings 3
ADVISORY COUNCIL
GEORGE A. AKERLOFKoshland Professor of EconomicsUniversity of California, Berkeley
ROGER C. ALTMANFounder & Senior ChairmanEvercore
KAREN ANDERSONSenior Advisor, Results for AmericaExecutive Director, Results for All
ALAN S. BLINDERGordon S. Rentschler Memorial Professor of Economics & Public AffairsPrinceton UniversityVisiting FellowThe Brookings Institution
ROBERT CUMBYProfessor of EconomicsGeorgetown University
STEVEN A. DENNINGChairmanGeneral Atlantic
JOHN DEUTCHEmeritus Institute ProfessorMassachusetts Institute of Technology
CHRISTOPHER EDLEY, JR.Co-President and Co-FounderThe Opportunity Institute
BLAIR W. EFFRONCo-FounderCenterview Partners LLC
DOUGLAS W. ELMENDORFDean & Don K. Price Professor of Public PolicyHarvard Kennedy School
JUDY FEDERProfessor & Former DeanMcCourt School of Public PolicyGeorgetown University
ROLAND FRYERHenry Lee Professor of EconomicsHarvard University
JASON FURMANSenior FellowPeterson Institute for International Economics
MARK T. GALLOGLYCofounder & Managing PrincipalCenterbridge Partners
TED GAYERVice President & DirectorEconomic StudiesThe Brookings Institution
TIMOTHY F. GEITHNERPresidentWarburg Pincus
RICHARD GEPHARDTPresident & Chief Executive OfficerGephardt Group Government Affairs
ROBERT GREENSTEINFounder & PresidentCenter on Budget and Policy Priorities
MICHAEL GREENSTONEMilton Friedman Professor in EconomicsDirectorEnergy Policy Institute at ChicagoUniversity of ChicagoNonresident Senior FellowThe Brookings Institution
GLENN H. HUTCHINSChairmanNorth IslandCo-FounderSilver Lake
JAMES A. JOHNSONChairman Johnson Capital Partners
LAWRENCE F. KATZElisabeth Allison Professor of EconomicsHarvard University
MELISSA S. KEARNEYProfessor of EconomicsUniversity of MarylandNonresident Senior FellowThe Brookings Institution
LILI LYNTONFounding PartnerBoulud Restaurant Group
HOWARD S. MARKSCo-ChairmanOaktree Capital Management, L.P.
MARK MCKINNONFormer Advisor to George W. BushCo-Founder, No Labels
ERIC MINDICHChief Executive Officer & Founder Eton Park Capital Management
SUZANNE NORA JOHNSONFormer Vice ChairmanGoldman Sachs Group, Inc.
PETER ORSZAGManaging Director & Vice Chairman of Investment BankingLazardNonresident Senior FellowThe Brookings Institution
RICHARD PERRYManaging Partner & Chief Executive OfficerPerry Capital
MEEGHAN PRUNTY Managing DirectorBlue Meridian PartnersEdna McConnell Clark Foundation
ROBERT D. REISCHAUERDistinguished Institute Fellow & President EmeritusUrban Institute
ALICE M. RIVLINSenior FellowThe Brookings Institution Professor of Public PolicyGeorgetown University
DAVID M. RUBENSTEIN Co-Founder & Co-Chief Executive OfficerThe Carlyle Group
ROBERT E. RUBINCo-Chair, Council on Foreign RelationsFormer U.S. Treasury Secretary
LESLIE B. SAMUELSSenior CounselCleary Gottlieb Steen & Hamilton LLP
SHERYL SANDBERGChief Operating Officer Facebook
RALPH L. SCHLOSSTEINPresident & Chief Executive OfficerEvercore
ERIC SCHMIDTExecutive Chairman Alphabet Inc.
ERIC SCHWARTZChairman and CEO76 West Holdings
THOMAS F. STEYERBusiness Leader and Philanthropist
LAWRENCE H. SUMMERSCharles W. Eliot University Professor Harvard University
PETER THIELEntrepreneur, Investor, and Philanthropist
LAURA D’ANDREA TYSONProfessor of Business Administration and EconomicsDirectorInstitute for Business & Social ImpactBerkeley-Haas School of Business
DIANE WHITMORE SCHANZENBACHDirector

4 Informing Students about Their College Options: A Proposal for Broadening the Expanding College Opportunities Project
W W W . H A M I L T O N P R O J E C T . O R G
W W W . H A M I L T O N P R O J E C T . O R G
1775 Massachusetts Ave., NW Washington, DC 20036
(202) 797-6484
Printed on recycled paper.
Highlights
Sarah Turner of the University of Virginia proposes to better align workforce and postsecondary policies, helping adults who have lost employment to more effectively invest in their human capital through additional education and training.
The Proposal
Restructure federal student aid for workers who lose their jobs. Turner proposes an Enrollment for Employment and Earnings policy that would make income support and student financial aid available to unemployment insurance recipients, replacing Pell Grants and tuition tax credits for these individuals.
Provide systematic, customized guidance to help workers choose and complete postsecondary programs. Using emerging data infrastructure, adult potential students would be provided with a clear comparison of costs, program duration, completion rates, and expected labor market outcomes associated with different postsecondary choices.
Discourage UI recipients from enrolling in postsecondary programs with a record of poor performance. Eligibility for the author’s EEE assistance would be contingent on enrollment in postsecondary programs with sufficiently high completion rates and beneficial labor market outcomes.
Benefits
This proposal would help adult workers to acquire new skills in the immediate aftermath of adverse labor market shocks. By facilitating these timely skill investments, workers’ earnings would be increased. Guidance regarding postsecondary options and limitations on poor-performing programs would reduce loan default rates, benefiting both students and taxpayers.